When I took office as Mayor, it was no secret that the City of Tampa was behind the curve in addressing the causes and impacts of climate change. Many cities our size have had comprehensive climate plans in place for more than a decade. With the release of Tampa’s first ever Climate Action and Equity Plan, I am proud to show that not only is Tampa ready to tackle the underlying causes of climate change, but also to offer actionable solutions to meet the challenges we are already facing as a community.
Tampanians are increasingly feeling the impacts of a changing climate. We are experiencing more extreme and frequent heat. Sea levels are rising (nearly 8 inches since 1946) —causing more frequent flooding and costly damage to homes and essential infrastructure. Our wetland ecosystems and other environmental assets that have come to define our communities and way of life are threatened. And while Tampa avoided the worst impacts of Hurricane Ian, the storm is a painful recent reminder that our neighborhoods are vulnerable to severe storms that are increasing in frequency.
These realities may seem daunting, but Tampanians are ready to rise to the challenge. The optimism, collaborative spirit, and diversity of our residents have enabled our city in recent years not only to emerge as stronger than before, but also to attract record setting growth, transforming Tampa into a hub of innovation that is a driver of opportunity for newcomers and longtime residents alike.
“This Plan will build upon a number of critical efforts that are already helping us plan for the future.”
These qualities will serve as an important foundation as we strengthen our response to the climate crisis through the comprehensive initiatives laid out in this Climate Action and Equity Plan. Fortunately, this Plan will also build upon a number of critical efforts that are already helping us plan for the future, including not only Transforming Tampa’s Tomorrow— which established Sustainability and Resiliency as a top priority for my administration—but Resilient Tampa, which included important climate actions at every scale, strengthening families, neighborhoods, infrastructure, and City systems.
Now is the time for us to go further, and this Plan sets forth bold, equity-centered approaches that will establish Tampa as a leader in climate action. Collectively, the initiatives across this Plan will reduce Tampa's contribution to climate change. They will also protect and prepare our neighborhoods in the face of current and future climate impacts, and foster stewardship of our treasured natural assets. Our Climate Action and Equity Plan is comprehensive in its scope, covering the full range of climate impacts across
our communities, with chapters dedicated not only to core systems including Energy, Water and Wastewater, and Transportation, but also to Community, Housing and Development, and Food. A chapter dedicated to Governance will help to break down public sector silos and catalyze new funding, spurring greater coordination and integrating climate action into initiatives across every City department.
With our energy and transportation sectors contributing the vast majority of citywide greenhouse gas emissions, initiatives across this Plan aim to reduce our carbon footprint. For example, City government will lead by example and transition to 100% clean and renewable energy in municipal operations, while strengthening transportation options to enable reductions in vehicular emissions. As we continue to increase the supply of housing, we will channel growth towards areas projected to experience fewer climate hazards, while increasing resources available to fortify homes against weather events. We will increase community engagement across our neighborhoods, strengthening climate focused educational opportunities and preparedness. We will use nature-based solutions that simultaneously address stresses like erosion and water quality while bringing additional community-focused benefits like open space. We will also address the impacts of heat by expanding and managing our tree canopy, and taking other important steps. In every aspect of these efforts, we have taken into consideration issues of equity and the importance of community, so that we move our city towards a more equitable and resilient future that is amiable for Tampanians of every background.
These are just some of the ways that this Plan will mobilize partnerships, from across City government sectors and neighborhoods, to address the causes and adapt to the impacts of our changing climate. This is the next step forward in what must be a collaborative effort. By working together in making this Action Plan a reality, we will continue our work of Transforming Tampa’s Tomorrow: through smart and integrated planning, we can ensure a climate-resilient future for every Tampanian.
NOTE FROM THE SUSTAINABILITY AND RESILIENCE OFFICER
It has been my privilege to work with some of the best and brightest scientists, community members, energy modelers, and our own City of Tampa team to develop this Climate Action and Equity Plan. Thanks to their collective efforts, this comprehensive plan details how the City of Tampa will transition to a lower-carbon economy, build climate-ready infrastructure, and ensure that we take care of Tampanians from all walks of life along the way.
Like other cities across America, Tampa faces a pivotal moment as a result of climate-related challenges and opportunities. Billions of dollars in state and federal money will pave the way for new energy delivery systems and infrastructure designed and built to withstand the impacts of extreme weather. The diversity and strength of our residents are our greatest asset in ensuring the success of these opportunities. For this reason, in developing this Plan, we have worked to consider how every proposed action will impact people, neighborhoods, and quality of life. Make no mistake: Tampa is changing, with our city poised to grow more in the next 10 years than perhaps at any other period in its history. It is every Tampanian’s responsibility to help shape that growth.
Our Climate Action and Equity Plan maps out a future where we are able to address the challenges posed by growth and climate change while building a stronger, healthier, more sustainable, and resilient city. We will encourage shorter, non-vehicle trips via transportation and mobility networks. We will empower residents to generate their own renewable energy. We will elevate and strengthen homes and businesses in coastal areas.
Tampa is on the move, with the ability to shape how our city changes through the power of our own residents rather than solely responding to outside forces. With the core values of Tampa’s first ever Climate Action and Equity Plan as our guide, I am proud to be a part of Tampa’s next chapter—where our energy is cleaner, our infrastructure is stronger, and our people are more resilient.
EXECUTIVE SUMMARY
Tampa’s environment, climate, and natural resources are among its greatest assets. We live in a city surrounded by water, on one of the country’s most productive urban estuaries, with a river running through it. Tampa also has an incredible tree canopy, recently ranked number one in the world.1 While these attributes make Tampa a beautiful and comfortable place to live, and help to shape the economy and local culture, its geography presents many challenges in a world of environmental change. With consistently higher temperatures, elevated water levels, and the potential for increased storms, Tampa, as other cities across the globe, will have to adapt and respond. We will have to make changes to our infrastructure, our policies, and our priorities, especially considering the disproportionate impacts that climate change will have on vulnerable communities. The effects of climate change are real, and will have broad impacts, as described in this Plan. Going forward, we will have to work together – across city departments, neighborhoods, and sectors – to ensure success, and to make progress towards meeting this challenge.
This Climate Action and Equity Plan has been created to set forth principles, initiatives, and actionable projects. By following its guidance in the years to come, we will reduce greenhouse gas emissions, adapt our infrastructures, and make sure to do this with all Tampanians in mind – listening to their input and responding to their needs. These are the three primary goals, fundamental to an overall approach established by this Plan. It will take time to align the trajectory of our city with these new community needs. We are fortunate, however, to have leadership that is looking ahead and making our first steps toward progress.
To guide our next steps, the following 10 Climate Action Categories have been established. These categories organize initiatives as well as acting as a checklist for future work. The ultimate goal is for climate action and equity to be integrated into all departmental projects, from master plans to capital improvements, so that it becomes fundamental to City operations.
1 Balch, O. (2019). “Green Streets: Which City has the Most Trees”
10 CLIMATE ACTION CATEGORIES
Summary of the 10 Climate Action Categories, their abbreviations, and descriptions.
Abbreviation/Icon
Category
Description
E
ENERGY
WW
WATER AND WASTEWATER
SW
STORMWATER
TLU
TRANSPORTATION AND LAND USE
WM
WASTE MANAGEMENT
HD
HOUSING AND DEVELOPMENT
COM
COMMUNITY
ENV
HABITAT AND ENVIRONMENT
F
FOOD
GOV
GOVERNANCE
Climate resilience can be integrated into every place and project in Tampa. First, we must recognize appropriate opportunities, which can be found in almost all capital improvement projects.
This 10-category framework will help to establish a perspective for more comprehensive project planning and policy.
INTRODUCTION 10 CLIMATE ACTION AND EQUITY PLAN
CLIMATE ACTION IN TAMPA
Mayor Jane Castor’s “Transforming Tampa’s Tomorrow” initiative, or “T3,” has served as the bedrock of her administration policy. T3 not only directed focus to five priority areas, but also established an integrated effort toward planning for the city’s future, including climate change. Efforts toward this agenda were initiated when Mayor Castor appointed the City’s first Sustainability and Resilience Officer, who shortly after delivered the City’s first resilience plan: Resilient Tampa. This document has become a guiding beacon for Tampa’s governance and is the foundation for this Climate Action and Equity Plan.
This is the first time a Tampa mayor has put climate concerns on the top of the City's agenda. Under Mayor Castor’s leadership, Tampa has also completed the Greenhouse Gas Inventory (2021); the Regulatory Approach to Sea Level Rise (2021), the Coastal Area Action Plan (underway); the East Tampa Urban Heat Pilot Program (ongoing); an update to the City of Tampa Tree Canopy Urban Forest Analysis 2021 (ongoing); and the upcoming City of Tampa Vulnerability Assessment. Taken together, these efforts serve as a major step forward in the evolution of the city and will help to prepare its residents for the future.
The Climate Action and Equity Plan aims to drive implementation and action with an equity lens that considers risks, vulnerabilities, and impacts for all Tampanians. It will also be used to advance new initiatives based on best practices and collaboration across departments. This document represents a lengthy process of self-assessment, research, and coordination to determine quick but transformative actions that can springboard the city towards enhanced future resilience.
Opportunity for All Tampanians
Thriving Neighborhoods
Climate-Ready Infrastructure
Growing and Connected City
“The Climate Action and Equity Plan aims to drive implementation and action with an equity lens that considers risks, vulnerabilities, and impacts for all Tampanians.”
GOALS AND PRIORITIES
Initiatives within this Climate Action and Equity Plan collectively work to advance three overarching goals:
MITIGATE
Reduce Carbon Emissions and Increase Carbon Capture
ADAPT
Make Infrastructural Changes, Acknowledging the Future Impacts of Climate Change
ENGAGE
Listen To and Support All Tampanians Along the Way
This broad but deliberate approach gets to the core of climate change. First, there is a need to minimize, or mitigate, the source of the problem. The recent City of Tampa Greenhouse Gas Study has provided valuable insights about primary sources of carbon emissions that drive climate change. Recent research by multiple organizations, including the National Oceanic and Atmospheric Administration (NOAA), underscores that the quantity of emissions produced is connected to loss of ice mass, ocean expansion, and atmospheric change. Second, as climatic factors shift, the city’s urban environments will also have to adapt. There are many cases of existing property and infrastructure built along our increasingly vulnerable coastlines. Projects, programs, and policies must enable modifications to physical, environmental, and social systems to reduce risk. Third, we want to form partnerships and build consensus as we move our city forward. This will require creating clear channels of communication between the community and City administration. Engaging the community through this process is of primary focus, and we want everybody involved in the prosperity that is to come.
The causes and impacts of climate change are disproportionality shared among us. Equity is a central theme that guides every aspect of this Plan. Under Mayor Castor’s leadership, any climate action will consider impacts and risks for Tampa residents of every background. Equity is embedded in the Plan name as a consistent reminder of that goal, ensuring policies and infrastructure improvements benefit all communities across the city. In this critical moment, many new funding sources supporting a range of priorities from neighborhood improvements to environmental justice can be applied to improve basic infrastructure while also increasing resilience in traditionally underserved communities.
ENGAGEMENT AND EQUITY
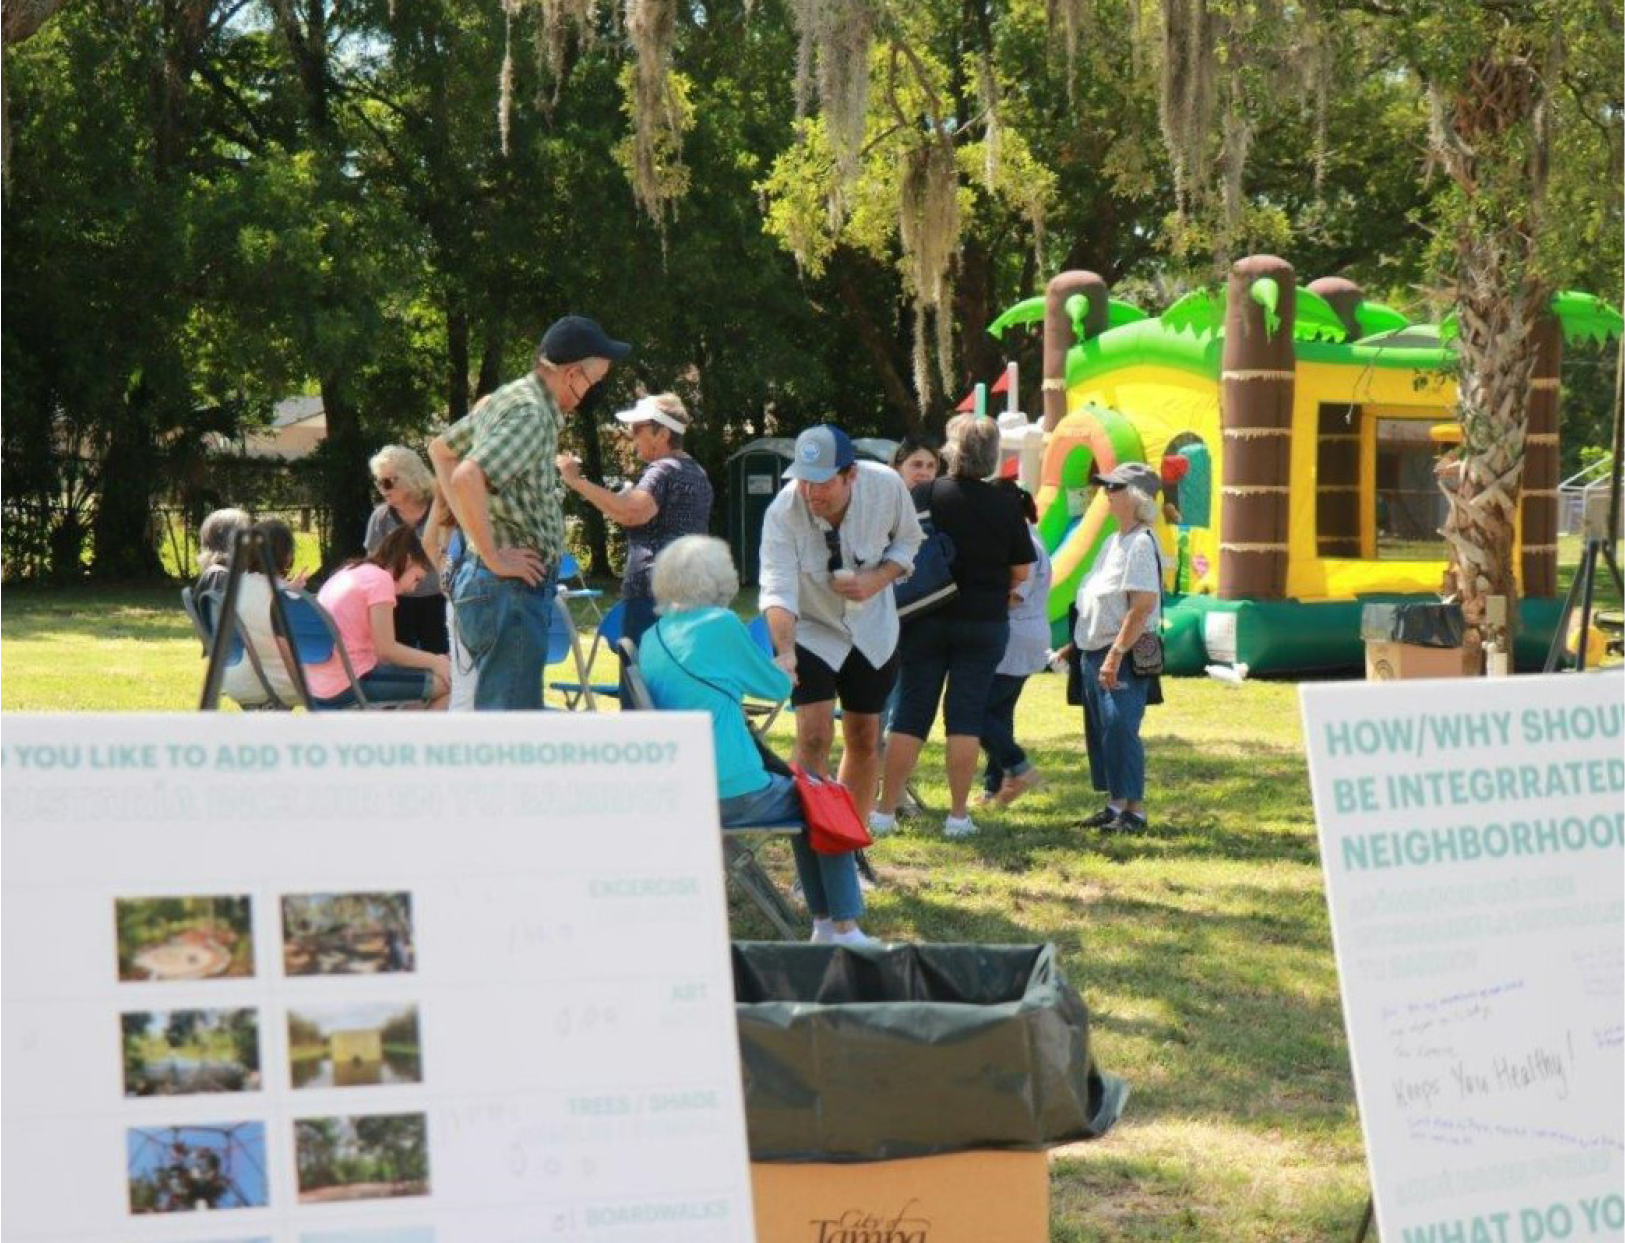
Past plans and studies in Tampa included extensive outreach to Tampanians across the city, providing invaluable input and helping to define goals and priorities. For example, during the development of Resilient Tampa, more than 1,720 residents were reached through a Community Input Tool, and dozens of stakeholder and departmental meetings informed the report’s 56 actions. The Regulatory Approach to Sea Level Rise project held multiple outreach seminars and a community symposium, with opportunities for feedback.
In developing this Climate Action and Equity Plan, outreach efforts were focused toward the following three activities:
Understanding the concerns and needs of front-line communities: Partners of the Climate Action and Equity Plan included the CLEO Institute, a non-profit focused on climate education and front-line community engagement. Front-line communities are typically described as underserved or low status populations, who tend to absorb the negative impacts of climate change first – they serve as a bell weather for future vulnerable populations. CLEO developed a community ambassador program to drive hyper-local and personal interactions within these communities and hosted multiple listening sessions and town halls to solicit public feedback from these unique and important voices. The goal was to use this project as a first step in establishing new lines of communication and discussing topics related to climate change, but in terms that made sense to the residents within those communities.
Developing new models for outreach and establishing community dialogue: The team worked extensively with the Community Engagement and Partnership Department (CEPD) to identify frameworks that bring about more inclusive and efficient means of outreach. This included a pilot outreach event in collaboration with the Urban Land Institute, the CEPD, and the Stormwater Department, and a pilot community presentation that brought together multiple departments to host a set of multi-topic, multi-issue meetings for a defined area of impact, rather than hosting presentations on a project-by-project basis.
Identifying departmental capacities and shortfalls, project opportunities, and inter-relationships with other departments: Interviews with City of Tampa staff revealed barriers and administrative challenges to the implementation of climate goals. To address this, multiple departmental and stakeholder meetings were held, bringing together personnel to define opportunities for more integrated and layered project planning.
PARTNERS OF THE CLIMATE ACTION AND EQUITY PLAN INCLUDED THE CLEO INSTITUTE, A NON-PROFIT FOCUSED ON CLIMATE EDUCATION AND FRONTLINE COMMUNITY ENGAGEMENT.
LOOK FOR THIS ICON THROUGHOUT THE DOCUMENT TO LEARN MORE ABOUT HOW COMMUNITY VOICES WERE IMPLEMENTED IN THIS PLAN
THE CLEO INSTITUTE AMBASSADORS PROGRAM
To pinpoint concerns within communities that were underrepresented in previous planning processes, the Climate Action and Equity Plan took deliberate steps to engage these citizens. The City partnered with the CLEO Institute (CLEO), a non-profit, nonpartisan organization that has worked across the state to build climate literacy through advocacy and education, because of their expertise and successful record of accomplishing this task with other cities.
CLEO developed an ambassador program that recruited leaders from specific neighborhoods, enlisting them as part of the outreach and education team. Their work was focused on establishing comfortable conversations guided by the topic of climate change. Ambassadors and CLEO staff fostered community connections within East Tampa, Sulphur Springs, North Tampa, West Tampa, and the southern end of South Tampa. This group was responsible for direct communication with the neighborhoods, and connected community members with outlets for civic engagement and media resources. With the help of CLEO, ambassadors participated in news interviews, panel discussions and had their community leadership skills highlighted in community listening sessions. Efforts included community listening sessions to discuss areas of concern and educate citizens about the impacts of the climate crisis; door-to-door solicitations to distribute fliers and recruit for events; surveys to complement the listening sessions; and informal conversations within the neighborhoods. The surveys highlighted prioritized areas of concern for residents, gauged climate literacy and helped those that couldn't attend listening sessions to have a voice. Residents expressed specific concern about extreme weather events, flooding and the lack of public transportation. The shared goal was to explain the Climate Action and Equity Plan program and above all, to listen to stories and convey that the City was interested in hearing their voice. When trust had been established, they exchanged surveys and other information.
The listening sessions conducted by CLEO as part of their outreach strategy led to many conversations about the daily life of Tampa citizens. The ambassadors alongside CLEO were able to inform the city of difficulties surrounding bus routes being cut, high energy burdens, flood and stormwater issues as well as the lack of connection between government initiatives and community benefit. Many of the community’s difficulties have direct relationships to the climate crisis. Several of the concerns brought up during these workshops are addressed through initiatives in the Plan.
WHAT WE HEARD FROM THE COMMUNITY IMPROVE COMMUNICATION BETWEEN RESIDENTS AND CITY LEADERS, ESPECIALLY RELATED TO EMERGENCY PREPAREDNESS CITY OF TAMPA
CREATE OPPORTUNITIES FOR ENVIRONMENTAL STEWARDSHIP AND CLIMATE-RELATED JOBS
ADDRESS FLOODING EQUITABLY
ADDRESS HEAT
PROMOTE CLEAN ENERGY OPTIONS THAT WILL MAINTAIN AFFORDABILITY
DEVELOP EQUITABLE HOUSING AND TRANSPORTATION INFRASTRUCTURE
NEW APPROACHES
Climate change is a complex, multi-faceted challenge that will disrupt many aspects of our traditional ways of life: there are no simple solutions. Primary impacts will include increased heat and storms, changes to our coastline, uncertainty of sustainable water sources, and degraded water quality. Secondary effects will force us to make changes in our food, energy, transportation, and stormwater systems. Ultimately, environmental change will require new approaches toward city-building and for risk mitigation. Major economic inputs will be required to adapt, especially at the coastal edge.
These complexities are best and most efficiently addressed by reconsidering the interconnectedness of urban infrastructure.
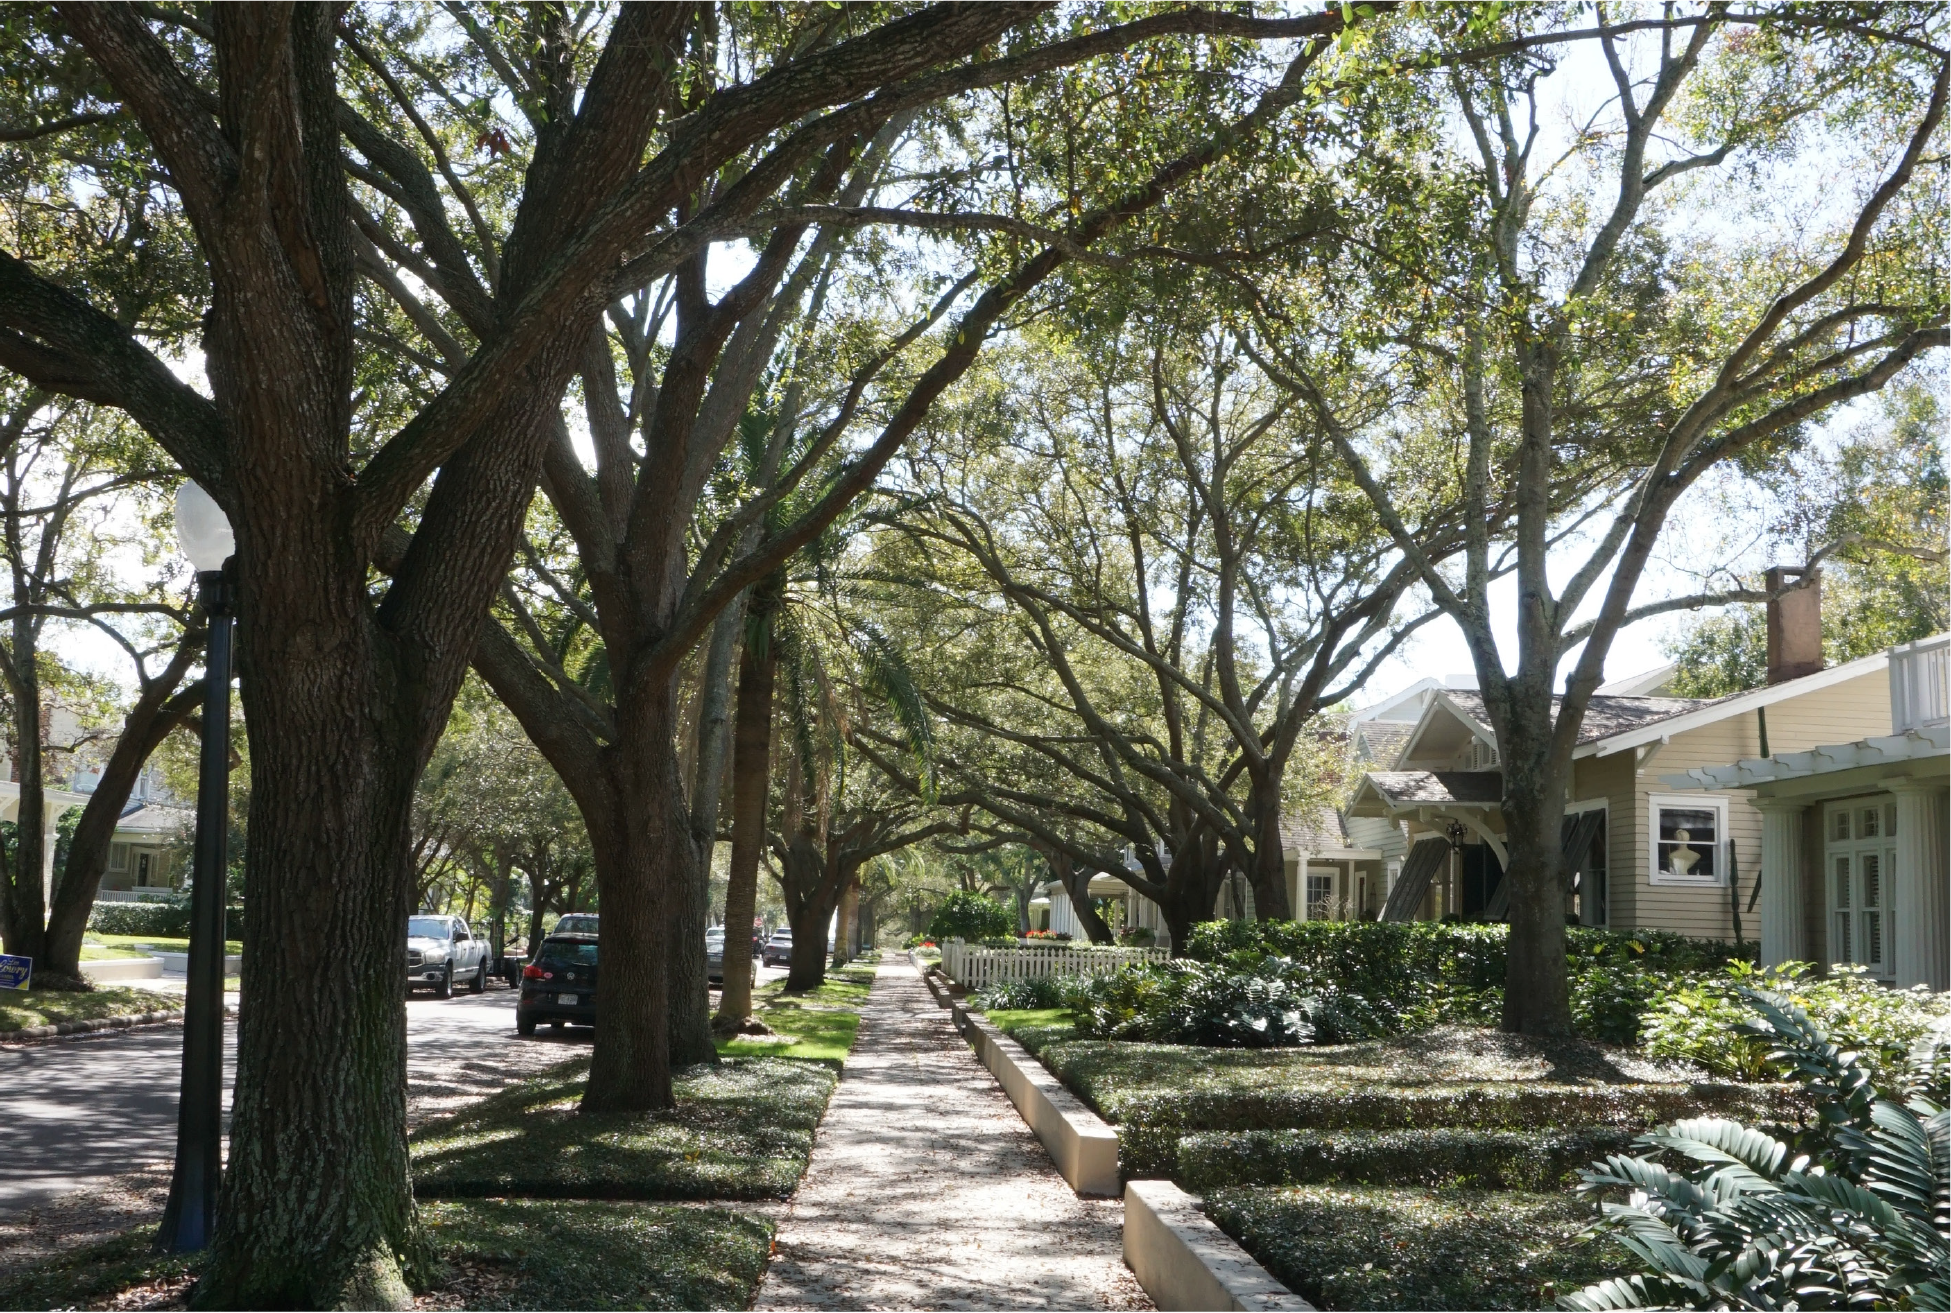
POWER LINES, for example, are often located in City right-of-way space, along with other utilities and sidewalks. Because of the overhead wires, only small canopy trees are allowed, limiting the amount of shade. Areas without trees tend to be hotter, and so are less comfortable to be in, especially in the heat of a Tampa summer. TREE CANOPIES also have an indirect relationship with creating walkable and bikeable streets, and ultimately with our transportation systems. Consider the comfort level difference between a shaded street in summer versus one without canopy. These subtle changes can influence if a car is used or if it remains parked.
Trees have other benefits, too, such as providing habitats, dissipating rainfall, and absorbing water and carbon dioxide. These interconnected factors describe the environment and nature of a place, and influence our ability to mitigate climate change impacts.
To address these complex issues, solutions will need to be layered and similarly complex. For example, multiple departments should be involved in projects that involve the urban tree canopy, including not only the Parks and Recreation Department, but also the Mobility Department, which is responsible for roadways, City Planning, and Tampa Electric (TECO), Tampa's utility company. This issue of power lines and the tree canopy is a priority for the City of Tampa, and will be underscored across several initiatives. It serves as an example of how departments must work together to accomplish climate goals.
The need for interdepartmental collaboration and multi-benefit project planning has also been noted recently by the regional Tampa Bay chapter of the Urban Land Institute (ULI). This organization brought together a national expert advisory panel to review the City of Tampa’s stormwater practices and this panel’s primary recommendation was to enhance the coordination and integration of stormwater projects in public space. The experts noted that the City has historically dealt with two topics – drainage and public space – in isolation, but that this has caused degradation of community environments. In their report, they encouraged the City of Tampa to work towards multi-benefit solutions in stormwater projects.
Typical neighborhood power lines in Tampa vsHyde Park neighborhood of Tampa Images by Applied Sciences.
THE VIRTUAL TECHNICAL ASSISTANCE PANEL (VTAP)
From the Urban Land Institute (ULI)
The City of Tampa has more than 240 stormwater retention and detention ponds. These are a primary component of the city’s flood prevention infrastructure and are responsible for capturing large quantities of water with an associated role in maintaining urban runoff water quality. In 2021, the City began work with the ULI's Resilience program to convene a group of experts to discuss this topic and provide national best practices solutions in advancing resilience through land use policies and development strategies. In establishing this study, the City of Tampa acknowledged the opportunity to re-imagine green spaces as multipurpose facilities that can provide value to the community while solving stormwater problems.
Recommendations
The Panel developed high level recommendations, which included the following.
Develop and coalesce around a “big idea” that addresses the city’s need for stormwater infrastructure and recognizes the benefits of green infrastructure for the community at both the neighborhood and watershed scales.
Design and organize solutions that provide multiple benefits, such as flood protection, economic development, public gathering spaces, green infrastructure, restored ecological functions, and trail connections.
Create and internalize a new holistic and scalable approach to ranking and prioritizing projects based on multi-benefit analysis, through the Transforming Tampa’s Tomorrow/Resilient Tampa lens, and which is connected to the big idea.
Build and institutionalize a scalable and intentional citywide community engagement plan to develop buy-in and inform decision-making on stormwater management projects.
CLIMATE ACTION AND EQUITY PLAN
FUNDING
Significant funding for climate and other resilience efforts has become available at the federal, state, and regional levels, and this Plan will be used as a guide for Tampa grant administrators. However, because grants can be competitive and sometimes require matching funds, the City of Tampa will advance the necessary projects, programs, and policies that are instrumental to mitigating climate risk and to addressing community climate concerns without delaying these efforts or overly relying upon potential funding streams. Our goal is to integrate climate thinking across all work and existing City budgets so that progress moves forward and is ‘baked into’ ongoing project work.
TRACKING PROGRESS
The Sustainability and Resilience Officer will track and monitor the progress of priority initiatives and objectives. Key metrics derived from this monitoring will be reported in the next iteration of Tampa’s Climate Action and Equity Plan, and on the City’s website. This will help us remain accountable, and to communicate progress to the community.
How Tampa Contributes to Climate Change
City-wide greenhouse gas production, by category
46.3% TRANSPORTATION
47.0% ENERGY
OTHER (8.3%)
4% - INDUSTRIAL AND LAND USE
2.6% - WASTE (CITYWIDE PRODUCTION/GOV. MANAGED)
1.4% - ENERGY (GOVERNMENT OPERATIONS)
0.2% - TRANSPORTATION (GOV.T OPERATIONS, FLEET)
Metric tons of carbon dioxide per person, per year by city
The City of Tampa emits approximately 13.7 metric tons of carbon dioxide per person, per year. As a comparison, St. Petersburg contributes 10.9 metric tons per capita, Sarasota 12.6, and Orlando 21. Overall, this equates to a total of 5.5 million metric tons of carbon dioxide within the City of Tampa in a year.²
Two primary categories represent almost all of Tampa’s city-wide greenhouse gas emissions.
Energy use accounts for 47.0% followed closely by transportation, at 46.3% – by far the largest contributors. Commercial energy consumption is the highest within that sector, followed very closely by residential, with government and industrial uses at much lower rates. Since 2009 transportation sector emissions are up 22%, accounting for approximately 2.6 million metric tons of carbon dioxide per year. Industrial emissions are also up by 47%.
The great news is that Tampa’s emissions have recently decreased– despite a growing population. This is because TECO, the city’s primary provider of energy, has transitioned most of its power generation from coal to natural gas, helping to decrease city-wide energy emissions by almost 40% since 2009. However, as TECO’s transition continues, overall net-reductions will be increasingly more difficult to achieve. In fact, all indicators show that emission counts could quickly increase since other sectors' emissions are on the rise. Municipal operations, the functions that City government are responsible for, account for 4.2% of citywide emissions. Energy use and other emission-inducing City functions are concentrated within a few areas.
Creating clean water is the City's top energy use category
Combined, City departments consumed 176,380,772 KWHs of electricity in 2019. IN FISCAL YEAR 2022, THIS ADDED UP TO A BILL OF APPROXIMATELY $25,000,000.
ELECTRICITY CONSUMPTION AND GREENHOUSE GAS EMISSIONS BY DEPARTMENT 2019
Electricity consumption (kWhs) and greenhouse gas emissions (mtCO2e) by City department, 2019
Department
kWhs
mtCO2e
WATER/WASTEWATER
112,841,126
48,183
PARKS AND RECREATION
17,427,891
7,442
OTHER (NOT CATEGORIZED)
11,539,349
4,927
TAMPA CONVENTION CENTER
10,550,150
4,505
POLICE
6,683,683
2,854
FIRE RESCUE
4,733,606
2,021
PARKING
3,685,943
1,574
ADMINISTRATION
2,941,350
1,256
TRANSPORTATION AND MOBILITY
1,586,109
677
SOLID WASTE
1,424,447
608
PUBLIC WORKS
1,086,360
464
INFRASTRUCTURE
698,880
298
PUBLIC LIBRARY
529,280
226
HEALTH
322,379
138
REAL ESTATE
191,039
82
FACILITIES MANAGEMENT
139,180
59
TOP 5 ELECTRICITY CONSUMING GOVERNMENT FACILITIES KWHs
Top 5 electricity consuming government facilities by kWhs
Rank
Facility
kWhs
1
HOWARD F. CURREN PLANT WATER TREATMENT PLANT
58,488,692
2
DAVD L. TIPPIN WATER TREATMENT FACILITY
37,572,145
3
TAMPA CONVENTION CENTER
10,550,150
4
POLICE HEADQUARTERS AND GARAGE
4,507,674
5
MORRIS BRIDGE WATER TREATMENT PLANT
3,967,486
FROM THE CITY OF TAMPA GREENHOUSE GAS INVENTORY, 2019
TOP 5 VEHICLE MILES TRAVELED, BY DEPARTMENT
FROM THE CITY OF TAMPA GREENHOUSE GAS INVENTORY, 2019
This provides a visible target for prioritizing climate action. Garbage collection and disposal, which is managed by the City, was noted in the Greenhouse Gas Inventory as creating 138,317 metric tons of greenhouse gas emissions. This is more than equal to all other City functions combined. Other focus areas include Water and Wastewater processing. Together, these two departments comprise about 64% of municipal energy use.
Two facilities in particular, the Howard F. Curren Water Treatment Plant and the David L. Tippin (potable) Water Treatment Facility use 58.5 million and 37.5 million kilowatt hours per year. That equates to 33% and 21% of all municipal energy use, respectively. The Police Department are responsible for the majority of vehicle miles covered by City-owned vehicles.
GOING FORWARD
The primary sources of greenhouse gas production have been identified by the recent City of Tampa Greenhouse Gas Inventory (2021). We will need to recalibrate our city in order to become more efficient when it comes to energy and water use, transition to renewable energy sources, reduce waste, and lessen our dependence on the automobile. While these changes will help to decrease our carbon footprint, they can also benefit daily life. Tampanians spend 18.2% of their budget on transportation, 2% higher than the national average, costing approximately $11,000 per year.3 Providing mobility options not only helps to lessen our emissions, but it also provides equitable access to jobs and other facilities or amenities. Within municipal operations, there are opportunities to reduce energy use or transition to renewable power in water and wastewater processing. This includes adding efficiencies, such as reducing water infiltration into wastewater pipes, which ultimately reduces processing demands and can make a big impact on Tampa’s energy future.
Did you know Mayor Castor’s 2023 Budget included hiring the City’s first ever citywide energy manager?
The City will also have to confront issues associated with its mobility system, one of the greatest contributors of greenhouse gases. Additionally, the land dedicated to automobile transportation is connected to drainage, heat islands, walkability, tree canopy, utility distribution, and streetscape design. Proximity to city amenities, such as shopping, libraries, and schools can make a big difference, and will be a focus of city planning moving forward. This important initiative also has a major relationship to creating an equitable city.
THE IMPACTS OF CLIMATE CHANGE
The federal government’s recently completed Fourth National Climate Assessment outlines the most current understanding of climate change and its potential impacts for regions across the United States. 61% of major Southeast cities are exhibiting worsening heat waves, higher than any other region, with more than 100 additional warm nights per year expected by the end of the century.4 This heat affects our waters, our energy demands, vegetation, and habitats, with many more unknowns. The National Oceanic and Atmospheric Administration’s (NOAA) suggests that sea levels will rise by 14 to 18 inches in the Gulf from 2020 to 2050, with flooding to occur more than 10 times as often as is experienced today.5 The Tampa Bay Climate Science Advisory Panel has concluded that Gulf waters will be anywhere between 1.5 to 5.5 feet above 2020 levels by the year 2100.6 Many coastal communities are built to the edges without much room to spare. Drainage systems, which rely on ponds and soil for water storage, will be affected by increased groundwater levels. These and other issues associated with climate change are described in the following pages.
USGCRP, 2018: Impacts, Risks, and Adaptation in the United States: Fourth National Climate Assessment, Volume II;
Climate Science Advisory Panel. 2019. Recommended Projections of Sea Level Rise in the Tampa Bay Region. *Calculations remove the low and high NOAA scenarios, and are based on difference from the observed levels in 2020.
Heat
Cities across the Southeast are experiencing more frequent and longer summer heat waves, with increasing overnight low temperatures and extended frost-free seasonality.7 Data from the National Climatic Data Center (NCDC) shows that temperatures are currently approximately 1° C (1.8° F) above pre-industrial levels, with the last decade being the hottest on record.8 The last three decades have each been successively warmer than any decade before since recordings started in 1850. We are experiencing increasing overnight low temperatures and extended frost-free seasonality.
Tampa currently experiences approximately 73 days each year with ‘feels like’ temperatures of 100° F and above. By 2053, that number is expected to reach 103 days.
Average annual temperatures for Tampa have increased by 2.5° F since records began in 1891.9 The summer of 2022 was the warmest on record for Tampa with an average temperature of 85.7° F.10
These changes are absorbed into the urban environment, creating thermal impacts, especially as hard and impervious surfaces soak up the heat. Climate change induces ecosystem change, and issues such as water quality are important to monitor. There is a human response to heat as well. Increased temperatures require more air conditioning and can cause risks, particularly for vulnerable populations. These impacts are described on the following pages.
Energy Use
Hotter temperatures, especially at night, will require air conditioners to work harder and longer. Air conditioning accounts for approximately 27% of home energy use in the Tampa region and it is predicted that in 30 years, Floridians will pay $300 million more in cooling costs than they do today.11,12 Research has shown that central air conditioning, as opposed to individual units, is less than half the per square foot cost.13 As temperatures increase, renters and people who cannot afford a centralized system will face rising costs.
Flooding
Increased sea levels will cause flooding at the coast, but will also put pressure on stormwater systems inland. Combined with an expectation of more intense storms, urban areas could see more flooding, especially in low-lying zones.
Sea Level Rise
The National Oceanic Atmospheric Administration has recently said that, based on historic trajectories, we can expect 4-8 inches of sea level rise in the next 30 years, with high levels of confidence.14 This change at the coast will not only affect water entering stormwater systems and overtop-ping sea walls, but habitats will change, stormwater ponds will become brackish and will not serve their purpose, aquifers will also be affected by salinity, and infrastructure will become impaired, such as roadways and utilities.
Public Health
Hotter days can have dangerous impacts on public health, including on people’s ability to work, to bike, or to walk around their neighborhood, with especially adverse effects on older populations, those with underlying health conditions, and those with special needs. Research has also shown that infectious diseases and non-historic health problems may occur more frequently as climate zones shift. People can become exposed to non-endemic influences, causing unique reactions. Vector borne diseases from mosquitoes is a primary concern, especially in the Tampa region.
7-9 USGCRP, 2018: Impacts, Risks, and Adaptation in the United States: Fourth National Climate Assessment, Volume II;
10 Barry, Rebecca. “Summer 2022 Was Warmest on Record for Tampa.”; 11 Mayclin, Danni. “Air Conditioning Accounts for about 12% of U.S. Home Energy Expenditures.”; 12 Mulligan, Michaela. “Think This Summer Felt Hot? Just Wait, Tampa Bay.”;
13 Mayclin, Danni. “Air Conditioning Accounts for about 12% of U.S. Home Energy Expenditures.”;
14 Climate Science Advisory Panel. 2019. "Recommended Projections of Sea Level Rise for the Tampa Bay Region" (Update).
Increased Storms
Warmer coastal waters can create more intense storms for the Gulf region, with heavier and longer-lasting rainfall events.15 When rainfall is concentrated, or when it lasts longer, total water volumes can overwhelm stormwater systems, leading to increased flood levels and damage. The economic impacts of such storms can be devastating. The costs of Hurricane Ian, for example, which directly hit the Fort Myers Beach area, is projected to have costs of more than $50 billion. 2017 was the costliest year on record, with a figure of near $300 billion. Studies have shown that there is roughly a 30% increased likelihood of major storms in the coming decade.16 The future will be wetter, and we will have to be prepared.
Storm Surge
In hurricane events, water is the most destructive force, not the wind. Generally, storm surge is accounted for by current building codes and FEMA regulated zoning. However, with sea levels rising, some areas may be exposed to new hazards, and storm surge elevations will match any changes in coastal waters.
Habitat Change
As the climate changes, there will be associated shifts and impacts to ecosystems. In our region, we are already seeing mangroves become more abundant and deeper water will make it more difficult for sea grass to grow. Ecosystem change can be heightened by human-induced inputs, such as pollution and disturbance. Wetlands and water quality are a primary concern as they are primary agents in regulating environments.
Hall, Timothy M., et al.,2021. “U.S. Tropical Cyclone Activity in the 2030s Based on Projected Changes in Tropical Sea Surface Temperature.”
City Hall Tampa International Airport MacDill Air Force Base The polygons are the 2020 Block digital vector boundaries from the U.S. Census Bureau. Daytime Surface Temperature Hotspots Tampa, Florida Mean Daytime Land Surface Temperature (°F / °C) 43°C4039 383736343227 109°F1041021009997939081 Airport City Boundary Neighborhoods Map Projection: NAD83 / Florida GDL Albers HillsboroughBay OldTampa Bay
MONTHLY MEAN SEA LEVEL MSL (ft)
St. Petersburg, Florida
Image: Monthly Mean Sea Level MSL for St. Petersburg, FL From 2019 CSAP Sea Level Rise Report
AMOUNT OF ELEVATION GAIN AFTER 2000
(NOAA2017, FEET)
OUR UNIQUE TOPOGRAPHY
The City of Tampa is situated within a uniquely flat topography with karst limestone geology. This means that over time, sands have accumulated and hardened, creating a very porous sub-surface environment. Different than other parts of the country, minimal amounts of rainwater move along the surface. Instead, it is mostly infiltrates the soil, where it migrates laterally, or it goes into the atmosphere through evapotranspiration.
Sometimes the water below ground meets the surface, where it is exposed as a spring. It is also held in surficial pockets in flat areas, creating wetlands, marshes, and swamps. This system is important as it cleans the water before it enters our streams, rivers, or Tampa Bay. However, urban development has radically changed this system and is causing environmental change.
Comparison of water distribution by ground cover type and impervious surface percentage
Ground Cover Type
Impervious Surface (%)
Run-off (%)
Evapo-transpiration (%)
Shallow Infiltration (%)
Deep Infiltration (%)
Natural Ground Cover
0
10
40
25
25
Low Impervious
10-20
20
38
21
21
Medium Impervious
30-50
30
35
20
15
High Impervious
75-100
55
30
10
5
Compounding Shocks and Stressors
Climate change impacts can combine with other factors to present compounding difficulties for the community. It is important to remember that population groups can be affected differently. Consider extreme heat, for example, when coupled with power loss after a hurricane. Some will have less capacity to cope – they may have medication that needs to be refrigerated or have increased susceptibility to heat. The city will continue to embed an equitable approach and response that seeks to protect vulnerable populations and considers the complexity of community needs.
SHOCKS AND STRESSES, FROM RESILIENT TAMPA
Shocks include both natural and human-driven disasters, such as hurricanes, heatwaves, pandemics, and cyberattacks. While it is critical for Tampa to prepare for these risks by mitigating their impact and building the capacity to bounce back more quickly when they do occur, addressing underlying stresses is equally important.
Stresses are the vulnerabilities that afflict Tampa’s communities on an everyday basis, and are amplified in the event of a shock as already-vulnerable communities tend to experience greater impacts during these adverse events. Stresses range from escalating affordability challenges to economic inequality to aging infrastructure. Tackling such stresses will not only foster a more prosperous and thriving city on an everyday basis, it will also strengthen Tampa’s preparedness for future disasters.
TAMPA BY THE NUMBERS
CLIMATE ACTION AND EQUITY PLAN
ENERGY AREA: 72,960 ACRES OF LAND
3,205-6,410 ACRES OF LAND NEEDED TO MEET TAMPA’S ENERGY NEEDS WITH SOLAR ENERGY (1 MEGA-WATT OF SOLAR POWER REQUIRES 5-10 ACRES OF LAND)
127 MILES OF COASTLINE
116 MILES OF TRAILS
1,225 MILES OF ROAD
32% OF THE CITY HAS TREE CANOPY (27,641 ACRES)
23,962 ACRES ARE IMPERVIOUS
24,000 ACRES OF WETLANDS
ESTIMATES: 641 MEGA-WATT HOURS TOTAL
532 MEGA-WATT HOURS USED BY THE CITY (EXCLUDING GOVT.)
109 MEGA-WATT HOURS USED BY GOVERNMENT
WATER WASTE: 526 MILES OF PIPE IN STORMWATER SYSTEM
81 MILLION GALLONS OF POTABLE WATER PRODUCED EACH DAY
20% USED FOR IRRIGATION
10% USED FOR HEALTH AND SAFETY
35% HOUSEHOLD USE
>1,000 TONS OF TRASH PER DAY (AVERAGE)
>82,000 POUNDS PER HOUR (AVERAGE)
35% COMMERCIAL USE
1 RIVER (HILLSBOROUGH RIVER IS THE PRIMARY SOURCE OF WATER)
United Sates Census Bureau. [2021). "2020 U.S. Gazatteer Hles,"
City of Tampa [2018). "City of Tampa Tree Canopy and Urban Forest Analysis 2016."
Ibid
ibid
Water Department, (2020).
lbld
lbid
City of Tampa. (2021). "Greenhouse Gas lnventory,"
ibid
Solar Enerqy lndustries Association. (n.d.).
THE ECONOMIC IMPORTANCE OF ADDRESSING CLIMATE CHANGE
Climate and resilience planning efforts have economic benefits that extend beyond the more obvious infrastructure and community benefits. Many companies are looking to meet climate goals because of company policy, and in considering locations for development, factors such as transportation and access to clean and renewable energy are critical to hitting their targets. Amazon’s recent search for new office headquarters, for example, brought tens of thousands of high-paying jobs and billions of dollars in investment to cities that were selected, in part due to their prioritization of climate action. Building community infrastructure and improving Tampa’s carbon footprint will draw companies such as these to the region.
The Tampa Bay Partnership has recently released a publication addressing the business case for addressing climate in the region. The Partnership’s report suggests that building resilience into urban infrastructure could save communities more than two dollars for every dollar spent. One primary concern is sea level rise. The report suggests that in the six-county region of the Tampa Bay Regional Planning Council (TBRPC), daily tidal inundation may result in $2.9 billion in property value loss, with an associated $34 million in sales, tourism and property tax lost annually by 2045. By 2070, $238 million could be lost annually.
Building resilience into urban infrastructure could save communities more than $2 for every dollar spent.
The future, however, is not so certain. TBRPC has issued multiple possible scenarios for how much waters may rise, ranging from 2 to 8.5 feet above 2000 levels. These findings, supported by recent National Ocean and Atmospheric Administration (NOAA) research, explain that future conditions are highly dependent on trajectories of increased heat, uncertainties of ice-mass loss, and change in ocean dynamics, which are all impacted by efforts to reduce greenhouse gas emissions. In an indirect way, future flooding and the impacts within coastal communities are dependent on our actions today. Without action, we are heading toward the most elevated risk scenarios.
INITIATIVES ARE ORGANIZED BY THE 10 CLIMATE ACTION CATEGORIES
Within each section, goals, strategies, and specific initiatives can be found. Below is a sample page showing how to read the document.
Climate Action Category Strategy Initiative(s) Goal Goal(s) met - Mitigate - Adapt - People Initiative directly addresses com-munity input Type of initiative - Study - Policy - Administrative - Project
3 CLIMATE ACTION INITIATIVES
aH
ENERGYE
The Tampa Electric Company (TECO) owns the electric generation facilities, transmission lines, and distribution infrastructure that provide electricity to Tampa. In total, TECO serves approximately 800,000 customers. In Florida, service utilities operate within an exclusive territory and are regulated by the five-member Florida Public Service Commission. By state code, TECO is responsible for creating and providing energy. If another entity wants to manufacture energy, they can do the following. 1) They may produce and transmit it directly to their own property. 2) If more is produced than is needed on-site, the energy can be put into TECO’s distribution network and applied to a future TECO bill, or the producer is compensated at a rate that is agreed upon by TECO and the Public Service Commission – this is known as “net-metering”. 3) If large amounts of excess are produced, the entity can sell their energy to a utility through an arrangement called a Power Purchase Agreement. In Florida, those that generate power can only sell to a utility, not directly to a customer, and the utility sets the rate of purchase. If the power has to go through local transmission lines to get to the purchaser, the local utility will charge a fee – much like a toll booth.
This complex framework makes the City of Tampa heavily reliant on TECO to meet any clean or renewable energy goals. Currently, TECO generates approximately 90% of its electricity from burning fossil fuels, primarily natural gas. Approximately 6% of its electricity is solar generated, projected to increase to 20% by 2030.27 Their recent switch from coal power to natural gas has helped to decrease the city’s greenhouse gas emissions, but there is a long way to go if we are to transition to 100% clean and renewable energy. Emera, their parent company, has set the goal of carbon neutrality by the year 2050, but this does not guarantee 100% clean and renewable energy for its customers since carbon neutrality can be accomplished by purchasing offsets to make up for emissions over and above the 100% clean and renewable mark.
Image: Sources of municipal energy. From the City of Tampa Greenhouse Gas Inventory
Given these realities, it may be difficult to accomplish 100% clean and renewable power for all of Tampa; however, Mayor Castor is committed to working toward this goal for municipal entities. This Plan provides a multi-pronged approach toward transitioning to new energy sources while also reducing energy demand. In addition to the following initiatives, a 100% Clean and Renewable Energy Plan will soon be produced to define and prioritize pathways towards this goal. This roadmap will also include a verified timeline, based on data collection and state-of-the-art analysis of the City’s assets.
Spotlight on TECO
Since the year 2000, Tampa Electric has reduced coal usage by more than 90%. Over that period, their transition to natural gas has enabled them to cut carbon dioxide emissions in half while the demand for power has increased 25%. So far, the company has installed more than 650 megawatts (MW) of solar capacity, enough energy to power 100,000 homes, and is currently constructing another 600 MW. By the end of 2023, Tampa Electric will be generating enough solar energy to power 200,000 homes, 14% of its energy production. This commitment aligns Tampa Electric with its parent company, Emera Inc., which announced a corporate-wide vision for net zero by 2050.
To reach net zero, TECO has laid out the following plan:
Increase the use of zero/low-carbon technologies.
Tampa Electric has been actively investing in renewable solar energy, which will soon account for 14% of overall energy production. The company plans to expand renewable capabilities at a pace that is affordable for customers.
Invest in emerging solutions that help generate clean energy and support innovation to reduce carbon emissions. Innovations in both existing and new technologies, including carbon capture, bio-fuels, hydrogen and battery storage, may become components of the Company’s future energy portfolio. The company is also piloting new concepts like a plug-and-play micro-grid system that delivers resilient, renewable energy at the community level. Tampa Electric has just recently provided more than $5 million in partnership funding to the University of South Florida to further research innovative technologies and new ideas, which should help with these pursuits.
Continue projects to transition power stations away from coal. Big Bend’s Unit 1 is being re-powered and Big Bend Unit 2 has retired, as part of the Big Bend Modernization project. When complete in late 2022, Unit 1 will be a state-of-the-art, highly efficient, combined-cycle natural gas unit, capable of producing 1,090 megawatts of electricity. Modernizing power plants improves fuel generation efficiency, which corresponds to lower fuel costs and emissions.
Big Bend Unit 3 was retired in April 2023, which is 18 years early. It began operating as a coal unit in 1976; natural gas was added as a secondary fuel several years ago.
Modernize the electric grid. Tampa Electric is adopting new technologies to deliver power more intelligently and efficiently. They are currently working with the City to transition 100% of streetlights to LED technology by the end of 2022. Other projects involve smart meters and remote access control.
Provide energy audits for all customers. TECO offers free energy audits for every account. They will conduct a personalized in-home audit and have an online version that is more simple, but less detailed. This is an exceptional service and should be utilized by all.
To schedule your In-Home Audit, call 813-275-3909 weekdays from 8 a.m. to 5 p.m.
Challenges
Power and Price Volatility
So far, Tampa’s successes in reducing greenhouse gas emissions have been tied to TECO’s transition to natural gas. Over 80% of TECO's power is supplied by this source. While this has helped to address climate change issues, the reliance on natural gas may create increased price volatility. Just this last year, natural gas commodities rose approximately 60%. This increased costs for TECO, for which they subsequently requested an 11% rate increase for consumers.
TECO: The Gatekeeper to 100% Clean and Renewable Energy
The city can initiate different efforts to put on a display of best practices when it comes to energy; however, progress will ultimately be governed by TECO. Under current state law, large customers of TECO, like the City of Tampa, do not have economical choices to develop their own off-site renewable energy options.
Pre-emption Laws at the State Level
State policy makers have enacted rules that lessen local municipalities' ability to make regional regulations. This has impacted many different sectors, such as transportation and environment (regarding urban tree canopy codes, for example), but has especially been a factor in cities’ relationship with utilities.
In response to citizen- and city council-initiated climate activism in Tampa and across the state, in 2021 Florida legislatures pre-empted the ability for cities to enact laws, policy, or procedures that require clean energy from utilities or in new developments. The State also preempted local governments from requiring gas stations to include electric vehicle charging stations as part of any permitting or zoning approvals. Most energy issues have been preempted by the State for many decades when the Public Service Commission and the State Office of Energy were created.
Defining Terms in the Energy Industry
Carbon Neutral, Net-zero, and Offsets
Many companies or municipalities are attempting to meet a goal of carbon neutrality, which signifies an effort to reduce production of CO2, or compensating for lack of reductions elsewhere by removing an equal amount of CO2 from the atmosphere.
Net-zero is a different standard, whereby an organization reduces all greenhouse gas emissions across its entire supply chain.
In most cases it is impossible to reduce usage to zero, so a system of trade-offs has been established whereby a customer or a utility can purchase an offset to make up for their insufficiencies. Offsets represent a metric ton of emissions avoided or reduced. For example, A company can reduce their ‘dirty’ energy use by 70% and then make up for the other 30% by planting trees, which, in the accounting system, are considered to absorb the greenhouse gas still being produced. This is easier to achieve than actually consuming 100% clean or renewable energy, which is very difficult.
Renewable Energy
Derived from sources that can naturally replenish themselves, such as wind, sun, and hydro-power.
Clean Energy
This includes a larger cache of energy sources that are zero-carbon. It includes all renewable energy sources but also nuclear, some forms of hydrogen and bio-gas.
Renewable Natural Gas
Organic waste material from homes but also from agricultural production – cows especially – is put through decomposition processes, which release gas. This can be captured and cleaned to be used for energy purposes.
Renewable Energy Certificates (RECs)
RECs are a market-based instrument that represents the right to own the environmental, social, and other non-power attributes of renewable electricity generation. These RECs substantiate offsets, so that they may be included in metrics that establish whether a target energy goal has been met or not. Offsets and RECs are similar but fundamentally different instruments with different impacts, representing different criteria for qualification and crediting. RECs are purely associated with energy generation, whereas offsets can be measured and monetized as metric tons of CO2 or CO2 equivalent.
Distributed Energy
In this type of energy system, the electricity generating sources are located close to load (demand) and the power generated is consumed on-site or nearby on the same distribution line, rather than pushing energy back through a substation onto transmission lines. A typical power plant is tied into the transmission grid, and feeds load far away. Distributed generation is mostly consumed very close to where it is generated and is most commonly associated with rooftop solar energy. Combined heat and power (CHP) is another form of distributed energy often used in large factories that convert excess heat to electricity then consume it on site.
Net Metering
When an owner of solar panels produced more energy than they use, they create a balance from which to draw upon later in the year. At the end of the year the power is purchased by the Utility from the energy producer for, "avoided costs," meaning the fuel cost that the Utility did not incur to create the energy. This rate is set by an agreement between TECO and the public service commission. In the case of a solar farm, all of the energy produced falls into the “avoided cost” category and is paid for, by TECO, at that rate. Historically the avoided cost rate is very low and is not cost-competitive with a utility-owned solar farm.
Avoided Costs
The avoided cost rate is set by an agreement between TECO and the Public Service Commission. In the case of a solar farm, all of the energy produced falls into the “avoided cost” category and is paid for, by TECO, at that rate. Historically the avoided cost rate is very low and is not cost-competitive with a utility-owned solar farm.
Power Purchase Agreements (PPAs)
This is an agreement between a power generating company and a utility. In Florida, the Utility is almost always the buyer, but in other states with competitive markets, cities and large customers regularly buy direct from power plants.
Franchise Agreement
Franchise agreements are purely voluntary but are customary in Florida, and describe agreements made between energy supplier (the Utility) and customer. Ultimately the City does not have any jurisdiction – the utility does not have to sign – and the operating policies are determined by the Public Service Commission. However, these are traditional instruments used to formalize stipulations and provisions.
Utility Rate
Every TECO customer has the option of selecting their rate structure for the power that they receive. This is mandatory from the Public Service Commission. There are multiple options, and can be aligned with patterns of energy use. For example, some energy users may only use power during concentrated mid-day hours, whereas others may distribute their energy use throughout the 24-hour cycle. By manipulating energy demand to off-peak hours, it is possible to reduce energy costs. TECO, by default, selects a rate structure for each customer. The rate options are proposed by TECO and approved by the Public Service Commission in a public process.
E1
Transition All Municipal Operations to 100% Clean and Renewable Energy
While the City and its administrative departments are only responsible for 4.3% of city-wide greenhouse gas emissions, it is the largest single entity, with an ability to coordinate large-scale change.28 Because of this, and because of the City’s opportunity to lead by example, the City will 1) create a plan to identify pathways to 100% clean and renewable energy and 2) establish priority projects that will help us to meet our goal. The transition will not be simple, especially since the City is reliant on an outside entity for its energy supply. Utilities, such as TECO, and the Public Service Commission ultimately determine access. However, there are steps that the City can take, noted in the following.
E 1.1 IMPROVE ENERGY EFFICIENCY IN MUNICIPAL FACILITIES
It is helpful to keep in mind that the cleanest source of energy is the energy never used. Considering that 32.2% of the City’s municipal greenhouse gas emissions come from electricity use, reducing energy waste or inefficiency is important to curbing overall emissions.
Energy is used in industrial processes, such as in cleaning water or wastewater, and in facilities. The industrial side takes more energy, which is required for large pumps and mechanical components.
Within the City’s building portfolio, parking garages, recreation facilities, and stations (police, fire) are some of its greatest consumers. Lighting and air conditioning are primary targets, with LED lighting change-outs saving up to 40% energy consumed. New roofs, insulation, and high-efficient HVAC equipment can also bring energy use down another 10%-40%.
⊲ E 1.1.1 Direct consistent funding towards building renovations for energy reduction. A priority list includes the following.
Changing lighting to LED in parking garages:
Ybor City Parking Garage
Palm Avenue Parking Garage
Twiggs Street parking Garage
TPD Parking Garage
South Regional Parking Garage
HVAC replacement:
Old City Hall
David Barksdale Senior Center
Port Tampa Community Center
Wayne Pappy Community Center
Fire Station 21
Fire Station 20
Roof replacement
Port Tampa Community Center
Fire Station 9
Fire Station 18
Fire Station 10
Fire Station 15
Fire Station 16
ENERGY-REDUCING RETROFITS
Retrofitting existing lighting infrastructure is one way to create energy efficiencies. This includes power for recreation field lighting, pool pumps, and facility lighting and cooling. Rogers Park Golf Course, Copeland Park, and Loretta Ingraham Center Pool are top energy using facilities owned by Tampa.
E 1.2
TRANSITION TO CLEAN AND RENEWABLE ENERGY SOURCES
The City has reviewed 1,344 electric meters that they own and operate and identified 20 priority solar implementation projects that would provide a high return on investment. These projects are already underway, and the continued development of solar power will continue to be a priority for the City, as will be working with TECO to motivate them toward a 100% clean and renewable energy agenda.
The solar feasibility study revealed that with a $14 million investment, the City could use those 20 solar projects to reduce its energy demand from TECO by 11,291,119 kWh, which is approximately 6.4% of its total usage. This would provide an estimated annual savings of $1,242,024. Many of the properties chosen are well suited for solar installations and would provide annual offsets of up to 141.5% (producing more energy than the buildings consume). Buildings with solar energy offsets of 15% or higher should be prioritized first. Very conservative calculations were made to determine the ROI timeline for each property, which are shown on the following pages. With new solar tax credit incentives these ROI timelines would likely end up being shorter.
E 1.2.1 Install solar panels at municipal facilities, using the Solar Feasibility Study provided by this Plan. MITIGATE
PROJECT
E 1.2.2 Mandate that all new municipal construction should utilize solar energy when possible, or be “solar ready”. MITIGATE
POLICY
E 1.2.3 Review existing tariff rates for all departments, with a focus on opportunities when transitioning to renewable energy sources. MITIGATE
STUDY
WHAT IS SOLAR READY?
In solar-ready buildings roofs are designed with structural capacity to hold a future solar installation, with a conduit run from the roof to the electrical panel. Additional wall space is provided in the elec-trical room for an inverter. Other design consider-ations should include the orientation of the building, to minimize shade and maximize south-facing sun for the roof. Roof equipment and other roof obstruc-tions should be minimized and centralized to one point (preferably the north side of the roof where there is the least amount of sun) to make room for as many solar panels as possible.
The City has initiated a study to define 20 buildings suitable for solar energy implementation.
Summary of prioritized City buildings for solar energy implementation, including installation size, annual production, energy offset, estimated cost, annual savings, and ROI timeline.
Building name
Size of solar installation
Annual production (kWH)
Annual energy offset
Estimated cost
Estimated annual savings
ROI timeline (years)
1. David L. Tippin Water Treatment Facility
3,328
5,219,153
13.8%
$6,242,719
$574,107
10.8
2. Tampa Convention Center
2,873 kW
4,422,550
41.9%
$4,613,826
$486,481
9.4
3. Police Athletic League
141.5 kW
221,340
141.5%
$350,622
$24,347
14.4
4. TPD and Fire Rescue Communications Center
118.5 kW
186,745
18.6%
$301,345
$20,542
14.7
5. Tampa River Center
156.4 kW
204,425
41.9%
$382,115
$22,487
17
6. TPD District 3
94.6 kW
146,115
32.9%
$248,566
$16,073
15.5
7. Loretta Ingraham Center
99.1 kW
150,450
22.5%
$258,465
$16,550
15.6
8. Macfarlane Park David M. Barksdale Senior Citizen Center
97.9 kW
131,325
53.7%
$255,807
$14,446
17.7
9. Port Tampa Park Community Center
75.7 kW
112,540
34.8%
$205,307
$12,379
16.6
10. Fire Station #14
63.3 kW
100,725
63.5%
$176,551
$11,080
15.9
11. Tampa Fire Rescue HQ
58.9 kW
82,433
7.7%
$165,568
$9,068
18.3
12. Dept. of Solid Waste and Environmental Program Mgmt.
62.3 kW
93,670
19.2%
$173,918
$10,304
16.9
13. TPD District 1
57.3 kW
85,680
20.8%
$161,880
$9,425
17.2
14. Fire Station #15
51.8 kW
60,622
53.2%
$148,440
$6,668
22.3
15. Springhill Park Community Center
49.7 kW
71,638
17.1
$143,217
$7,880
18.2
16. Fire Station #23
24.1 kW
34,621
16.8%
$77,152
$3,808
20.3
17. Kate Jackson Center
17.5 kW
27,855
15.4%
$58,854
$3,064
19.2
18. Fire Station #11
16.8 kW
19,465
8.9%
$56,657
$2,141
26.5
19. Fire Station #22
10.7 kW
14,960
7.2%
$38,479
$1,646
23.4
20. Greco Softball Complex
3.4 kW
5,432
2.6%
$14,564
$598
24.4
Total savings
SIZE OF SOLAR INSTALLATION: 7.31 MWANNUAL PRODUCTION: 11,291,119 KWHANNUAL CITY OF TAMPA ENERGY OFFSET: 6.4%ESTIMATED COST: $14MESTIMATED ANNUAL SAVINGS: $1.2MROI TIMELINE: 11.3 YEARS
Prioritized solar projects above are from the Energy Reduction + Solar Feasibility study, by REAL Building Consultants, as part of the Climate Action and Equity Plan.
Example pages from the Energy Reduction and Solar Feasibility Study, by REAL Building Consultants
E 1.3 TRANSITION TO EVs
Electric vehicles remove gas combustion from the point of release, eliminating NO2 and other discharges associated with climate change. Transitioning the City’s fleet will be an ongoing effort that will also include an evaluation of electric energy sourcing, available product types, different needs within the fleet, and associated cost/benefit metrics.
E 1.3.1 Continue to build the City’s electric and hybrid vehicle fleet.
MITIGATEPOLICY
E 1.4
TRACK AND MONITOR ENERGY USE
Regular auditing of facility energy use enables both comparison and tracking, to better understand where improvements can be made. This will require additional personnel to acquire and manage data. To support this effort, the City will hire its first Energy Manager.
The City will also begin to utilize the ENERGY STAR Portfolio Manager tool, which is used to monitor facility energy consumption, establish benchmarks, and track performance. This tool allows a performance comparison between buildings of a similar size, and with a similar function through the Portfolio Manager’s extensive database.
Integrating energy and water data from ENERGY STAR Portfolio Manager to more robust, visualization tools, such as the LEED Arc Dashboard (similar to what is used for LEED for Cities, which the City of Tampa has certification) may also provide opportunities for the City’s Sustainability & Resilience Officer and other departments can track their performance across other metrics in addition to energy and water efficiency: specifically waste, transportation, and human experience.
E 1.4.1 Hire an energy manager.
MITIGATEADMINISTRATIVE
E 1.4.2 Develop a framework for comprehensive energy consumption tracking and management using a program such as the Better Buildings Challenge or the Energy Star Portfolio Manager, especially at priority energy use facilities such as the Howard F. Curren Wastewater Plant. Report energy use annually on the City’s website.
MITIGATEADMINISTRATIVE
E 1.4.3 Continue to conduct a greenhouse gas inventory every 5 years.
MITIGATESTUDY
ELECTRIC VEHICLES AND EMISSIONS
Electric Vehicles in Florida emit over 63% fewer GHG emissions annually compared to gasoline vehicles. As a comparison, a gasoline powered car needs an efficiency of 88 miles per gallon to have the same GHG emissions benefits as an electric car. In the future, this may be enhanced since more power is being generated by renewable energy. The combustion process also produces byproducts that enter the atmosphere, including carbon monoxide, nitrogen dioxide, particles containing hazardous chemicals, and sulfur dioxide. It also produces carbon dioxide, which is not harmful to humans, but is a greenhouse gas and contributes to global warming.
ENERGY MANAGEMENT IN ATLANTA
The benefits from hiring an energy manager are generally two-fold – increased progress towards achieving policy goals (for example, monitoring of municipal energy use and prioritization of energy reduction projects) and energy savings (due to increased scrutiny of energy bills). The results and reduction of costs can potentially pay back the salary required several times over.
The City of Atlanta hired an energy manager in 2014 and was able to capture the following benefits:
Identification of thousands of streetlights that were billed by the utility but didn’t exist
Identification of dozens of buildings that were sold by asset management but the City had accidentally retained ownership of utility responsibilities.
Benchmarking of the energy and water consumption of every building over 5,000 sqft owned by the City
Behavioral efficiency training with staff (combined with the benchmarking, this reduced average energy use intensity (EUIs - energy delivered to a building divided by its area) 19% in 3 years)
Building energy audits
Management of the City’s new facility LED program
Management of a Revolving Loan Fund
Establishment of energy performance contracts
Within 1 year, these efforts saved Atlanta approximately $5 million, a number that continues to increase.
The energy manager in Atlanta was also responsible for designing a community engagement process to pass sweeping energy legislation. This included 160 stakeholder meetings in 6 months, leading to:
Benchmarking policy (commercial and multi-family housing)
Transparency policy (commercial and multi-family housing)
Energy Audit policy (commercial and multi-family housing)
Retro-commissioning policy (commercial and multi-family housing)
LEED-NC policy for new City buildings
LEED-EB policy requirement for all existing City buildings within 10 years
Design of the City’s rooftop solar program
Co-authoring of the City’s Climate Action Plan
E2
Use Policy and Incentives to Encourage a Transition Away from Fossil Fuels in the Public Sector
Energy use produces the greatest amount of greenhouse gas emissions in Tampa, with transportation in a very close second. This energy, mostly all from TECO, is responsible for powering our homes and places of work, our air conditioners, refrigerators, and other appliances. It fuels our productivity, regulates our environments, and connects us to others. Working toward clean and renewable energy sources in the public sector will help to mitigate increased heat, which is the source of many other climate-related impacts. Developing a diversified portfolio of energy sources will also help to establish price stability.
A move toward clean and renewable energy will help to reduce emissions, thus decreasing the degree of environmental change in the future. There is also an equitable component to making this change. Fossil fuels include an element of environmental degradation and are often associated with air and water quality problems that tend to occur in lower income or front-line communities. Lastly, diversifying our energy portfolio will help to stabilize prices in the face of environmental and political uncertainties. Just in the last few years, the price of natural gas has tripled. This accounts for 90% of TECO’s energy output and so the Public Service Commission has granted the utility permission for a rate increase.
Part of this Climate Plan is dedicated to educating the consumer about energy and different available options. This can be found in the “Defining Terms in the Energy Industry” section, in the introduction to the Energy chapter, and in the following pages, which describe the components of a TECO energy bill, for typical customers and for those that self-power using solar.
E 2.1
EXPAND UPON EXISTING WEATHERIZATION AND ENERGY EFFICIENCY INCENTIVES TO REDUCE ENERGY CONSUMPTION IN RESIDENTIAL AND COMMERCIAL SECTORS
Energy use is the leading cause of greenhouse gas emissions in the City of Tampa. To make a significant citywide contribution to reducing future climate change, there will need to be a dramatic shift in the way that we build and power our communities. The City is committed to working towards this as a priority goal with collaboration and support from the community. Options range from mandates to incentives to information-based metrics that will all help to develop a culture of environmental stewardship.
E 2.1.1 Form a working group to evaluate options for policy that incentivizes solar energy production and energy efficiency projects in the private sector. Approaches can range from mandates to monitoring to incentives. MITIGATE ENGAGE POLICY
E 2.1.2 Embed weatherization into the City of Tampa Owner-Occupied program. MITIGATE ENGAGE ADMINISTRATIVE
Sample Energy Utility Bill Without Solar Energy Supply
Daily Basic Service Charge A fixed daily or monthly fee for basic connection to the TECO power grid. This is billed monthly regardless of the service used, or whether a property is solar powered.
Energy Charge Energy charges become more expensive after thresholds are exceeded. Power also costs more or less at different times of day, that is, during peak load times or off-hours. Every customer has multiple rate options. Generators, solar, and/or batteries can be used to minimize threshold exceedance. The City is currently exploring its rates and usage, and tools that will help minimize costs.
Storm Protection Charge All utilities are allowed to charge additional fees for storm protection, which includes power line burial, pole upgrades, and tree trimming, and is governed by the Public Service Commission. TECO has recently been granted permission to increase usage of Storm Protection funds. The cost is passed on to the consumer through the fee shown.
Clean Energy Transition Mechanism Similar to the Storm Protection Plan, this fee is established for utility upgrades and is approved by the Public Service Commission.
Florida Gross Receipt Tax This is a blanket tax from utility services for all retail customers in Florida, provided to the utility company.
Sample Energy Utility Bill With Solar + TECO Energy Supply
Power for this bill is supplied by solar to keep TECO power use under the threshold of increased rate charges. All other fees apply, since power is being drawn from the TECO grid.
Sample Energy Utility Bill Using 100% Solar Energy Supply
When only using solar energy, all fees are eliminated except for those associated with being connected to the TECO grid. This is needed since power is sometimes supplied to TECO. This overage is deducted from when power is drawn from their system. This is monitored and charged on a yearly basis, called ‘net metering.’
THE MY SAFE FLORIDA HOME PROGRAM
Recently re-enacted by the Florida State Legislature, this $100 million program provides home inspections and matches homeowner funding to mitigate risk to hurricane damage. The program provides $2 for every $1 spent, with up to $10,000 provided for a $5,000 investment. Projects can include opening protection, exterior doors, including garage doors, and bracing, waterproofing and reinforcement of roof elements. Through this program, purchase of impact-resistant doors, garage doors, and windows are also tax exempt. Many of the same projects that mitigate risk to wind also help to seal off interior space, creating air conditioning efficiencies and lower energy consumption.
E 2.2 SUPPORT ACCESS TO SOLAR ENERGY FOR RESIDENTIAL, COMMERCIAL, AND INDUSTRIAL USERS
The City will ensure that Tampa’s codes and policies do not limit an individual's access to solar energy. The City will also serve as a link between energy users and the multiple opportunities that exist to ease the financial burdens of transitioning to alternative energy sources such as solar.
E 2.2.1 Facilitate connections between the community and solar programs, including Solar United Neighbors (SUN), the Solar and Energy Loan Fund (SELF), and the Property Assessed Clean Energy (PACE) program.
E 2.2.2 Review historic district codes and ensure that all Tampa homes have an opportunity to install solar energy.
E 2.2.3 Work with TECO to develop a decentralized power generation plan.
E 2.2.4 Engage with the Florida Public Service Commission regulary and establish an inter-agency group to discuss issues related to Utility providers.
POLICY OPTIONS THAT INCENTIVIZE SOLAR ENERGY PRODUCTION
Some cities have promoted citywide standards to curtail the use of fossil fuels within their jurisdictions. Some require strict adherence to minimum criteria or penalties are invoked. Others rely on tracking and monitoring, and hope that information will help developers to find opportunities to be more energy efficient. The following examples reveal the breadth of approaches.
MANDATE
INCENTIVE
INFORMATION
The Green Building Ordinance (Miami Beach)
Includes a tax for all buildings that do not meet LEED Gold or Living Building Challenge certificate on new construction over 7,000 sq ft. LEED Silver designation receives a 66% reduction of the tax and lesser LEED certified buildings receive a 50% tax reduction. The tax equals 5% of construction value.
Green Building Incentive Program (Orlando)
New commercial and multi-family construction with a minimum 1,000 sq. ft. gross floor area receives a one-time/one-year property tax rebate on their new tax increment generated by the project. Platinum rating receives 100% tax rebate; Gold, 75%; Silver, 50%. There is a program cap of $2,500,000 in tax rebates awarded during the five-year program, with no project receiving more than $250,000.
Commercial Building Energy Efficiency Ordinance (Atlanta)
Requires municipal buildings above 10,000 square feet and commercial and residential buildings above 25,000 square feet to annually track whole-building energy use and report to the City. The phased implementation started in 2014. Energy and water consumption are tracked using the ENERGY STAR Portfolio Manager on an annual basis, with an audit every 10 years.
Better Buildings Challenge
This is a United States Department of Energy (DOE) program that provides assistance for tracking and monitoring energy efficiency. Participants conduct an energy efficiency assessment of their building portfolio and pledge to make organization-wide energy savings of 20% in 10 years. Support is provided by DOE, including technical assistance, community network, and publicity.
PRIVATE FINANCING FOR SOLAR ENERGY There are many different avenues to finance the things we buy. Most people get a loan when they buy a car or a house. Similarly, for major home upgrades – a new roof, air conditioner, or solar panels – many homeowners often need affordable financing to make that happen. With several “green lenders” in the marketplace, it is important to know the difference between the various types of financing.
Comparison of private financing options for solar energy, including co-ops, unsecured loans, PACE, and bank/credit union loans, with details on timeframe, description, and payment responsibilities.
Type of Assistance
Timeframe
Description
Responsibilities and Payments
SUN
Solar Co-op
Price reduction because of coordination of bulk purchasing
SUN provides education and helps to optimize utility billing
SELF
Source of Capital
Unsecured Loan
Up to 7 years for repayment, paid monthly
Client will not lose home if they cannot repay
Payment goes to the lender
Opportunity for flexible payment plans in times of hardship
Financing is detached from the home
PACE
Source of Capital
Secured Loan
Up to 20 years for repayment, paid yearly
Backed by the equity of the home. This is an assessment and as such, carries with the selling of the house. Financing agent does not check credit nor financial situation.
Ad valorem tax - payment is collected through the tax collector
No flexibility for repayment
Cannot sell home unless the loan is paid off
BANK AND CREDIT UNIONS
Source of Capital
Unsecured Loan
Lender de-pendent
Client will not lose home if they cannot repay
Payment goes to the lender
Opportunity for flexible payment plans in times of hardship
Financing is detached from the home
E 2.3 COORDINATE, INCENTIVIZE AND/OR PLAN A TRANSITION TO ELECTRIC VEHICLES IN THE PUBLIC SECTOR
Recent studies suggest that inconsistencies in electric vehicle (EV) infrastructure is the number one concern for those considering making a switch from internal combustion engine cars. The City is in the process of creating development standards to ensure consistent and affordable access to electricity in places where EVs may be found.
E 2.3.1 Create an EV Readiness Ordinance that guarantees access to electric vehicle charging in multi-family, commercial, and hotel developments.
WATER AND WASTEWATER
The City of Tampa Water and Wastewater departments share similar missions: to deliver high-quality water and wastewater services in a sustainable manner, while protecting public health and the environment. However, these play significant roles when considering energy and greenhouse gas production – they are the two highest energy users across all municipal departments, consuming more than half of the energy. Therefore, this context provides our water treatment, distribution, and collection systems with prime opportunities to reduce energy usage and curb greenhouse gas emissions.
Energy reductions can occur through three different approaches: modernizing equipment, optimizing treatment processes, and water conservation. The more water used, the more energy required for the multiple phases of processing and pumping. Treating water from the city’s toilets, showers, sinks, and commercial use is responsible for the greatest quantity of energy use. This energy intensive process collects water through a series of pipes and pump networks and delivers it to the Howard F. Curren Water Treatment Plant near the Port.
Energy sourcing is just as important for meeting goals related to emissions, especially considering that power purchased from TECO is mostly generated by burning natural gas. Just recently, the Water Department has initiated efforts to explore powering 50% of its facilities through solar panels and a mini-hydro project at the dam. Other projects, such as increased use of bio-gas and a solar farm, are being considered for powering the Wastewater Treatment Plant.
As climate shifts and environmental conditions change, we will also have to safeguard our water sources to maintain affordable and equitable access. The Hillsborough River is the primary source for drinking water in Tampa. Currently, the City withdraws approximately 80.1 million gallons of water from the reservoir each day.29 The City’s permit allows for 82 million gallons per day. Increased growth, potential drought, and saltwater intrusion are all factors that can increasingly strain our water system.
The Water Department has issued a $10 million project request for proposals (RFP) to develop solar and hydro-electric energy production.
THE CITY OF TAMPA POTABLE WATER SYSTEM
WW1
Reduce Energy Use in Water Facility Operations
In 2019, Water and Wastewater Treatment Plants were the leading electricity consumers across all City departments, with 112,841,126 kilowatt hours consumed that year.30 The plants operate heavy machinery and require substantial amounts of energy to operate. This points to a significant area of opportunity. Many of the processes used for treatment and cleaning water could be considered for energy reduction potential, as could efficiencies and opportunities such as power generation at the Wastewater Plant, or implementation of innovative technologies.
Other efficiencies can be gained in collection and distribution systems. For example, the sewer system, which is piped and pumped throughout the city, has to process up to 25% more water during wet weather because rain and ground water seeps into old pipes that leak. The additional water from the leaks combines with the wastewater that is sent to the Howard F. Curren Advanced Wastewater Treatment Plant. Replacing or rehabilitating piping on both public and private lands can help to alleviate these inefficiencies and decrease energy use at the facility, while helping to upgrade sewer pipes for homeowners.
Other efficiencies can be found in the potable water system. Decreasing water use on our lawns, for example, and minimizing leakages in our homes and businesses also lessens the demand for pumping and processing at potable water plants. Of the millions of gallons of drinking water that is produced every day, 20%, or approximately 16 million, are used for irrigation. An additional 6 million gallons of irrigation water is provided to residents by the City’s Howard F. Curren wastewater processing plant, which supplies processed and treated reclaimed water to specific areas within the city.
WW 1.1 RETROFIT EXISTING FACILITIES AND SYSTEMS
Many of the legacy components of Water and Wastewater facilities are aging and less efficient than newer models. Retrofits and upgrades will go a long way toward reducing overall energy demand. Updating can also help to mitigate risk to flooding.
W1.1.1 Use a carbon footprint and energy efficiency lens to evaluate facility performance. Identify retrofit opportunities that incorporate these criteria for return-on-investment metrics, considering expenditures required to meet municipal energy-use goals. Incorporate this perspective in any future master planning efforts. MITIGATE STUDY
W1.1.2 Invest in advanced metering infrastructure, which can provide consumers important real-time information about potential leaks. This saves the consumer money and decreases the City’s need to process thousands of gallons per year. MITIGATE PROJECT
W1.1.3 Evaluate pump stations for renovation upgrades that would save energy. MITIGATE STUDY
W1.1.4 Establish submeters for individual process components and insert data into Energy Star Portfolio Manager. MITIGATE PROJECT
W1.1.5 Partner with regional universities to research and evaluate new processes and technologies that could substantially reduce HFC AWTP energy user. MITIGATE STUDY
W1.1.6 Investigate alternatives for the recovery and reuse of treatment process residuals. MITIGATE STUDY
Near-term projects
Water Department
Refurbish clear wells at the high service pump station, to enable 100% use of volume with less on and off switching, creating energy efficiency
Install new variable frequency drives to reduce energy use
Centralize operations to create more efficient system management and energy efficiency
Chemical system improvements, including on-site generation of water cleansing chemicals, creating chlorine from salt, to decrease reliance on chlorine delivered by rail. This will minimize transportation energy and decreasing the potential for delay in times of emergency, or opportunities for pollution
Ozone system improvements to decrease energy use in an energy intensive system. This will also create resilience during hazardous events when liquid oxygen may become scarce
Modernize 100-year-old filters
Component replacement for valve dissipation, which functions better and is more efficient
Wastewater Department
Pumping station rehabilitation at Bayshore Boulevard, Ballast Point, Prescott Street, and Rome Avenue to mitigate risk from flooding events.
Howard F. Curren Wastewater Treatment Plan Main Pumping Station rehabilitation, including upgrades to electrical systems and installation of submersible pumps, to maintain function during flooding
Sewer pipe lining to reduce infiltration during wet weather periods
WW 1.2 REPLACE LEGACY PIPES
In the Wastewater Department, the energy associated with inflow and infiltration (I&I) increases costs for the City by an average of 6-10%. With over 60% of the City’s collection system more than 50 years old, it is time to begin work on modernizing this infrastructure, on both public and private properties. The Wastewater Department continually inspects pipelines in the right-of-way using CCTV. The condition of pipes is scored, and this information can be used to prioritize replacement. This work will be coordinated with other departments, such as the Mobility and the Water Departments, so that these efforts can be integrated with other ongoing projects.
W1.2.1 Explore a new program to repair and replace private service laterals, potentially using grant funding. This program could significantly reduce leaks from deteriorated service laterals, which are considered one of the primary sources of the peak rates of inflow, and the related impacts of peak flows on pumping and treatment operations – primarily the peak power demands.
MITIGATEPROJECT
W1.2.2 Mandate on-site wastewater plumbing meet code for substantial improvement on private property, including sewer laterals. This can be supplemented by the City of Tampa Owner-Occupied program, which provides grants to homeowners to upgrade infrastructure.
MITIGATE POLICY
WW 1.3 USE RENEWABLE ENERGY SOURCES AT WATER AND WASTEWATER FACILITIES
Supplying clean and renewable energy to our water and wastewater processes will help us to address the emission sources of the City's municipal operations, surpassing the reductions that we are able to accomplish by sourcing energy through TECO.
W1.3.1 Install solar at Water Department facilities, with a target of 50% energy being produced through renewable energy sources.
W1.3.2 Develop small-use hydro power at the dam.
W1.3.3 Commit to use of bio-gas generated as an alternate energy source, considering environmental benefits and the potential to create jobs.
W1.3.4 Conduct a study to determine the vulnerability of solar panels to on-site atmospheric chemicals, such as H2S, at the Wastewater Treatment Plant.
W1.3.5 Provide clean and renewable energy or offsets for power at the Howard F. Curren Advanced Wastewater Treatment Plant.
The HFC AWTP uses an anaerobic digestion process to decompose and stabilize organic solids, which result from the wastewater treatment processes. Anaerobic digestion produces bio-gas – which is largely methane. The bio-gas is mostly “flared off”, that is burned, resulting in uncontrolled CO2 discharge.
Bio-gas is a poor-quality alternative fuel which, if judged by the economic use of fuel, typically leads to a decision that it is more economic to flare the bio-gas instead of using it. If the performance criterion is one of least CO2 emission rather than lowest cost, then use of the bio-gas, instead of increased natural gas use, could be justified.
MOVING WASTEWATER THROUGH THE SYSTEM
All of the City of Tampa’s wastewater passes through the Howard F. Curren facility, near the Port. This includes material delivered from North Tampa, South Tampa, and everywhere in between. Since Tampa generally has a flat terrain, sewer water is collected by pipes and pumped through the system. This requires intense energy use and is a major factor in the City’s energy budget.
Protect Water Resources
Water resources are becoming increasingly stressed by development and climate change. The supply is not limitless, and the water that we had previously accounted for is being altered by saltwater intrusion. Our water resources also have a critical impact on our natural environment, supporting ecosystems that help to define our region.
At this moment, the City will have to consider new and innovative solutions to ensure the availability of safe and clean drinking water for all, and that this future is equitable. It is also important to remember that water is not only located and stored in lakes, rivers and wetlands. When it rains, water is collected by trees and its movement is slowed by vegetation. In Florida, in our flat and porous landscape environment, water infiltrates into soils and migrates below the surface. The natural environment holds, cleans, and also recharges ground water. We need to let the water in, and allow it to slowly move toward its destination, while keeping in mind how infrastructure, including our transportation system, impacts this system by creating impervious surfaces through roadways and parking lots.
WW 2.1 PROTECT GROUNDWATER RESOURCES
The Tampa hydrological system conducts much of its flow subsurface. Our soils are very porous and sandy, with a geology that resembles a block of swiss cheese, or the sponge on your kitchen counter. Its nooks and crannies fill with water, which migrates toward our major rivers and the Bay. It is important to protect these resources to conserve water resources for the future and to maintain healthy ecosystems, which regulate environmental change.
W2.1.1 Study and address the impacts of saltwater intrusion and groundwater rise.
ADAPTSTUDY
WW 2.2 SAFEGUARD UTILITIES FROM FLOODING
As hazards increase with climate change, the infrastructure of water resource delivery will be increasingly tested. Securing this infrastructure will safeguard basic human needs during difficult times.
W2.2.1 Ensure sufficient backup power exists at facilities.
MITIGATE PROJECT
W2.2.2 Install submersible pumps at the Wastewater Treatment Plant.
MITIGATEADAPTPROJECT
W2.2.3 Conduct vulnerability assessments to understand flooding and future conditions at critical facilities.
ADAPTSTUDY
W2.2.4 Resolve stormwater issues where wastewater pump stations are vulnerable to flooding or sea level rise.
ADAPT PROJECT
WW 2.3 UTILIZE RECLAIMED WATER
Reclaimed water from the Wastewater Treatment Plant can augment the use of potable water and can beneficially support various regional water needs. This is the purpose of the current PURE program, which is undertaking a rigorous investigation to identify the best purposes for post-processed water from the Howard F. Curren Advanced Wastewater Treatment Plant.
2.3.1 Explore water reuse opportunities.
WW 2.4 TRACK WATER USAGE OVER TIME
Maintaining a water audit will help us to understand opportunities for improvement and will provide a benchmark for measuring water usage goals.
2.4.1 Record and publish water usage data on the City’s website.
STORMWATER
The Stormwater Department and the regional Southwest Florida Water Management District are responsible for water conveyance through the landscape. This involves a system of pipes and ponds but also various types of landscape. Wet environments, like wetlands, are some of our region’s most biodiverse habitats and are important for stabilizing environmental change. It will be critical to integrate, rather than separate, these landscapes so that they may proliferate in our urban environment. This will require coordination between different disciplines and City departments, a challenge to be confronted in the near term. Funding strategies will also have to change so that projects have multiple benefits and make efficient use of community space.
Stormwater also impacts the health of our primary water bodies. Pollution and other nutrients are carried from urban and agricultural areas through the system, which can affect habitats and marine life. Increased flows and shoreline design play an important role in erosion and coastal stabilization, which will be important to address for our coastal communities. At the coast, flooding risks are expected to increase, due to higher high tides and increased groundwater levels. This will test our stormwater system’s capacity and may change the habitat and other environmental conditions.
At the coast, flooding risks are expected to increase, due to higher high tides and increased groundwater levels.
SW1
Manage Stormwater for Healthy Environments and Multi-Beneficial Use
Stormwater management is a critical function for keeping our communities safe, especially when considering climate change. However, we also need to recognize that stormwater elements take up space and impact residents’ daily lives, including birds and other animals that live among us.
SW 1.1
PROMOTE SPATIAL AND URBAN SOLUTIONS FOR FLOODING PROBLEMS
To maximize the efficiency of urban space, we need to create multi-benefit spaces that protect communities from the impacts of flooding but also promote habitat, carbon absorption, shade, and community and recreational uses.
This endeavor will require new approaches to project management and funding. Traditional separations, especially between the Stormwater Department and the Parks and Recreation Department, will have to be resolved. Also, stormwater will have to be integrated into planning processes. Rather than resolving problems in an area, our focus will be on taking a holistic place-based approach.
SW 1.1.1 Coordinate opportunities for green infrastructure in the project planning phase across City departments, prior to establishing capital improvement projects. Coordinate urban infrastructure projects by area, allowing for layered and multi-benefit solutions.
SW 1.1.2 Foster additional collaboration between the Stormwater Department and the Parks and Recreation Department, including the alignment of project budgets and maintenance for some projects.
SW 1.1.3 Build resources for landscape management within the Parks and Recreation Department.
SW 1.1.4 Build a pilot stormwater management demonstration project at a city park.
LEVERAGING GREEN INFRASTRUCTURE
The majority of the urban landscape is made up of impervious surfaces, which, rather than allowing stormwater to percolate into the ground, result in runoff that has collected pollutants and is deposited, unfiltered, into a local water body.
Green infrastructure utilizes vegetation, soils and landscaping to reintroduce a pervious surface to help absorb and filter pollutants, therefore discharging cleaner water into nearby water bodies.
SW 1.2 CONDUCT A COMPREHENSIVE STUDY OF URBAN STORMWATER AND LEVERAGE DATA/FINDINGS FOR EQUITABLE DECISION MAKING
An urban stormwater study will identify areas where the natural hydrologic system has been significantly impacted by development. The City will use this analysis to evaluate opportunities for surface drainage solutions.
SW 1.2.1 Initiate conversations with the communities most vulnerable to sea level rise and develop planning strategies.
SW 1.2.2 Develop a citywide stormwater masterplan, followed by prioritization of projects that address flooding, with an equity lens.
SW 1.2.3 Conduct a Hillsborough River tributary analysis, with an emphasis on channelized and piped waterways.
SW 1.2.4 Conduct a study of repetitive loss properties and identify opportunity areas where property acquisition benefits both the property owner and resilience interests. Consider properties that may be vulnerable in the future and generate an expected cost scenario, or multiple scenarios.
REPETITIVE LOSS ZONES A “repetitive loss” property includes any building for which two or more claims of more than $1,000 were paid by the National Flood Insurance Program (NFIP) within a 10-year period. Repetitive loss is an indicator of flooding issues in an area.
SW2
Consider Future Conditions in Developing Plans, Projects, and Policies
Stormwater systems are often engineered to meet specific criteria, with an understanding of typical water quantities entering the system. In recognizing that these criteria are becoming dynamic, projects and planning of stormwater management will need to be forward-looking and dynamic as well, building resilient infrastructure that will meet future community needs.
SW 2.1 INCORPORATE CLIMATE CHANGE AND SEA LEVEL RISE IN STORMWATER AND WATERSHED PLANNING DOCUMENTS
To ensure the longevity and sustainability of our capital improvement projects, projects will be devised to address forward-looking conditions. Additionally, managing upslope conditions will help to reduce flooding closer to the coast as sea levels rise. Increased groundwater elevations will decrease storage volumes. We will have to adapt the functionality of our stormwater and drainage system.
SW 2.1.1 Establish future conditions scenarios for use in the City of Tampa Stormwater Manual.
SW 2.1.2 Create a future conditions groundwater map to be used for planning and permitting.
SW 2.1.3 Differentiate areas of the city and apply unique codes for areas susceptible to sea level rise.
SW 2.1.4 Increase requirements for upland water storage at the lot level for both commercial and residential scenarios.
SW 2.1.5 Consider future rainfall projections when establishing stormwater standards.
TAMPA – SEA LEVEL RISE, 2100 INTERMEDIATE/2060 HIGH SCENARIO
Image: From City of Tampa, Regulatory Approach to Sea Level Rise, 2021c.
BROWARD COUNTY – FUTURE CONDITIONS AVERAGE WET SEASON GROUNDWATER ELEVATION MAP
With a foot of rise in some wells over the last 20 years, Broward County decided to create a forward looking groundwater map so that development will account for projected conditions. The map is used for permitting and planning, and provides for appropriate design of stormwater management systems, and enables correct identification of (future) wet or dry retention areas. This will ensure proper functioning of the stormwater management system for on-site water storage.
Image: Broward County. (2017). Broward County Future Conditions Average Wet Season Groundwater Elevation Map.
NEW YORK – EXPANDING THE AREA FOR INCREASED BUILDING AND INFRASTRUCTURE HARDENING
The City of New York has adopted a policy that would extend coastal building criteria to areas further inland. For example, the building code associated with floods has been expanded to .02% floods, which allows residents to adhere to standards associated with closer proximity to flooding within a 10-year period. Repetitive loss is an indicator of flooding issues in an area.
Image: New York City Planning. (2021). Zoning for Coastal Flood Resiliency.
SAN FRANCISCO – SEA LEVEL RISE VULNERABILITY MAPS
San Francisco has established a “Sea Level Rise Vulnerability Zone,” which is used for planning and public outreach. The delineated zone is used for their City’s Vulnerability Assessment and shows the combined event of a 100-year flood and the 2100 high sea level rise scenario. The map is also shown on their website and on interactive maps. This allows the community to understand their relationship to potential vulnerabilities and to make educated decisions about property purchases and future land use.
Image: City and County of San Francisco. (2019). Sea Level Rise Vulnerability and Consequences Assessment Executive Summary; and City and County of San Francisco. (2022). City and County of San Francisco Bayview South / Hunters Point Ground Elevations in Feed-NAVD88.
CLIMATE ACTION AND EQUITY PLAN
TLU TRANSPORTATION AND LAND USE
Vehicular travel is one of the top two producers of citywide greenhouse gas emissions in Tampa. Not only is transportation an issue associated with climate change, but it also affects residents’ health and safety. The City has recently completed its Vision Zero Action Plan to address pedestrian deaths and injuries. The initiatives outlined below aim to complement that Plan and provide pathways for reducing automobile use, thereby addressing associated greenhouse gas and safety concerns.
Transportation has been a priority for Mayor Castor since taking office, with the focus area serving as one of the five pillars of her T3 Initiative. In 2019, the Mayor’s Transportation Advisory Team developed five citywide actions:31
Five citywide transportation actions developed by the Mayor’s Transportation Advisory Team
Action Number
1
2
3
4
5
Description
Implement strategic transit projects*
Focus on trails and greenways as transportation options
Adopt Vision Zero as a citywide policy
Reinvent urban parking and mobility
Enhance neighborhood engagement
* This includes modernizing and expanding the streetcar service, leveraging CSX rail lines, connecting Westshore, Downtown, and USF, expanding HART bus service, establishing key intermodal centers, and connecting Tampa to Orlando.
Each of these initiatives is also reiterated by this Climate Action and Equity Plan.
TLU1
Reduce Vehicle Miles Traveled (VMTs)
Tracking the City’s progress toward transportation goals is paramount to defining and motivating success towards reducing emissions and achieving related transportation benefits. By gaining a clear picture of how much vehicular travel there is in the City, we can help to identify hotspots as well as areas for project opportunities.
Besides data tracking, we must strengthen our approach in considering mobility as an ecosystem, which includes cars, bikes, buses, and trains but also includes the associated effects of block structure, density, parking requirements, and overall comfort. The City will focus on creating walkable and bikeable environments. This includes making sure that there is a continuous shade canopy along sidewalks and shade at bus stops, and that buses run frequently and are on time. We must also consider affordability as well as the density and activity of the City, so that trips can be shortened, are more engaging, and provide more equitable access for the Tampa community while addressing causes of climate change.
CITY-WIDE GHG EMISSIONS (2009 VS. 2019)
Source: City of Tampa. (2021). “Greenhouse Gas Inventory.”
TLU 1.1
TRACK AND MONITOR PROGRESS TOWARDS REDUCING VEHICULAR USE
Measuring progress can only be accomplished if data is collected and archived. This is the first step in keeping ourselves accountable and is essential for tracking our successes and identifying how we can improve.
TLU 1.1.1 Inventory vehicle miles traveled (VMTs) in the city and set realistic targets for VMT reduction.
MITIGATE STUDY
The carbon footprint of an automobilie-based system is much larger than other forms of transportation. Not only are tires worn and roads construct-ed, but they take up space and need infrastructure such as parking lots and gas or electrification stations. In the City of Tampa, the average house-hold spends 18.2% of their budget on transportation, equating to $11,077 per year. Ninety-six percent of that is spent on buying and maintaining private vehicles. Source: U.S. Bureau of Labor Statistics; PVT Group. SPACE THAT 200 PEOPLE OCCUPY BY MODE OF TRANSPORTATION AVERAGE OF 1.5 PEOPLE IN 133 PRIVATE CARS (3,379 FT) 20 PASSENGERS IN 10 BUSES (533 FT) 40 PASSENGERS IN 5 TRAMS (749 FT) 200 CYCLISTS (451 FT) 200 PEDESTRIANS (95 FT) HOW MUCH ROAD SPACE DOES IT TAKE TO TRAVEL?
TLU 1.2 CREATE SAFER, MORE COMFORTABLE STREETS, TRAILS, AND PEDESTRIAN-SCALED MOBILITY ENVIRONMENTS
Tampa began as a streetcar town but grew in the 60s and 70s when automobiles dominated. Our resulting urban environment defers to automobile use. Building on what has been accomplished by the Vision Zero Plan, the City will work to transform city streets into a safe and comfortable community fabric oriented more around pedestrians as opposed to cars.
TLU 1.2.1 Ensure policies do not unnecessarily prioritize vehicle-centric infrastructure. MITIGATE ENGAGE POLICY
TLU 1.2.2 Quickly expand dedicated, protected spaces for bicyclists and pedestrians, using affordable and efficient methods. MITIGATE ENGAGE PROJECT
TLU 1.2.3 Provide tree canopy or other shading within the pedestrian mobility network. MITIGATE ENGAGE PROJECT
TLU 1.2.4 Begin an intense tree planting effort along trails. MITIGATE ENGAGE PROJECT
TLU 1.2.5 Coordinate with HART to ensure sufficient shade at bus shelters. MITIGATE ENGAGE STUDY
TLU 1.2.6 Integrate tree planting into new mobility projects. MITIGATE ENGAGE POLICY
TLU 1.2.7 During all major roadway projects, place utility wires underground or install underground conduit to facilitate future underground service (to create opportunities for shade trees). MITIGATE ENGAGE POLICY
TLU 1.2.8 Create a standards ordinance to establish minimum criteria for the integration of complete streets in capital improvement projects. MITIGATE ENGAGE POLICY
TLU 1.2.9 Beginning with a pilot effort in Sulphur Springs, test and expand upon initiatives to connect multiple modes of safe transportation. MITIGATE ENGAGE PROJECT
TLU 1.2.10 Allocate sufficient resources in mobility projects to manage long-term maintenance of project-associated trees. MITIGATE ADMINISTRATIVE
If just one driver per household switched to taking public transportation for a daily commute of 10 miles each way, this would save 4,627 pounds of carbon dioxide per household per year— equivalent to an 8.1% reduction in the annual carbon footprint of a typical American household.
In 1993, on average, each person accounted for 21 miles of driving per day in urbanized areas. By 2017, that number increased to 25 miles per day. Every year, Americans are having to drive farther just to accomplish the same things we did back in 1993 every day.
TRANSPORTATION FOR AMERICA, 2022
U.S. DEPARTMENT OF TRANSPORTATION, FEDERAL TRANSIT ADMINISTRATION (2010)
TLU 1.3
ESTABLISH LAND USE POLICIES TO INDUCE ALTERNATIVE MOBILITY CHOICES
Cities with population density can deliver more goods and services in closer proximity, eliminating the need to drive. As Tampa grows from nearly 400,000 residents to an anticipated 500,000 by the year 2045, there is an opportunity to grow while promoting a more compact footprint. Currently there are approximately 5.5 residents per acre, while an ideal range is 8-16.32 The City of Tampa will work to absorb increased population within City boundaries, promoting smaller residence sizes such as accessory dwelling units and increased density buildings. Creating an urban form that is more reliant on pedestrian mobility, rather than vehicular, will help the City to decrease its GHG emissions.
TLU 1.3.1 Implement the Transit Oriented Development/Mixed-Use Corridor zoning and land use recommendations from City Planning studies.
TLU 1.3.2 Expand the Neighborhood Commercial District Plan program.
TLU 1.3.3 Change land use code and zoning to promote the 10-minute neighborhood concept. Aim for 8-16 residents per acre on average.
TLU 1.3.4 Identify high density locations in the City’s future land use plan and prioritize regional and multi-modal transit accommodation in proximity.
TLU 1.3.5 Prioritize public CIP funding in neighborhoods with density.
TLU 1.3.6 Follow the Vision Zero Action Plan, including the creation of a Safe Routes to Places program.
32 Litman, T. (2016). "Determining Optimal Urban Expansion, Population and Vehicle Density, and Housing Types for Rapidly Growing Cities."
PARKING REQUIREMENTS
A surface parking space typically costs $5,000$10,000 per space. Structured parking costs between $25,000-$50,000.
In a 100-unit development, containing 2 and 3 bedroom homes, approximately 175 parking spaces would be required under existing code, which would cost up to $8.75 million dollars if accommodated with a parking garage. At ground level, 175 spaces would take up approximately 1.3 acres of land if only used for parking.
In Tampa, automobiles are a primary source of greenhouse gases, almost accounting for 50%.
Parking takes up approximately 1/3 of urban land area in the United States. By taking up this space, parking affects walkability and motivates automobile use.
Parking minimums make traditional urban land use like what is found in Ybor City or along Florida Avenue impossible to accomplish and dramatically increases the cost of new multi-unit development, making affordable housing with access to local amenities very difficult to construct.
In 2017, Buffalo became the first US city to stop requiring development projects to include a minimum amount of parking. More recently, in March of 2022, the City of Raleigh voted 7-1 to eliminate parking mandates citywide and will establish parking maximums on many uses. Other cities to relinquish parking mandates include Santa Monica, Hartford, Fayetteville, Branson, and San Francisco.
Images: Rural to Urban transect and Household Transport Carbon in metric tons of CO2 per household per year.
TLU 1.4 WORK WITH REGIONAL TRANSIT AGENCIES TO INCREASE MOBILITY OPTIONS
Current transit options are defined by the Hillsborough Area Regional Transit (HART) Authority, in association with the Hillsborough Transportation Planning Organization (TPO) and, in some situations, the Tampa Bay Area Regional Transit Authority (TBARTA), the Pinellas Suncoast Transit Authority (PSTA), and other Pinellas County agencies. A private company has been developing a regional rail system on the east coast, called the Brightline. Tampa has been in the news as the next logical link.
TLU 1.4.1 Establish transit and other mobility plans in a formalized document. Connect land use to transportation.
TLU 1.4.2 Modernize and expand the streetcar system.
TLU 1.4.3 Support regional transit connections such as the Brightline.
TLU 1.4.4 Ensure transit affordability. Explore potential options, such as free or reduced rates for specific corridors.
TLU2
Ensuring Safe and Equitable Opportunities for Evacuation During Hazardous Weather Events
Hazardous weather such as a major hurricane is most dangerous for those who cannot evacuate. Past studies of community vulnerabilities in Tampa, as well as recent stakeholder engagement, suggested that this poses a significant risk for the region.33 Low-income Tampanians, particularly those who do not own a car, and those who are unfamiliar with the emergency management system, are most at risk. With the prediction of more frequent and more intense storms as a result of climate change, these hazards are only expected to increase.
TLU 2.1
STUDY THE EVACUATION SYSTEM AND CREATE A NETWORK OF LOCAL COMMUNITY FACILITIES AND LIFELINES
People are more inclined to use a system that they are familiar with and feel safe using. Localizing the evacuation system network will help to establish clear and equitable pathways for sheltering during hazardous weather events.
TLU 2.1.1 Create a diverse and local scale system of sheltering facilities through integrated projects, such as resilience hubs, at locations that are familiar to the community.
MITIGATE ADAPT ENGAGE PROJECT
WASTE MANAGEMENT
The Solid Waste Department provides service to 90,000 customers and processes roughly 360,000 tons of municipal solid waste (MSW) and recycling annually. Residential trash collection is comprised of 50% compostables, 20% recyclables, and only 30% trash. Except for recycling and yard waste collection, all MSW is captured as refuse for energy generation. Recent weight-based studies show the city's recycling comprises 2.5% of total materials collected and processed (2019), down from 4.5% in 2009, and only a fraction of materials are composted.34 In comparison, a city like Charlotte recycles and composts 11.5% of their waste.35
Collecting and processing MSW accounts for 2.5% of citywide greenhouse gas production, which is a sizable amount as a single departmental source. MSW in in the department's solid waste jurisdiction is brought to the McKay Bay Waste Management Resource Facility, where materials are taken to the Waste to Energy Plant (WTE) or the Transfer Station, dependent on their classification. All class I MSW is processed at WTE for energy recovery, generating electricity. A smaller percentage of MSW is taken off site to Hillsborough County's Southeast Landfill, 20 miles outside of the city limits. During necessary maintenance of the WTE, MSW is diverted to the southeast county landfill. Recycling is taken directly to the contracted processing facility, unless the load has surpassed the allowed contamination rate resulting in diversion to the WTE, where it is used for energy production.
The WTE generates revenue as well as electricity. Most of the energy created (20 out of 21.1 MW capacity) is committed to the Seminole Electric Cooperative through 2026. The remainder is used internally to power the facility. Looking forward, it is important to prioritize projects that preserve and expand the WTE's capabilities while making the most of the energy it produces.
The McKay Bay Waste Management Resource Facility is situated on the historic McKay Bay peninsula on the coastline, surrounded by low-lying landscapes. As its locations means that it is affected by hurricanes every year, access to the facility may become an issue. Increased MSW typically occurs with natural disasters such as hurricanes and can increase the workload and tonnage processed at the facility, exceeding capacity. As flooding, sea level rise, and continued hurricane threats become more of an issue, mitigation of these problems will need to be addressed.
34 City of Tampa. (2021). “Greenhouse Gas Inventory; 35 City of Charlotte. (2018). “Circular Charlotte: Towards a zero waste and inclusive city.”
Waste-to-energy process
Drawing adapted from Deltaway Energy, Waste to Energy: How it Works. deltawayenergy.com.
The McKay Bay Waste to Energy (WTE) facility is able to process up to 1,000 tons of garbage each day, and sometimes receives more. This waste is incinerated to produce steam, which runs through a turbine to create energy. At the Tampa facility this equates to 22.5 megawatts, enough to power 15,000 homes per month.
Municipal solid waste that enters the plant is placed on the tipping floor, where two cranes stack the material, preparing it to be pushed down chutes to the four combustion and boiler chambers. The waste is burned and the heat energy is transferred to steam through a boiler, which pushes a 22.5-megawatt turbine generator. Treated wastewater from the nearby treatment plant is used to cool the turbine generator condenser and the rest of the plant.
Waste materials can be categorized as biomass, or biogenic, which includes paper, cardboard, food waste, grass clippings, leaves, wood, and leather products. Non-biomass combustible materials include plastics and other synthetic materials made from petroleum. Noncombustible materials include glass and metals.
In Tampa, the average biogenic CO2 value from the 2022 reporting to EPA was 59%; 41% were non biogenic. Therefore, energy from the plant has a lower carbon intensity than that produced through fossil fuel-based power plant. To establish a carbon neutral rating, the City would have to offset the 41% of their non-biomass and non-combustible waste with offsets.
Enhance Waste Stream Management
In the City of Tampa, most waste is sent to the Waste to Energy (WTE) facility where it is incinerated. The outputs of this process are energy, bottom/fly ash, and recycled metals. The facility, however, has capacity limitations and there is not room for major expansion. To prepare for the future, the City will need to manage its waste stream to mitigate the need for waste storage at the landfill. When used, the landfill costs the City about twice as much per ton and creates more greenhouse gases. The landfill is also used when recycling loads are contaminated. This is often a problem, with 47% of material put in the bin for recycling not able to be processed.
WM 1.1
CREATE PARTNERSHIPS TO REDUCE TOTAL MUNICIPAL SOLID WASTE (MSW) THAT GOES TO THE LANDFILL
One way to ensure capacity is not overwhelmed at the WTE is to limit the amount of organic waste that is delivered. The EPA estimated that 33.8 million tons of food waste were generated in the U.S., which accounts for 14.1% of total municipal solid waste. One option is to prevent food waste from reaching the WTE, and by treating it similarly to bio-solids (human waste) using anaerobic digestion (AD). Anaerobic digestion can be used to micro-bially degrade food, resulting in the production of bio-gas. In this process, methane is converted to electricity. The other biproduct – digestate – can be used as fertilizer. Residential composting is another way to keep organics out of the waste stream. This can be accomplished individually or communally, for example at a community garden facility.
WM 1.1.1 Consider an anaerobic digestion partnership with the Wastewater Department. MITIGATESTUDY
WM 1.1.2 Explore the potential to combine organic products, such as residential yard waste, with compostable products through an aerated static pile composting operation. MITIGATESTUDY
WM 1.1.3 Support companies that are helping to eliminate single use products. MITIGATE POLICY
WM 1.2 EDUCATE THE PUBLIC ABOUT WASTE STREAM MANAGEMENT
Recycling rates have dropped to a recent low and composting has not been established as a common habit. Prioritizing the public’s knowledge of waste stream management will go a long way toward reducing greenhouse gas emissions. Solid waste operations are responsible for the most greenhouse gas emissions of any City of Tampa department.
WM 1.2.1 Increase educational efforts and programs to grow citywide composting and recycling.
Upgrade Facilities and Transition to New Technologies
Municipal solid waste accounted for 138,317 metric tons of carbon dioxide equivalents (mtCO2e) in 2019, responsible for 59.1% of greenhouse gas (GHG) emissions under the City’s purview. Most all of this is from garbage processed at the Waste to Energy (WTE) facility – 118,568 mtCO2e, with 19,749 mtCO2e associated with landfill-diverted waste. The McKay Bay Waste-to-Energy facility meets all EPA standards for clean air and water quality; however it produces a sizable amount of Scope 1 GHG emissions, meaning that they are directly under the control of City of Tampa operations. The City will explore the following options to create efficiencies, increase reliability, and expand capacity of the Waste to Energy Plant. Other technologies can be applied to the vehicle fleet for power and for creating operational efficiencies.
WM 2.1 INVEST IN UPGRADES TO FACILITIES, SERVICES, AND EQUIPMENT
Especially at the Waste to Energy Plant, a focus on increasing performance will help to increase capacity, produce more energy, and be more efficient.
WM 2.1.1 Partner with academic, governmental, and non-governmental organizations to research the feasibility of implementing a carbon sequestration pilot project.
WM 2.1.2 Explore options for new infrastructure such as a mixed waste facility or an industrial compost site.
WM 2.1.3 Implement new boiler technologies to create more efficient combustion.
In industrial settings, carbon sequestration can be used to capture greenhouse gases at the point of emissions. The technology must be used cautiously when paired with oil and gas extraction as not to be used to further unnecessary reliance on fossil fuels. In a waste-to-energy setting, where carbon emissions are controlled and tied to long-term investment solid waste projects paired with on-site energy generation, a carbon sequestration pilot could reduce emissions not directly tied to fossil fuel extraction.
WM 2.1.4 Renovate or repair facility components such as main and auxiliary transformer replacement, ash building replacement, refuse crane replacement, turbine generator overhaul and stack repairs.
WM 2.1.5 Expand collection of yard and organic waste.
WM 2.2 REDUCE WASTE MANAGEMENT FLEET EMISSIONS
The department collection service drives approximately 688,000 miles. This represents a significant portion of the vehicle use for the City. Continuing to expand use of alternative fuel types, such as usage of CNG and potential electric vehicles, and creating efficiencies in routing are opportunities to lower overall greenhouse gas emissions.
WM 2.2.1 Use data management to maximize route efficiencies.
MITIGATE STUDY
GOVERNMENT GREENHOUSE GAS EMISSIONS BY CATEGORY (2019)
Ł
Address Operational Challenges Related to Storms and Sea Level Rise
Storms and other adverse weather can cause major challenges for the Department of Solid Waste and Environmental Program Management. Water contamination of collected recyclables by storms causes rejected loads at the recycling processor and creates a less efficient mix of materials for WTE. Dramatic increases of waste can also come from flood-damaged homes, overwhelming the system, and requiring diversion to the county's landfill – all while the location of the facility may be at risk of flooding or damage from a weather event or future sea level rise.
WM 3.1 ENSURE ACCESS TO THE MCKAY BAY FACILITY, NOW AND IN THE FUTURE
The primary collection and sorting facilities are located near the coast on a peninsula. Land has been raised in this area but access in and out of the facility could potentially be impeded by contextual roadway flooding.
WM 3.1.1 Conduct a vulnerability assessment and implement necessary upgrades, including evaluating the main building at the WTE facility for hurricane rating resilience.
WM 3.2 MANAGE SERVICE DURING OR AFTER MAJOR STORMS
WM 3.2.1 Refine the process for handling post-storm events, including consideration of heavy debris. This includes arranging contracts before disasters occur. Coordinate this Plan with others in the region.
WM4
Address Environmental Impacts of Waste Management
The landfill and waste-to-energy systems include byproducts that can be harmful to the environment. Reducing and accounting for these byproducts, and finding alternative uses, can create efficiencies and lessen the end-state carbon footprint.
WM 4.1 EXPLORE ALTERNATIVE USES OF ASH
WM 4.1.1 Identify and develop methods for recycling or reusing ash residue or treated ash residue, such as recycling or allowing re-use of ash by others.
WM 4.2 SUPPORT STATEWIDE EXTENDED PRODUCER RESPONSIBILITY (EPR) POLICY
Extended Producer Responsibility (EPR) require producers to pay for a portion of the costs of recycling the materials that they put onto the market. This includes many types of materials that are single use, such as plastics, packaging materials, paper, and food service ware. States use EPR legislation to promote recycling efforts and require producers to develop takeback programs and more sustainable product designs. Several states have existing EPR programs for industries including pharmaceuticals, paint, batteries, and carpet. However, a recent push to expand the concept to include packaging and plastics is gaining traction.
WM 4.2.1 Define a champion to support EPR legislation.
ERP POLICY IN OTHER STATES:
Oregon – SB 582. The bill requires producers to join producer responsibility organizations (PROs) that will charge annual membership fees based on the environmental impacts of the producer’s products. The state will establish a collection list to standardize recycled items across the state and funding will go toward upgrading facilities to meet new performance standards. These facilities will be required to obtain a permit from Oregon’s Department of Environmental Quality (DEQ) to receive recyclable materials from various communities. PROs will also have a responsibility to create accessible educational resources for local governments to use to increase awareness of the state’s recycling initiatives.
Massachusetts – S.610 / H.D. 1553 requires producers of plastics, metal, paper, cartons, and glass to pay recovery costs for products based on a state-implemented system. The system establishes the amount producers are required to pay, which is determined by the net cost of recycling collection and processing costs. Retailers and distributors may not sell, offer for sale, use, or distribute covered materials if the producer of the material is not in compliance with the bill. If a producer, retailer, distributor, or any other responsible party violates any section of the bill, they are subject to fines for each day a violation occurs. There has been no recent development or movement toward having this bill enacted.
New York – S1185A requires producers of packaging and paper products to develop and implement strategies to promote recycling. Also imposes restrictions on particular materials within three years of the bill’s passage unless the producers have an approved state plan with exceptions to those materials. The bill is currently in the senate rules committee.
MCKAY BAY WASTE TO ENERGY FACILITY The McKay Bay Waste to Energy facility is one of only two in the country that is owned and operated by the municipality that it serves. This provides a unique opportunity for the City to generate its own energy through the waste that it receives, and to claim the renewable energy credits (RECs) that are associated with its operation.
HD HOUSING AND DEVELOPMENT
Climate change will affect the way we build, especially along the coast. This will require modifications to policy and a reliance on building codes to keep people safe and promote resilient development. Adaptations will have economic costs, whether they are carried by the City or by private property owners. These costs may also have extended social impacts since not everyone will have the financial resources to adapt, and some communities will be impacted more than others. Working through these policy issues will be a priority for the City, especially within the Coastal High Hazard Area (CHHA). A significant portion of our community lives within this zone. Since 2010, in Tampa, the population living within the CHHA has increased “ by 21.5%. This amounts to 55,672 people (in 2020).36
The City will also consider future conditions when conducting planning and construction. To secure a resilient future, we will have to build toward it. Not only is there a need to reduce greenhouse gas emissions; with sea levels expected to increase by 10 to 12 inches by 2050, with similar effects on groundwater, we will also need to adapt our housing and development patterns.37
Since 2010, in Tampa, the population living within the CHHA increased by 21.5%.
HD1
Ensure Livable Housing in Secure Locations
With evolving environmental dynamics as a result of climate change, we will need to rethink approaches to housing for the many historic communities along our coastline. This will require a comprehensive strategy that considers community needs as well as the infrastructure required to keep them safe. Inland areas will also change and face new climate related risks. To support community resilience we will need to ensure affordable housing exists in places that are protected from hazards and provide continued access to services and amenities.
HD 1.1 INCREASE THE SUPPLY AND AVAILABILITY OF AFFORDABLE RESILIENT HOUSING, WITH A FOCUS ON LESS CLIMATE VULNERABLE AREAS
Promoting equitable development practices is already a primary initiative for Mayor Castor. This Plan seeks to reinforce existing programs while connecting them to issues of climate change, climate gentrification, weatherization, and the maintenance of historic structures.
HD 1.1.1 Continue the Mayor’s affordable housing initiative and the Dare to Own the Dream home ownership program.
HD 1.1.2 Adopt missing middle zoning to provide “gentle density” near transit corridors and in neighborhoods where hi-rise development may not be compatible.
HD 1.1.3 Create an ADU policy for areas outside of the CHHA, increasing the supply of housing in less hazard-prone areas.
HD 1.2 PROVIDE RESOURCES TO THE COMMUNITY TO WEATHERIZE AND FORTIFY EXISTING HOUSING
Recent federal government incentives have provided significant opportunities to help homeowners. There are also many other resources provided by regional non-profit organizations (see Energy section, Initiative 2.2).
HD 1.2.1 Work with community partners to develop home renovation programs. Focus on helping those with less economic capacity that have strong local social networks.
HD 1.2.2 Communicate new state and federal incentives for home improvement related to energy efficiency and storm readiness.
HD2
Develop Specific Policy for Coastal Areas
The coastline will bear the brunt of impacts caused by rising sea levels and stormwater, creating compounding challenges. The City will take a coordinated approach to focus policies and projects towards coastal areas, addressing human vulnerabilities while protecting environmental health and habitats.
HD 2.1
ESTABLISH RESILIENT BUILDING PRACTICES THROUGH POLICY
Florida is known as having one of the most stringent building codes in the country, and research validates the resilience that this provides. Continuing to pursue elevated design criteria will help to prepare structures and homeowners for the intermittent environmental challenges to come.
HD 2.1.2 Ensure strict enforcement of the most current Florida Building Codes through the permitting process.
⊲ HD 2.1.1 Finalize and implement policy recommendation from the Coastal Area Action Plan study. This may include:
Increased design flood elevations
No-fill policy
Shoreline buffers and mitigation
Mitigation trust funds or taxing
Overlay zones for infrastructure planning
Building requirements or variance opportunities
Evacuation policy
HD 2.1.3 Avoid harmful or hazardous uses in the Coastal High Hazard Area (CHHA).
COMMUNITYCOM
The City will work toward a whole-community approach in addressing and protecting Tampanians from the impacts of climate change. FEMA guidelines describe this as an approach that includes:38
FEMA whole-community approach components
A
B
C
Understanding and meeting the actual needs of the whole community
Engaging and empowering all parts of the community
Strengthening what works well in communities on a daily basis
Tampa’s diversity, including the rich character found across our neighborhoods, is our city’s source of strength. Working with this in mind will help to empower local action, build partnerships, and foster relationships between residents and community leaders. Addressing community concerns will require a collaborative approach that centers problem-solving at the neighborhood-level and elevates community leaders. Also, the City will intensify its efforts to engage meaningfully with residents and to incorporate their perspectives, needs, and ideas into climate solutions. From educating youth to creating quality jobs to supporting families, together we can approach climate change as a Tampa collective and work towards creating a more sustainable future.
“Together we can approach climate change as a Tampa collective.”
38 Federal Emergency Management Agency (FEMA). (2011). “A Whole Community Approach to Emergency Management.”
COM1
Establish Local Scale Communication and Engagement
Recognizing that not all neighborhoods or communities are the same and recognizing the importance of elevating community members’ local expertise around needs and opportunities, it is important to identify and support community-driven solutions. The City will work to expand outreach and strengthen its coordination, prioritizing historically underrepresented and marginalized communities. An expanded Community Engagement & Partnerships Department will support these efforts to strengthen relationships with community members.
Establishing clear communication channels can help to address concerns, transmit community issues or vulnerabilities, and elevate local knowledge. Work in this area can inform planning and risk mitigation, and help to find localized project opportunities.
COM 1.1
LEVERAGE COMMUNITY ENGAGEMENT OPPORTUNITIES TO DISCUSS CHALLENGES RELATED TO CLIMATE CHANGE AND SURFACE RESIDENT-DRIVEN SOLUTIONS
COM 1.1.1 Familiarize residents with environmental hazards and response through everyday project outreach activities.
COM 1.1.2 Create a map that triggers specific information delivery, coordinated with outreach opportunities for all projects occurring in the City.
COM 1.1.3 Provide a survey at relevant community events and online, coordinated through community outreach, that identifies vulnerabilities and concerns within a neighborhood. Incorporate understandings from local engagement into the development of the Local Mitigation Strategy (LMS) and the Comprehensive Plan.
COM 1.1.4 Create a culture around climate hazards by initiating equitable and fun forms of community engagement based around extreme weather events.
CASE STUDY EXAMPLE: THE CANON BEACH 5K
To make a frightening issue approachable, Cannon Beach in Oregon reminds community members of the danger that they face from tsunamis, similar to hurricanes in Tampa, by marking it with a fun event. Together, the community runs the evacuation route to a location of safety. The race is hosted annually, helping to embed disaster response activities into their collective memory.
Cannon Beach 5k event. Photo and article by Tom Banse, Northwest News Network. Banse, T. (2014). “Cannon 5k Injects Fun Into Tsunami Readiness.”
COM 1.2
EDUCATE THE COMMUNITY ABOUT CLIMATE CHANGE THROUGH ACCESSIBLE AND CULTURALLY AWARE FORMS OF COMMUNICATION
COM 1.2.1 Expand and promote programs such as Mangrove Marcus that introduce youth to landscape systems through outreach opportunities and programs. MITIGATE ADAPT ENGAGE ADMINISTRATIVE
COM 1.2.2 Create a communication channel designed to inform underserved communities. MITIGATE ADAPT ENGAGE ADMINISTRATIVE
COM 1.2.3 Explain flood insurance and potential liabilities to property owners. MITIGATE ADAPT ENGAGE ADMINISTRATIVE
COM 1.2.4 Create overlay zones that relate to future sea level rise projection. MITIGATE ADAPT ENGAGE POLICY
COM 1.2.5 Create a real estate disclosure policy or property report card using information from the Local Mitigation Strategy process. MITIGATE ADAPT ENGAGE POLICY
COM 1.2.6 Create a climate resilience committee that includes local-level community representatives. MITIGATE ADAPT ENGAGE ADMINISTRATIVE
COM 1.2.7 Expand the Resilient Tampa brand, for example, through Parks and Recreation at youth events. MITIGATE ADAPT ENGAGE ADMINISTRATIVE
Mangrove Marcus is a summer program in Tampa that connects youth to the local environment. Kids and counselors explore fresh and saltwater environments while developing a sense of eco-awareness.
PROJECT OPPORTUNITY: Develop the Martin Luther King, Jr. Recreation Complex as a hub for Mangrove Marcus activities.
Promote Training and Workforce Development Around Climate Change
Despite new challenges, climate change also presents opportunities, including the opportunity to connect Tampanians to high-quality jobs that will be increasingly critical in the future. This work will employ and empower the local community as the City adapts and upgrades infrastructure, and works towards meeting newly established goals: there is a lot of work to be done.
COM 2.1 EXPAND MUNICIPAL GREEN JOBS TRAINING AND OPPORTUNITIES
COM 2.1.1 Develop training programs to prepare Tampanians for quality jobs supporting climate initiatives, such as urban forestry, energy efficiency programs, solar, and maintenance divisions, both mechanical and environmental. This could include jobs such as:
Pump maintenance for bio-gas capture at Howard F. Curren Plant
Expanding the capacity of the Mangrove Marcus program
Increasing the horticultural capacity of the Parks and Recreation Department, including the Forestry division, and maintenance to areas near rivers, wetlands, and native habitats.
MITIGATE ADAPT ENGAGE ADMINISTRATIVE
ARBORIST TECHNICIAN PROGRAM
At Mid-State Technical College in Wisconsin students have the opportunity to be trained as an arborist technician, giving them a direct career path into the profession. There is need to develop similar programs in the Tampa Bay area.
ENV
HABITAT AND ENVIRONMENT
HABITAT, OPEN SPACE, AND CONSTRUCTING HEALTHY ENVIRONMENTS
Tampa’s diverse and productive ecosystems are one of our city’s most treasured assets and have come to define our culture and communities. Climate change will affect the dynamics that support these regional systems, especially along the coast. Hotter temperatures and rising seas will force environments to adapt. These changes will also demand human change, as properties become submerged, stormwater systems no longer function, and shade becomes a prized commodity. Tampanians will have to take on the role of stewards, minimizing detrimental impacts while working to build, “ not just maintain, ecosystem functions.
We will have to give attention to our tree canopy and urban heat islands. Without a canopy, areas become hotter and store heat energy, which is released over long periods of time. This can make nights much warmer or can worsen already hot conditions. Focusing on the city’s tree canopy and heat islands can help to mitigate greenhouse gases while creating more comfortable spaces for people to live, work, and play.
We will have to give attention to our city’s tree canopy and urban heat islands
The need to adapt is already being seen in some coastal areas, for example at Picnic Island, where erosion and sand migration have swallowed waterfront picnic shelters, and at Ben T. Davis Beach, where the shoreline has been compromised. The City of Tampa Parks and Recreation Department will have to consider future impacts such as erosion and habitat migration and work these scenarios into planning and maintenance operations.
ENV1
Conserve and Increase Carbon Sinks, with a Focus on Wetlands and the Hydrologic System
The City can make a difference in the balance of emissions by maintaining carbon capture capacity, either through natural or technological means. Seagrasses, trees, wetlands, soils, and other landscape elements, when healthy, absorb carbon dioxide from the atmosphere, store it, and break it down through their own processes of growth and decay. This is especially important in coastal environments, where the presence of water creates rapid processing cycles, while also adding habitat for other creatures. Current studies show that mangroves and coastal wetlands annually sequester carbon at a rate 10 times greater than mature tropical forests.39 This points to the need to not only protect and conserve, but to construct these environments, rehabilitating habitats that were once lost.
WATERWAY PROJECT POTENTIALS: Lowry Park (shown), Henry Ola Park
ENV 1.1
EXPLORE OPPORTUNITIES TO INTRODUCE NATURE-BASED SOLUTIONS TO THE COASTAL EDGE
Historic development of the coastal edge has brought about the construction of hundreds if not thousands of miles of seawalls. This has had a compounding effect on habitats and the health of submarine environments. We have just recently begun to understand the importance of native shorelines, especially related to their adaptability to sea level rise and proliferation of marine life. The City will take a proactive approach toward evaluating and adapting the coastal edge, especially where owned by the City.
ENV 1.1.1 Create a living shoreline master plan. Include opportunities where there are multiple repetitive loss properties and evaluate for restoration projects.
ENV 1.1.2 Conduct a sea wall and shoreline inventory. Include ownership, material, condition, and elevation on all properties. This can be completed as a unique study, through transfer of real estate, or through permitting services.
ENV 1.1.3 Review and implement a version of the TBRPC living shoreline ordinance. Potentially including district overlays. Incorporate long term strategies of incremental removal of sea walls and establishing living shorelines (on the Hillsborough River and along the coast).
ENV 1.1.4 Require habitat mitigation offset fees for future development of seawalls. MITIGATE ADAPT POLICY
ENV 1.1.5 Establish no-interest loans for conversion of sea wall to living shoreline.
ENV 1.1.6 Coordinate opportunities to use dredge material with the upcoming Army Corps channelization project for the Port.
ENV 1.1.7 Coordinate small pilot projects and monitoring to test resilience applications.
ENV 1.2
ADDRESS WATER QUALITY IN THE HILLSBOROUGH RIVER AND TAMPA BAY
Tampa Bay provides incredible ecosystem benefits for our region. Climate change will alter environmental conditions and put pressure on it. The more we can do to keep it healthy, balanced, and productive for a diverse range of habitats and species, the less it will change in the future. The Reasonable Assurance Plan for Tampa Bay provides background for water quality issues in Tampa Bay and can act as a guide for future action. Similarly, the Hillsborough River BMAP can be used to develop project opportunities specific to the river and its tributaries, which is responsible for a large percentage of water delivery into Tampa Bay. The Tampa Bay Estuary Program also provides excellent guidance through their Habitat Master Plan. This document can help guide conservation efforts within Tampa Bay.
ENV 1.2.1 Work with the Tampa Bay Estuary Program to create a plan that reduces nutrient loads for the benefit of seagrass habitat in Tampa Bay.
ENV 1.2.2 Study the Hillsborough River and its tributaries. Identify and prioritize projects to enhance water quality.
ENV 1.2.3 Address minimum flows in the Hillsborough River.
ENV 1.2.4 Fund water quality initiatives such as street sweeping, collection of oil, spill assistance programs, waste management, and other forms of pollution prevention.
ENV 1.2.5 Examine existing municipal properties and transition landscape plantings away from requiring fertilizer. New plantings on municipal lands near water bodies shall be accomplished in a way that does not require fertilizer.
COASTAL LIVING SHORELINE PROJECT POTENTIALS
The following City parks and properties were identified as potential project sites: Hillsborough River shorelines; Picnic Island Bayou mitigation project with the Port of Tampa; Ben T. Davis Beach; Cypress Point Park; Palmetto Beach Coastline; Bayshore Boulevard; Ballast Point; River Tower; Sulphur Springs; Rowlett Park; Temple Crest.
ENV 1.3
DEVELOP ELEVATED STANDARDS FOR HABITAT CONSERVATION
The regional water system is controlled by multiple entities, primarily the Southwest Florida Water Management District, the Florida Department of Environmental Protection, and the Environmental Protection Commission of Hillsborough County. The City of Tampa also has its own set of regulatory documents. These codes will be reviewed for opportunities to ensure that our local habitats will be conserved for future generations, and to guard against environmental change.
ENV 1.3.1 Increase littoral edge standards in the Stormwater Manual, above SWFWMD requirements.
ENV 1.3.2 Establish a wetland policy to protect critical ecosystems.
Reduce the Urban Heat Island Effect
A primary concern associated with climate change is an increase in global temperatures. These impacts are compounded within cities in heat islands, where a lack of tree canopy and/or infrastructure and expanded pavement surfaces increase the temperature of urban environments. This ambient heat is absorbed by hard surfaces and is emitted slowly, continuing into the night, producing longer durations of higher temperatures. Elevated temperatures can make it more difficult to accomplish tasks such as walking and working outdoors. It is also a significant health risk, particularly for seniors and for those with underlying health conditions.
Establishing and maintaining a healthy tree canopy will not only mitigate increased heat but it can also offer other benefits such as offsetting GHG emissions and intercepting rainfall, which reduces stress on stormwater systems. Historically, the City of Tampa has been recognized for its incredible tree canopy; it was highlighted in an MIT study as the densest urban tree canopy in the world.40 However, preliminary results from the City’s most recent canopy survey suggests a loss of over 3,300 acres in the last 10 years.
The City of Tampa Parks and Recreation department plays a leading role in tree canopy preservation and enhancement. The department’s existing operations oversee tree canopy maintenance, and tree planting is supported by the Tree-Mendous program, which offers free trees to homeowners. However, these programs have had limited capacity and are challenged by the expansiveness of trees and landscapes under their care. The City will develop programs and staff to add capacity to support the stewardship of Tampa’s trees and open spaces.
Utilities also play a large role in the success or failure of the city’s tree canopy. Overhead power lines are associated with prohibitive codes that do not allow for large and tall canopy trees. Additionally, the regional Utility (TECO) has initiated a storm prevention plan, sanctioned at the state level. Major efforts have taken place to secure power during times of inclement weather, but this has come at the expense of many tree-lined corridors adjacent to overhead wires. The City is currently working with TECO to identify corridors for power line burial, and this is a primary and potential impactful initiative of this Plan.
ENV 2.1 INTEGRATE APPROACHES TO ADDRESS THE URBAN HEAT ISLAND IN ALL PROJECTS
With hotter temperatures predicted for our future, it will be important to maintain comfortable urban spaces within our city, especially if a primary goal is to decrease dependency on vehicles and promote people-powered mobility options. One way to create comfort is through shade, which is notably absent in some parts of the city. The City is currently studying why this occurs, and how to fix it through the East Tampa Urban Heat Pilot program, which will work with neighborhood residents and City agencies to prioritize projects that mitigate the impacts of extreme heat. Concepts and techniques learned through this project will help to guide future actions citywide, and will help to develop future initiatives for this goal.
ENV 2.1.1 Integrate tree planting into public works and mobility projects, including a budget allocation toward tree installation and ongoing maintenance. MITIGATE ENGAGE ADMINISTRATIVE
ENV 2.1.2 Inform the public about impacts from tree canopy loss and what they can do to help. MITIGATE ENGAGE PROJECT
ENV 2.1.3 If form-based codes are developed, consider space requirements for trees and maximize canopy potential. MITIGATE ENGAGE POLICY
ENV 2.2 CONSIDER THE IMPACT OF UTILITIES ON THE URBAN TREE CANOPY
Overhead utility lines affect the plantings under them, prohibiting the growth of major canopy trees. Additionally, maintenance by utility companies can severely impact the structure and health of trees in close proximity as utility lines can claim the right of way. In historic districts, such as in Hyde Park, power lines are concealed in alleyways. In newer developments they located underground. However, a large portion of Tampa's canopy is obstructed or shaped by energy transmission infrastructure.
ENV 2.2.1 Move overhead utilities underground while accomplishing streetscape or other capital projects, for example PIPES projects. MITIGATE ENGAGE PROJECT
ENV 2.2.2 Work with TECO to prioritize locations for underground utilities. Identify priority streets and/or neighborhoods and consider popular pedestrian and community corridors. MITIGATE ENGAGE STUDY
ENV 2.3 STRENGTHEN THE PARKS AND RECREATION DEPARTMENT’S EFFORTS TO MANAGE AND EXPAND TAMPA’S TREE CANOPY
Prior to expanding the city’s tree canopy we must make sure that existing canopy is maintained properly, to ensure health and longevity. To do so, in addition to proactively planting new trees, will require new staff.
ENV 2.3.1 Establish new tree planting procurement methods for the Parks and Recreation Department.
MITIGATE ADMINISTRATIVE
ENV 2.3.2 Increase Tampa Parks and Recreation Department staff so that they can both maintain and expand the city’s tree canopy. Quantities are described in the 2021 Forestry Division Strategic Plan.
MITIGATE ENGAGE ADMINISTRATIVE
ENV 2.4 IMPLEMENT THE URBAN FORESTRY MANAGEMENT PLAN (2013)
The Urban Forestry Management Plan is a sound guidance document. Since its inception, over 50% of the action items have been completed. The next steps are to implement the remaining action items or to determine if those actions are still a priority, while creating additional items with the Natural Resources Advisory Council and the Internal Technical Working Group. Other actions are currently being developed by a city ecological analysis. Management of these processes should be considered, as well as significant effort towards their implementation.
ENV 2.4.1 Consider the most appropriate personnel to administer the Urban Forestry Management Plan, whether the Planning Department or the Parks and Recreation Department.
MITIGATE ADMINISTRATIVE
ENV 2.5
ESTABLISH BETTER DATA MANAGEMENT PROCESSES WITHIN THE CITY TO TRACK AND MONITOR ITS CANOPY
Capturing tree data through typical permitting processes will help to better manage our city’s tree canopy, and to know where gaps exist.
ENV 2.5.1 Enhance tree inventory methods by capturing parcel-level data through development and redevelopment permitting, especially pertaining to tree planting and removal.
ADMINISTRATIVE
ENV 2.6 FOCUS EFFORTS ON TREE PLANTING, ESPECIALLY WHERE URBAN HEAT ISLANDS EXIST
The Forestry Division Strategic Plan includes a comprehensive outlook on how to accomplish the City’s tree planting and maintenance goals. It includes recommendations for hiring, for implementation of Tree-Mendous Tampa, and for equipment purchases.
ENV 2.6.1 Follow guidance for hiring and equipment purchasing from the Forestry Division Strategic Plan.
ENV 2.6.2 Hold community events to distribute trees.
ENV 2.6.3 Develop and fund a reforestation program to work with large property owners to plant surplus lands with canopy trees.
ENV 2.6.4 Create a study to prioritize locations to plant trees in public property and rights of way.
1 Ł r '
FOODF
Changing environmental conditions can also increase challenges related to food access and affordability. Drought, heat, and damaging storms can have major impacts on the local food system. The City will identify strategic partnerships and projects that can help ensure basic levels of food security, particularly for Tampanians that already face other barriers in accessing affordable healthy food.
The City will cultivate and support existing relationships with Feeding Tampa Bay and other food distribution organizations. Additionally, studies will evaluate opportunities to establish community gardens, making food available for those that are willing to grow their own on the local scale.
Support and Promote Local Food Programs
Regional partners have spent years developing and strengthening food collection and distribution systems. These organizations can help to secure food resources for those in need, especially if food insecurity increases with climate change.
F 1.1 CONTINUE TO WORK WITH REGIONAL ORGANIZATIONS THAT PROVIDE FOOD TO THOSE IN NEED
F 1.1.1 Distribute program information at targeted outreach events.
F 1.1.2 Create a liaison to work between community outreach and food programs.
The City was recently awarded a $300,000 grant from the USDA to establish a community garden with the Coalition for Community Gardens and the Community Foundation Tampa Bay. This is a City of Tampa sponsored project and partnership that will expand the network of community gardens in an identified area of the City, supporting two community gardens in the next three years. The program will provide mentoring and education to communities and will work with community members to support a cooperative effort to mentor and train gardeners to cultivate food within their community.
The program will also create jobs by establishing Urban Agriculture Coordinator position(s), to manage education programs, provide job training, establish garden markets, and provide administration.
Lastly, the grant project will develop new school gardens in underserved and food insecure communities, starting by adding two new school gardens by the end of the first year and adding two additional school gardens after three years. This will include curriculum for students of all ages.
Increase Local Food Assets
Growing more food in close proximity makes us more resilient to outside logistical factors and price fluctuations, while reducing emissions resulting from long-distance food distribution. With grass-roots community support, community gardens provide an opportunity for the city to grow more of its own food.
F 2.1
EXPLORE OPPORTUNITIES FOR THE CITY TO DEVELOP FOOD RESOURCES ON PUBLICLY OWNED LANDS
Providing access to locally grown food not only creates a direct connection between grower and consumer, but market locations can become important community and cultural centers.
F 2.1.1 Evaluate opportunities to establish community gardens through the Parks and Recreation Department.
F 2.1.2 Pilot a food hall market within a food desert. Use City-owned property, providing the infrastructure for local farmers and approved gardeners to sell their food.
F 2.2 MAKE LAND USE CHANGES TO ALLOW FOR LOCALIZED FOOD PRODUCTION AND DISTRIBUTION
Our history of single use and single-family zoning has made it difficult to create the necessary traffic to sustain local stores and markets. Considering food access in new developments can help to create opportunities for local food access.
F 2.2.1 Approve zoning changes that support grocery store development in residential areas, such as increasing density and integrating mixed use into neighborhoods that can sustain commercial programming.
MITIGATE ENGAGE POLICY
F 2.3
CONNECT TAMPANIANS TO EXPERT RESOURCES RELATED TO FOOD PRODUCTION
Universities, especially the University of Florida, have robust programs that provide education about plants, soils, and cultivation techniques. Integrating these programs into communities, hosting workshops, and fostering community involvement for these programs can benefit Tampa citizens.
F 2.3.1 Promote University of Florida Extension Agency educational programs through City marketing and communications.
MITIGATE ENGAGE PROJECT
GOV GOVERNANCE
GOVERNING FOR RESILIENCE
The City will continue to expand upon synergies between infrastructure departments, and coordinate planning efforts across departments to maximize efficiencies. This effort will increase our ability to enhance infrastructure and to integrate climate action initiatives into projects across City departments. Building upon priorities set forth in Resilient Tampa, this Plan has laid out a framework to help guide decision-making, which will help us to be more efficient and comprehensive in the work that we perform. Going forward, integrating climate action across City business will be part of everything we do.
Incorporating climate action into planning will also open doors for funding. The federal legislature has recently passed multiple bills providing money for transportation, energy, and other infrastructure initiatives, and hurricanes also bring additional funding to the region. However, these funds will be distributed first to municipalities that are prepared and that have plans in place. The City of Tampa will continue ongoing efforts to be prepared to access these funds.
Integrating climate action across City business will be part of everything we do
Our next steps are to come together: not just across government, but across sectors, including nonprofit, philanthropic, academic, and private sector partners, as well as Tampanians from across our neighborhoods. As described in this Plan, we have identified our challenges and our opportunities. Together, we will need to make progress toward building a more resilient future. Tracking and monitoring our progress will be important to ensuring that we meet our objectives.
Strengthen Coordination Between Departments
We can gain efficiencies in implementing priorities identified across this Plan by making it easier for departments to work together. This includes sharing projects across department silos, induced through new protocols in the capital improvement projects process.
GOV 1.1 REVIEW AND ASSESS OPPORTUNITIES FOR COLLABORATION AND INTEGRATION OF CLIMATE ACTION INITIATIVES
Additional support is needed to coordinate overlapping project opportunities. The City will create a position to strengthen coordinated project delivery and will work to establish new frameworks that assist inter-agency collaboration.
GOV 1.1.1 Create a position to coordinate Resilient Tampa and Climate Action and Equity Plan goals. This person will review projects and work to identify, in the development phase, opportunities to integrate sustainability and resilience goals.
GOV 1.1.2 Complete a comprehensive review of existing policies and programmatic approaches within each department.
GOV 1.1.3 Coordinate the integration of climate action initiatives into all department planning, for example the Parks and Recreation Master Plan or Wastewater Master Plans, using the Climate Action Categories as a checklist for project opportunities.
Increase Revenue to Fund Climate Action
While federal grant opportunities have unlocked new funding pathways, additional funding is needed for the infrastructure upgrades necessary to prepare for a changing climate. We will need to take creative funding approaches to ensure our continued ability to adapt in the face of this chronic challenge.
GOV 2.1 CREATE FEES FOR PROJECTS THAT DEFER CLIMATE COSTS
Communities will need to find funding for adaptation projects as their context changes, especially at the coast, and the demand will eventually overwhelm the current supply of grants. In the meantime, it will be important to build a reservoir of savings to support future adaptation projects.
GOV 2.1.2 Work with communities to create self-assessed climate funds through overlay districts, based on future needs and community planning strategies.
GOV 2.1.1 Explore the potential to build mitigation and adaptation funds through policies such as a green building ordinance or a coastline protection mitigation fee for new sea wall projects.
MITIGATE ADAPT POLICY
GOV 2.2
ORIENT PLANS TOWARD FUNDING OPPORTUNITIES, AND INCORPORATE OPPORTUNITIES WITHIN PLANS
FEMA has stated that there is a 6-to-1 benefit ratio for money allocated toward resilience.41 This has opened up many different funding sources that will at least match local funding for projects that have resilience components, including mitigation or adaptation measures. Other funding can be found for projects that encourage equity, provide equal access through transportation, and support community health. Integrating these aspects into project planning and developing projects or plans with funding opportunities in mind can help position the City to receive help in strengthening infrastructure and taking care of its population along the way.
GOV 2.2.1 For new projects, allocate a percentage of scoping to identify resilience components that align with state or federal funding opportunities.
Create Place-Based Planning Frameworks
Localizing the issue of climate change can help to develop unique and appropriate solutions. Different communities have different levels of vulnerability, and also different capacities to adapt, whether physical or financial. The City will continue to work with communities to identify what types of policies and projects work best in different neighborhoods.
GOV 3.1 CREATE OVERLAY DISTRICTS TO ESTABLISH COMMUNITY GOALS AND FUNDING STRATEGIES
Overlay districts provide a mechanism for creating place-based policy, to meet community goals. For example, the Riverfront District, Channelside, and Ybor City Districts allow communities to define goals and funding mechanisms to reach them. This same approach can be geared toward climate action and adaptation planning.
GOV 3.1.1 Locate and develop Adaptation Action Areas.
GOV 3.1.2 Create planning overlay zones that relate to future sea-level rise impacts.
The Adaptation Action Area (AAA) designation can be used to provide focus for planning and policy, whereby unique codes or standards can be instituted. AAAs have been used in different ways, and are associated with different planning approaches. For example, Jacksonville’s Adaptation Action Areas Plan is defined by locations within the category 3 storm surge or within the 500-year flood plain. Miami-Dade designated an area, called the Little River AAA, that is susceptible to climate impacts and includes vulnerable populations. In Yankeetown, Florida, six Adaptation Action Areas were defined. Each constitutes a unique set of attributes related to flooding and sea level rise. At its essence, the AAA allows governments to identify a specific zone to implement policy and programs, and the boundaries can be based on individual preference.
GOV4
Expand Data and Analysis Capabilities within City Planning and Operations
Enhancing the City’s data capabilities will help us to make smart and data-driven decisions. It will also provide a tool to monitor our progress, ensuring that work is being done to secure the city’s future.
GOV 4.1 GATHER PARCEL-LEVEL DATA AND INTEGRATE INTO GIS PLATFORMS
Additional support is needed to coordinate overlapping project opportunities. The City will create a position to strengthen coordinated project delivery and will work to establish new frameworks that assist inter-agency collaboration.
GOV 4.1.1 Digitize elevation certificates and integrate into geographic information systems.
GOV 4.1.2 Include tree planting and demolition information in a coordinated GIS database.
GOV 4.1.3 Hire a data manager.
Plan for the Future
While climate change is already having impacts on our communities, we must continue to prepare for expanded impacts upon our way of life. To be ready for the future, we must plan and implement projects today. The City will use the most current and available science to support planning that looks to future conditions, so that our infrastructure is ready for diverse future scenarios.
GOV 5.1
INTEGRATE FUTURE CONDITIONS INTO ALL PLANNING AND CAPITAL IMPROVEMENT PROJECTS
Different scenarios can be applied to different assets, depending on life expectancy. However, a 50-year outlook is typical.
GOV 5.1.1 Create future planning guidance through the Post Disaster Redevelopment Plan.
GOV 5.1.2 Use future conditions for capital improvement projects and permitting.
ADAPTSTUDYMITIGATE ADAPT POLICY
CONCLUSION
The Climate Action and Equity Plan has been used to coordinate departments and to lay out initiatives to establish a new and robust climate agenda. It is a first step. As such, focus was equally distributed between identifying immediate opportunities for action and establishing a framework to guide future initiatives. Once progress is made, we will begin to see our strengths and weaknesses and can follow up with a secondary report that outlines clear and measurable goals, which will be much more concise than what was established by this report. However, three goals will guide us in these pursuits:
MITIGATE
Reduce Carbon Emissions and Increase Carbon Capture
ADAPT
Make Infrastructural Changes, Acknowledging the Future Impacts of Climate Change
ENGAGE
Listen To and Support All Tampanians Along the Way
Looking at the near term, a few priority actions have been established. These 10 areas will see the most active attention and will be the focus of initial work.
SHORT TERM PRIORITIES
The Flagship Actions described below cut across all 10 Climate Action Categories and support many of the initiatives detailed within this Plan. These prioritized next steps will go a long way in creating progress toward climate action and equity goals. Through the course of this planning process, the following became leading areas of interest:
DEVELOP FRAMEWORKS TO ORGANIZE, COORDINATE, AND MANAGE THE IMPLEMENTATION OF CLIMATE INITIATIVES
Resilience and climate action strategies need to be incorporated into ordinary departmental work. This can only be done by expanding the resilience lens and by monitoring City projects, programs, and policies for opportunities to incorporate climate action initiatives. This will require collaboration and new forms of project delivery.
ESTABLISH AND EXECUTE A 100% CLEAN AND RENEWABLE ENERGY PLAN FOR MUNICIPAL OPERATIONS
Tampa will lead by example and make a data-driven, realistic commitment towards a net equivalent use of clean and renewable energy. Constraints and challenges will be embedded into all recommendations and metrics – for example Tampa is energy dependent on the Tampa Electric Company (TECO). Understanding their fee structures, programs, and agreements is critical to creating realistic goals and strategies.
DEVELOP THE CITY’S SOLAR INVENTORY
The city currently does not have any solar-powered facilities. However, this will drastically change. After reviewing more than 100 sites, 20 have been selected and analyzed for solar power implementation. Other opportunity sites are in development and have been discussed with the departments. The City will also work with TECO to increase its inventory. As a primary consumer in the region, the City will work to expand efforts toward diverse options of clean and renewable energy sources.
DECREASE MUNICIPAL ENERGY USE
Infrastructure updates and newer technologies can help the City minimize energy consumption, especially that of its utilities. These are large-scale changes that can save Tampa money.
5. DEVELOP PROJECT OPPORTUNITIES TO MAKE CLIMATE INITIATIVES IMMEDIATELY ACTIONABLE
A major component of this project is to understand impediments to implementing initiatives and to work through structural and administrative challenges. Many of the listed initiatives are expected to be immediately actionable, providing a strong first step in the City’s push toward mitigating and adapting to climate change.
6. USE FUTURE CONDITIONS CRITERIA FOR CAPITAL IMPROVEMENT PROJECTS, PLANNING, AND PERMITTING
Future environmental conditions may not be certain, but the City acknowledges that they will be different than they are today. We will work toward the future: “Transforming Tampa’s Tomorrow.” Different scenarios can be applied to different assets, depending on life expectancy. However, a 50-year outlook is typical.
7. CREATE EFFICIENT, EQUITABLE, AND FUN FORMS OF COMMUNITY ENGAGEMENT
Outreach and equity is at the forefront of all City operations. These important concepts should not be thought of as a box to check, but as the genesis of project development and delivery. Communication strategies should reach a broad range of citizens, not just community leaders. However, community leaders are a good starting point and can provide a better understanding of an area.
8. PRIORITIZE REDUCING VEHICLE MILES TRAVELED (VMTS) THROUGH PLANNING AND MULTI-MODAL TRANSPORTATION OPTIONS
Good urban environments reduce the need to drive, which is a primary source of carbon emissions in Tampa. It will be a priority to promote diverse and efficient transportation options oriented around Tampanians’ needs and to create human-scale interactions within our urban areas.
9. INCREASE TAMPA’S TREE CANOPY
Although Tampa has historically been recognized worldwide for its high canopy coverage, this coverage has recently decreased because of development and new statewide policies. This important asset not only mitigates greenhouse gases but creates an enjoyable, more comfortable environment for people to inhabit.
10. RECOGNIZE THE IMPORTANCE OF NATURAL SYSTEMS
Tampanians are fortunate to enjoy vibrant and beautiful natural ecosystems. Tampanians and visitors alike can take advantage of numerous water bodies such as at coastlines, creeks, lakes, ponds and rivers, one of which runs through the center of Tampa. Whether it is fishing, running, hiking, or simply sitting outdoors, natural systems provide incredible value. They are also important for regulating the environment. Trees and wetlands process carbon dioxide. Coastal areas, with seagrass and mangroves, dissipate wave energy and prevent erosion. It is time to provide efforts toward integrating ecological systems into the success and growth of the city and to act as stewards of our environment.
Climate change presents an uncertain future. However, the science is clear, and we know that we will have to deal with rising sea levels, hotter temperatures, and more extreme precipitation events. It is essential to protect each other as much as our infrastructure. The actions established by this Plan will promote a whole community approach to creating a more Resilient Tampa, following Mayor Castor’s T3 agenda to Transform Tampa’s Tomorrow. However, the ultimate goal is to create a city that all Tampanians can enjoy and can be proud of.
City of Tampa Whit Remer Sustainability and Resilience Officer www.tampa.gov whit.remer@tampagov.net
Whit Remer, Sustainability and Resilience Officer, City of Tampa
PROJECT TEAM
Primary Author: Applied Sciences
Graphic Design: Alex Quinto
Editing: Anna Friedman, Seth Pyenson
Project Support: Sunbelt Strategies, Greenlink, The CLEO Institute, VHB, Jacobs, Valerin, REAL Building Consultants, Ariel Business Group, University of South Florida, Florida Center for Community Design and Research
CITY OF TAMPA
Parks and Recreation: Tony Monk, Brad Suder, Ted Fowler, Eric Muecke, Heather Wolf-Erickson, Doris Walent, Denise Dispenza
Revenue and Finanace: Michael Cascone, Catherine Hayes, Rebecca Young
Waste Management: Chuck Conklin, Larry Washington, Regina Byrd, Edgar Castro Tello, Alexis Black, Shelby Lewis, Amanda Alfarah, Mark Wilfalk
Water: Rory Jones, Chuck Weber, Seung Park, Elias Franco, Julia Palaschak
Wastewater: Charlie Lynch, Dr. Karloren Guzman, LaShonda Green, Andres Aviles, Eric Weiss
Planning: Stephen Benson, Andy Mikulski, Brian Knox, Matt Pleasant, LaChone Dock, Frank Hall
Development Services: JC Hudgison, Abbye Feeley
Fleet: Gary Stewart
Community Engagement and Partnerships: Janelle McGregor, Frank Crum
Facilities: Anja Davis, Adri Colina, Keith Bruton
Infrastructure & Mobility: Jean Duncan, Brad Baird, Vik Bhide, Al Hoel, Jan Washington, Calvin Hardie, Danni Jorgenson, Alana Brasier, Ben Allushuski, Alex Awad, Milton Martinez, Brandie Miklus
THE MAYOR’S SUSTAINABILITY AND RESILIENCE ADVISORY COMMITTEE
Rep. Kathy Castor
Walter Smith
Josh Baumgartner
Daane Reinking
Adelee Le Grand
Susan Glickman
Phil Compton
Taylor Ralph
Dr. Yogi Goswami
Bob Rohrlack
Chris Minner
Dr. Maya Trotz
Mallory Dimmitt
Demetri Sedita
CJ Reynolds
PLANNING COMMISSION
Jay Collins
Shawn College
THAP
Lisa Mascagni
Derrick Blue
THE TAMPA BAY ESTUARY PROGRAM
Maya Burke
UNIVERSITY OF SOUTH FLORIDA
Dr. Amy Stuart
Taryn Sabia
Dr. Sandra Garren
Dr. Shawn Landry
Dr. Ping Wang
TECO
Byron Burrows
Kristen Laplaca
David Plusquellic
SOLAR UNITED NEIGHBORS (SUN)
Heaven Campbell
Julie Herbst
Liz Veazey
GREENLINK
Etan Gumerman
Stephanie Varughese
Michael Gilley
Matt Cox
THE CLEO INSTITUTE
Betty Jeremie
Joseph Ayala
OTHERS
Josh Frank
All those not mentioned, that gave their time and thoughts to create this plan.
APPENDIX
Initiative List
Initiatives are categorized as Projects, Programs, Policies, or necessary Administrative changes.
Initiative List: Categorization of projects, programs, policies, and administrative changes for energy and water/wastewater sustainability.
Category
Initiative/Description
Policy Level
Mitigate
Adapt
Engage
Community Voice
Category
ENERGY
E 1
TRANSITION TO 100% CLEAN AND RENEWABLE ENERGY IN ALL MUNICIPAL OPERATIONS
Goal
E 1.1
Improve energy efficiency in municipal facilities
Strategy
E 1.1.1
Direct consistent funding towards building renovations for energy reduction.
Initiative
Mitigate
Administrative
E 1.2
Transition to clean and renewable energy sources
Strategy
E 1.2.1
Install solar panels at municipal facilities, using the Solar Feasibility Study provided by this Plan.
Initiative
Mitigate
Project
E 1.2.2
Mandate that all new municipal construction should utilize solar energy when possible, or be solar ready.
Initiative
Mitigate
Policy
E 1.2.3
Review existing tariff rates for all departments, with a focus on opportunities when transitioning to renewable energy sources.
Initiative
Adapt
Study
E 1.3
Transition to EVs
Strategy
E 1.3.1
Continue to build the City’s electric and hybrid vehicle fleet.
Initiative
Mitigate
Policy
E 1.4
Track and monitor energy use
Strategy
E 1.4.1
Hire an energy manager.
Initiative
Mitigate
Administrative
E 1.4.2
Develop a framework for comprehensive energy consumption tracking and management using a program such as the Better Buildings Challenge or the Energy Star Portfolio Manager, especially at priority energy use facilities such as the Howard F. Curren Wastewater Plant. Report energy use annually on the City’s website.
Initiative
Mitigate
Administrative
E 1.4.3
Continue to conduct a greenhouse gas inventory every 5 years.
Initiative
Mitigate
Study
E 2
USE POLICY AND INCENTIVES TO ENCOURAGE A TRANSITION AWAY FROM FOSSIL FUELS IN THE PUBLIC SECTOR
Goal
E 2.1
Expand upon existing weatherization and energy efficiency incentives to reduce energy consumption in residential and commercial sectors
Strategy
E 2.1.1
Form a working group to evaluate options for policy that incentivizes solar energy production and energy efficiency projects in the private sector. Approaches can range from mandates to monitoring, to incentives.
Initiative
Mitigate
Engage
Yes
Policy
E 2.1.2
Embed weatherization into the City of Tampa Owner-Occupied program.
Initiative
Mitigate
Engage
Yes
Administrative
E 2.2
Support access to solar for residential, commercial, and industrial users
Strategy
E 2.2.1
Facilitate connections between the community and solar programs, including Solar United Neighbors (SUN), the Solar and Energy Loan Fund (SELF), and the Property Assessed Clean Energy (PACE) program.
Initiative
Mitigate
Engage
Project
E 2.2.2
Review historic district codes and ensure that all Tampa homes have an opportunity to install solar.
Initiative
Mitigate
Engage
Yes
Policy
E 2.2.3
Work with TECO to develop a decentralized power generation plan.
Initiative
Mitigate
Engage
Yes
Study
E 2.2.4
Engage with the Florida Public Service Commission regulary and establish an inter-agency group to discuss issues related to Utility providers.
Initiative
Mitigate
Engage
Administrative
E 2.3
Coordinate, incentivize and/or plan a transition to electric vehicles in the public sector
Strategy
E 2.3.1
Create an EV Readiness Ordinance that guarantees access to electric vehicle charging in multi-family, commercial, and hotel development.
Initiative
Mitigate
Policy
WATER AND WASTEWATER
WW 1
REDUCE ENERGY USE IN WATER FACILITY OPERATIONS
Goal
WW 1.1
Retrofit existing facilities and systems
Strategy
WW 1.1.1
Use a carbon footprint and energy efficiency lens to evaluate facility performance. Identify retrofit opportunities that incorporate these criteria for return-on-investment metrics, considering expenditures required to meet municipal energy-use goals. Incorporate this perspective in any future master planning efforts.
Initiative
Mitigate
Study
WW 1.1.2
Invest in advanced metering infrastructure, which can provide consumers important real-time information about potential leaks. This saves the consumer money and decreases the City’s need to process thousands of gallons per year.
Initiative
Mitigate
Project
WW 1.1.3
Evaluate pump stations for renovation upgrades that would save energy.
Initiative
Mitigate
Study
Summary of water, wastewater, and stormwater strategies, initiatives, and projects
ID
Description
Type
Action
Adapt/Engage
Engage
Yes
Category
WW 1.1.4
Establish submeters for individual process components and insert data into Energy Star Portfolio Manager.
Initiative
Mitigate
Project
WW 1.1.5
Partner with regional universities to investigate new processes and technologies that could substantially reduce HFC AWTP energy use.
Initiative
Mitigate
Engage
Study
WW 1.1.6
Investigate alternatives for the recovery and reuse of treatment process residuals.
Initiative
Mitigate
Study
WW 1.2
Replace legacy pipes
Strategy
WW 1.2.1
Explore a new program to repair and replace private service laterals, potentially using grant funding. This program could significantly reduce leaks from deteriorated service laterals, which are considered one of the primary sources of the peak rates of inflow, and the related impacts of peak flows on pumping and treatment operations – primarily the peak power demands.
Initiative
Mitigate
Project
WW 1.2.2
Mandate on-site wastewater plumbing meet code for substantial improvement on private property, including sewer laterals. This can be supplemented by the City of Tampa Owner-Occupied program, which provides grants to homeowners to upgrade infrastructure.
Initiative
Mitigate
Policy
WW 1.3
Use renewable energy sources at water and wastewater facilities
Strategy
WW 1.3.1
Install solar at Water Department facilities, with a target 50% of energy being produced through renewable energy sources.
Initiative
Mitigate
Project
ww 1.3.2
Develop small-use hydro power at the dam.
Initiative
Mitigate
Project
WW 1.3.3
Commit to use of bio-gas generated as an alternate energy source, considering environmental benefits and the potential to create jobs.
Initiative
Mitigate
Project
WW 1.3.4
Conduct a study to determine the vulnerability of solar panels to onsite atmospheric chemicals, such as H2S, at the Wastewater Plant.
Initiative
Mitigate
Study
WW 1.3.5
Provide clean and renewable energy or offsets for power at the Howard F. Curren Advanced Wastewater Treatment Plant.
Initiative
Mitigate
Project
WW 2
PROTECT WATER RESOURCES
Goal
WW 2.1
Protect groundwater resources
Strategy
WW 2.1.1
Study and address the impacts of saltwater intrusion and groundwater rise.
Initiative
Adapt
Study
WW 2.2
Safeguard utilities from flooding
Strategy
WW 2.2.1
Ensure sufficient backup power exists at facilities.
Initiative
Adapt
Project
WW 2.2.2
Install submersible pumps at the Wastewater Treatment Plant.
Initiative
Adapt
Project
WW 2.2.3
Conduct vulnerability assessments to understand flooding and future conditions at critical facilities.
Initiative
Adapt
Study
WW 2.2.4
Resolve stormwater issues where wastewater pump stations are vulnerable to flooding or sea level rise.
Initiative
Adapt
Project
WW 2.3
Utilize reclaimed water
Strategy
WW 2.3.1
Explore water reuse opportunities.
Initiative
Mitigate
Adapt
Study
WW 2.4
Track water usage over time
Strategy
WW 2.4.1
Record and publish water usage data on the City’s website.
Initiative
Mitigate
Adapt
Engage
Administrative
STORMWATER
SW 1
MANAGE STORMWATER FOR HEALTHY ENVIRONMENTS AND MULTI-BENEFICIAL USE
Goal
SW 1.1
Promote spatial and urban solutions for flooding problems
Strategy
SW 1.1.1
Coordinate opportunities for green infrastructure in the project planning phase across City departments, prior to establishing capital improvement projects. Coordinate urban infrastructure projects by area, allowing for layered and multi-benefit solutions.
Initiative
Mitigate
Adapt
Administrative
SW 1.1.2
Foster additional collaboration between the Stormwater Department and the Parks and Recreation Department, including the alignment of project budgets and maintenance for some projects.
Initiative
Mitigate
Adapt
Administrative
SW 1.1.3
Build resources for landscape management within the Parks and Recreation Department.
Initiative
Mitigate
Adapt
Administrative
SW 1.1.4
Build a pilot stormwater management demonstration project at a city park.
Initiative
Mitigate
Adapt
Project
SW 1.2
Conduct a comprehensive study of urban stormwater and leverage data/findings for equitable decision making
Strategy
SW 1.2.1
Initiate conversations with the communities most vulnerable to sea level rise and develop planning strategies.
Initiative
Mitigate
Adapt
Engage
Yes
Study
SW 1.2.2
Develop a city wide stormwater masterplan, followed by prioritization of projects that address flooding, with an equity lens.
Initiative
Adapt
Engage
Yes
Study
SW 1.2.3
Conduct a Hillsborough River tributary analysis, with an emphasis on channelized and piped waterways.
Initiative
Adapt
Study
Goals, strategies, and initiatives for stormwater, transportation, and land use planning, including ADA-compliant actions and responsible parties.
Category
Description
Type
Mitigate
Adapt
Engage
Study
Policy/Project
SW 1.2.4
Conduct a study of repetitive loss properties and identify opportunity areas where property acquisition benefits both the property owner and resilience interests. Consider properties that may be vulnerable in the future and generate an expected cost scenario, or multiple scenarios.
Initiative
Adapt
Engage
Study
SW 2
CONSIDER FUTURE CONDITIONS IN DEVELOPING PLANS, PROJECTS, AND POLICIES
Goal
SW 2.1
Incorporate climate change and sea level rise in stormwater and watershed planning documents
Strategy
Policy
SW 2.1.1
Establish future conditions scenarios for use in the City of Tampa Stormwater Manual.
Initiative
Adapt
Yes
Policy
SW 2.1.2
Create a future conditions groundwater map, to be used for planning and permitting.
Initiative
Adapt
Policy
SW 2.1.3
Differentiate areas of the city and apply unique codes for areas susceptible to sea level rise.
Initiative
Adapt
Engage
Policy
SW 2.1.4
Increase requirements for upland water storage at the lot level for both commercial and residential scenarios.
Initiative
Adapt
Policy
SW 2.1.5
Consider future rainfall projections when establishing stormwater standards.
Initiative
Adapt
Policy
TRANSPORTATION AND LANE USE
TLU 1
REDUCE VEHICLE MILES TRAVELED (VMTS)
Goal
TLU 1.1
Track and monitor progress towards reducing vehicular use
Strategy
TLU 1.1.1
Inventory vehicle miles traveled (VMTs) in the City and set realistic targets for VMT reduction.
Initiative
Mitigate
Study
TLU 1.2
Create safer, more comfortable streets, trails, and pedestrian-scaled mobility environments
Strategy
TLU 1.2.1
Ensure policies do not unnecessarily prioritize vehicle-centric infrastructure.
Initiative
Mitigate
Yes
Policy
TLU 1.2.2
Quickly expand dedicated, protected spaces for bicyclists and pedestrians, using affordable and efficient methods.
Initiative
Mitigate
Yes
Project
TLU 1.2.3
Provide tree canopy or other shading within the pedestrian mobility network.
Initiative
Mitigate
Yes
Project
TLU 1.2.4
Begin an intense tree planting effort along trails.
Initiative
Mitigate
Yes
Project
TLU 1.2.5
Coordinate with HART to ensure sufficient shade at bus shelters.
Initiative
Mitigate
Engage
Yes
Study
TLU 1.2.6
Integrate tree plantings into new mobility projects.
Initiative
Mitigate
Policy
TLU 1.2.7
During all major roadway projects, place utility wires underground or install underground conduit to facilitate future underground service (to create opportunities for shade trees).
Initiative
Mitigate
Adapt
Engage
Policy
TLU 1.2.8
Create a standards ordinance to establish minimum criteria for the integration of complete streets in capital improvement projects.
Initiative
Mitigate
Policy
TLU 1.2.9
Beginning with a pilot effort in Sulphur Springs, test and expand upon initiatives to connect multiple modes of safe transportation.
Initiative
Mitigate
Engage
Yes
Project
TLU 1.2.10
Allocate sufficient resources in mobility projects to manage long-term maintenance of project-associated trees.
Initiative
Mitigate
Administrative
TLU 1.3
Establish land use policies to induce alternative mobility choices
Strategy
TLU 1.3.1
Implement the Transit Oriented Development/Mixed-Use Corridor zoning and land use recommendations from City Planning studies.
Initiative
Mitigate
Policy
TLU 1.3.2
Expand the Neighborhood Commercial District Plan program.
Initiative
Mitigate
Engage
Administrative
TLU 1.3.3
Change land use code and zoning to promote the 10-minute neighborhood concept. Aim for 8-16 residents per acre on average.
Initiative
Mitigate
Engage
Policy
TLU 1.3.4
Identify high density locations in the City’s future land use plan and prioritize regional and multi-modal transit accommodation in proximity.
Initiative
Mitigate
Engage
Study
TLU 1.3.5
Prioritize public CIP funding in neighborhoods with density.
Initiative
Mitigate
Engage
Policy
TLU 1.3.6
Follow the Vision Zero Action Plan, including the creation of a Safe Routes to Places program.
Initiative
Mitigate
Engage
Yes
Policy
TLU 1.3.7
Re-evaluate, decrease and, where appropriate, eliminate off-street parking requirements.
Initiative
Mitigate
Policy
TLU 1.4
Work with regional transit agencies to increase mobility options
Strategy
TLU 1.4.1
Establish transit and other mobility plans in a formalized document. Connect land use to transportation.
Initiative
Mitigate
Engage
Yes
Study
TLU 1.4.2
Modernize and expand the streetcar system.
Initiative
Mitigate
Engage
Yes
Project
TLU 1.4.3
Support regional transit connections such as the Brightline.
Initiative
Mitigate
Adapt
Engage
Yes
Administrative
TLU 1.4.4
Ensure transit affordability. Explore potential options, such as free or reduced rates for specific corridors.
Initiative
Mitigate
Engage
Yes
Policy
TLU 2
ENSURING SAFE AND EQUITABLE OPPORTUNITIES FOR EVACUATION DURING HAZARDOUS WEATHER EVENTS
Goal
TLU 2.1
Study the evacuation system and create a network of local community sheltering facilities and lifelines
Strategy
TLU 2.1.1
Create a diverse and local scale system of sheltering facilities through integrated projects, such as resilience hubs, at locations that are familiar to the community.
Initiative
Adapt
Engage
Yes
Project
Waste Management and Housing & Development Goals, Strategies, and Initiatives
Category
ID
Description
Type
Mitigate
Engage
Yes
Other
WASTE MANAGEMENT
WM 1
WM 1
ENHANCE WASTE STREAM MANAGEMENT
Goal
WM 1.1
WM 1.1
Create partnerships to reduce total municipal solid waste (MSW) that goes to the landfill
Strategy
WM 1.1.1
WM 1.1.1
Consider an anaerobic digestion partnership with the Wastewater Department.
Initiative
Mitigate
Study
WM 1.1.2
WM 1.1.2
Explore the potential to combine organic products, such as residential yard waste, with com-postable products through an aerated static pile composting operation.
Initiative
Mitigate
Study
WM 1.1.3
WM 1.1.3
Support companies that are helping to eliminate single use products.
Initiative
Mitigate
Policy
WM 1.2
WM 1.2
Educate the public about waste stream management
Strategy
WM 1.2.1
WM 1.2.1
Increase educational efforts and programs to grow citywide composting and recycling.
Initiative
Mitigate
Engage
Administrative
WM 2
WM 2
Upgrade Facilities and Transition to New Technologies
Goal
WM 2.1
WM 2.1
Invest in upgrades to facilities, services, and equipment
Strategy
WM 2.1.1
WM 2.1.1
Partner with academic, governmental, and non-governmental organizations to research the feasibility of implementing a carbon sequestration pilot project.
Initiative
Mitigate
Engage
Study
WM 2.1.2
WM 2.1.2
Explore options for new infrastructure such as a mixed waste facility or an industrial compost site.
Initiative
Mitigate
Study
WM 2.1.3
WM 2.1.3
Implement new boiler technologies to create more efficient combustion.
Initiative
Mitigate
Project
WM 2.1.4
WM 2.1.4
Renovate or repair facility components such as main and auxiliary transformer replacement, ash building replacement, refuse crane replacement, turbine generator overhaul and stack repairs.
Initiative
Mitigate
Project
WM 2.1.5
WM 2.1.5
Expand collection of yard and organic waste.
Initiative
Mitigate
Engage
Project
WM 2.2
WM 2.2
Reduce Waste Management fleet emissions
Strategy
WM 2.2.1
WM 2.2.1
Use data management to maximize route efficiencies.
Initiative
Mitigate
Study
WM 3
WM 3
ADDRESS OPERATIONAL CHALLENGES RELATED TO STORMS AND SEA LEVEL RISE
Goal
WM 3.1
WM 3.1
Ensure access to the McKay Bay facility, now and in the future
Strategy
WM 3.1.1
WM 3.1.1
Conduct a vulnerability assessment and implement necessary upgrades, including evaluating the main building at the WTE facility for hurricane rating resilience.
Initiative
Adapt, Study
WM 3.2
WM 3.2
Manage service during or after major storms
Strategy
WM 3.2.1
WM 3.2.1
Refine the process for handling post-storm events, including consideration of heavy debris. This includes arranging contracts before disasters occur. Coordinate this Plan with others in the region.
Initiative
Adapt, Study
WM 4
WM 4
ADDRESS ENVIRONMENTAL IMPACTS OF WASTE MANAGEMENT
Goal
WM 4.1
WM 4.1
Explore alternative uses of ash
Strategy
WM 4.1.1
WM 4.1.1
Identify and develop methods for recycling or reusing ash residue or treated ash residue, such as recycling or allowing re-use of ash by others.
Initiative
Mitigate
Study
WM 4.2
WM 4.2
Support statewide extended producer responsibility (EPR) policy
Strategy
WM 4.2.1
WM 4.2.1
Define a champion to support EPR legislation.
Initiative
Mitigate
Administrative
HOUSING AND DEVELOPMENT
HD 1
HD 1
ENSURE LIVABLE HOUSING IN SECURE LOCATIONS
Goal
HD 1.1
HD 1.1
Increase the supply and availability of affordable resilient housing, with a focus on less climate vulnerable areas
Strategy
HD 1.1.1
HD 1.1.1
Continue the Mayor’s affordable housing initiative and the Dare to Own the Dream home ownership program.
Initiative
Adapt, Engage
Yes
Administrative
HD 1.1.2
HD 1.1.2
Adopt missing middle zoning to provide “gentle density” near transit corridors and in neighborhoods where hi-rise development may not be compatible.
Initiative
Mitigate
Adapt, Engage
Policy
HD 1.1.3
HD 1.1.3
Create an ADU policy for areas outside of the CHHA, increasing the supply of housing in less hazard-prone areas.
Initiative
Mitigate
Adapt, Engage
Policy
HD 1.2
HD 1.2
Provide resources to the community to weatherize and fortify existing housing
Strategy
HD 1.2.1
HD 1.2.1
Work with community partners to develop home renovation programs. Focus on helping those with less economic capacity that have strong local social networks.
Initiative
Mitigate
Adapt, Engage
Yes
Study
HD 1.2.2
HD 1.2.2
Communicate new state and federal incentives for home improvement related to energy efficiency and storm readiness.
Initiative
Mitigate
Adapt, Engage
Yes
Administrative
HD 2
HD 2
DEVELOP SPECIFIC POLICY FOR COASTAL AREAS
Goal
HD 2.1
HD 2.1
Establish resilient building practices through policy
Strategy
HD 2.1.1
HD 2.1.1
Finalize and implement policy recommendation from the Coastal Area Action Plan study.
Initiative
Adapt, Engage
Study
HD 2.1.2
HD 2.1.2
Ensure strict enforcement of the most current Florida Building Codes through the permitting process.
Initiative
Adapt, Engage
Administrative
HD 2.1.3
HD 2.1.3
Avoid harmful or hazardous uses in the Coastal High Hazard Area (CHHA).
Initiative
Mitigate
Policy
Community, Habitat, and Environment Goals, Strategies, and Initiatives Table: Outlines objectives, strategies, and actions for local communication, engagement, workforce development, and environmental conservation.
Category
ID/Action
Description
Type
Mitigate
Adapt
Engage
Other
COMMUNITY
COM 1
ESTABLISH LOCAL SCALE COMMUNICATION AND ENGAGEMENT
Goal
COM 1.1
Leverage community engagement opportunities to discuss challenges related to climate change and surface resident-driven solutions
Strategy
COM 1.1.1
Familiarize residents with environmental hazards and response through everyday project outreach activities.
Initiative
Adapt
Engage
Yes
Administrative
COM 1.1.2
Create a map that triggers specific information delivery, coordinated with outreach opportunities for all projects occurring in the City.
Initiative
Adapt
Engage
Administrative
COM 1.1.3
Provide a survey at relevant community events and online, coordinated through community outreach, that identifies vulnerabilities and concerns within a neighborhood. Incorporate understandings from local engagement into the development of the Local Mitigation Strategy (LMS) and the Comprehensive Plan.
Initiative
Adapt
Engage
Yes
Project
COM 1.1.4
Create a culture around climate hazards by initiating equitable and fun forms of community engagement based around extreme climatic events.
Initiative
Mitigate
Adapt
Engage
Administrative
COM 1.2
Educate the community about climate change through accessible and culturally aware forms of communication
Strategy
COM 1.2.1
Expand and promote programs such as Mangrove Marcus that Introduce youth to landscape systems through outreach opportunities and programs.
Initiative
Mitigate
Adapt
Engage
Yes
Administrative
COM 1.2.2
Create a communication channel designed to inform underserved communities.
Initiative
Mitigate
Adapt
Engage
Yes
Administrative
COM 1.2.3
Explain flood insurance and potential liabilities to property owners.
Initiative
Mitigate
Adapt
Engage
Yes
Administrative
COM 1.2.4
Create overlay zones that relate to future sea level rise projection.
Initiative
Adapt
Engage
Policy
COM 1.2.5
Create a real estate disclosure policy or property report card, using information from the Local Mitigation Strategy process.
Initiative
Adapt
Engage
Policy
COM 1.2.6
Create a climate resilience committee that includes local-level community representatives.
Initiative
Adapt
Engage
Administrative
COM 1.2.7
Expand the Resilient Tampa brand, for example, through Parks and Recreation at youth events.
Initiative
Mitigate
Adapt
Engage
Administrative
COM 2
PROMOTE TRAINING AND WORKFORCE DEVELOPMENT AROUND CLIMATE CHANGE
Goal
COM 2.1
Expand municipal green jobs training and opportunities
Strategy
COM 2.1.1
Develop training programs to prepare Tampanians for quality jobs supporting climate initiatives, such as urban forestry, energy efficiency programs, solar, and maintenance divisions, both mechanical and environmental.
Initiative
Mitigate
Adapt
Engage
Administrative
HABITAT AND ENVIRONMENT
ENV 1
CONSERVE AND INCREASE CARBON SINKS, WITH A FOCUS ON WETLANDS AND THE HYDROLOGIC SYSTEM
Goal
ENV 1.1
Explore opportunities to introduce nature-based solutions to the coastal edge
Strategy
ENV 1.1.1
Create a living shoreline master plan. Include opportunities where there are multiple repetitive loss properties and evaluate for restoration projects.
Initiative
Mitigate
Adapt
Engage
Study
ENV 1.1.2
Conduct a seawall and shoreline inventory. Include ownership, material, condition, and elevation on all properties. This can be completed as a unique study, through transfer of real estate, or through permitting services.
Initiative
Mitigate
Adapt
Engage
Study
ENV 1.1.3
Review and implement a version of the TBRPC living shoreline ordinance. Potentially including district overlays. Incorporate long-term strategies of incremental removal of seawalls and establishing living shorelines (on the Hillsborough River and along the coast).
Initiative
Mitigate
Adapt
Engage
Policy
ENV 1.1.4
Require habitat mitigation offset fees for future development of seawalls.
Initiative
Mitigate
Adapt
Engage
Policy
ENV 1.1.5
Establish no-interest loans for conversion of seawall to living shoreline.
Initiative
Mitigate
Adapt
Engage
Administrative
ENV 1.1.6
Coordinate opportunities to use dredge material with the upcoming Army Corps channelization project for the Port.
Initiative
Mitigate
Adapt
Engage
Study
ENV 1.1.7
Coordinate small pilot projects and monitoring to test resilience applications.
Initiative
Mitigate
Adapt
Engage
Project
ENV 1.2
Address water quality in the Bay
Strategy
ENV 1.2.1
Work with the Tampa Bay Estuary Program to create a plan that reduces nutrient loads for the benefit of seagress habitat in Tampa Bay.
Initiative
Mitigate
Adapt
Engage
Study
ENV 1.2.2
Study the Hillsborough River and its tributaries. Identify and prioritize projects to enhance water quality.
Initiative
Mitigate
Adapt
Engage
Study
ENV 1.2.3
Address minimum flows in the Hillsborough River.
Initiative
Mitigate
Adapt
Engage
Study
ENV 1.2.4
Fund water quality initiatives such as street sweeping, collection of oil, spill assistance programs, waste management, and other forms of pollution prevention.
Initiative
Mitigate
Adapt
Engage
Administrative
Initiatives and strategies for environmental and food programs, including policy level, mitigation, adaptation, engagement, and community voice.
CHAPTER/ CATEGORIES
INITIATIVE/DESCRIPTION
POLICY LEVEL
MITIGATE
ADAPT
ENGAGE
COMMUNITY VOICE
CATEGORY
ENV 1.2.5
Examine existing municipal properties and transition landscape plantings away from requiring fertilizer. New plantings on municipal lands near water bodies shall be accomplished in a way that does not require fertilizer.
Initiative
Mitigate
Policy
ENV 1.3
Develop elevated standards for habitat conservation
Strategy
ENV 1.3.1
Increase littoral edge standards in the Stormwater Manual, above SWFWMD requirements.
Initiative
Mitigate
Policy
ENV 1.3.2
Establish a wetland policy to protect critical ecosystems.
Initiative
Mitigate
Policy
ENV 2
REDUCE THE URBAN HEAT ISLAND EFFECT
Goal
ENV 2.1
Integrate approaches to address the urban heat island in all projects
Strategy
ENV 2.1.1
Integrate tree planting into public works and mobility projects, including a budget allocation toward tree installation and ongoing maintenance.
Initiative
Mitigate
Yes
Administrative
ENV 2.1.2
Inform the public about impacts from tree canopy loss and what they can do to help.
Initiative
Mitigate
Engage
Project
ENV 2.1.3
If form-based codes are developed, consider space requirements for trees and maximize canopy potential.
Initiative
Mitigate
Policy
ENV 2.2
Consider the impact of utilities on the urban tree canopy
Strategy
ENV 2.2.1
Move overhead utilities underground while accomplishing streetscape or other capital projects, for example PIPES projects.
Initiative
Mitigate
Project
ENV 2.2.2
Work with TECO to prioritize locations for underground utilities. Identify priority streets and/or neighborhoods and consider popular pedestrian and community corridors.
Initiative
Mitigate
Engage
Yes
Study
ENV 2.3
Strengthen the Parks and Recreation Department’s efforts to manage and expand Tampa’s tree canopy
Strategy
ENV 2.3.1
Establish new tree planting procurement methods for the Parks and Recreation Department.
Initiative
Mitigate
Administrative
ENV 2.3.2
Increase Tampa Parks and Recreation Department staff so that they can both maintain and expand the city’s tree canopy. Quantities are described in the 2021 Forestry Division Strategic Plan.
Initiative
Mitigate
Engage
Yes
Administrative
ENV 2.4
Implement the Urban Forestry Management Plan (2013)
Strategy
ENV 2.4.1
Consider the most appropriate personnel to administer the Urban Forestry Management Plan, whether the Planning Department or the Parks and Recreation Department.
Initiative
Mitigate
Administrative
ENV 2.5
Establish better data management processes within the City to track and monitor its canopy
Strategy
ENV 2.5.1
Enhance tree inventory methods by capturing parcel-level data through development and redevelopment permitting, especially pertaining to tree planting and removal.
Initiative
Mitigate
Administrative
ENV 2.6
Focus efforts on tree planting, especially where urban heat islands exist
Strategy
ENV 2.6.1
Follow guidance for hiring and equipment purchasing from the Forestry Division Strategic Plan.
Initiative
Mitigate
Administrative
ENV 2.6.2
Hold community events to distribute trees.
Initiative
Mitigate
Engage
Project
ENV 2.6.3
Develop and fund a reforestation program to work with large property owners to plant surplus lands with canopy trees.
Initiative
Mitigate
Administrative
ENV 2.6.4
Create a study to prioritize locations to plant trees in public property and rights of way.
Initiative
Mitigate
Study
FOOD
F 1
SUPPORT AND PROMOTE LOCAL FOOD PROGRAMS
Goal
F 1.1
Continue to work with regional organizations that provide food to those in need
Strategy
F1.1.1
Distribute program information at targeted outreach events.
Initiative
Mitigate
Engage
Administrative
F1.1.2
Create a liaison to work between community outreach and food programs.
Initiative
Mitigate
Engage
Administrative
F 2
INCREASE LOCAL FOOD ASSETS
Goal
F 2.1
Explore opportunities for the City to develop food resources on publicly owned lands
Strategy
F 2.1.1
Evaluate opportunities to establish community gardens through the Parks and Recreation Department.
Initiative
Mitigate
Engage
Administrative
F 2.1.2
Pilot a food hall market within a food desert. Use City-owned property, providing the infrastructure for local farmers and approved gardeners to sell their food.
Initiative
Mitigate
Engage
Project
F 2.2
Make land use changes to allow for localized food production and distribution
Strategy
F 2.2.1
Approve zoning changes that support grocery store development in residential areas, such as increasing density and integrating mixed use into neighborhoods that can sustain commercial programming.
Initiative
Mitigate
Engage
Policy
F 2.3
Connect Tampanians to expert resources related to food production
Strategy
F 2.3.1
Promote University of Florida Extension Agency educational programs through City marketing and communications.
Initiative
Mitigate
Engage
Project
Governance goals, strategies, and initiatives for climate action, revenue, planning, and data management.
Category
Action
Description
Type
Mitigate
Adapt
Engage
Administrative/Policy/Study
GOVERNANCE
GOV 1
STRENGTHEN COORDINATION BETWEEN DEPARTMENTS
Goal
GOV 1.1
Review and assess opportunities for collaboration and integration of climate action initiatives
Strategy
GOV 1.1.1
Create a position to coordinate Resilient Tampa and Climate Action and Equity Plan goals. This person will review projects and work to identify, in the development phase, opportunities to integrate sustainability and resilience goals.
Initiative
Mitigate
Adapt
Engage
Administrative
GOV 1.1.2
Complete a comprehensive review of existing policies and programmatic approaches within each department.
Initiative
Mitigate
Adapt
Study
GOV 1.1.3
Coordinate the integration of climate action initiatives into all department planning, for example the Parks and Recreation Master Plan or Wastewater Master Plans, using the Climate Action Categories as a checklist for project opportunities.
Initiative
Mitigate
Adapt
Engage
Administrative
INCREASE REVENUE TO FUND CLIMATE ACTION
GOV 2
INCREASE REVENUE TO FUND CLIMATE ACTION
Goal
GOV 2.1
Create fees for projects that defer climate costs
Strategy
GOV 2.1.1
Explore the potential to build mitigation and adaptation funds through policies such as a green building ordinance or a coastline protection mitigation fee for new sea wall projects.
Initiative
Mitigate
Adapt
Policy
GOV 2.1.2
Work with communities to create self- assessed climate funds through overlay districts, based on future needs and community planning strategies.
Initiative
Mitigate
Adapt
Engage
Policy
GOV 2.2
Orient plans toward funding opportunities, and incorporate opportunities within plans
Strategy
GOV 2.2.1
For new projects, allocate a percentage of scoping to identify resilience components that align with state or federal funding opportunities.
Initiative
Mitigate
Adapt
Policy
CREATE PLACE-BASED PLANNING FRAMEWORKS
GOV 3
CREATE PLACE-BASED PLANNING FRAMEWORKS
Goal
GOV 3.1
Create overlay districts to establish community goals and funding strategies
Strategy
GOV 3.1.1
Locate and develop Adaptation Action Areas.
Initiative
Mitigate
Adapt
Engage
Policy
GOV 3.1.2
Create planning overlay zones that relate to future sea-level rise impacts.
Initiative
Mitigate
Adapt
Engage
Policy
EXPAND DATA AND ANALYSIS CAPABILITIES WITHIN CITY PLANNING AND OPERATIONS
GOV 4
EXPAND DATA AND ANALYSIS CAPABILITIES WITHIN CITY PLANNING AND OPERATIONS
Goal
GOV 4.1
Gather parcel-level data and integrate into GIS platforms
Strategy
GOV 4.1.1
Digitize elevation certificates and integrate into geographic information systems.
Initiative
Mitigate
Adapt
Engage
Administrative
GOV 4.1.2
Include tree planting and demolition information in a coordinated GIS database.
Initiative
Mitigate
Adapt
Administrative
GOV 4.1.3
Hire a data manager.
Initiative
Mitigate
Adapt
Administrative
PLAN FOR THE FUTURE
GOV 5
PLAN FOR THE FUTURE
Goal
GOV 5.1
Integrate future conditions into all planning and capital improvement projects
Strategy
GOV 5.1.1
Create future planning guidance through the Post Disaster Redevelopment Plan.
Initiative
Adapt
Study
GOV 5.1.2
Use future conditions for capital improvement projects and permitting.
Initiative
Mitigate
Adapt
Policy
REFERENCES
Back, Oliver. (2019). Green Streets: Which City has the Most Trees. The Guardian. Web, accessed November 23, 2022. Retrived from http:// senseable.mit.edu/news/pdfs/20191105_TheGuardian.pdf
Banse, Tom. (2014). Cannon Beach 5k Injects Fun Into Tsunami Readiness. For the Northwest News Network. Web, accessed November 29, 2022. Retrived from https://www.nwnewsnetwork. org/disasters-and-accidents/2014-09-29/cannon-beach-5k-injects-fun-into-tsunami-readiness
Barry, Rebecca. (September 2, 2022). Summer 2022 Was Warmest on Record for Tampa. For WFLA. Web, accessed November 29, 2022. Retrieved from https://www.wfla.com/weather/ summer-2022-was-warmest-on-record-for-tampa/#:~:text=TAMPA%2C%20Fla.,average%20temperature%20of%2085.7%C2%B0
Broward County. (2017). Broward County Future Conditions Average Wet Season Groundwater Elevation Map. Web, accessed February 2, 2023. Retrieved from https://www.broward.org/water-resources/Documents/futuregwelev.pdf
City of Charlotte. (2018). “Circular Charlotte: Towards a zero waste and inclusive city.” Web, accessed February 2, 2023.Retrieved from https://charlottenc.gov/SWS/CircularCharlotte/Documents/Circular%20Charlotte_Towards%20a%20zero%20waste%20and%20 inclusive%20city%20-%20full%20report.pdf
City of San Francisco. (2019). Sea Level Rise Vulnerability and Consequences Assessment Executive Summary. Web, accessed February 2, 2023. Retrieved from https://default.sfplanning.org/ plans-and-programs/planning-for-the-city/sea-level-rise/SLRVCA_ Report_Executive_Summary.pdf#page=2
City of San Francisco. (2022). City and County of San Francisco Bayview South / Hunters Point Ground Elevations in Feed-NAVD88. Web, accessed February 2, 2023. Retrieved from https:// www.dropbox.com/sh/yo2a913ru907csq/AADfmSpbowES1StILCW5PPRma/DEM/SF_DEM_SLRVZ_neighborhood_1.html?dl=0
City of Tampa. (2021a). Greenhouse Gas Inventory: Government Operations and City-Wide. Web, accessed February 2, 2023. Retrieved from https://www.tampa.gov/document/city-tampa-greenhouse-gas-inventory-86621
City of Tampa. (2021b). Resilient Tampa, Transforming Our City’s Tomorrow. Web, accessed February 2, 2023. R etrieved from https:// www.tampa.gov/sites/default/files/document/2021/Resilient%20 Tampa.pdf
City of Tampa. (2021c). Regulatory Approach to Sea Level Rise. Web, accessed February 2, 2023. Retrieved from https://www.tam-pa.gov/city-planning/sea-level-rise-study#:~:text=The%20City%20 of%20Tampa%20has,key%20recommendations%20for%20resilience%20planning.
City of Tampa Water Department. (2022). Fast Facts. Website, accessed November 4, 2022. https://www.tampa.gov/water/about-us/ water-department-fast-facts
Climate Science Advisory Panel. (2019). Recommended Projections of Sea Level Rise in the Tampa Bay Region (Update). Web, accessed February 2, 2023. Retrieved from https://www.tbrpc.org/wp-content/ uploads/2019/07/CSAP_SLR_Recommendation_2019_Final.pdf
Federal Emergency Management Agency (FEMA). (2011). A Whole Community Approach to Emergency Management: Principles, Themes, and Pathways for Action. Web, accessed February 2, 2023. Retrieved from https://www.fema.gov/sites/default/ files/2020-07/whole_community_dec2011__2.pdf
Federal Emergency Management Agency (FEMA). (2018). Natural Hazard Mitigation Saves Interim Report. Federal Insurance and Mitigation Administration. Retrieved from https://www.fema.gov/sites/ default/files/2020-07/fema_mitsaves-factsheet_2018.pdf
Geier, Ben. (2021, July 27). Places where people spend the most on transportation - 2021 edition. SmartAsset. Web, accessed February 2, 2023. Retrieved from https://smartasset.com/data-studies/trans-portation-spending-2021
Gonzalez, Tatiana. (2020). Development in the Coastal High Hazard Area (CHHA). For the Hillsborough County City-County Planning Commission. Web, accessed February 2, 2023. Retrieved from https://planhillsborough.org/wp-content/uploads/2021/02/Development-in-the-CHHA-report_FINAL.pdf
Hall, Timothy M., et al. (2021). U.S. Tropical Cyclone Activity in the 2030s Based on Projected Changes in Tropical Sea Surface Temperature. Journal of Climate, vol. 34, no. 4, 20 Jan. 2021, pp. 1321–1335., Web, accessed February 2, 2023. Retrieved from https://doi.org/10.1175/jcli-d-20-0342.1
Hillsborough County. (2020). Local Mitigation Strategy 2020 Plan Update. Web, accessed February 2, 2023. Retrieved from https:// www.hillsboroughcounty.org/library/hillsborough/media-center/ documents/lms/plans/countywide-local-mitigation-strategy.pdf
Landry, S., Koeser, A., Northrop, R., McLean, D., Donovan, G, Andreu, M. & Hilbert, D. (2018). City of Tampa Tree Canopy and Urban Forest Analysis 2016. Tampa, FL. City of Tampa, Forida.
Litman, Todd. (2016). Determining Optimal Urban Expansion, Population and Vehicle Density, and Housing Types for Rapidly Growing Cities. World Conference on Transport Research - WCTR 2016 Shanghai, 10-15 July. Web, accessed February 2, 2023. Retrieved from https://www.vtpi.org/WCTR_OC.pdf
Mayclin, Danni. (2018). Air Conditioning Accounts for about 12% of U.S. Home Energy Expenditures. Today in Energy - U.S. Energy Information Administration (EIA), U.S. Energy Information Administration, 23 July 2018. Web, accessed February 2, 2023. Retrieved from https://www.eia.gov/todayinenergy/detail.php?id=36692.
Mulligan, Michaela. (2022). Think This Summer Felt Hot? Just Wait, Tampa Bay. For the Tampa Bay Times. Web, accessed February 2, 2023. Retrieved from https://www.tampabay.com/weather/2022/09/24/think-this-summer-felt-hot-just-wait-tampa-bay/
New York City. (2021). Zoning for Coastal Flood Resiliency. Web, accessed February 2, 2023. Retrieved from https://www.nyc.gov/site/planning/plans/flood-resilience-zoning-text-update/flood-resilience-zoning-text-update.page and https://www.nyc.gov/as-sets/planning/download/pdf/plans-studies/flood-resiliency-update/proposal-slides.pdf
NOAA. (2022a). Coastal Blue Carbon. Web, accessed 11/2/2022. Retrieved from https://oceanservice.noaa.gov/hazards/sealev-elrise/sealevelrise-tech-report.htmlhttps://oceanservice.noaa.gov/ecosystems/coastal-blue-carbon/#:~:text=Salt%20marshes%2C%20mangroves%2C%20and%20seagrass,hundreds%20to%20thousands%20of%20years
Solar Energy Industries Association. (n.d.). Land Use & Solar Development. SEIA. Web, accessed February 2, 2023.Retrieved from https://www.seia.org/initiatives/land-use-solar-development
Transportation Advisory Team. (2019). Transforming Tampa’s Tomorrow, Recommendations and Final Report. Web, accessed February 2, 2023. Retrieved from https://www.tampa.gov/document/transportation-advisory-team-recommendations-report-31011
University of South Florida. (2020). Vulnerability Report. University of South Florida. Hillsborough County Community Vulnerability Study. June, 2020
Urban Land Institute. (2021). Tampa, Florida vTAP: Reinventing Stormwater Retention Areas as Green, Equitable Community Assets. Web, accessed February 2, 2023. Retrieved from https://knowledge.uli.org/en/Reports/TAP/2021/Tampa%20FL%20vTAP
United States Census Bureau. (2021). America Recycles Day: November 15, 2021. Website, accessed November 7, 2022. Retrieved from https://www.census.gov/newsroom/stories/america-recycles-day.html
United States Census Bureau. (web, accessed November 4, 2021). 2020 U.S. Gazetteer Files. Retreived from https://www.census.gov/geographies/reference-files/time-series/geo/gazetteer-files.2020.html#list-tab-NGUU7Y9APHJZCW4B10. Archived from the original on March 18, 2021. Retrieved November 4, 2021.
U.S. Bureau of Labor Statistics. (2022, September 29). Consumer expenditures in the Tampa Metropolitan Area - 2020–21 : Southeast Information Office. U.S. Bureau of Labor Statistics. Web, accessed February 2, 2023. Retrieved from https://www.bls.gov/re-gions/southeast/news-release/consumerexpenditures_tampa.htm
USGCRP. (2018). Impacts, Risks, and Adaptation in the United States: Fourth National Climate Assessment, Volume II: [Reidmiller, D.R., C.W. Avery, D.R. Easterling, K.E. Kunkel, K.L.M. Lewis, T.K. Maycock, and B.C. Stewart (eds.)]. U.S. Global Change Research Program, Washington, DC, USA, 1515 pp. doi: 10.7930/NCA4.2018.
Vogel, R. M., Yaindl, C., & Walter, M. (2011). Nonstationarity: Flood magnification and recurrence reduction factors in the United States1. JAWRA Journal of the American Water Resources Association, 47(3). https://doi.org/10.1111/j.1752-1688.2011.00541.x
Water Department. (2020, December 4). Water department fast facts. City of Tampa. Web, accessed February 2, 2023. Retrieved November 4, 2022, from https://www.tampa.gov/water/about-us/water-department-fast-facts#our-production-process--2
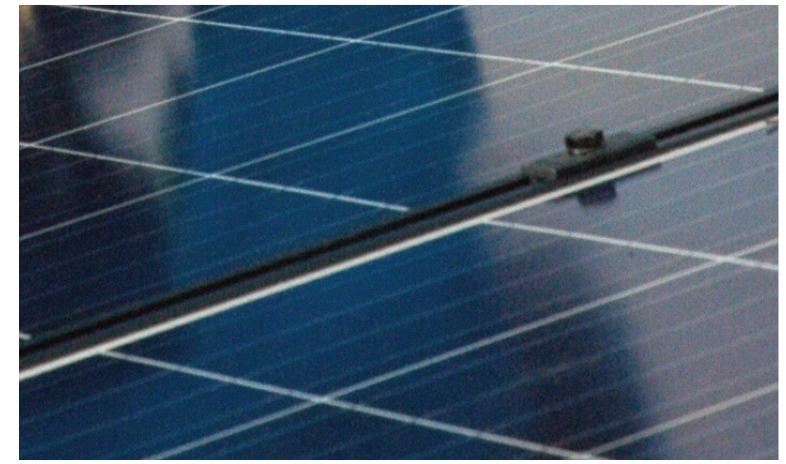
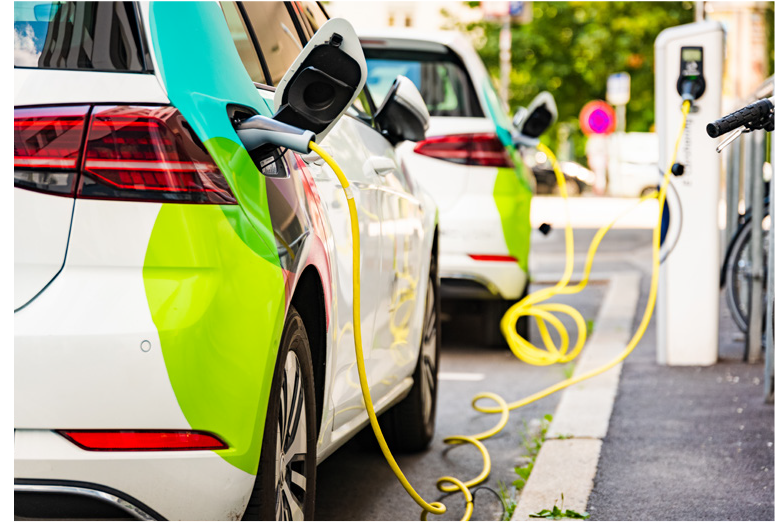
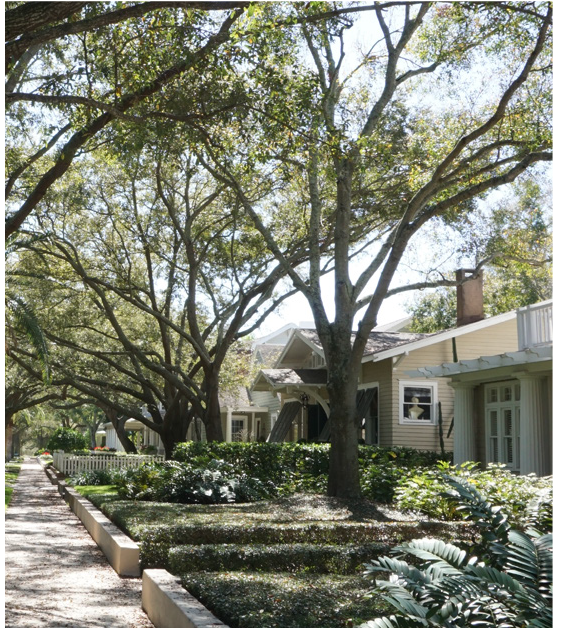
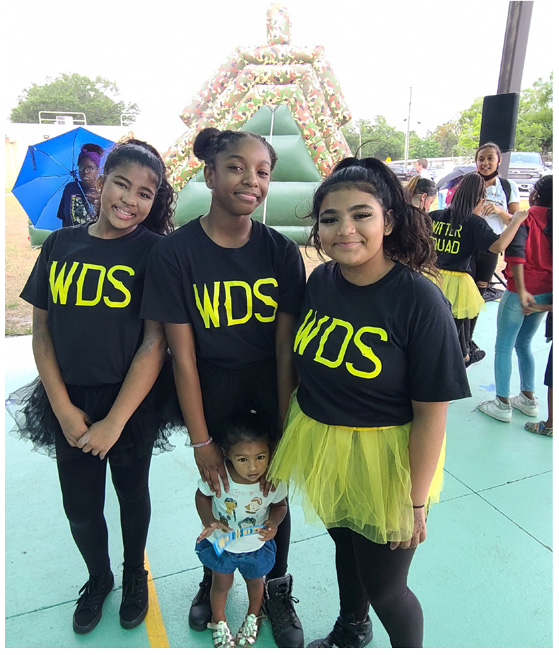
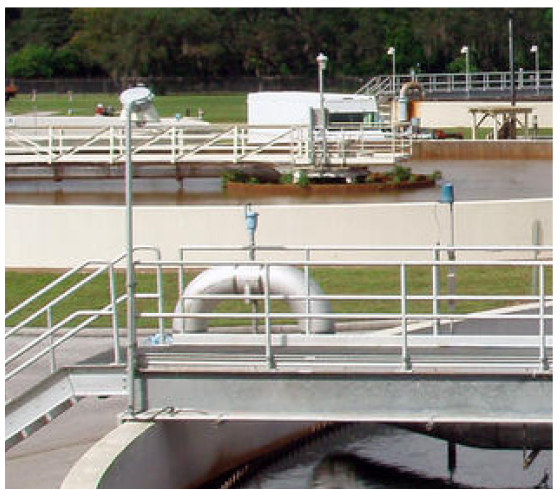
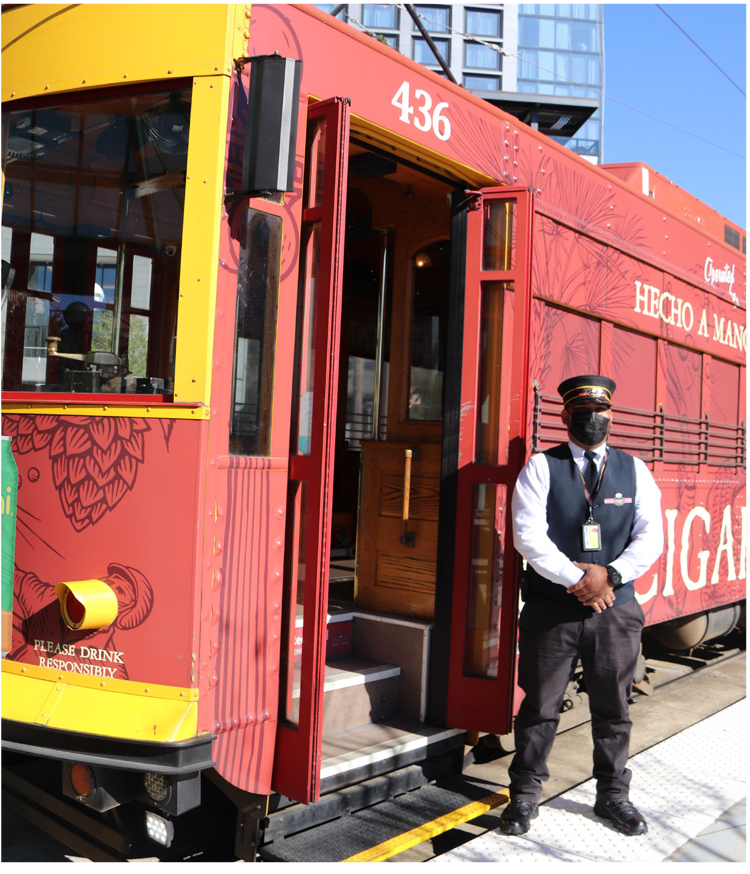
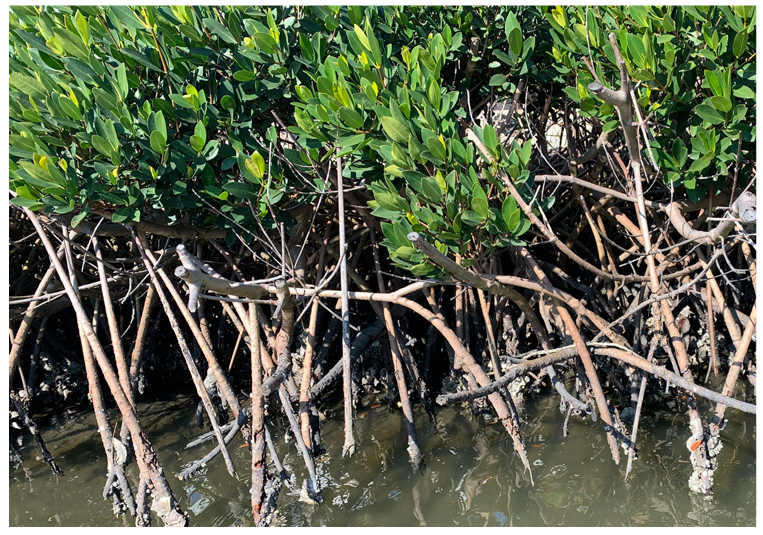
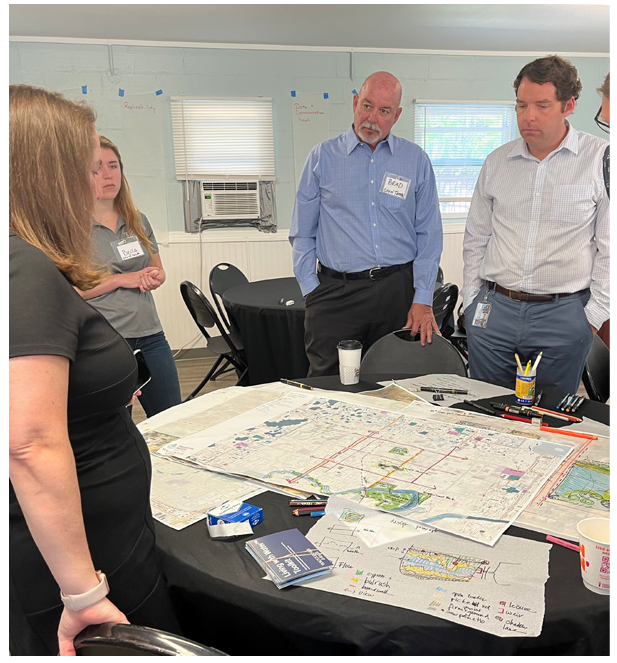
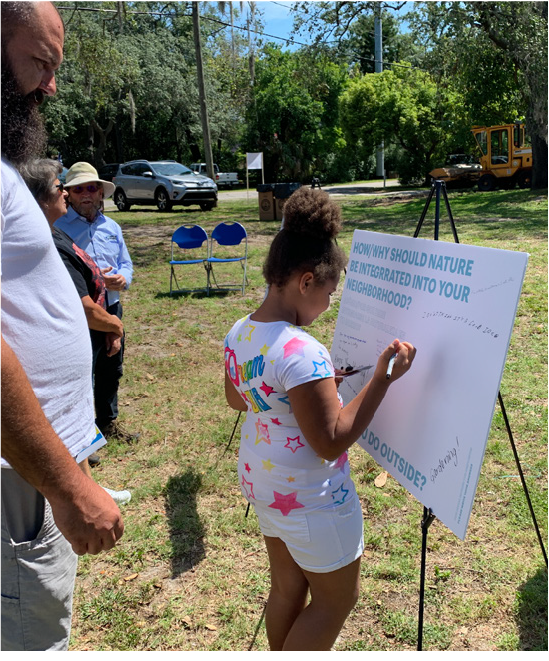
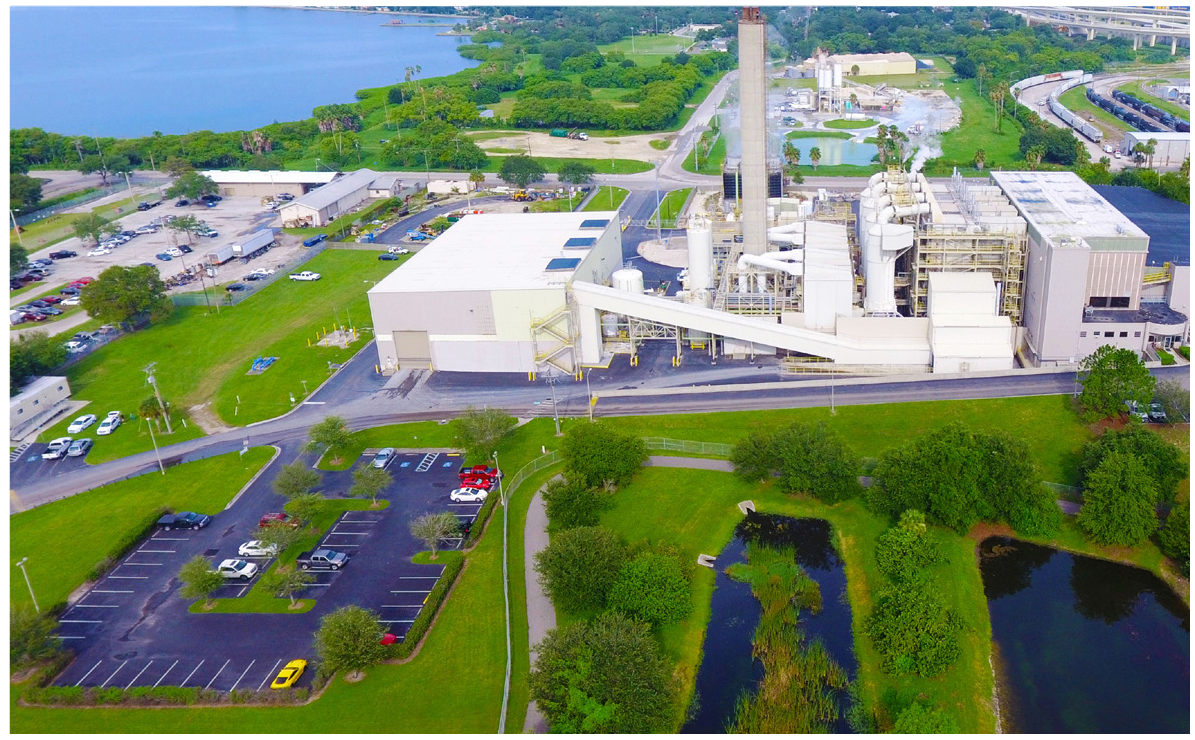
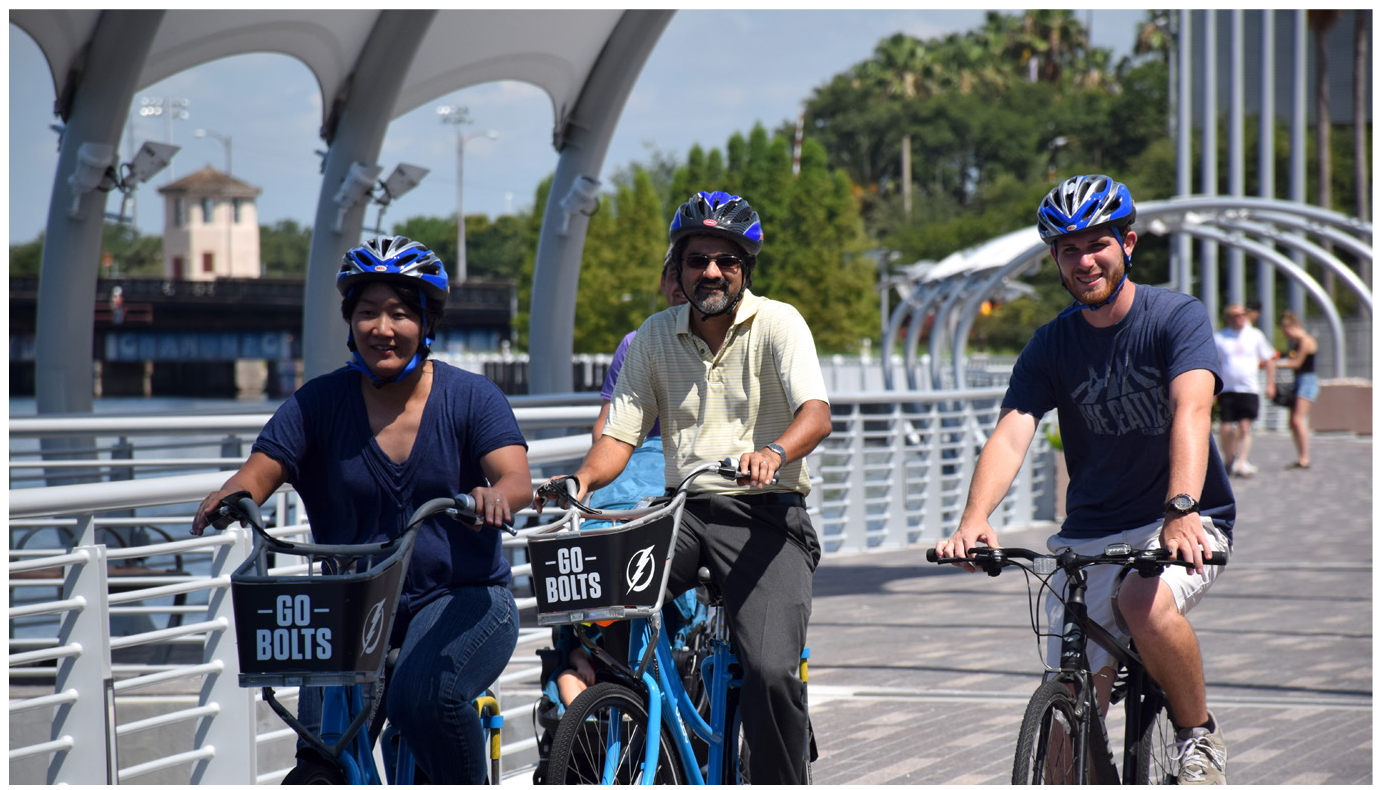
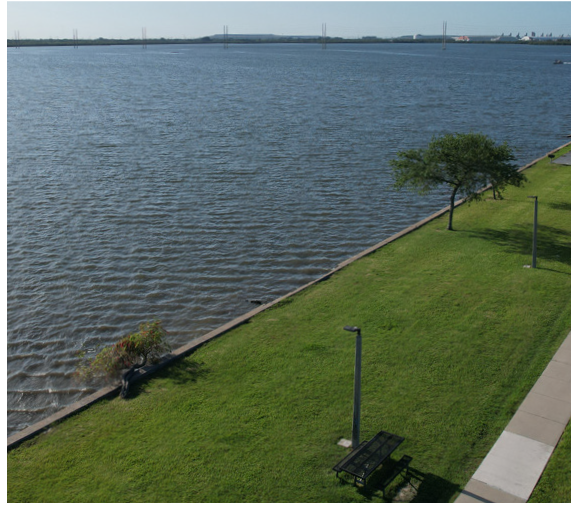
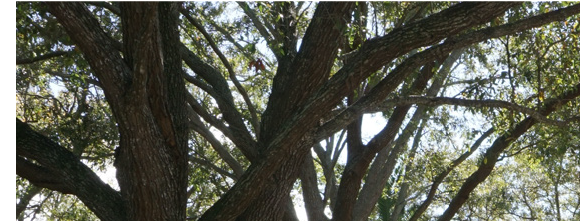
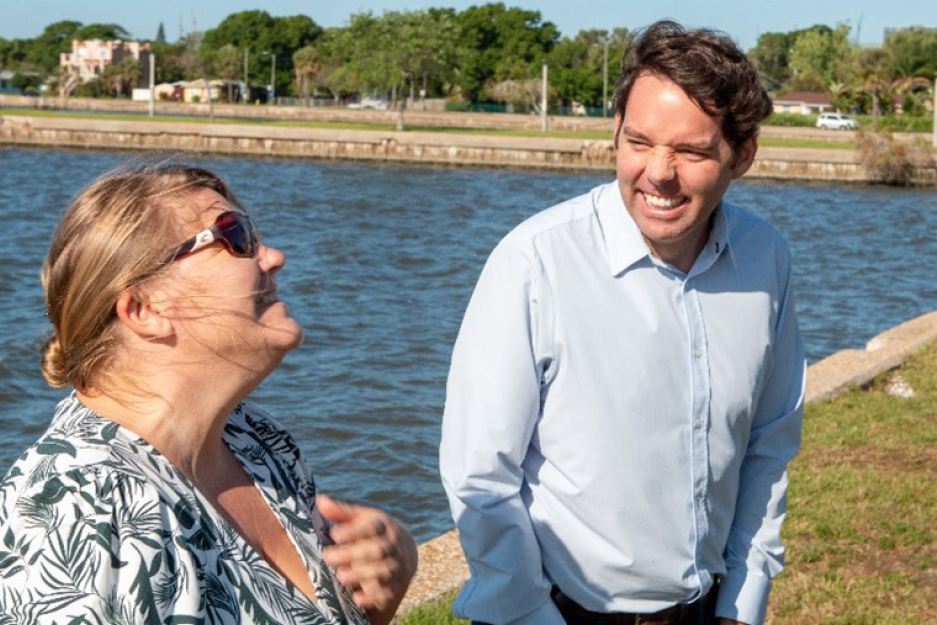



















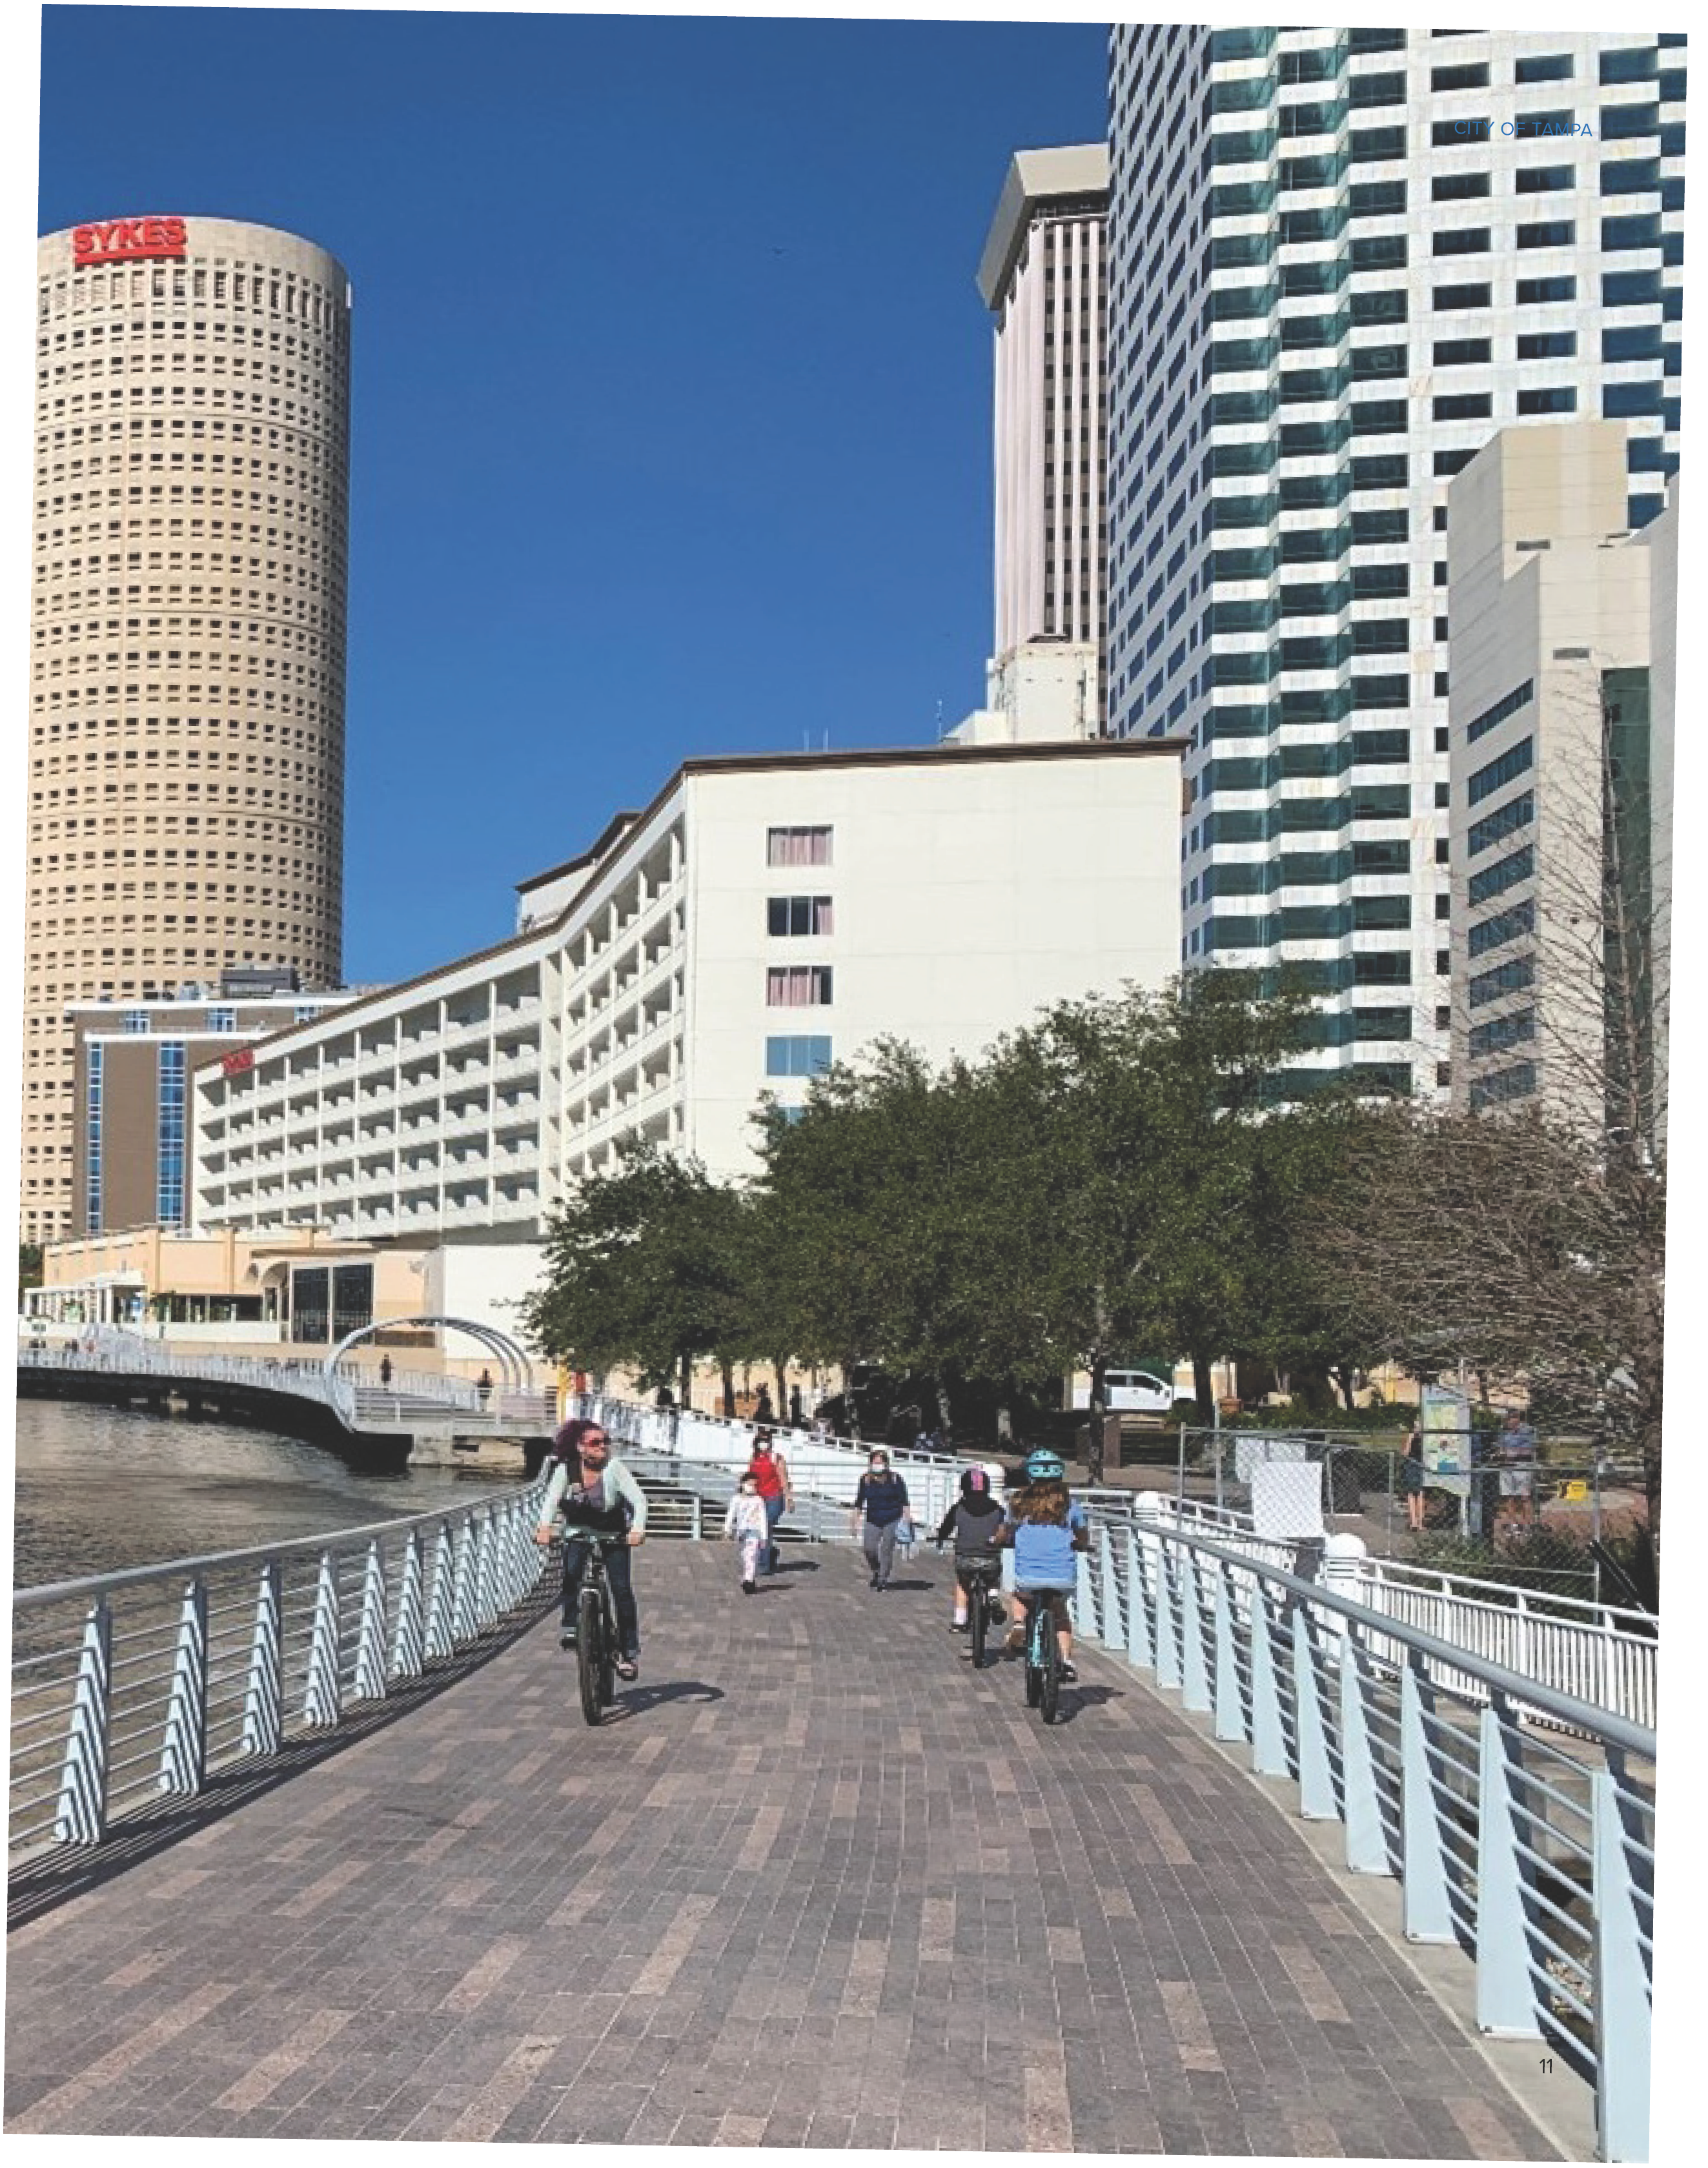
 Opportunity for All Tampanians
 Thriving Neighborhoods
 Climate-Ready Infrastructure
 Growing and Connected City
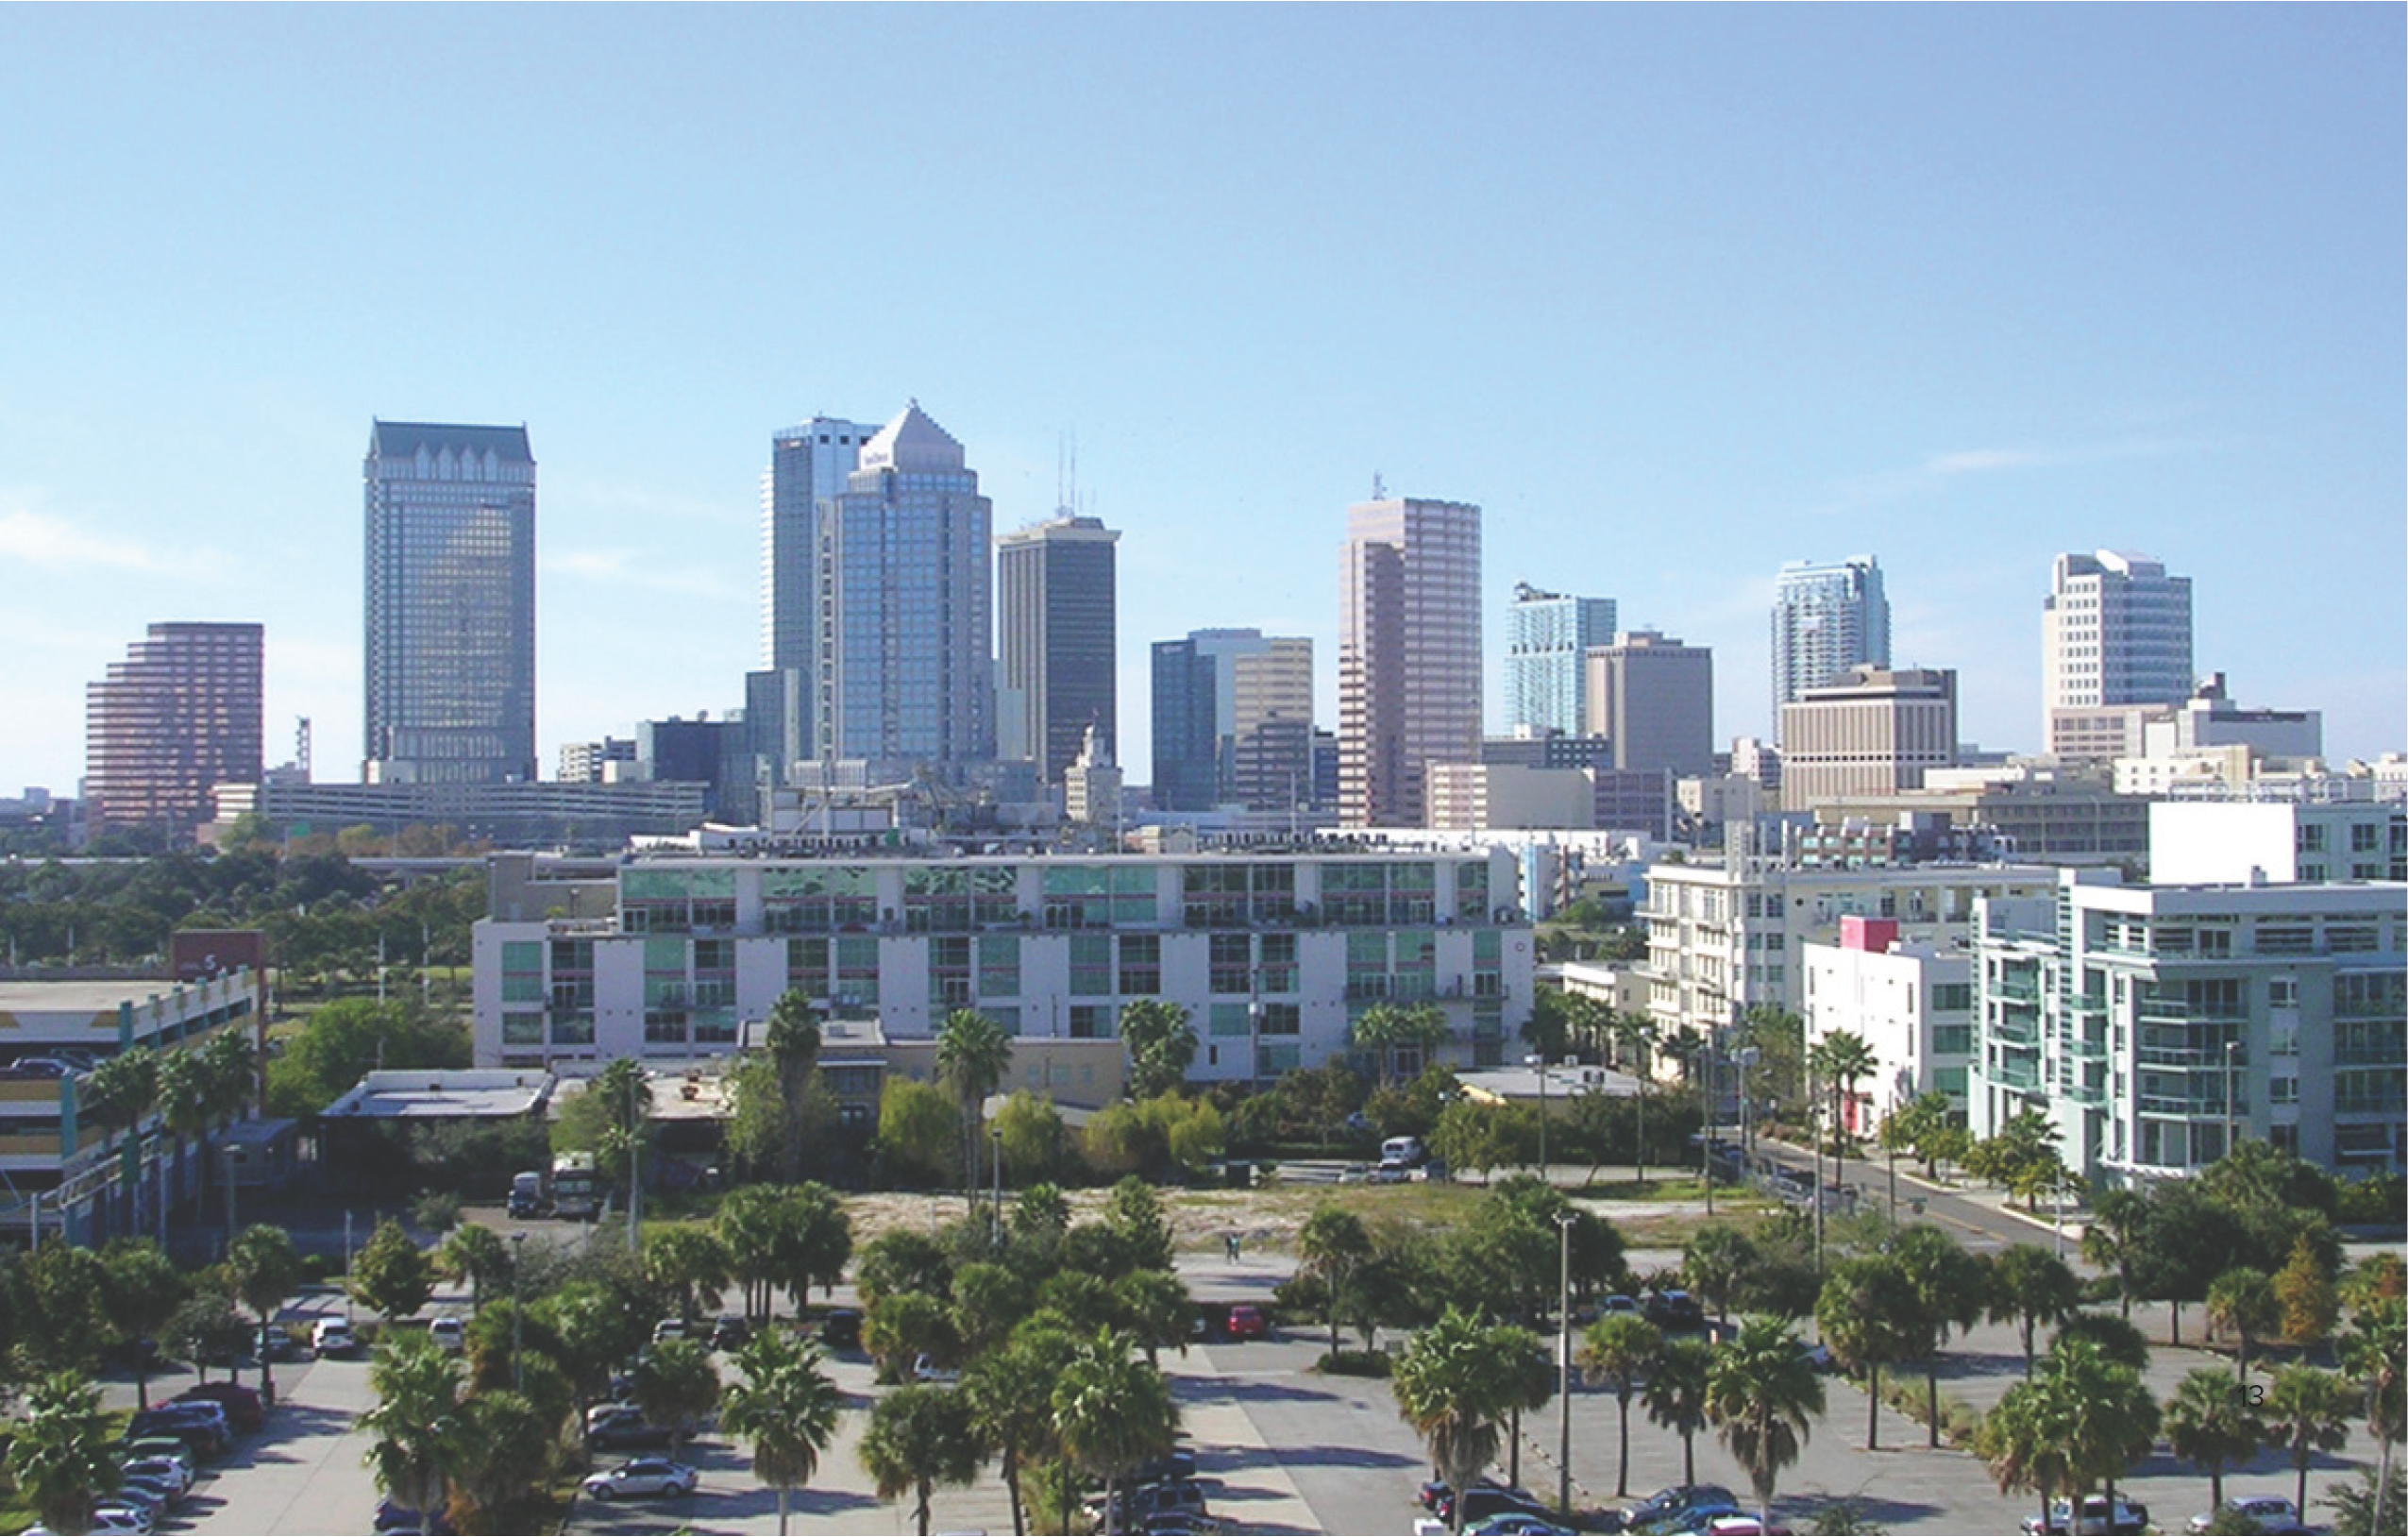




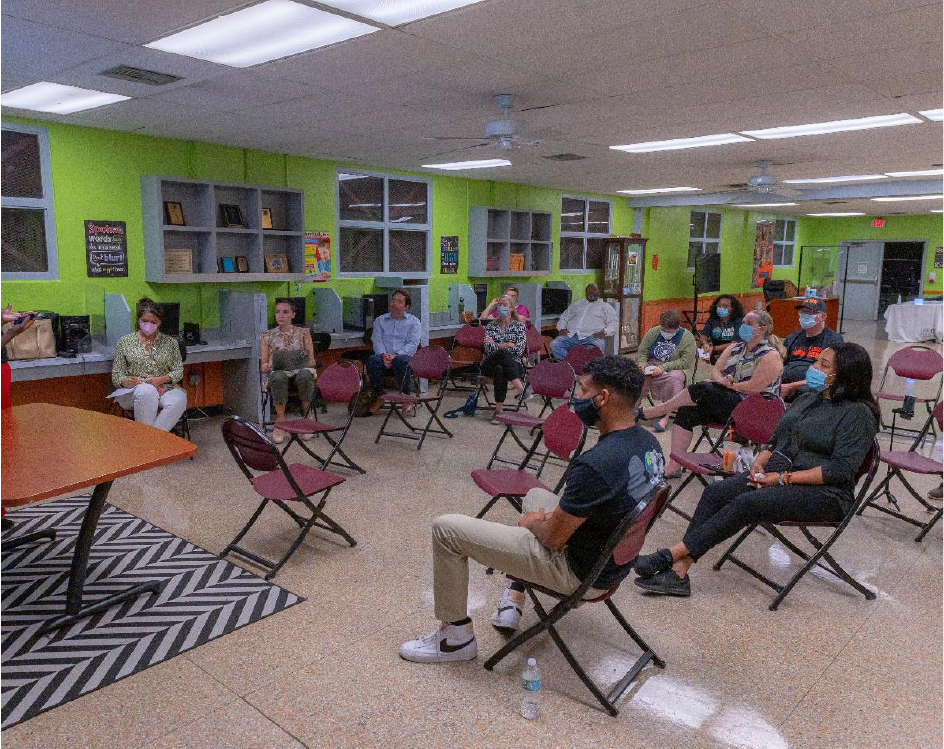
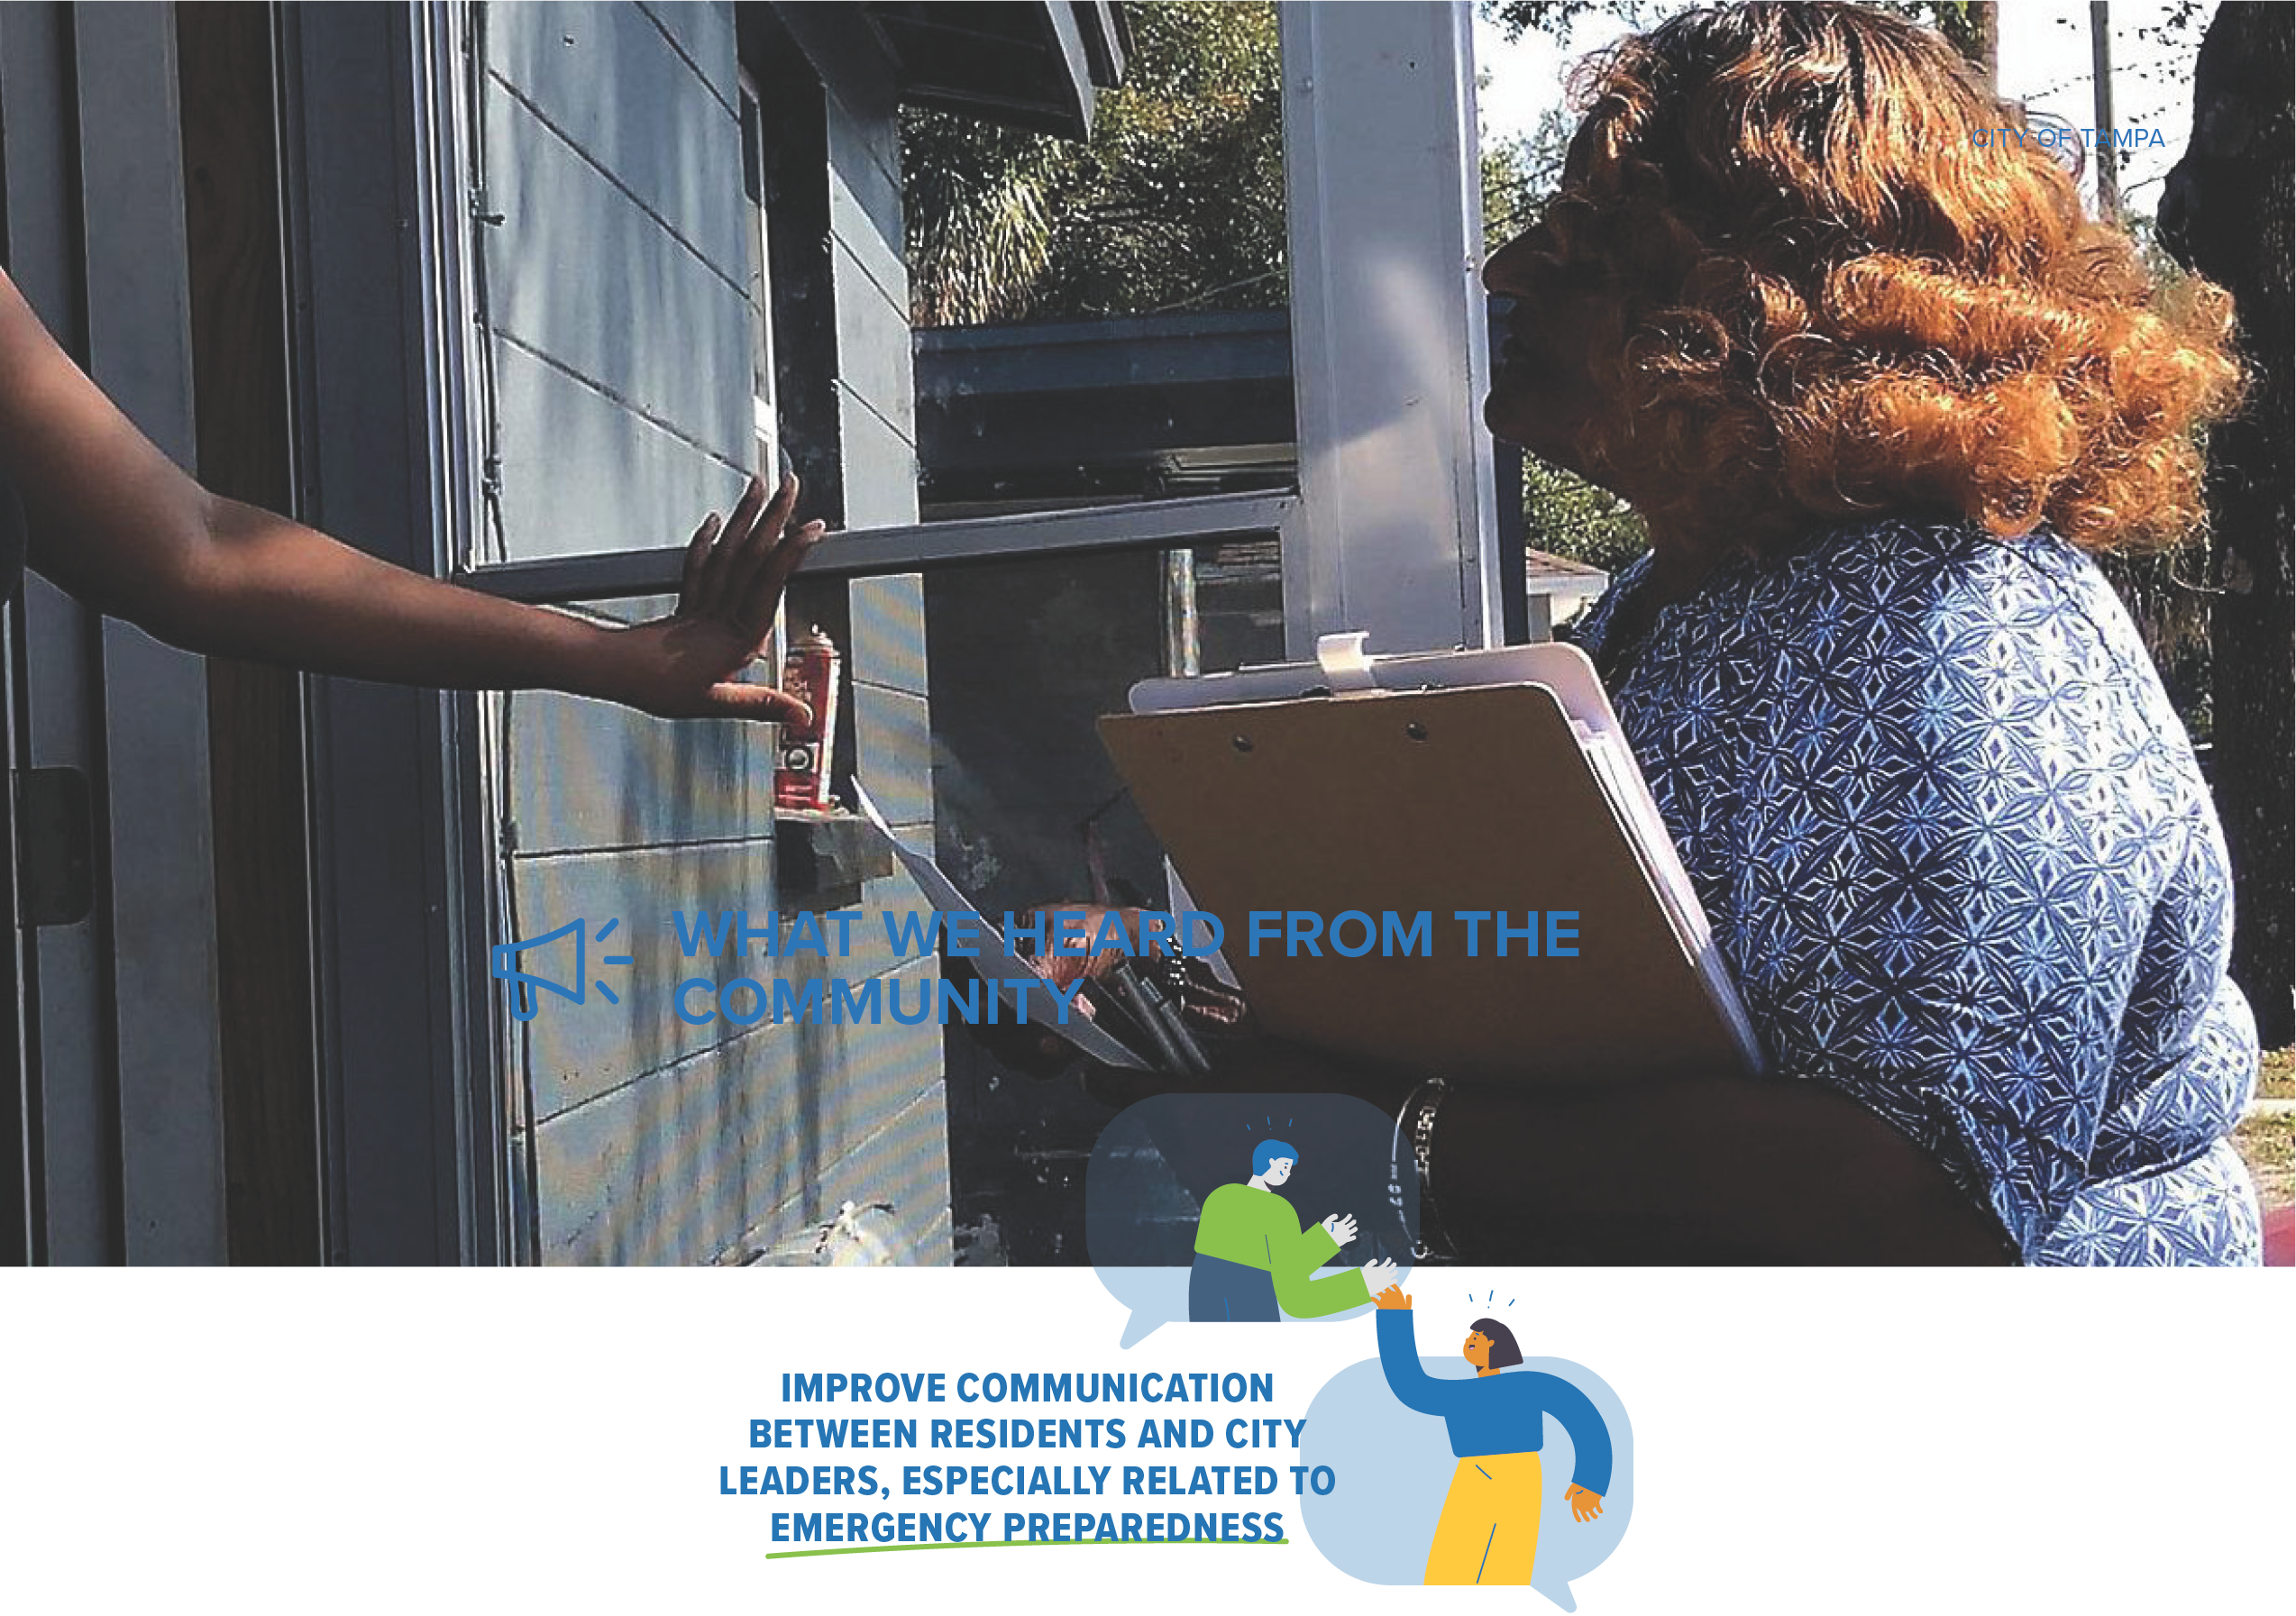
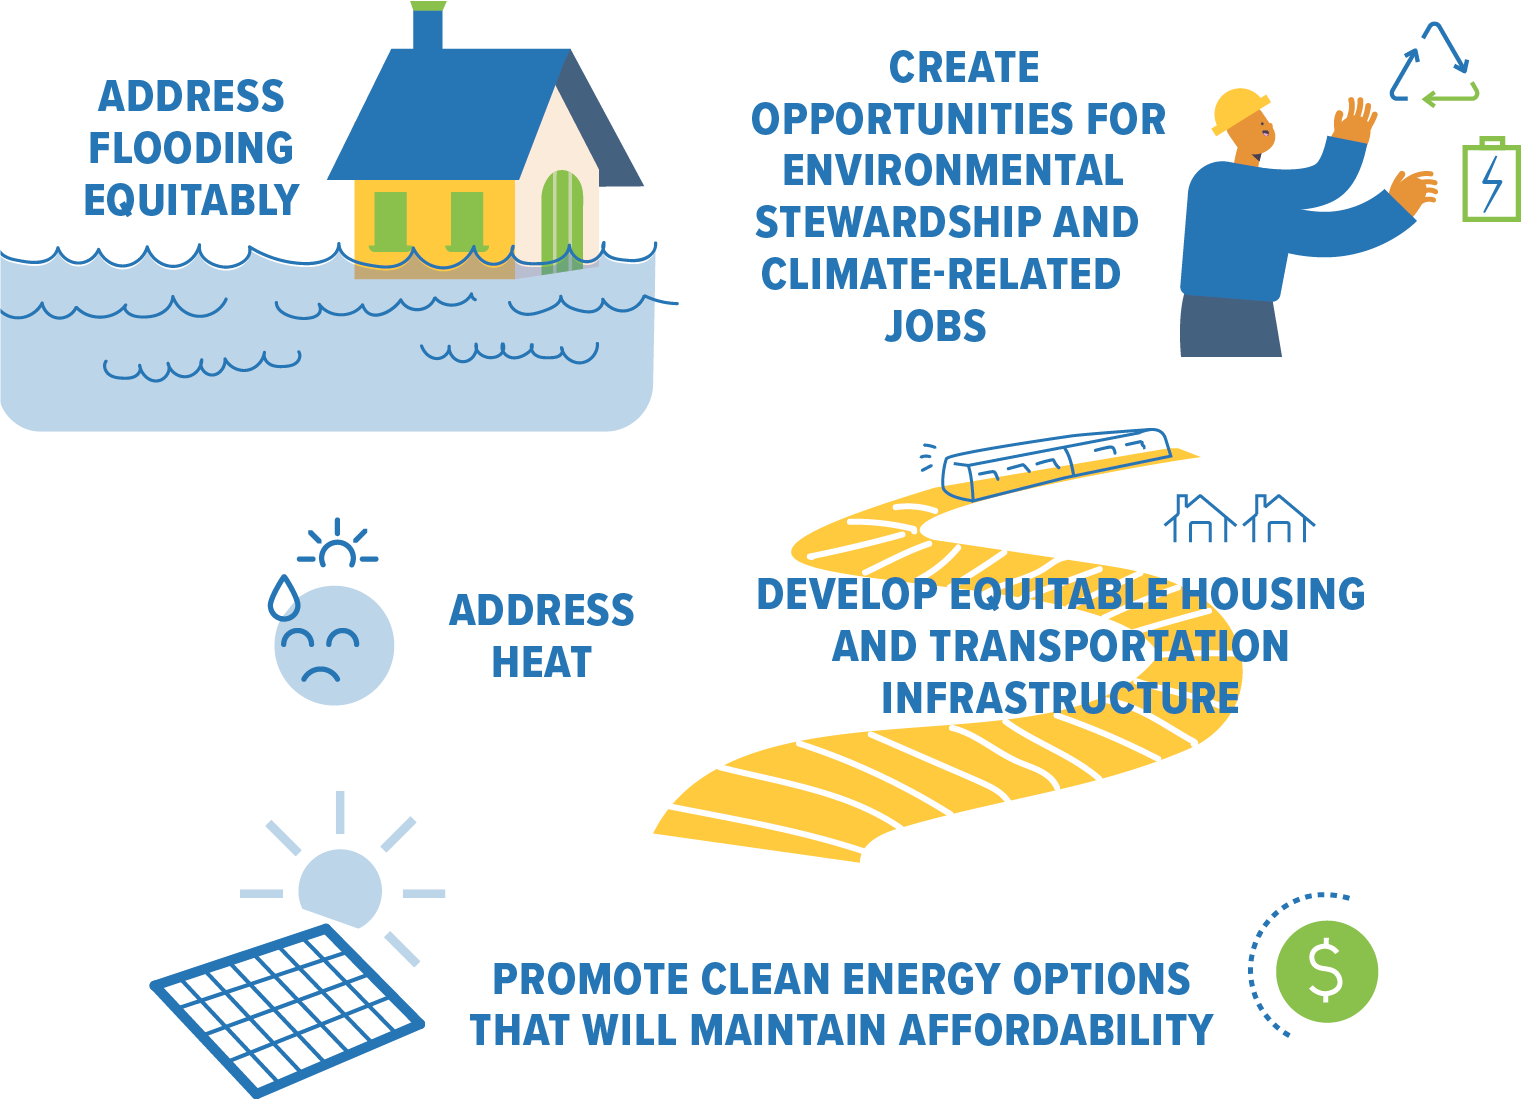

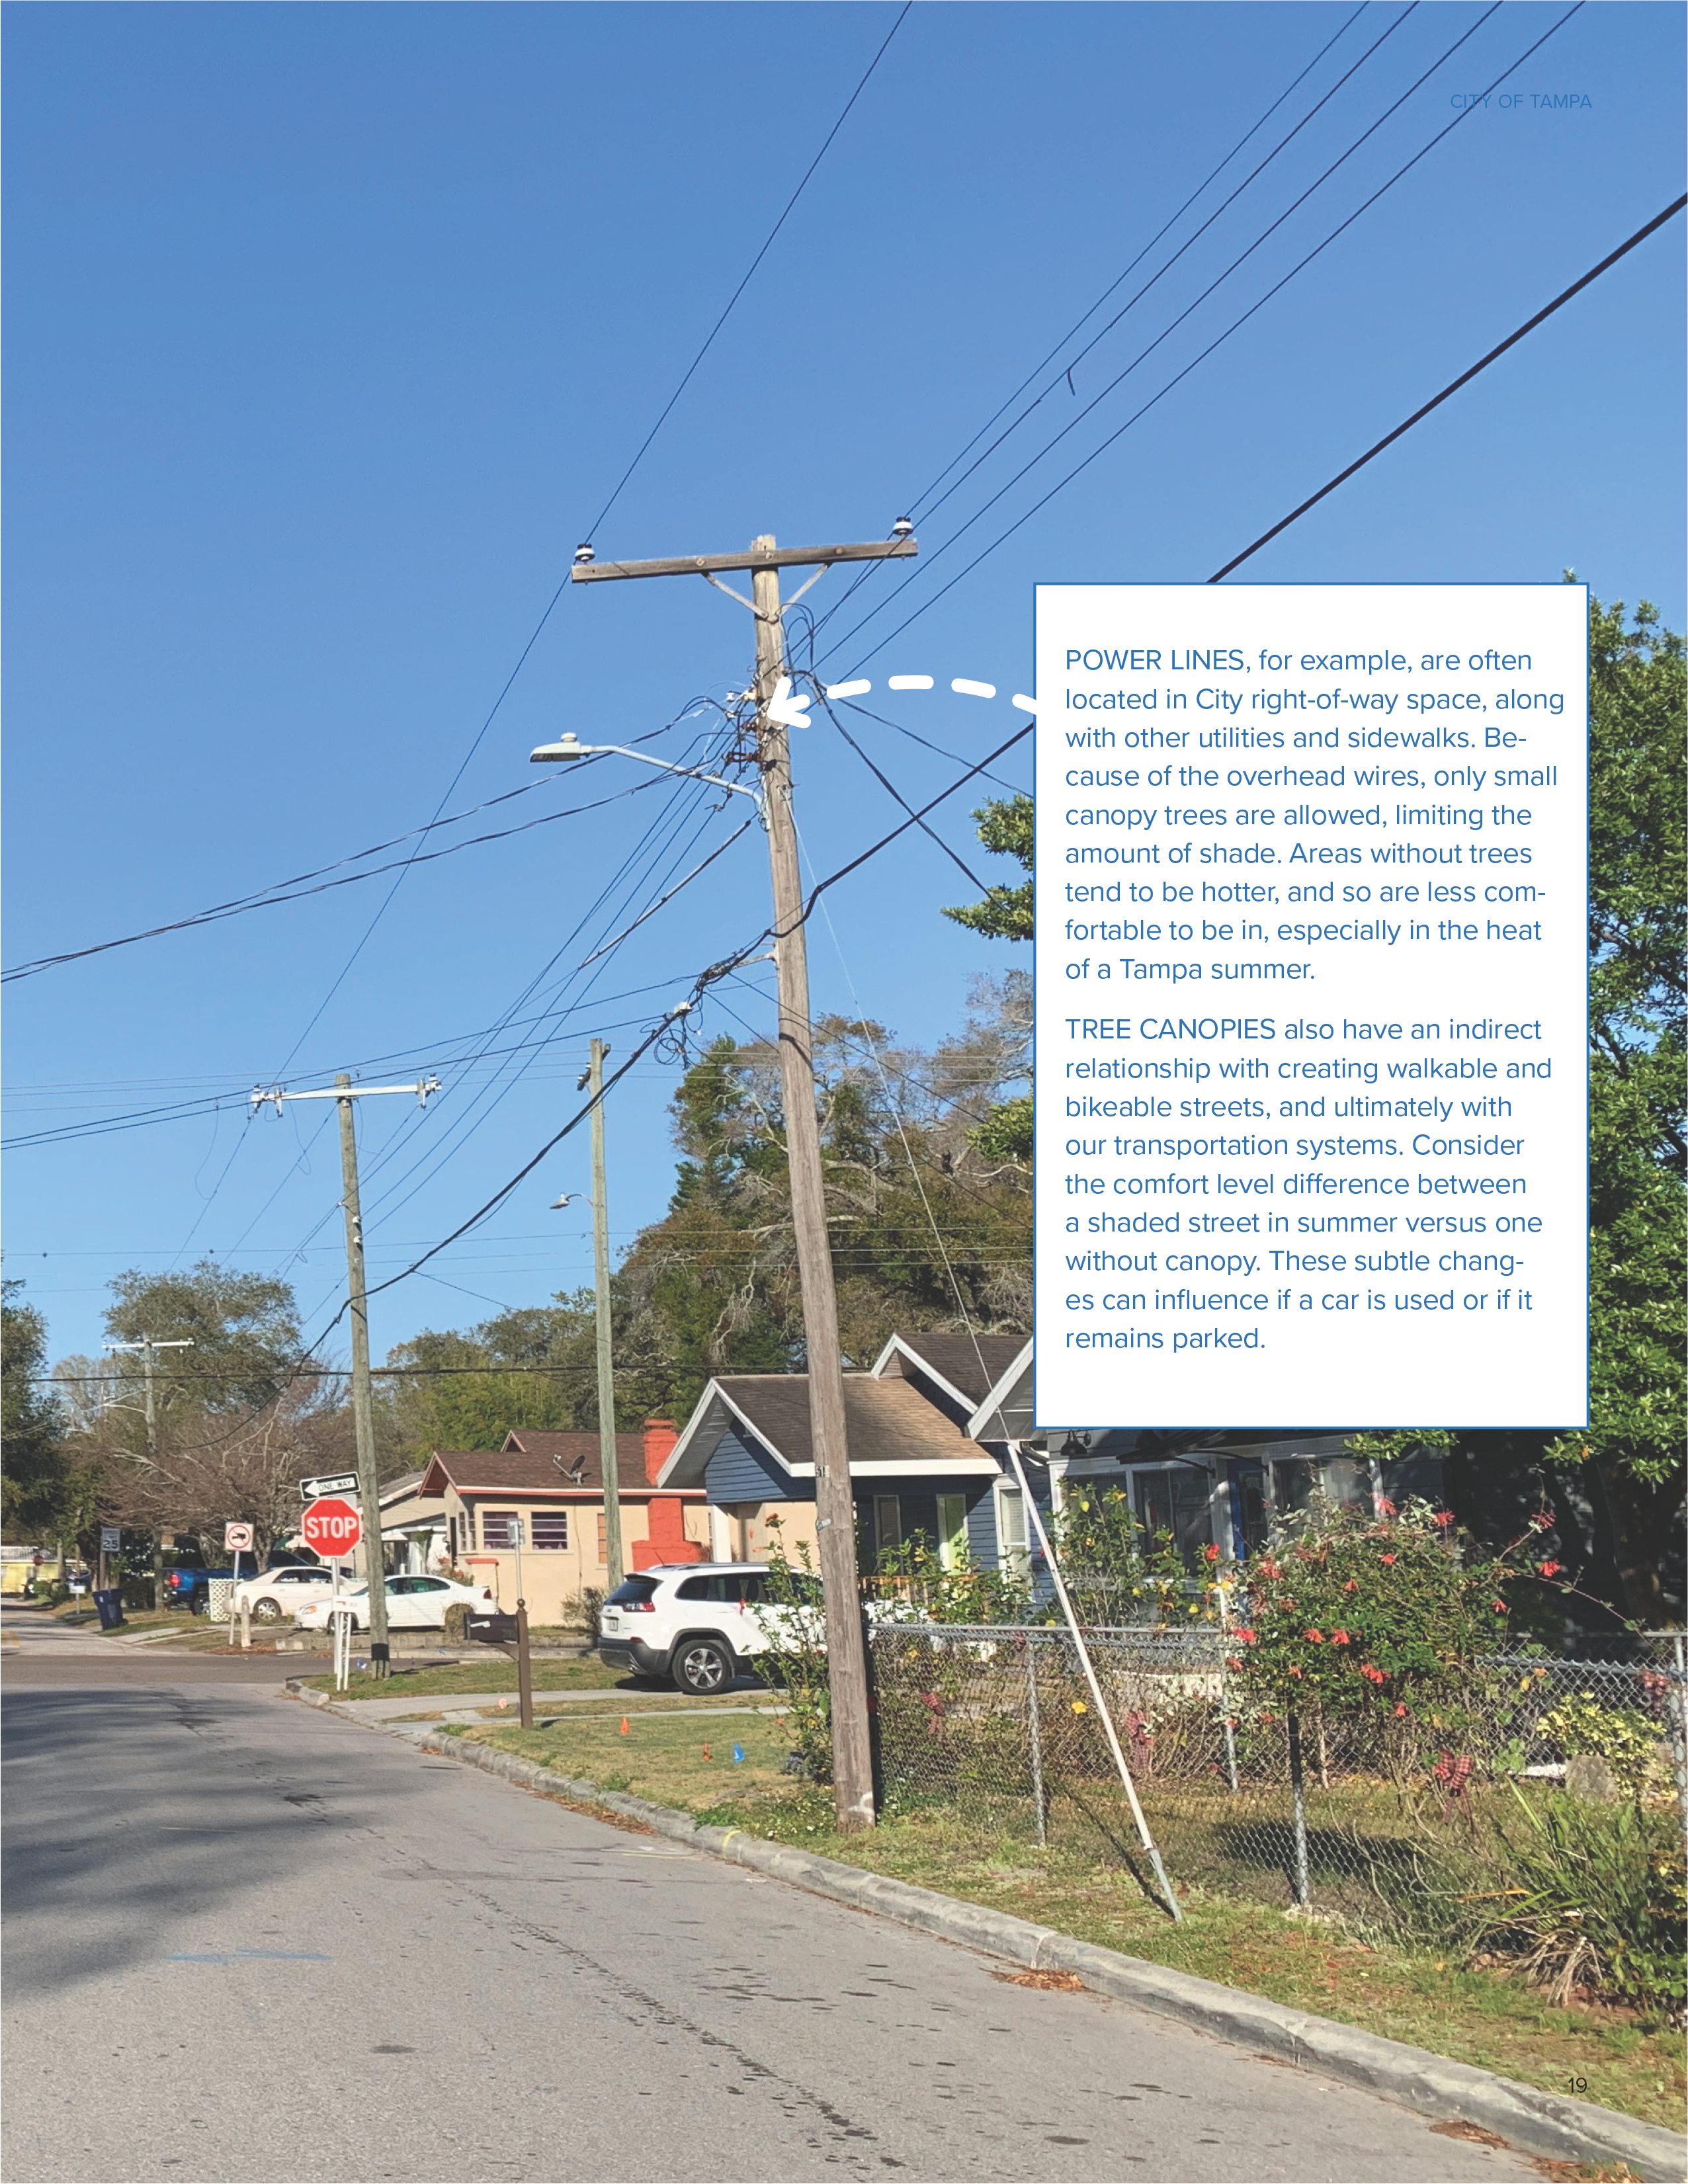
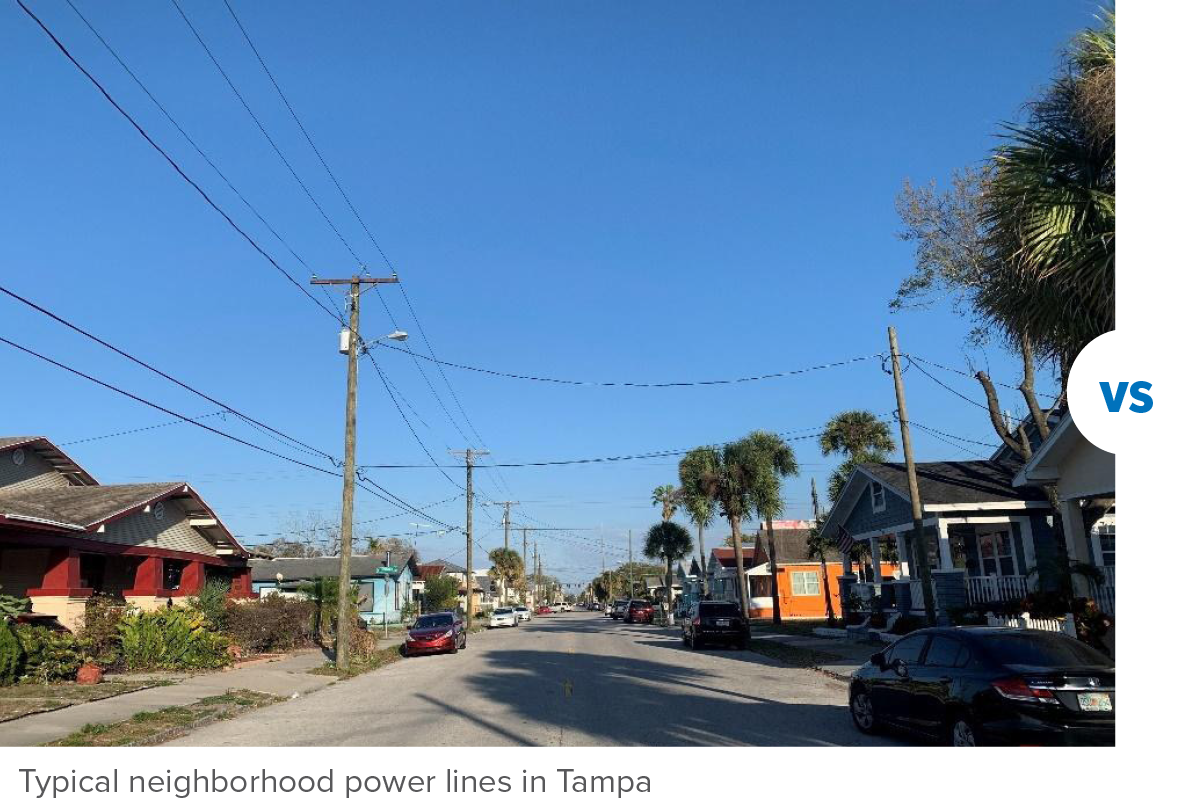
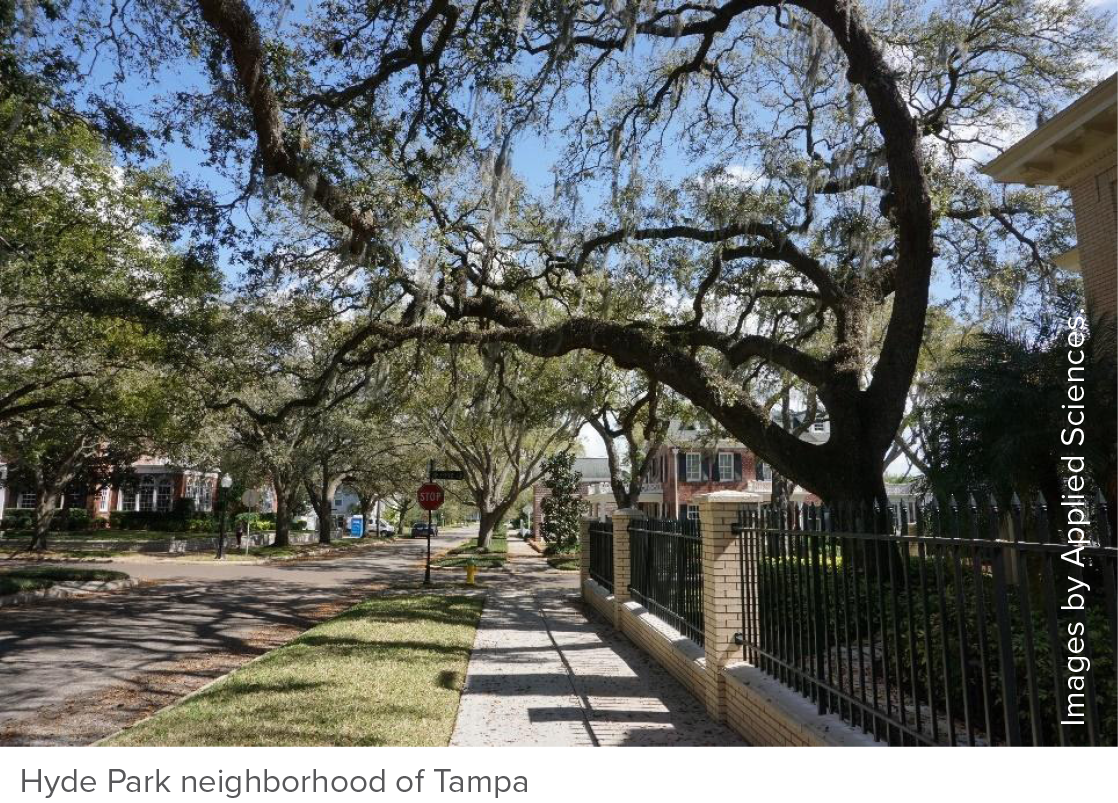
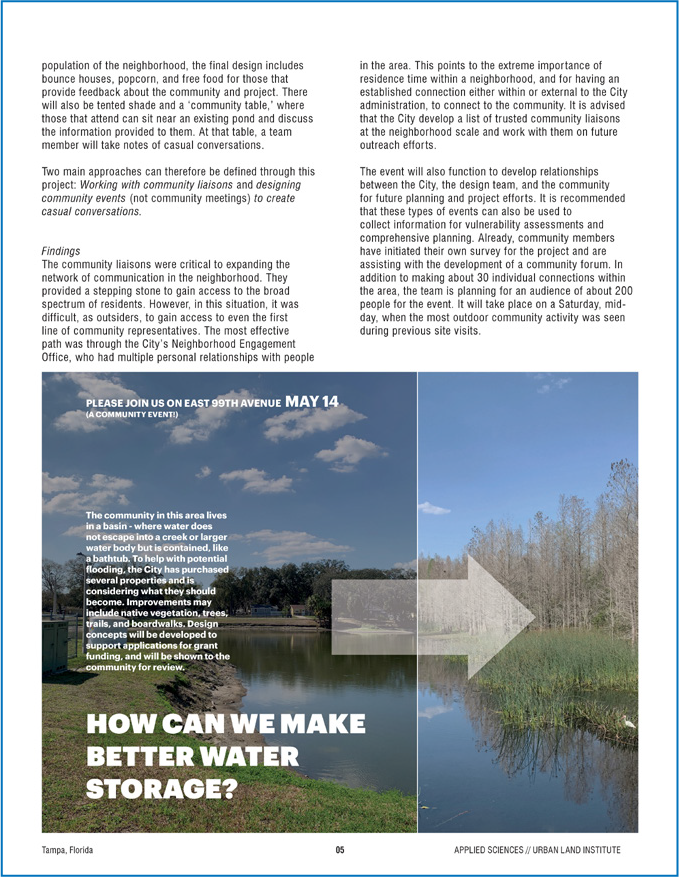


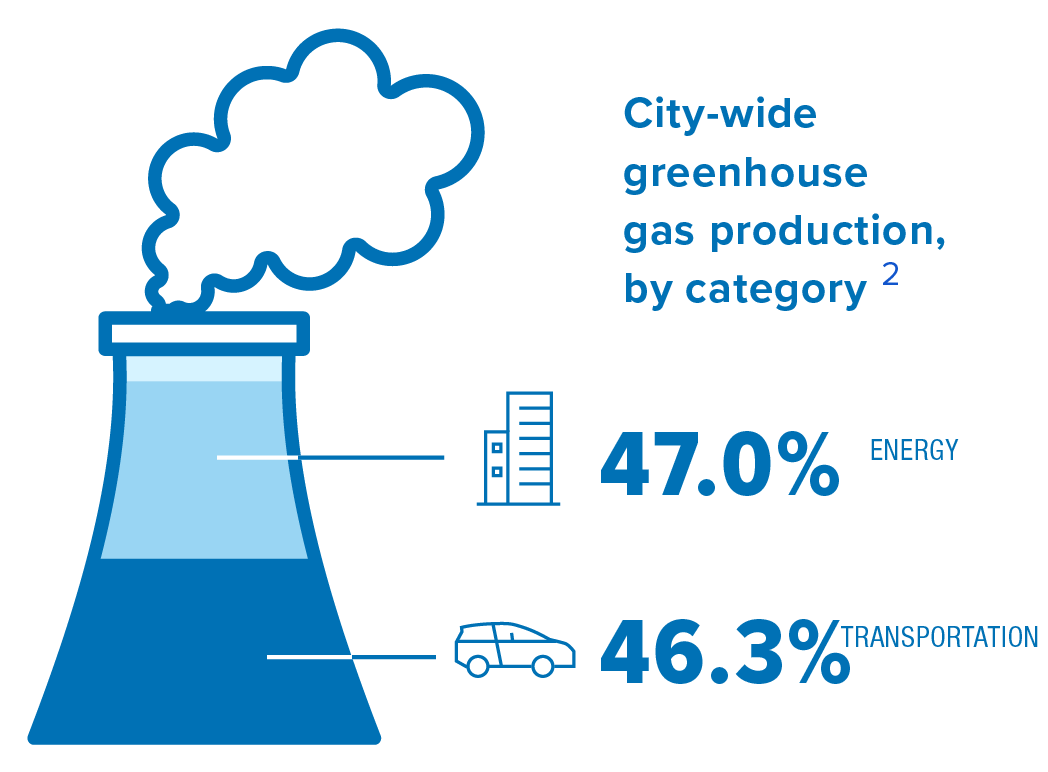

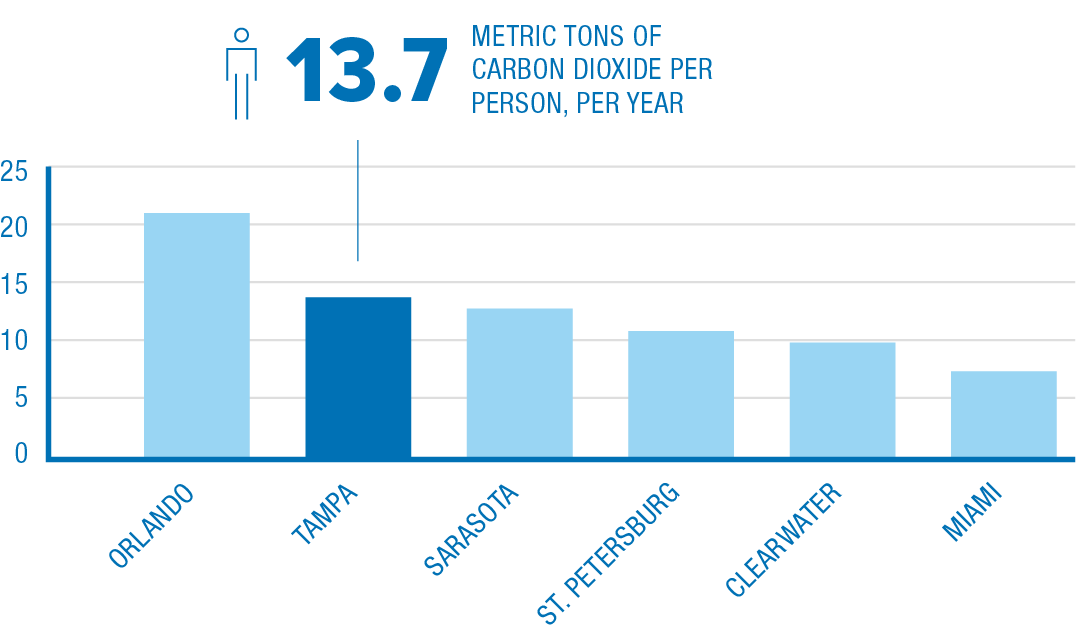
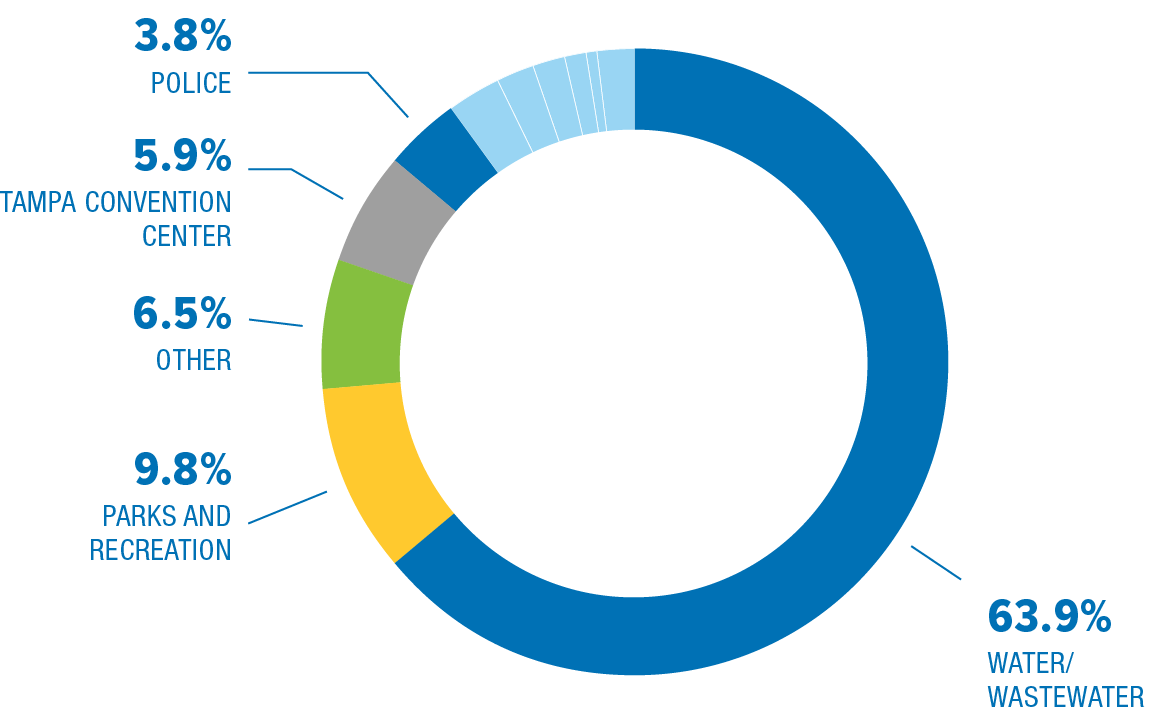
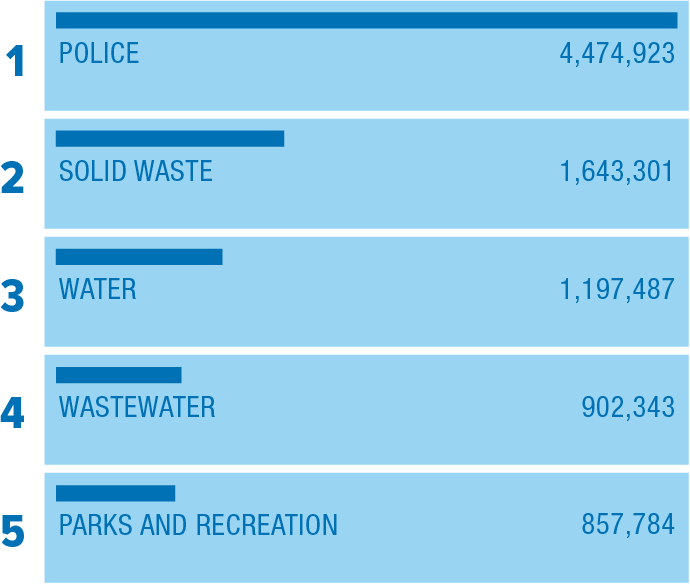
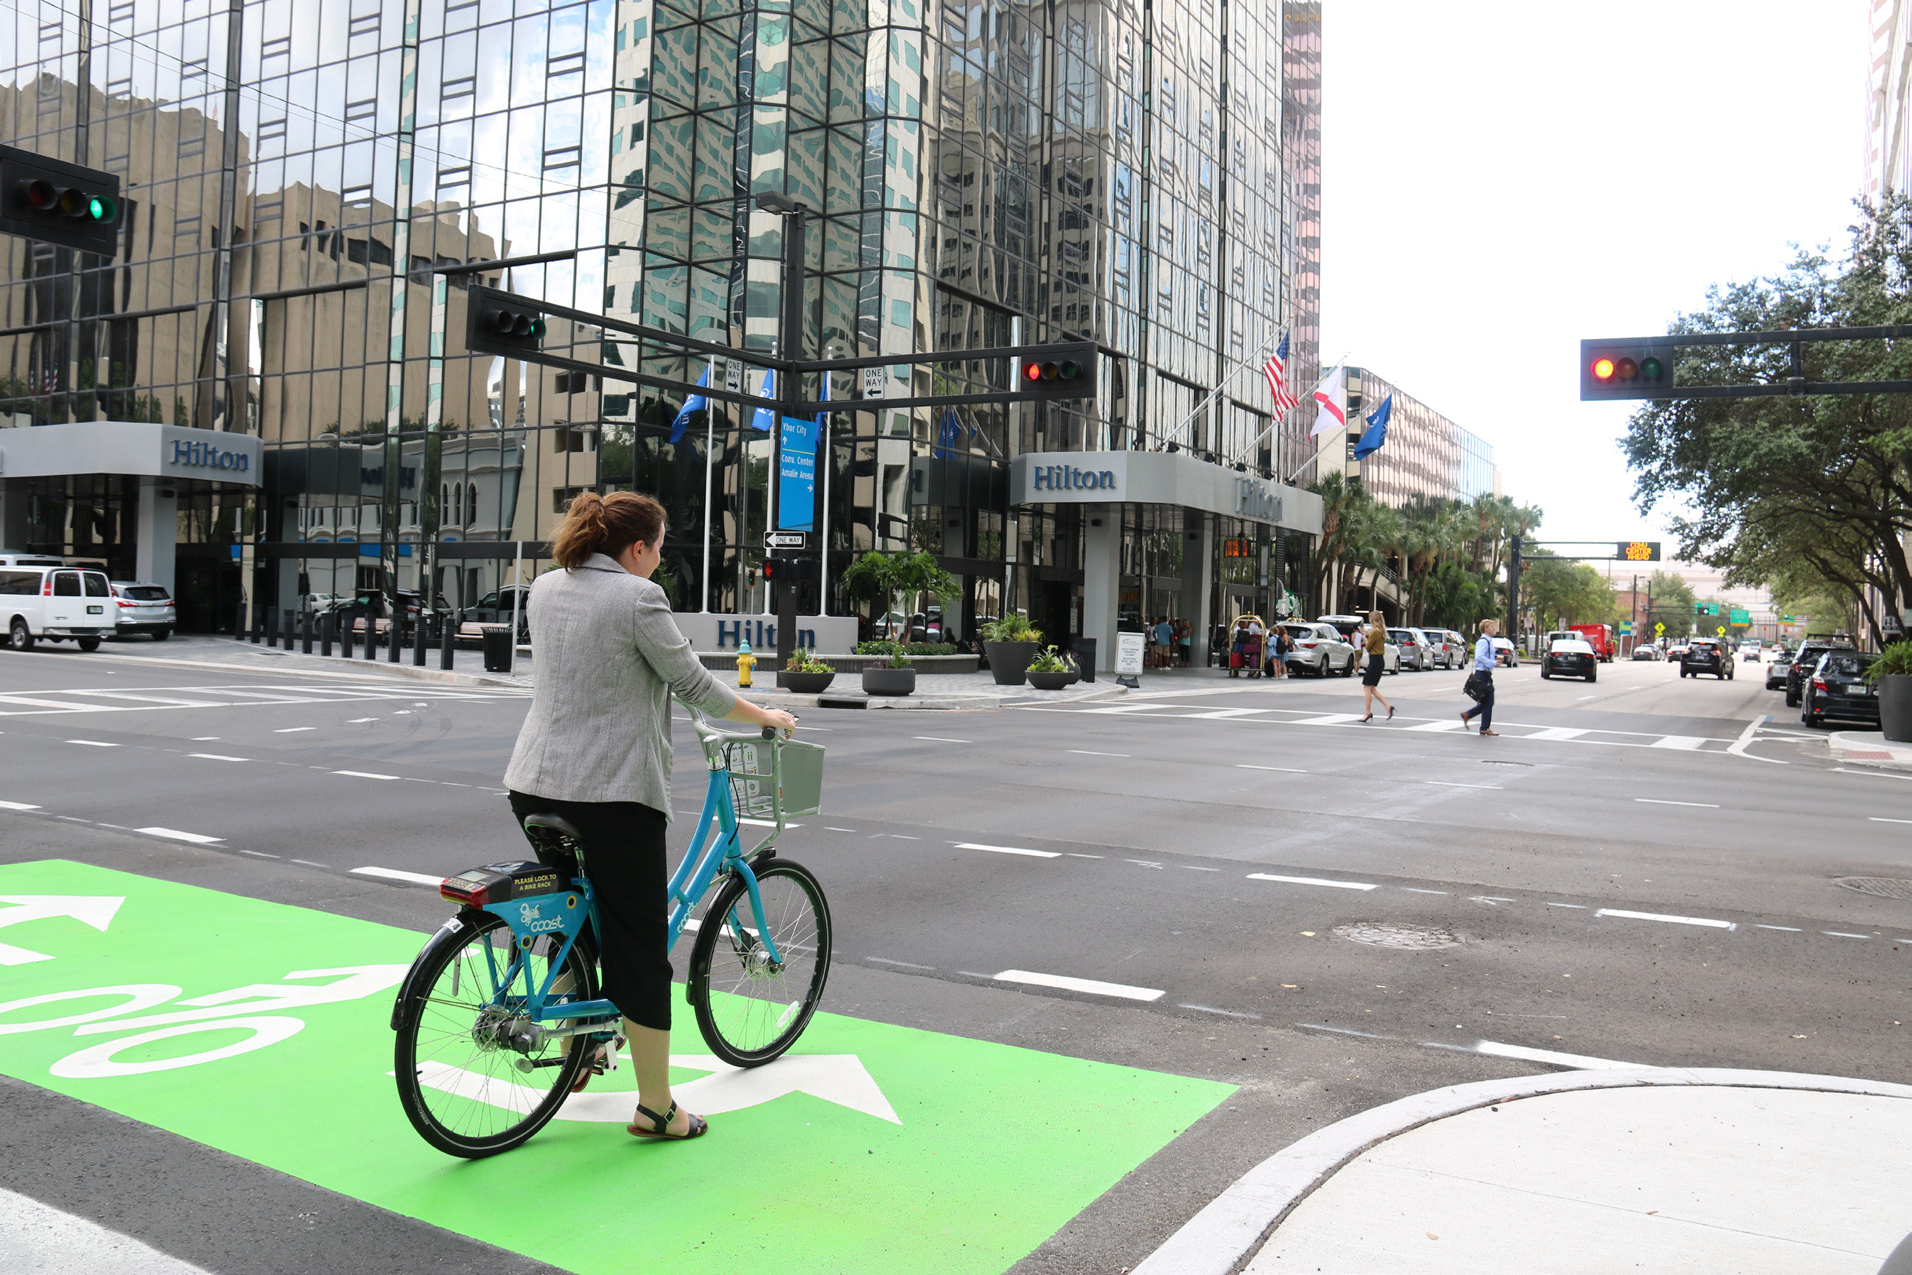
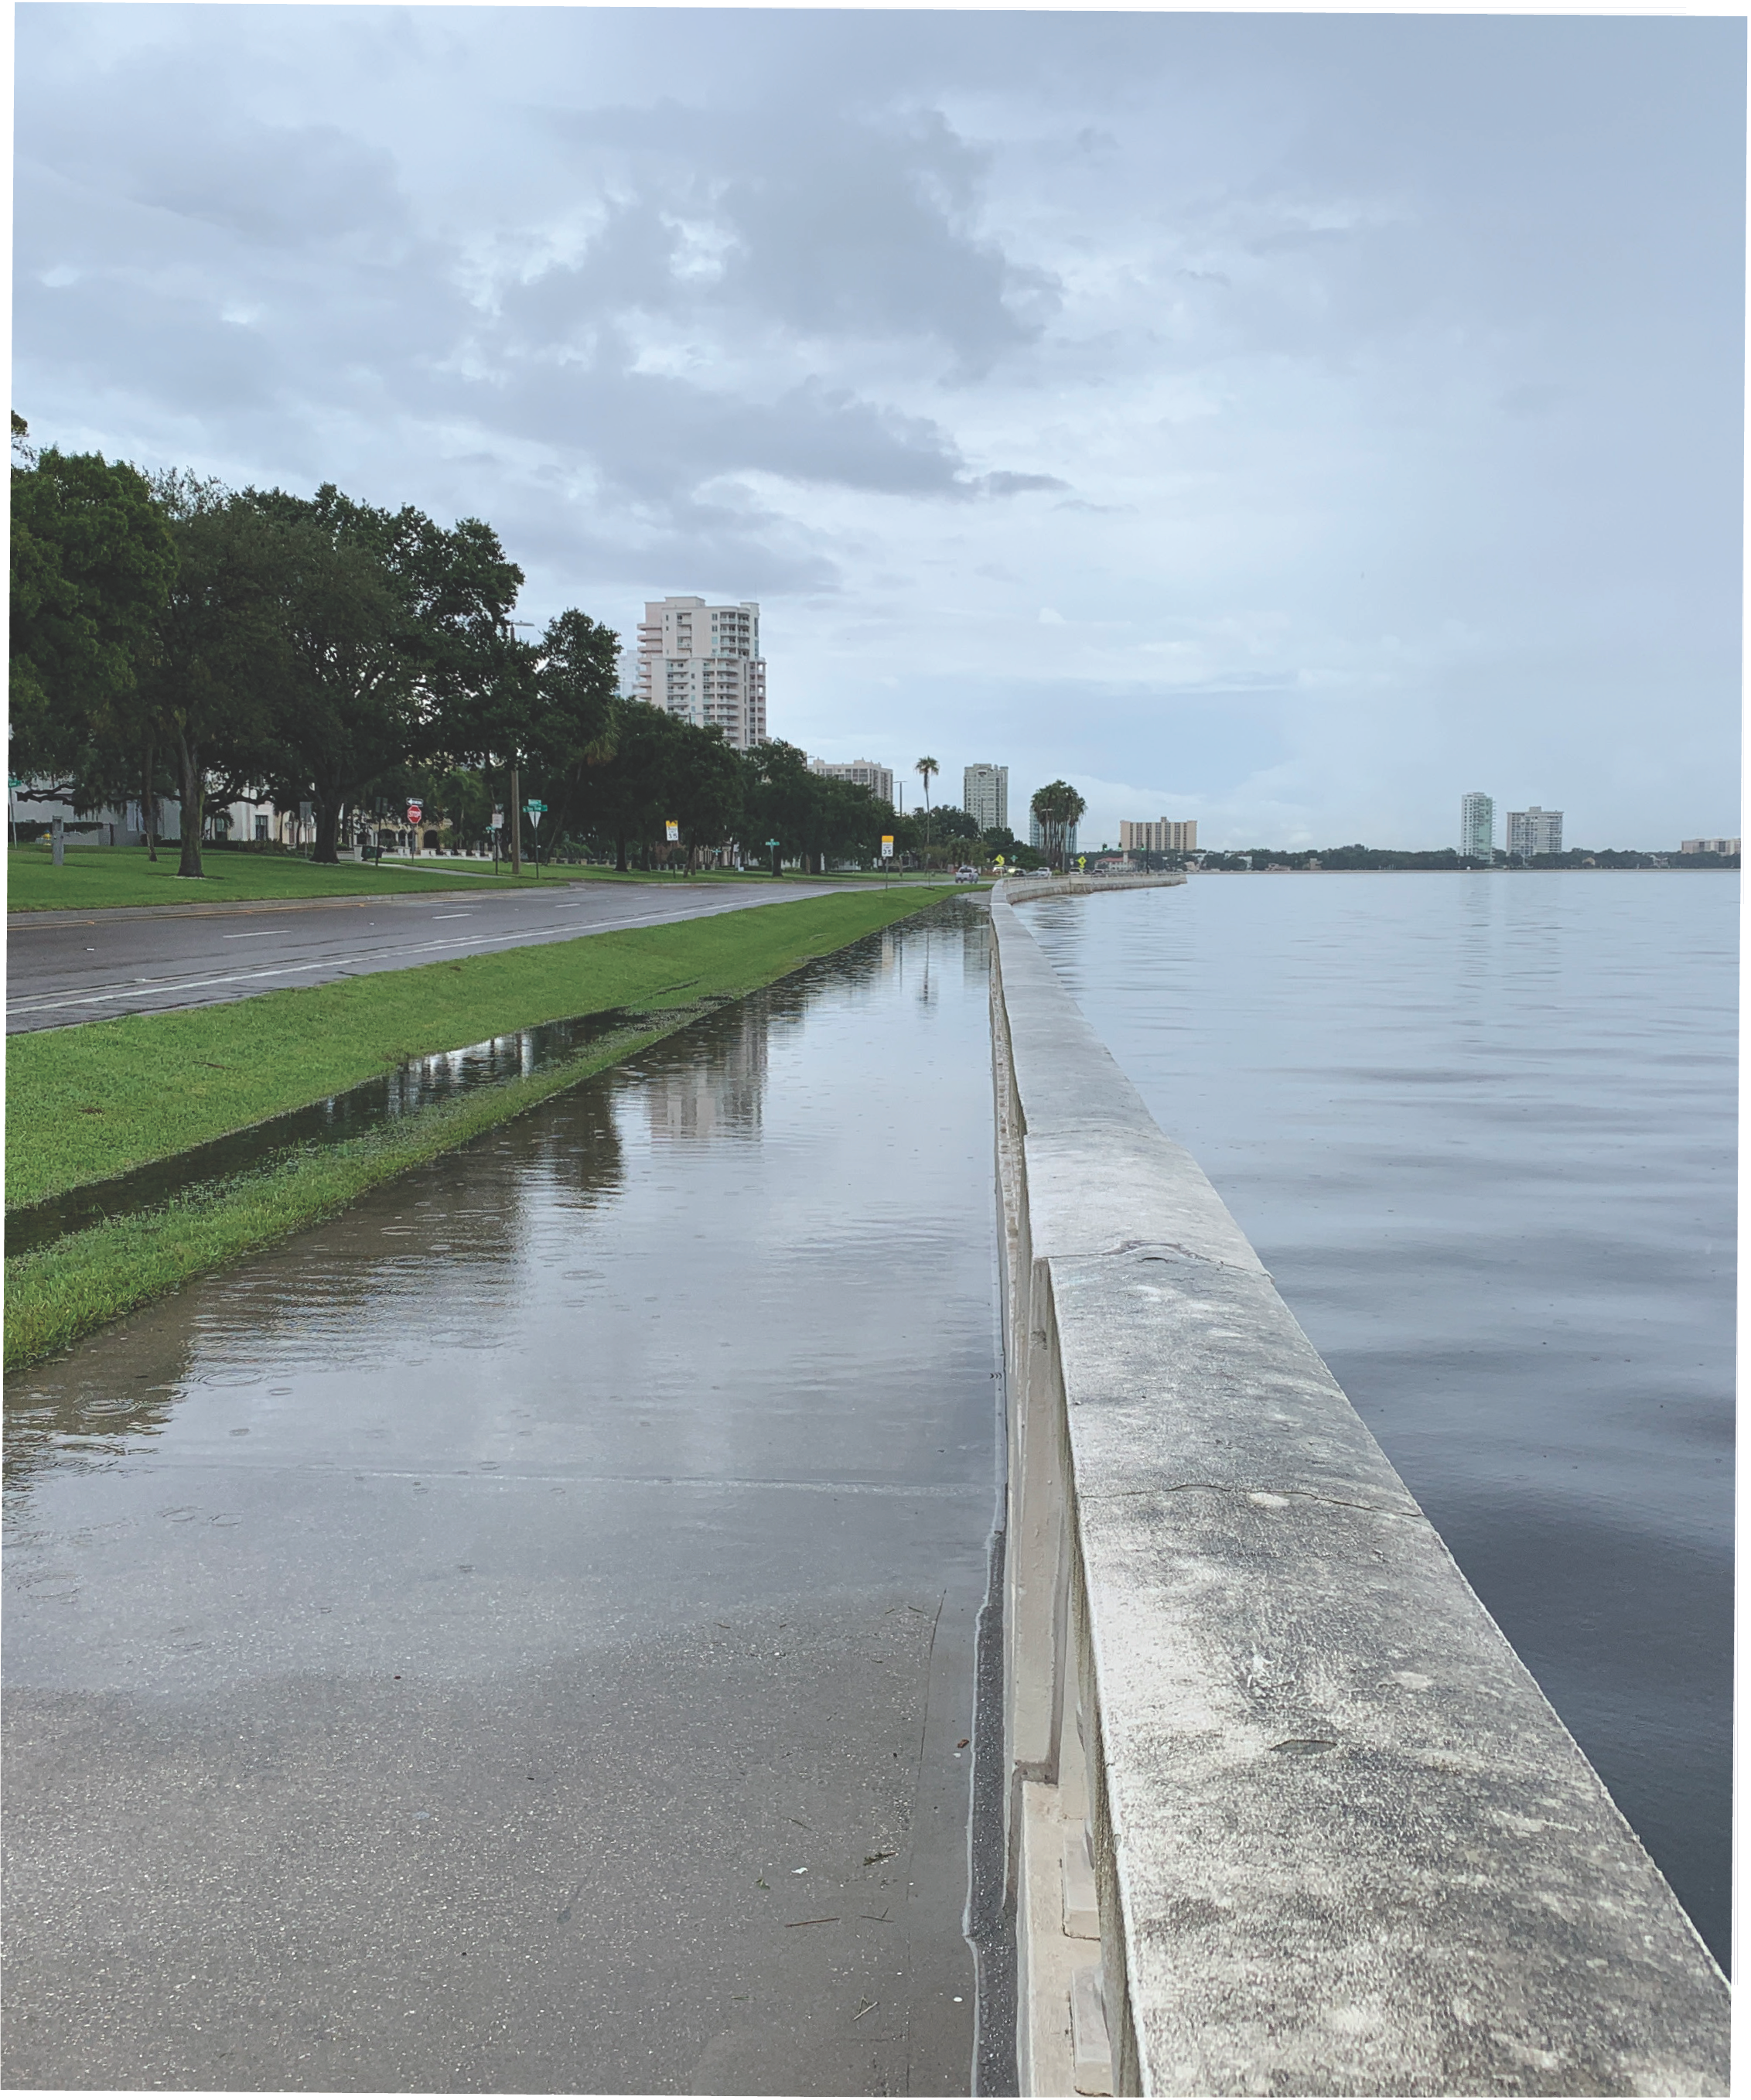






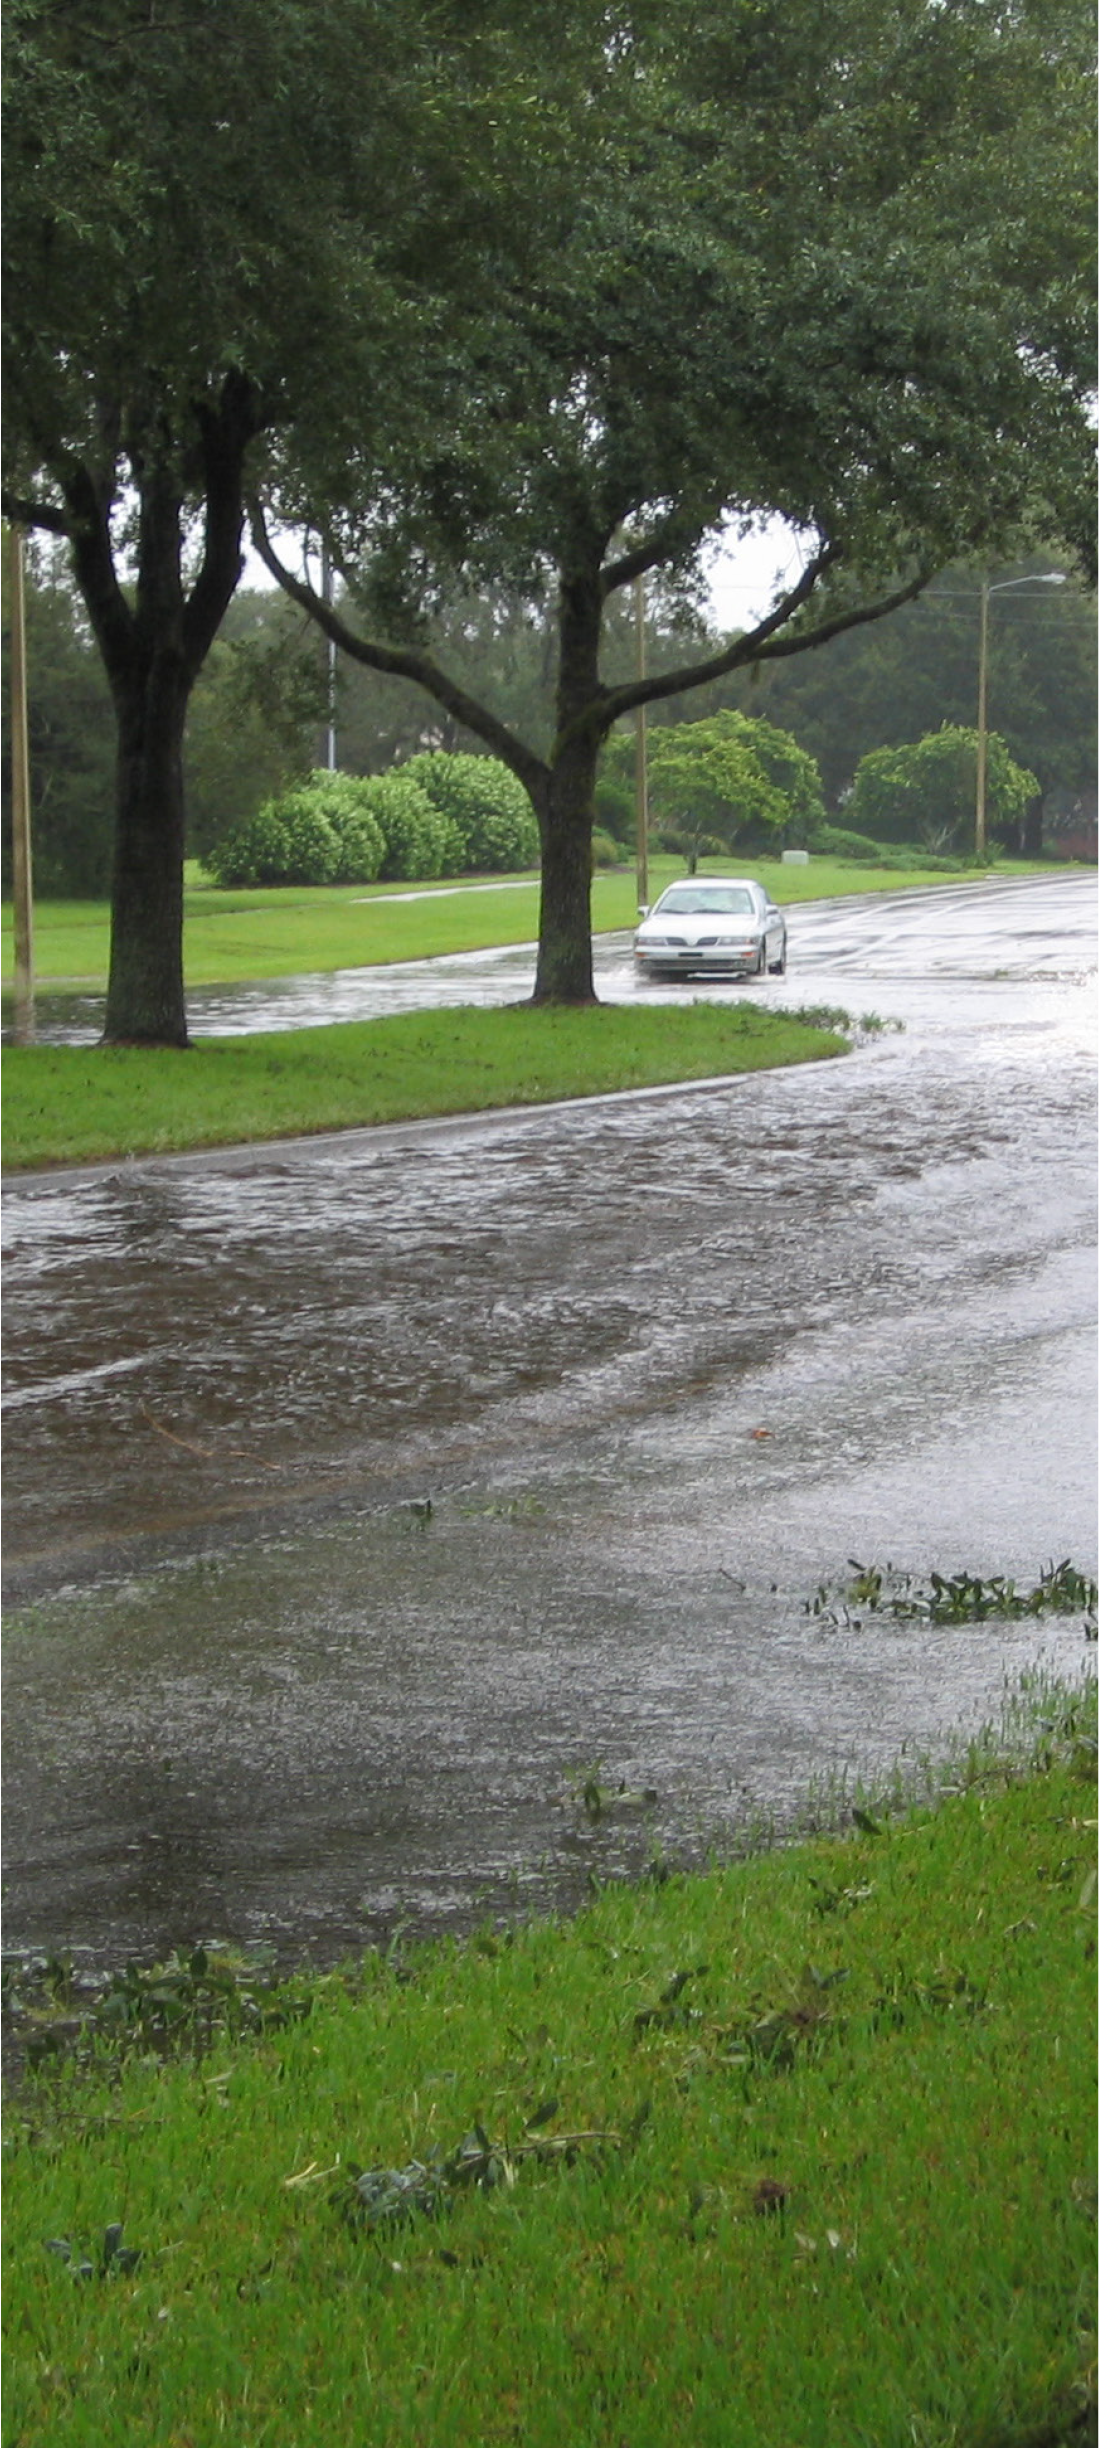
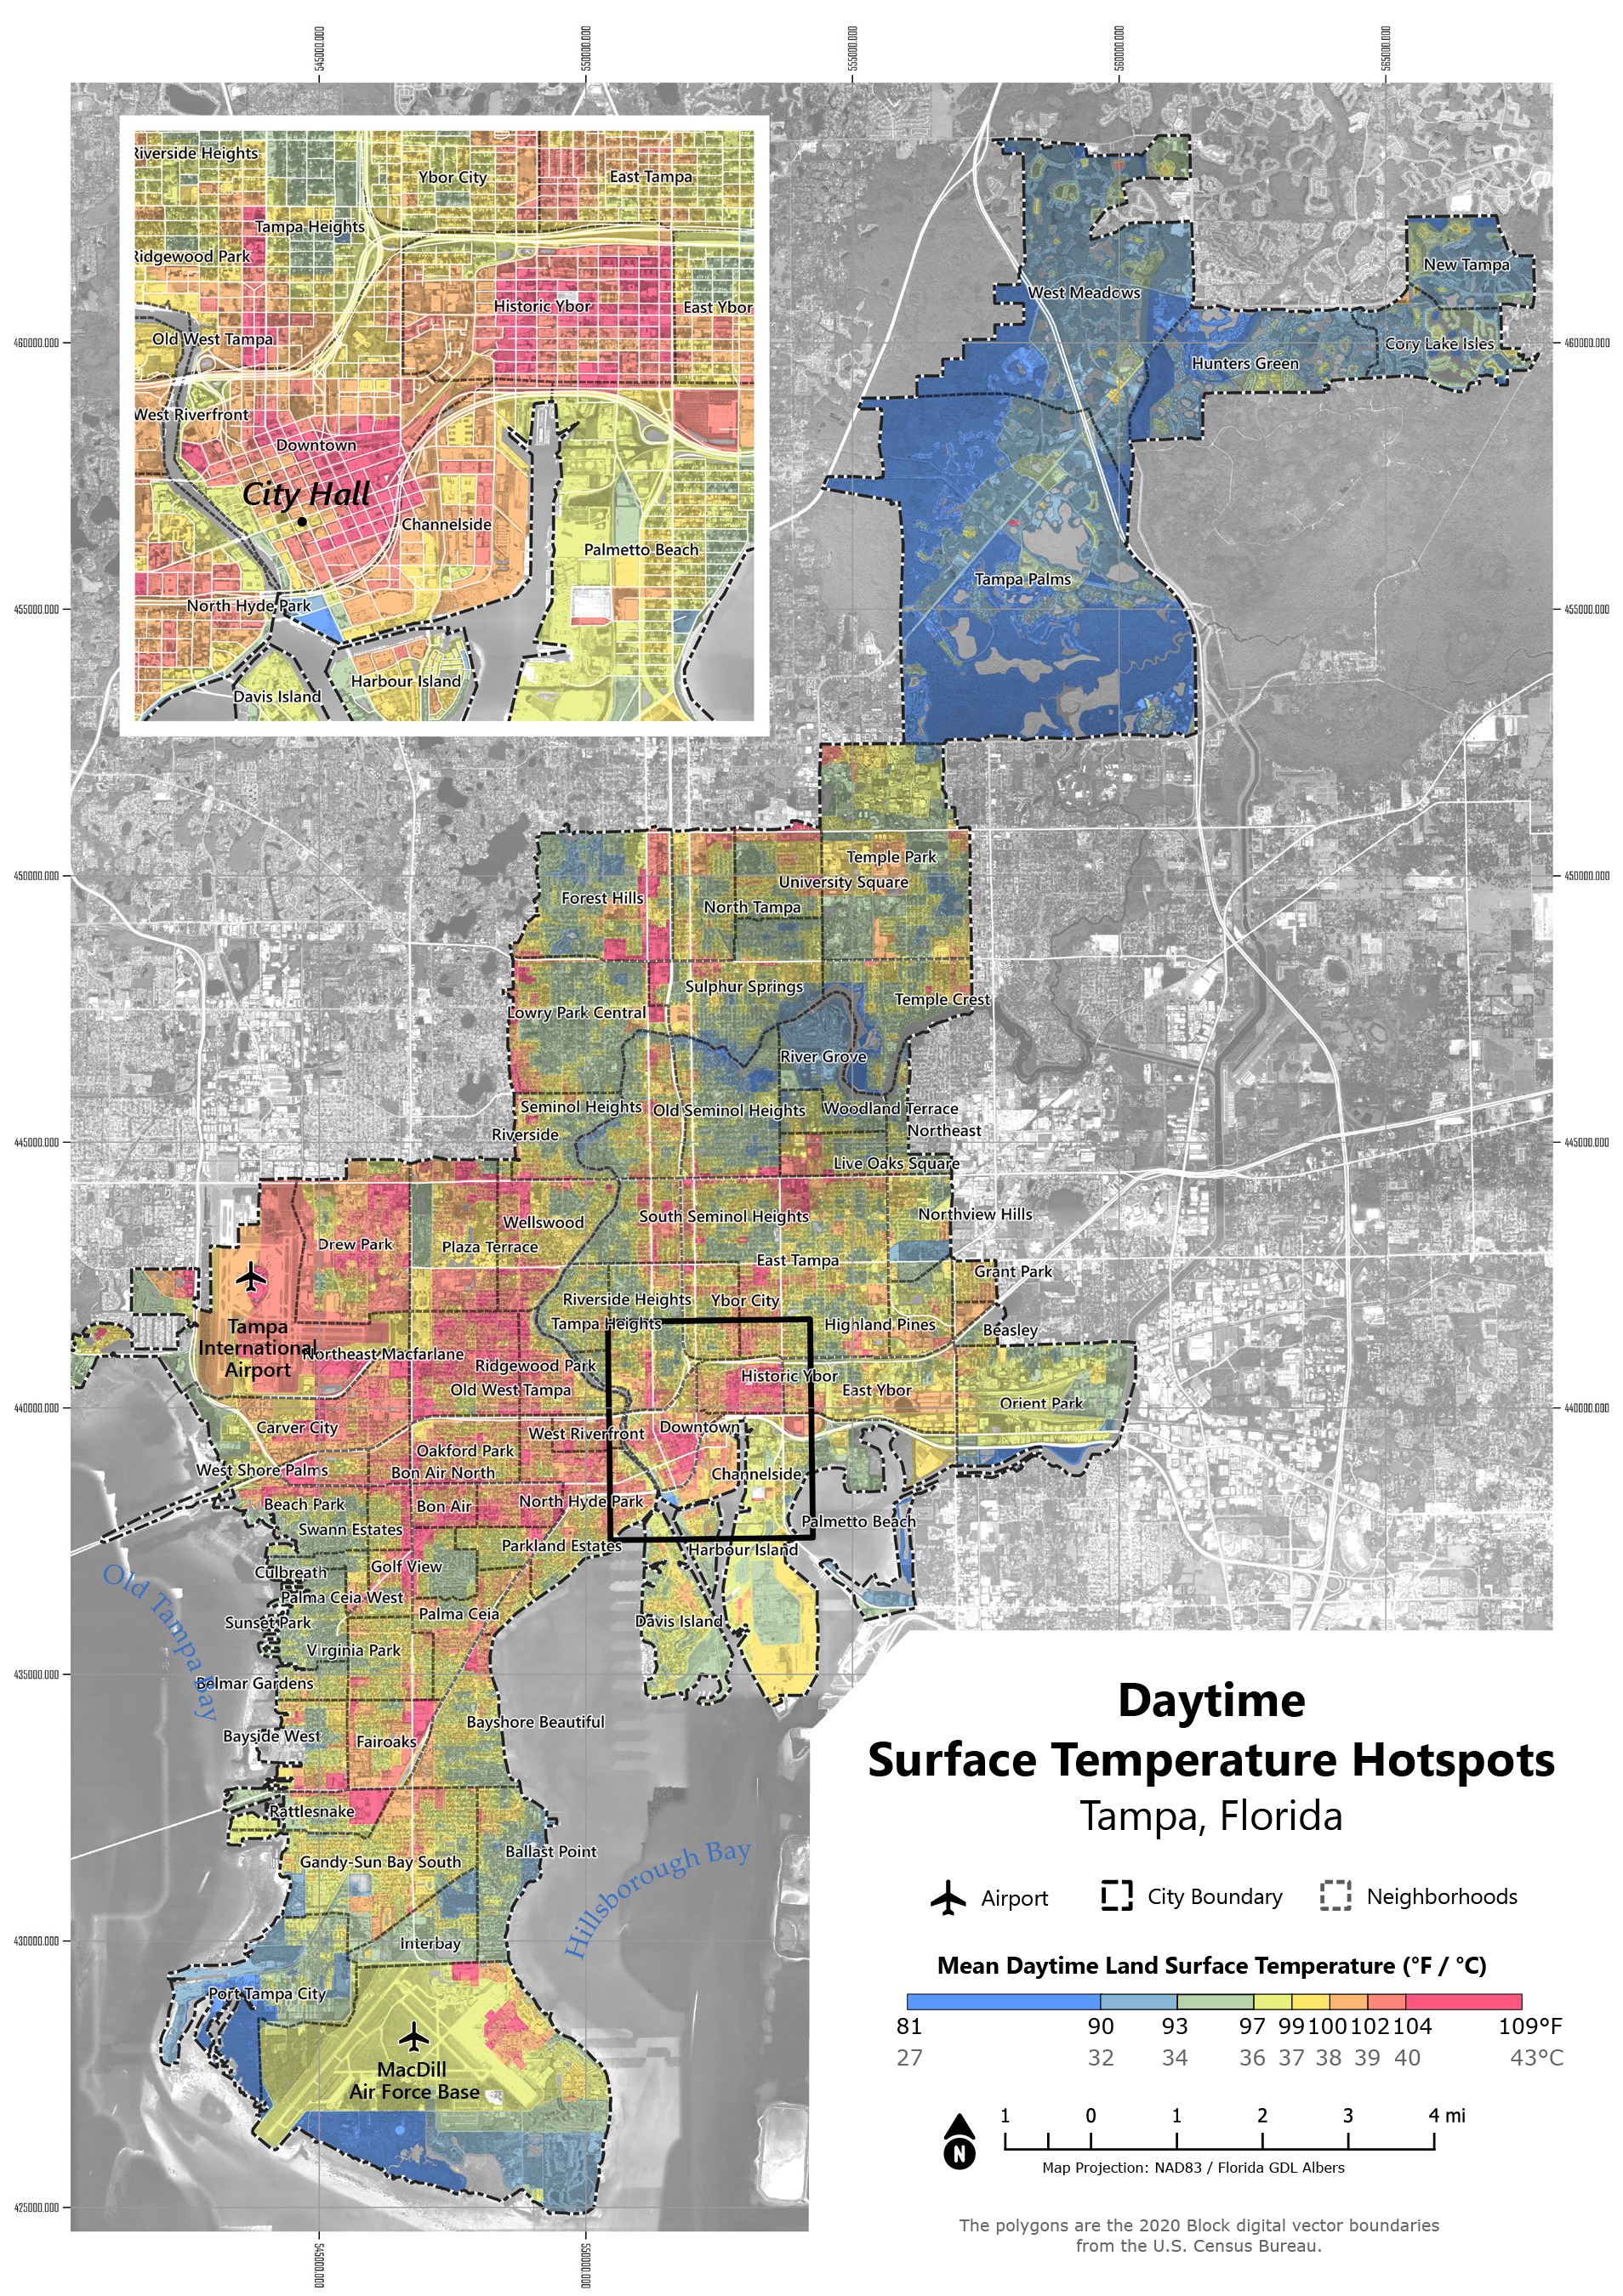
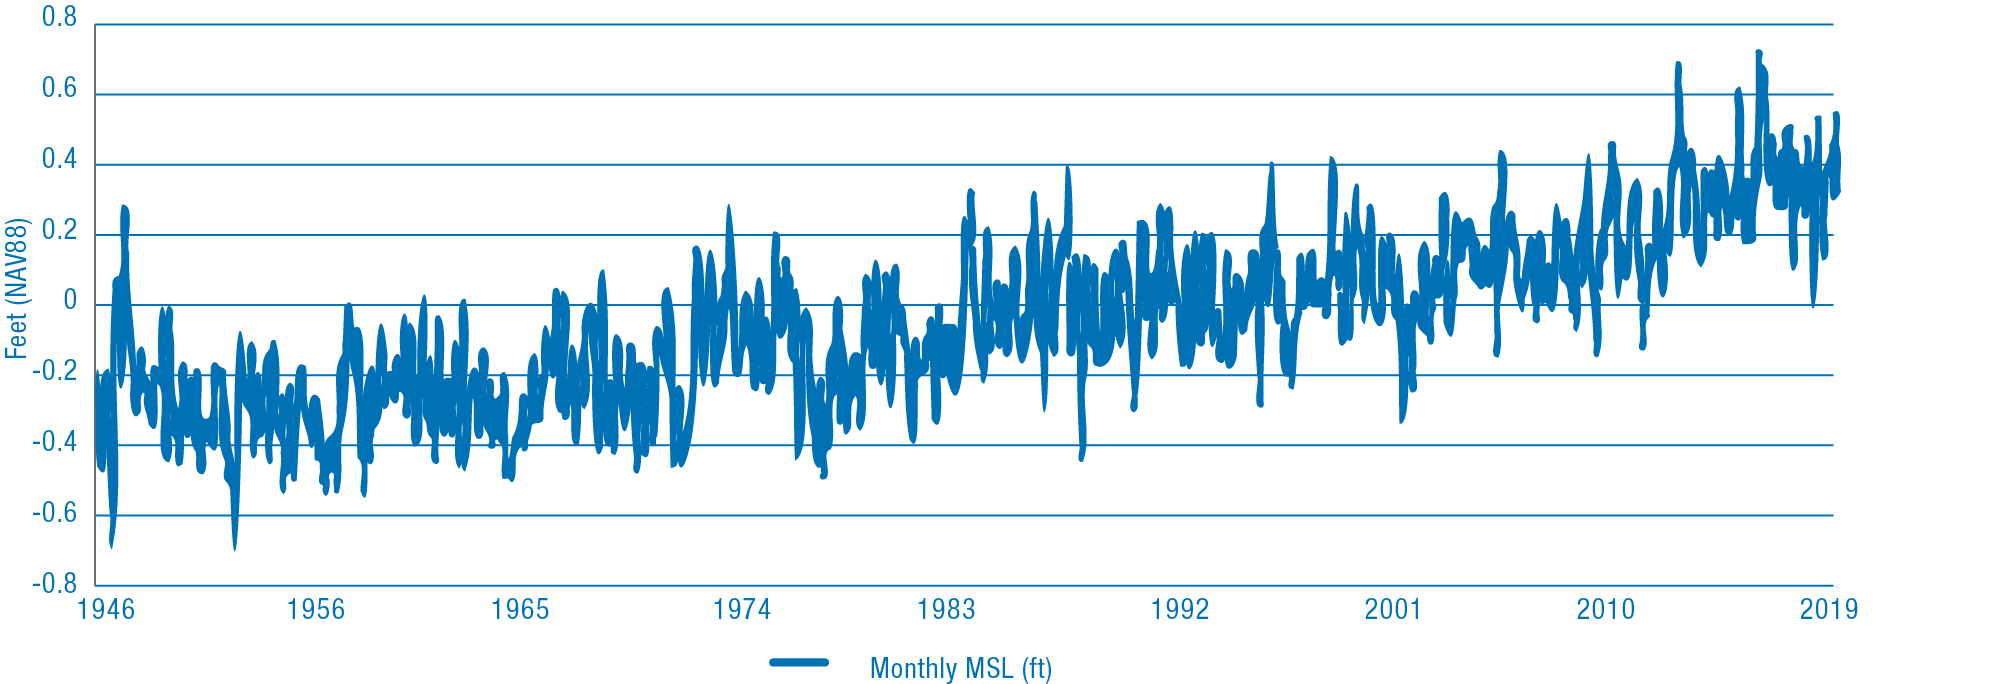
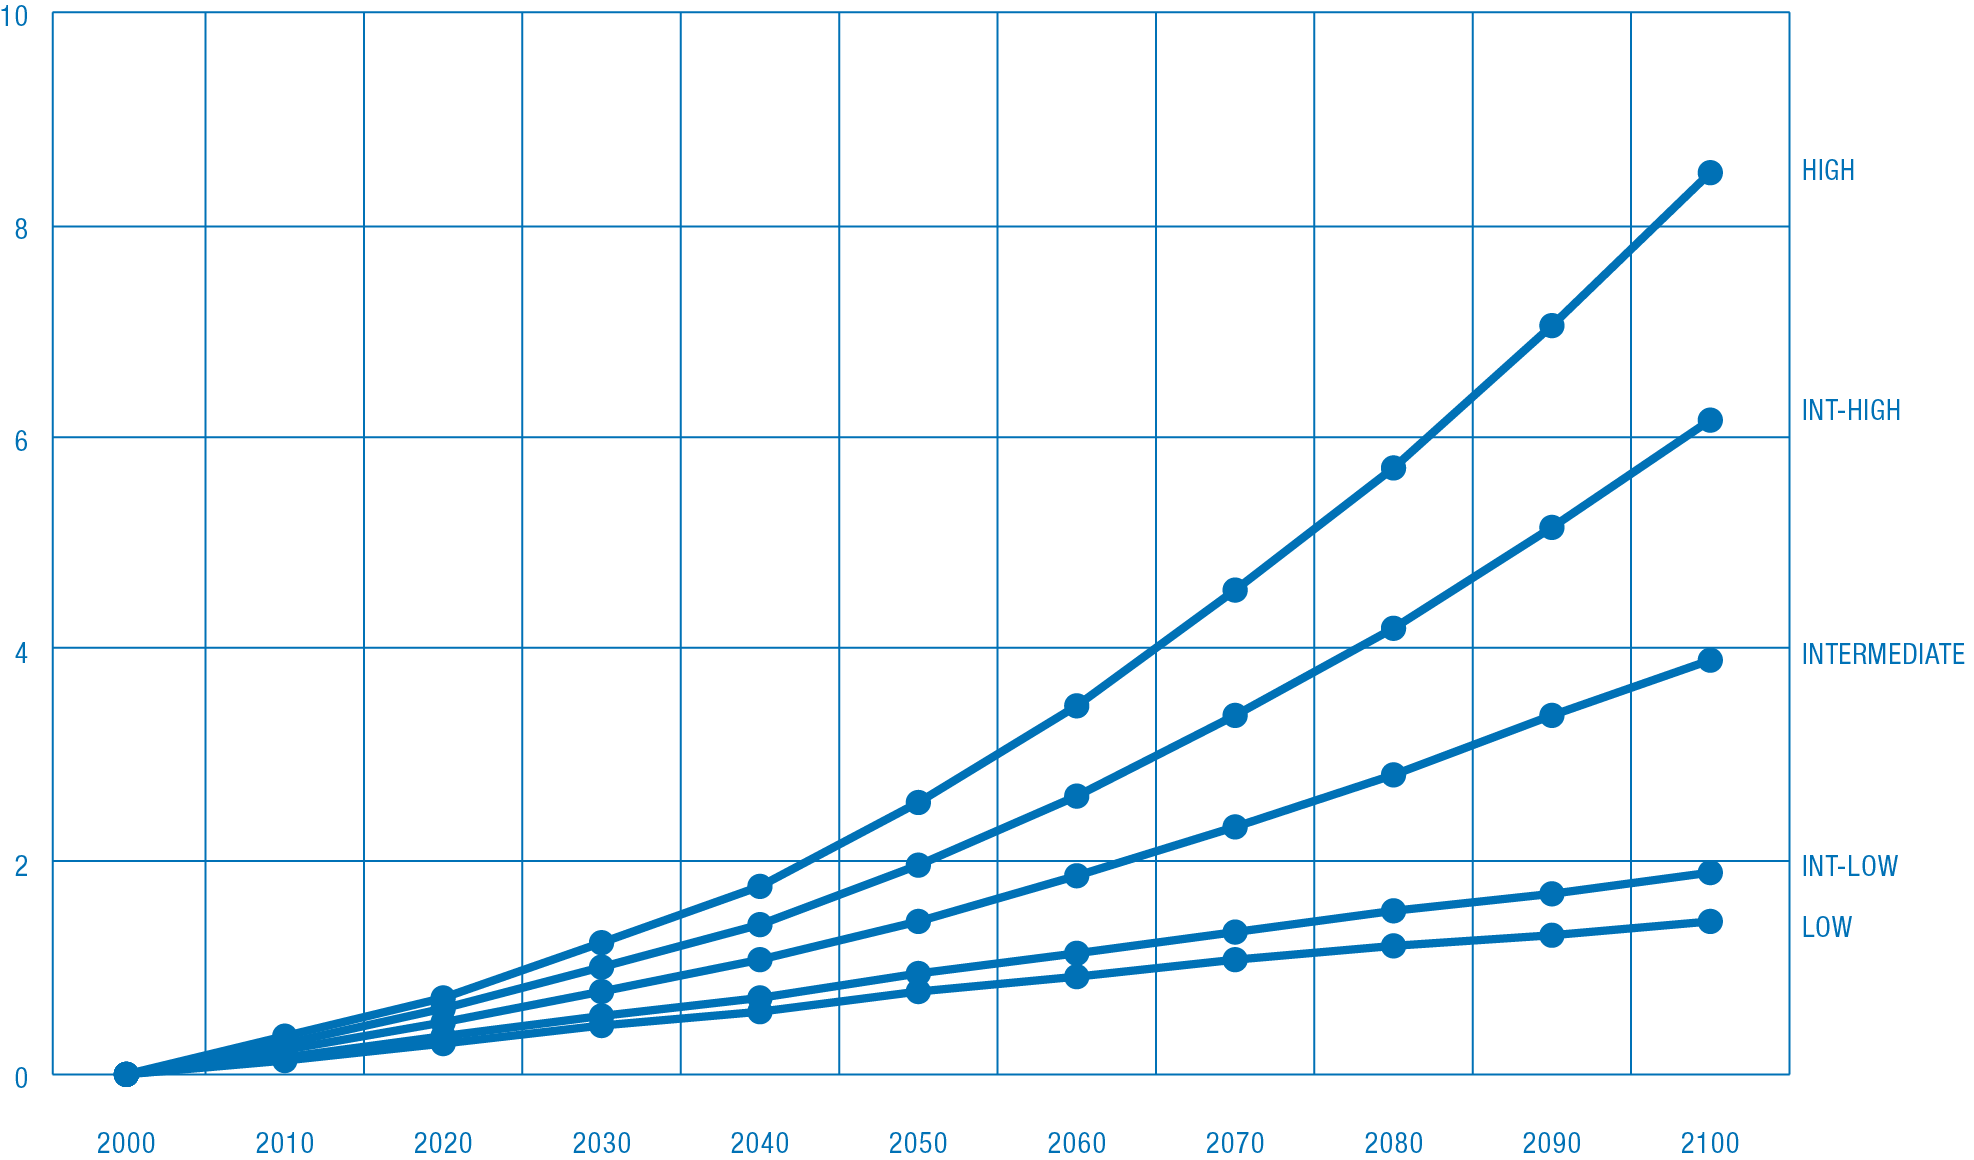
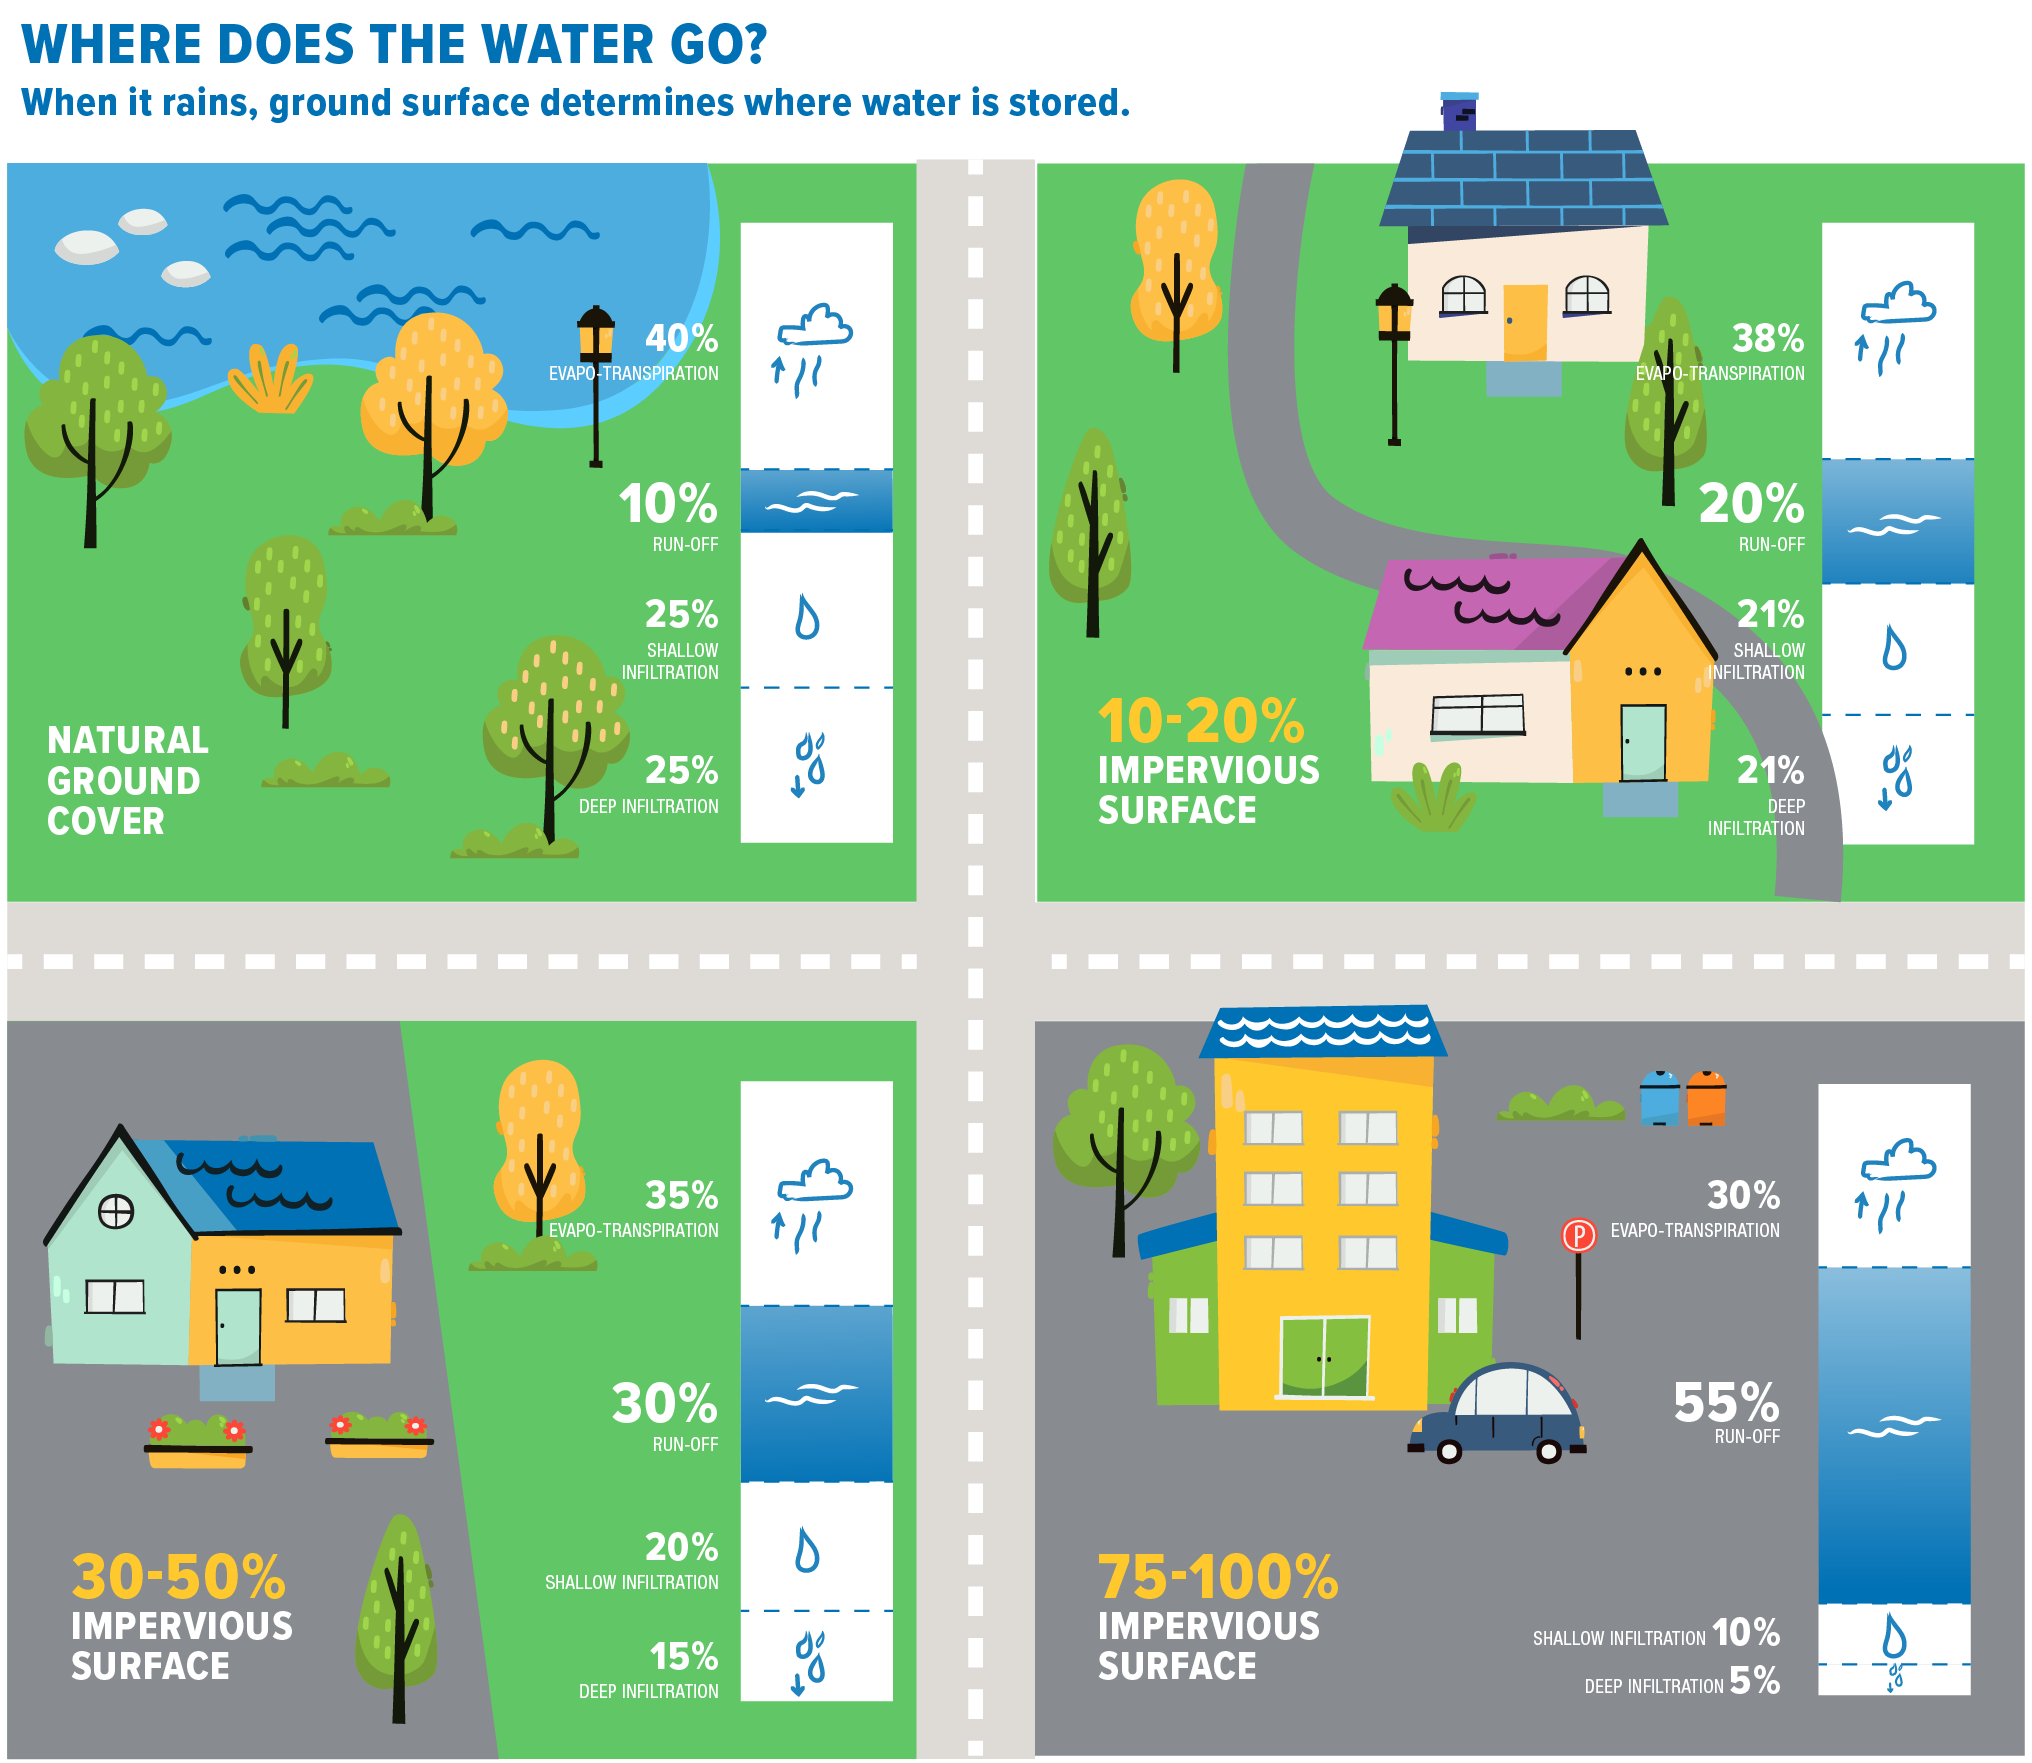
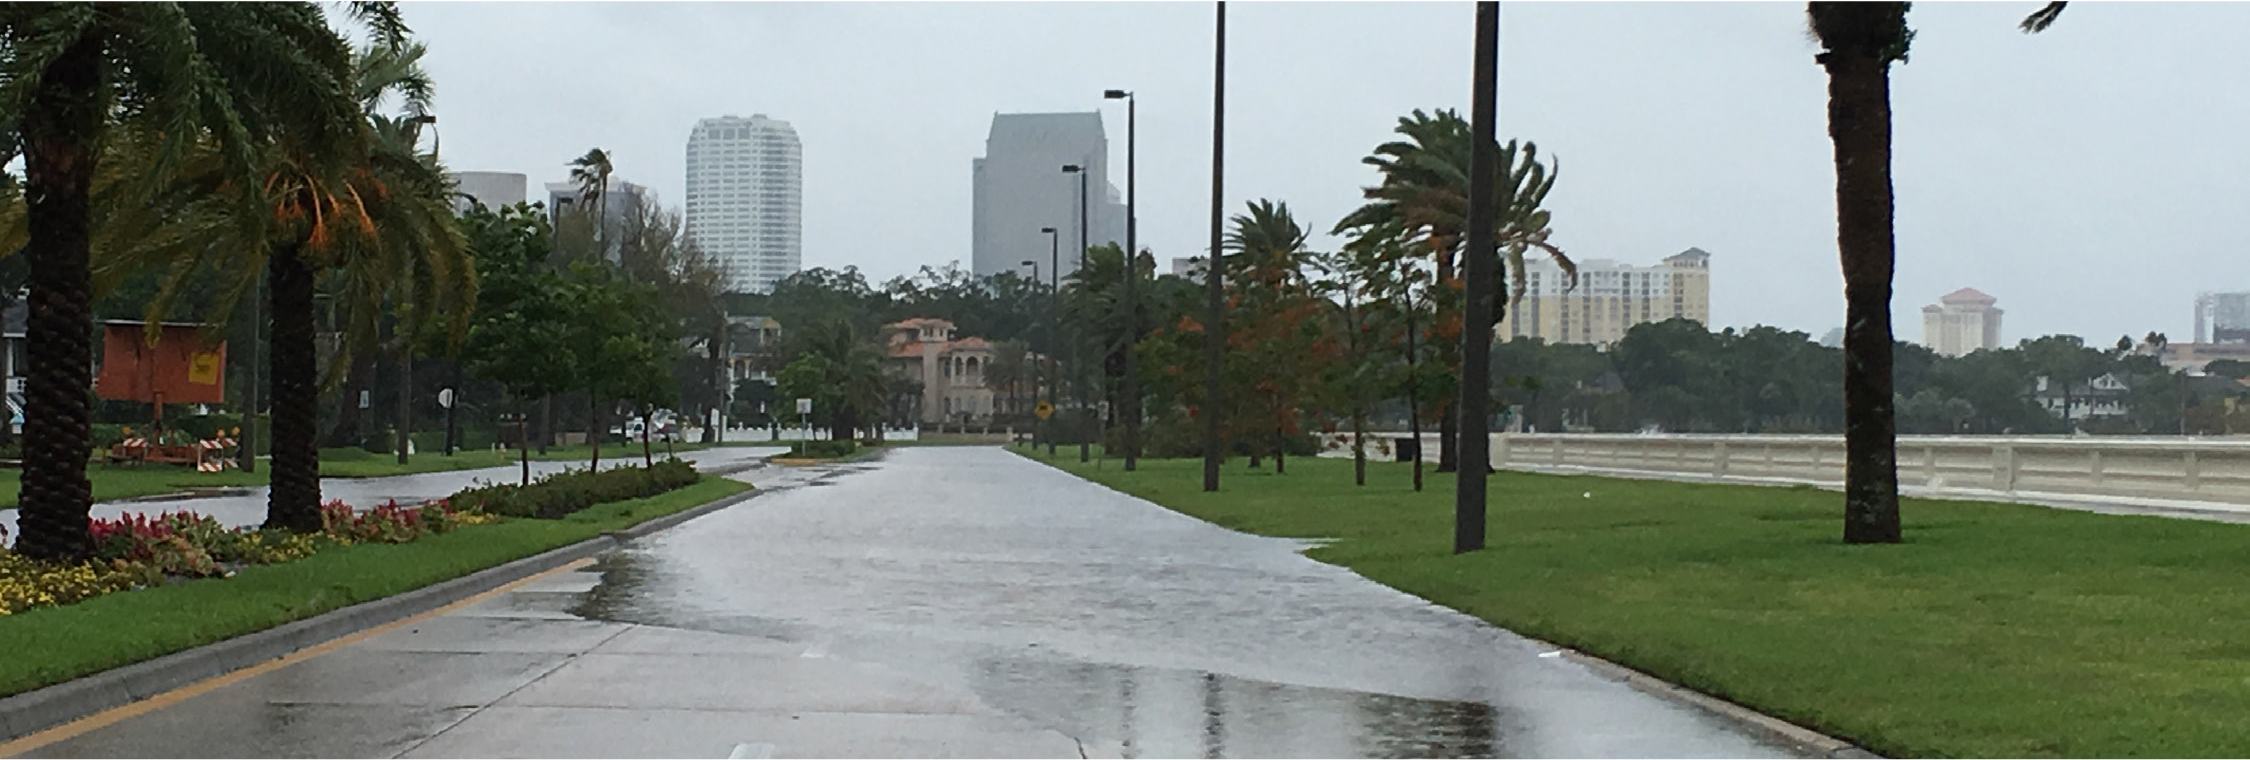


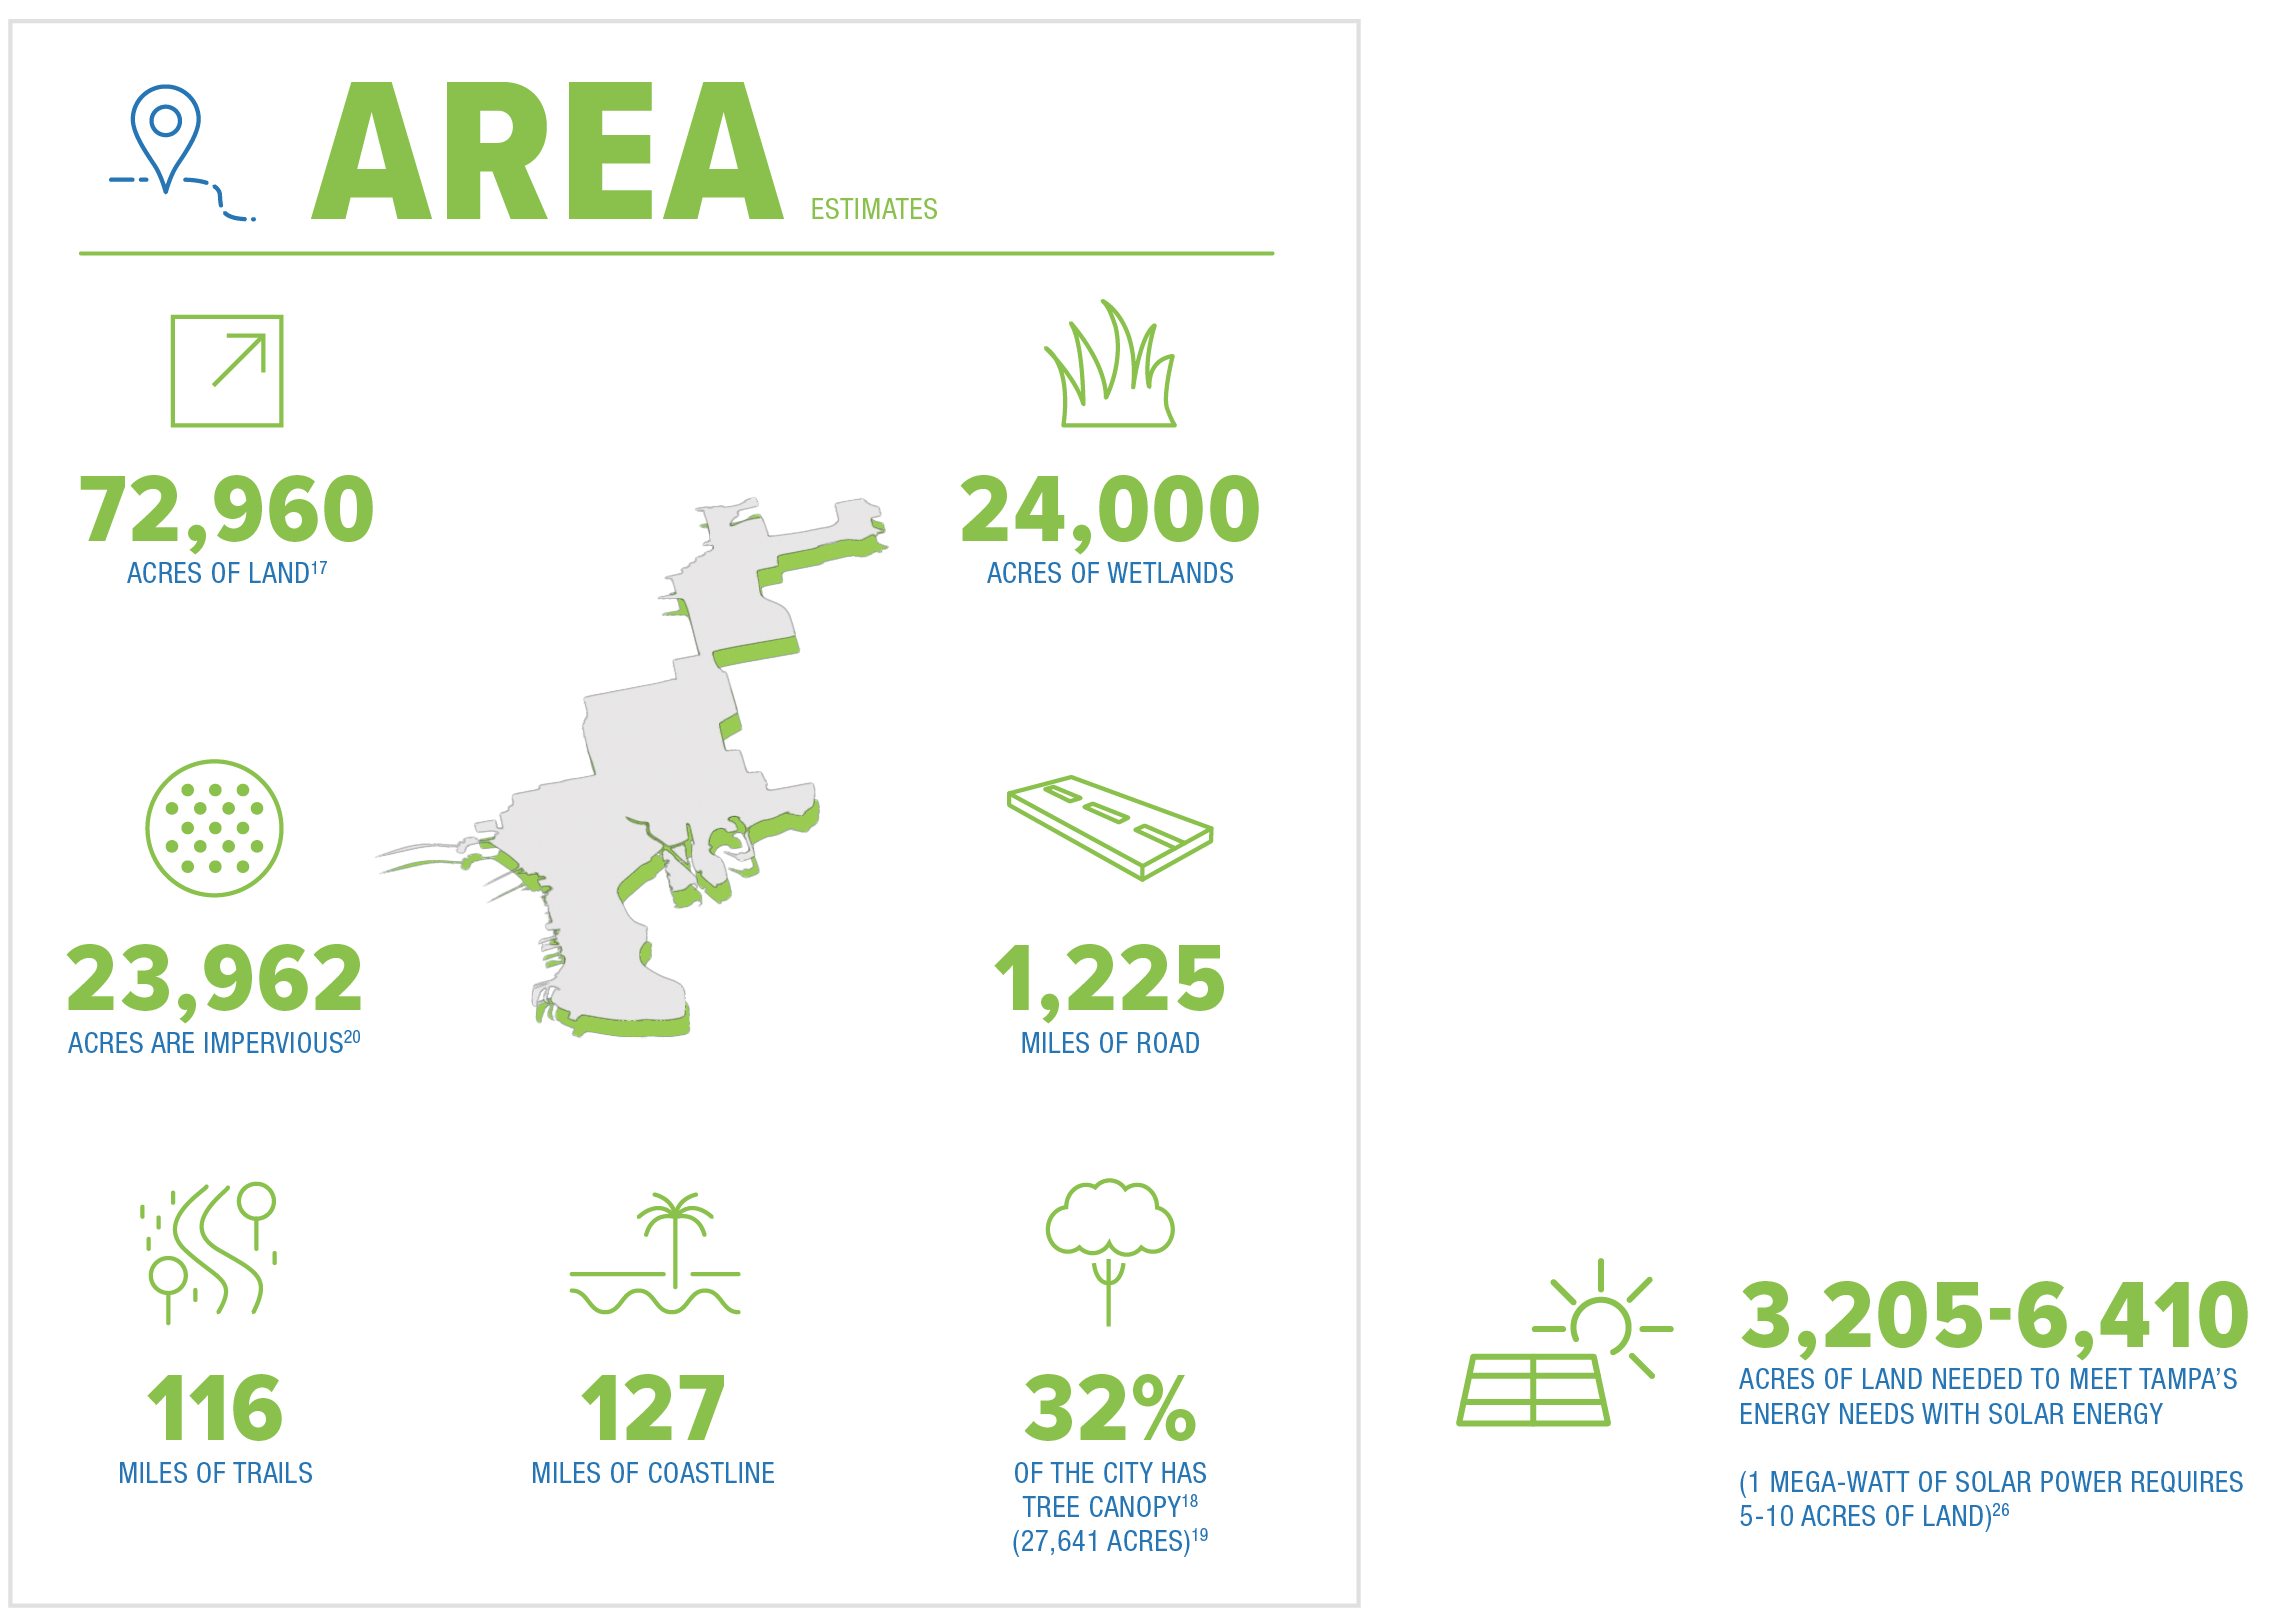
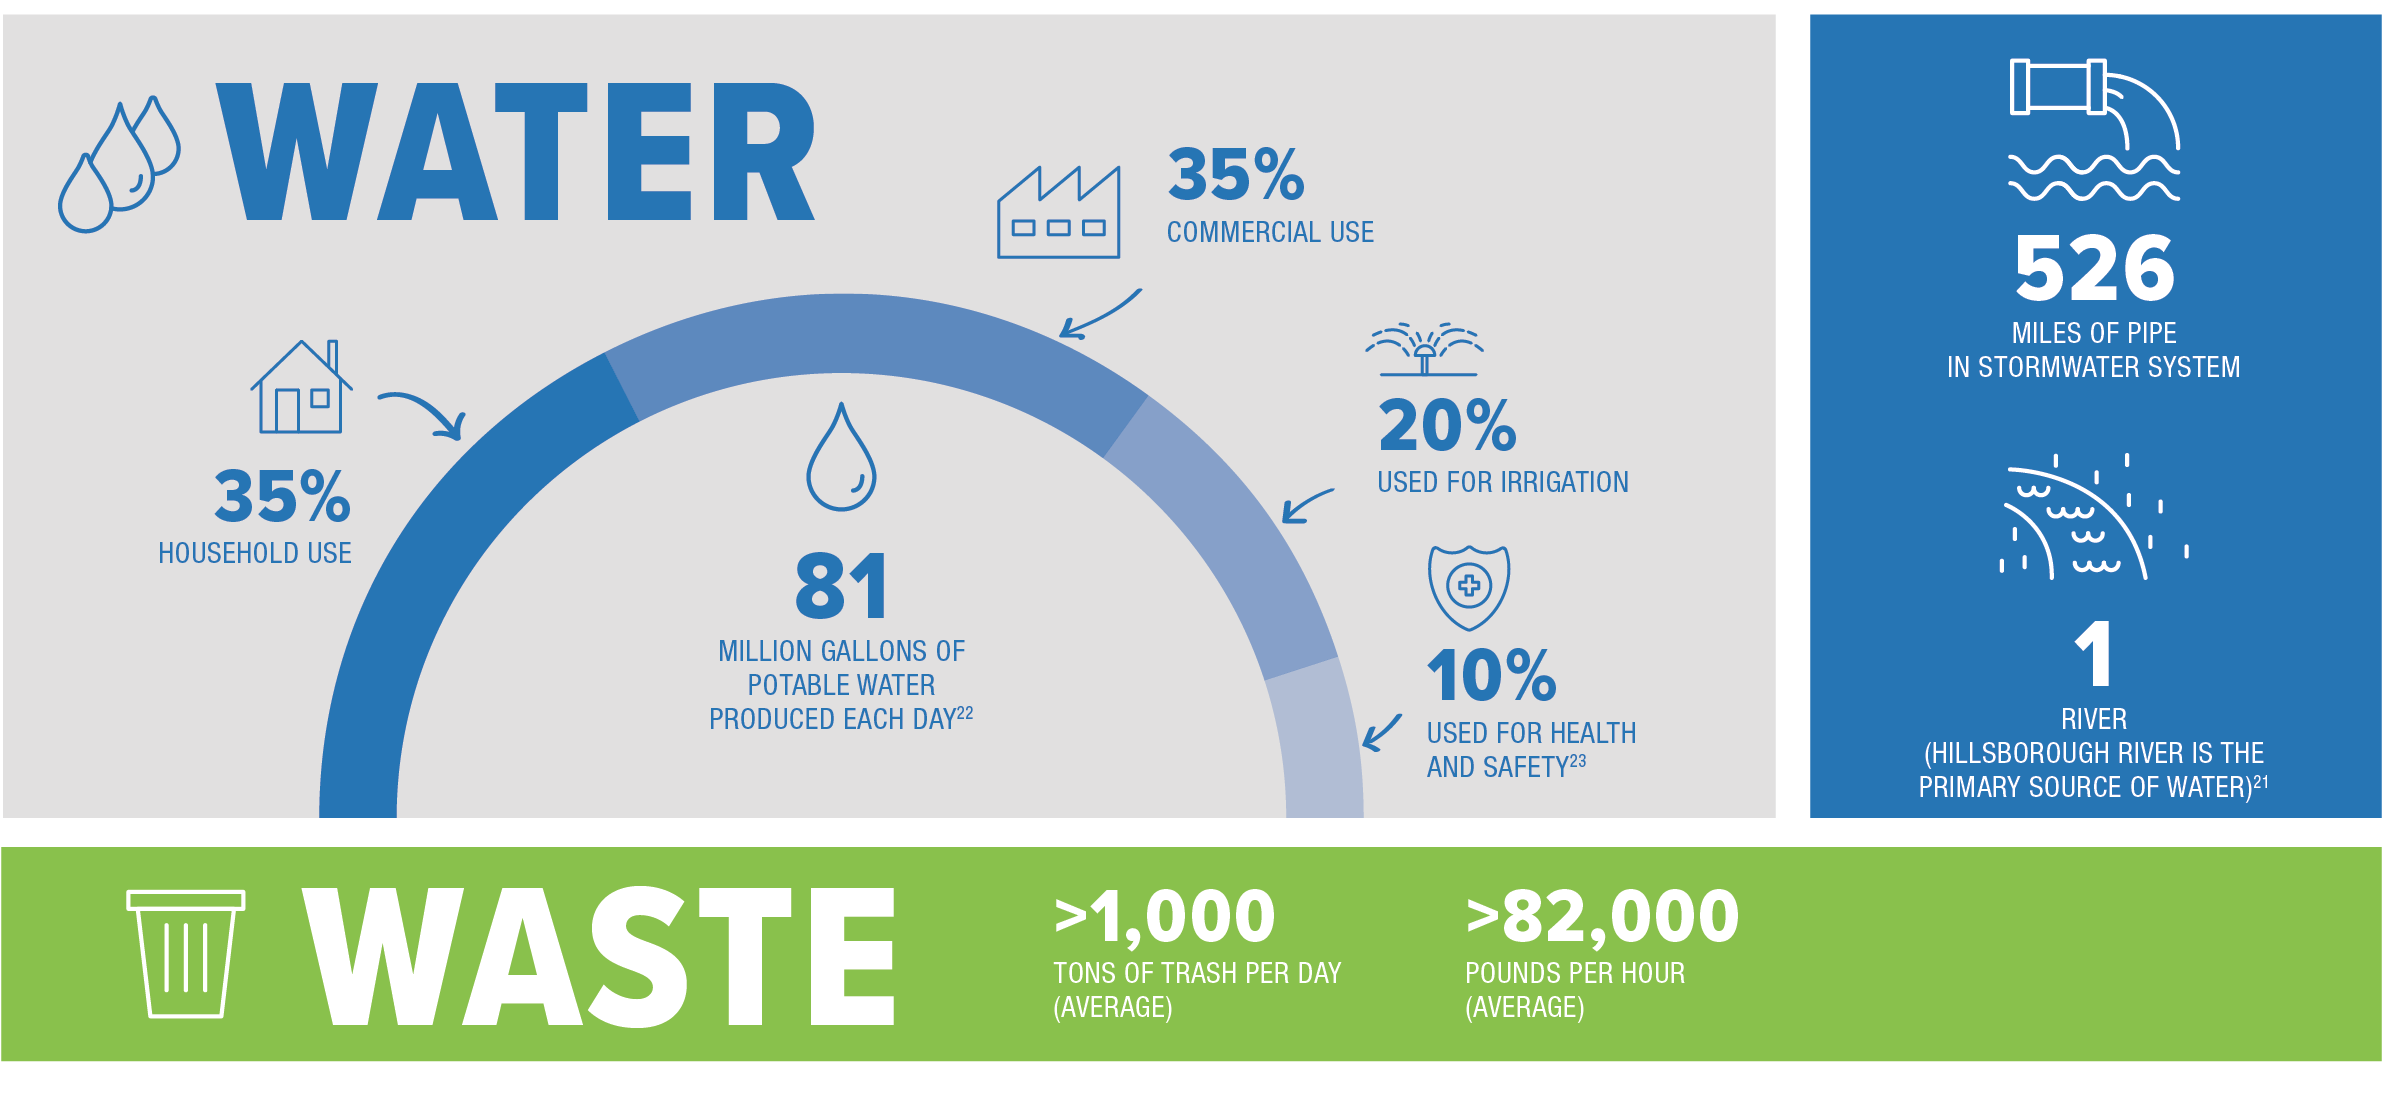
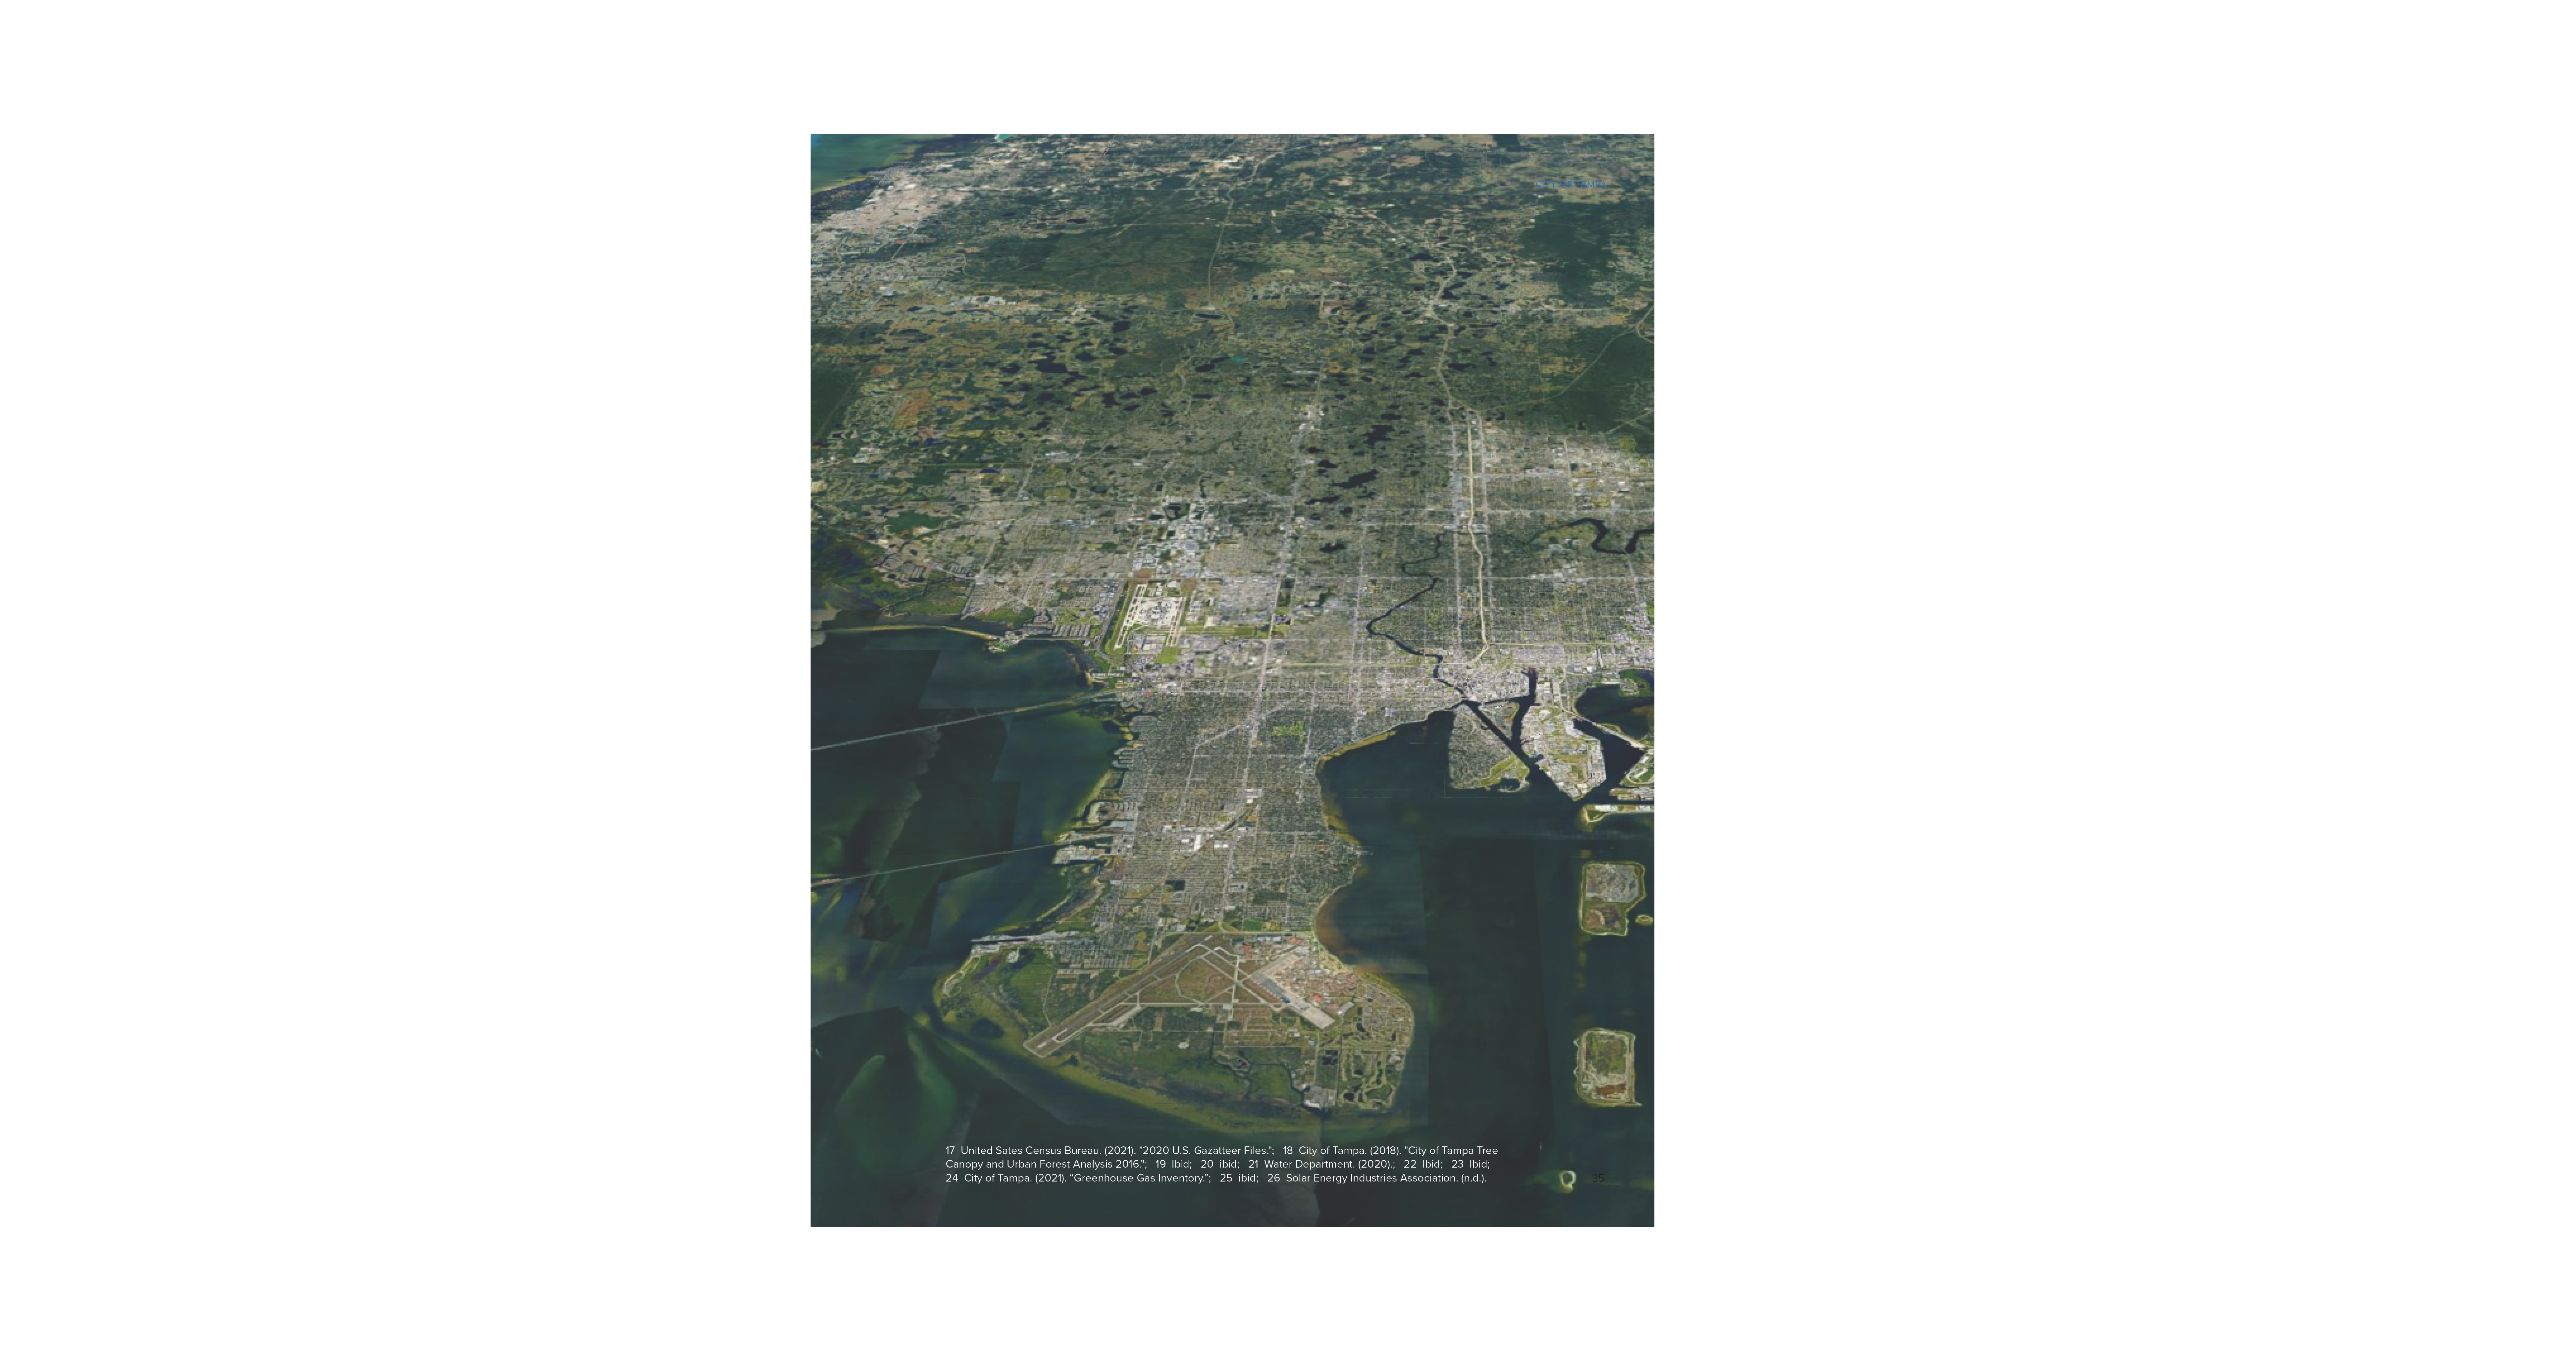
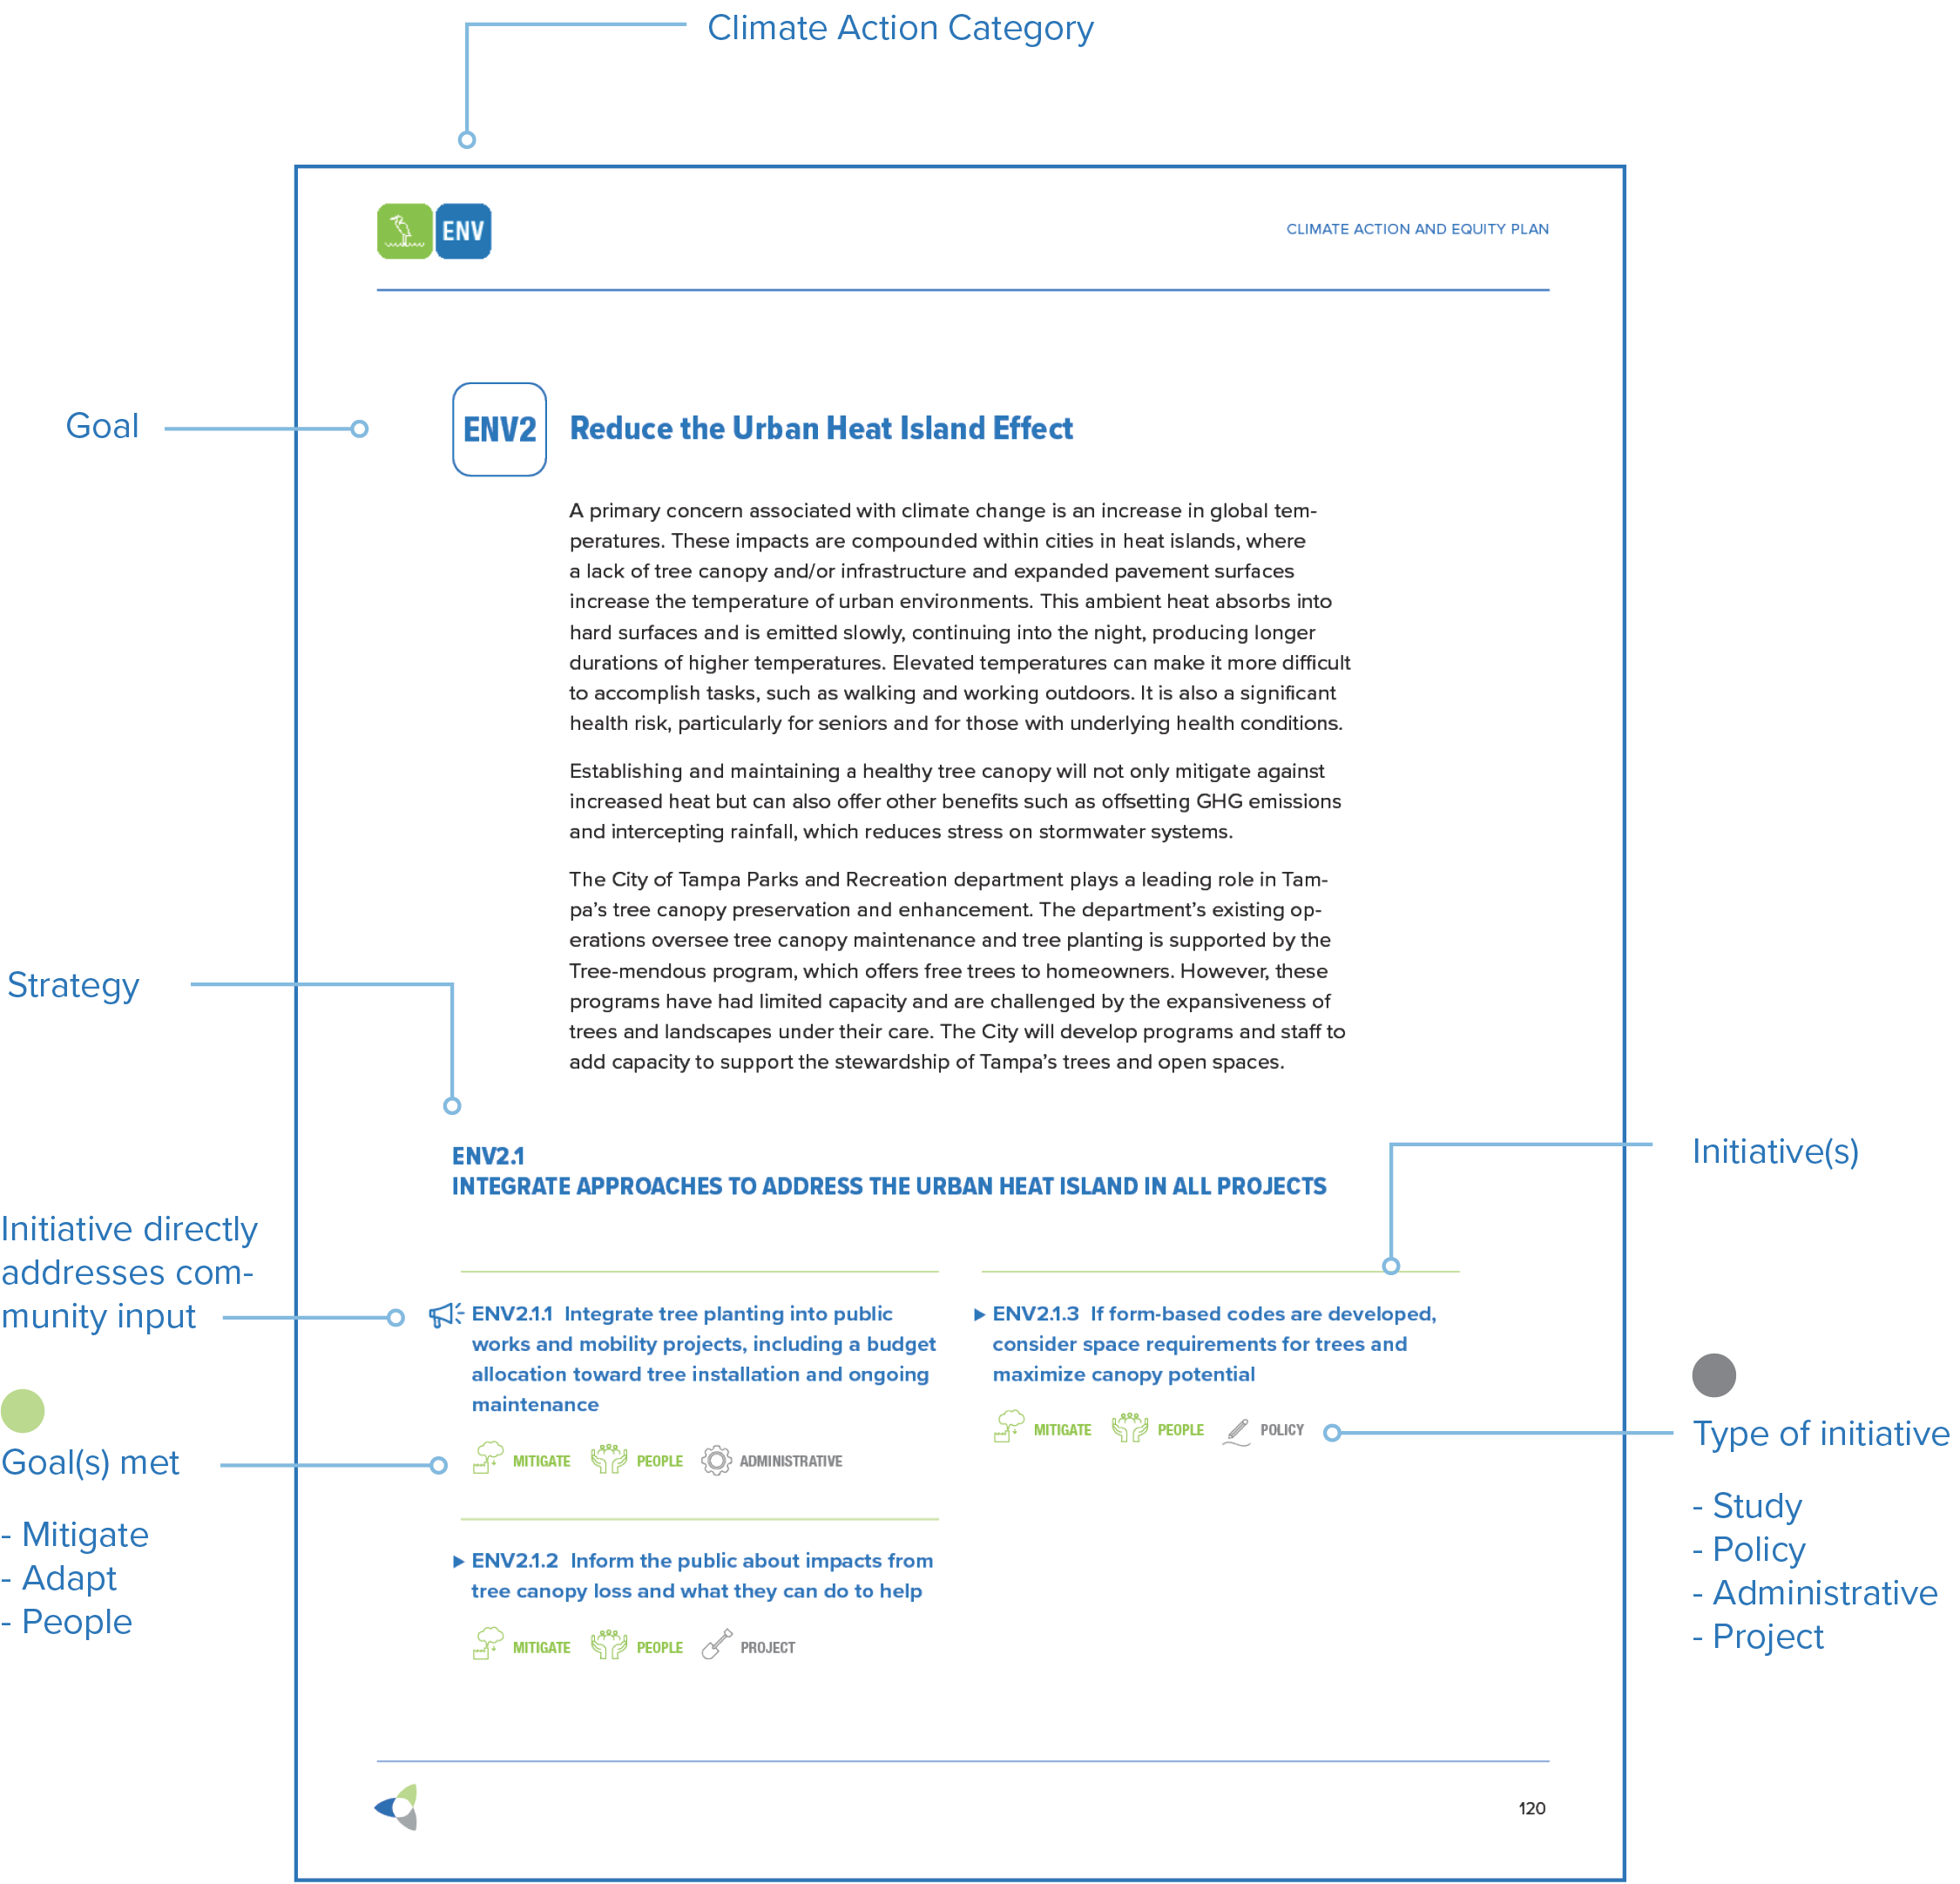
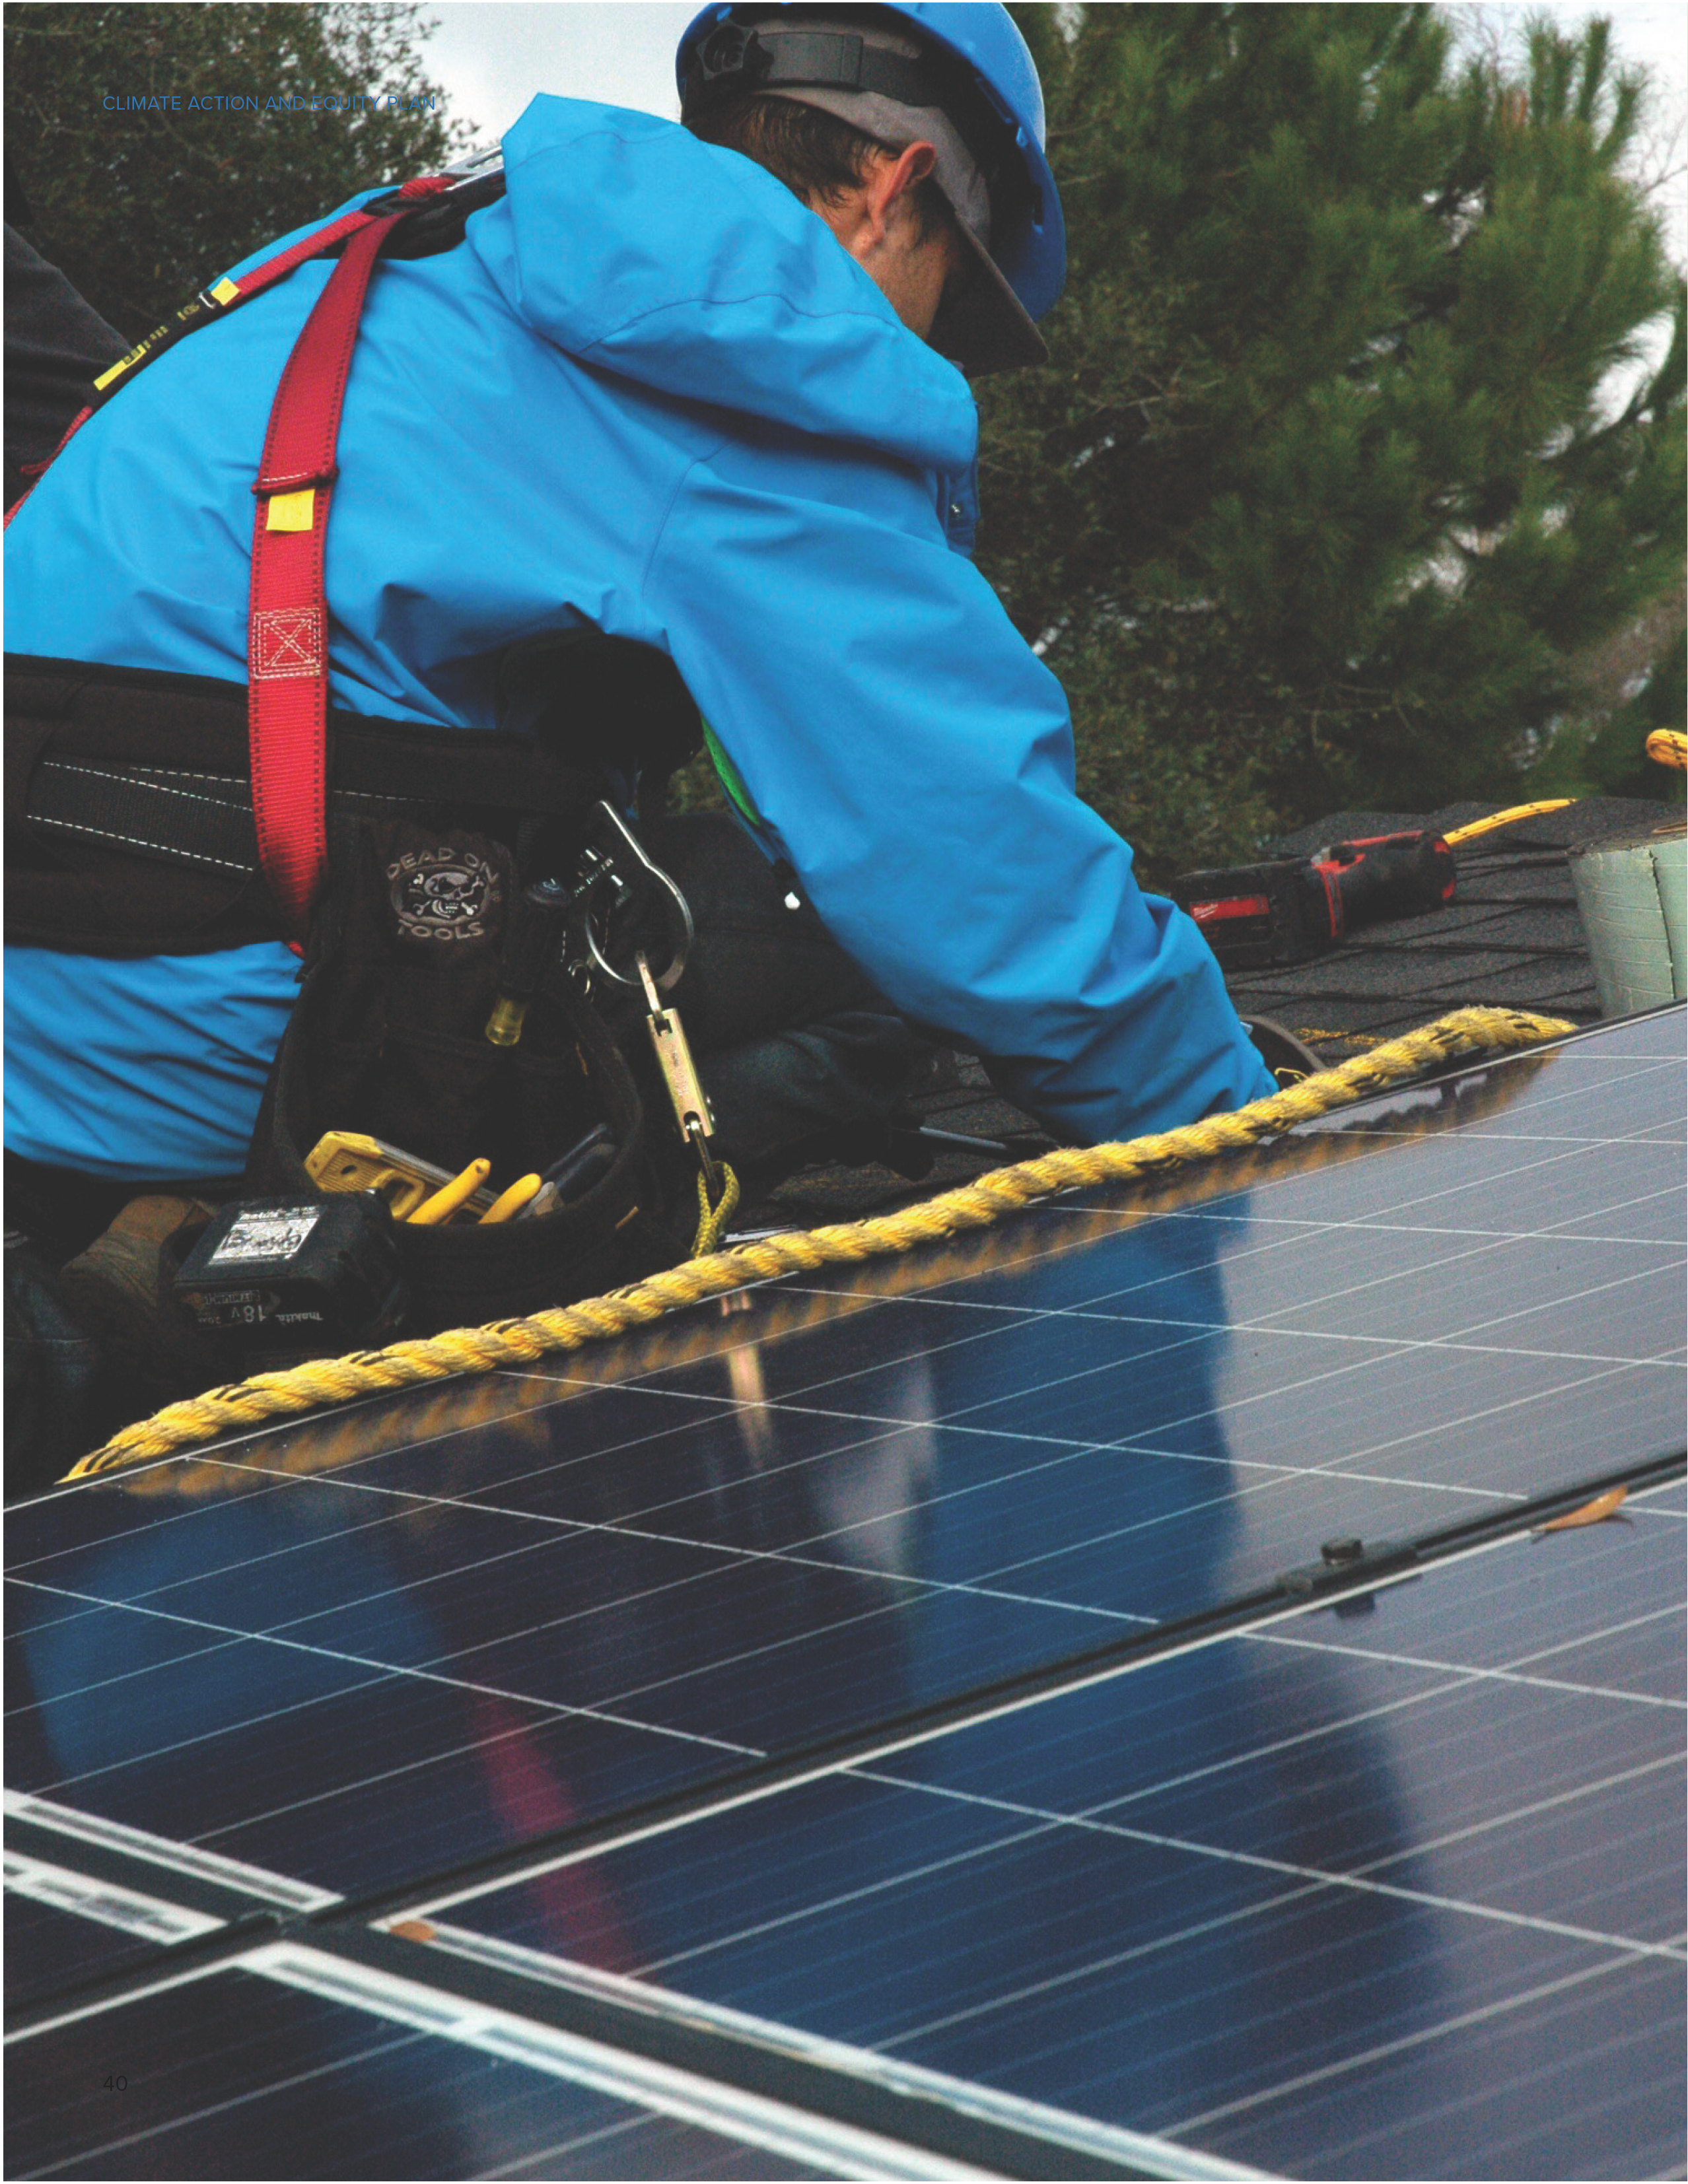
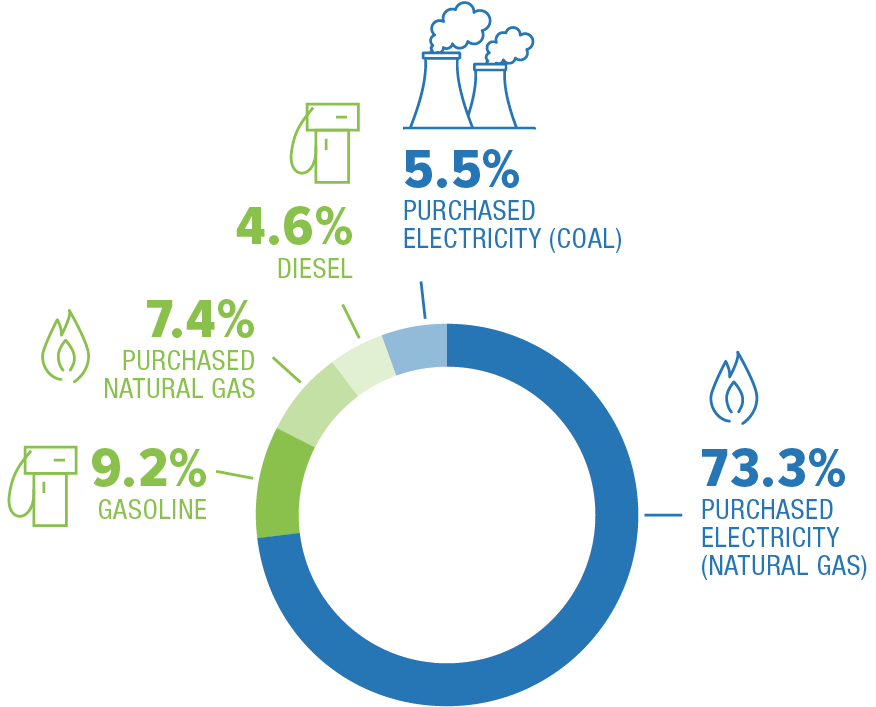


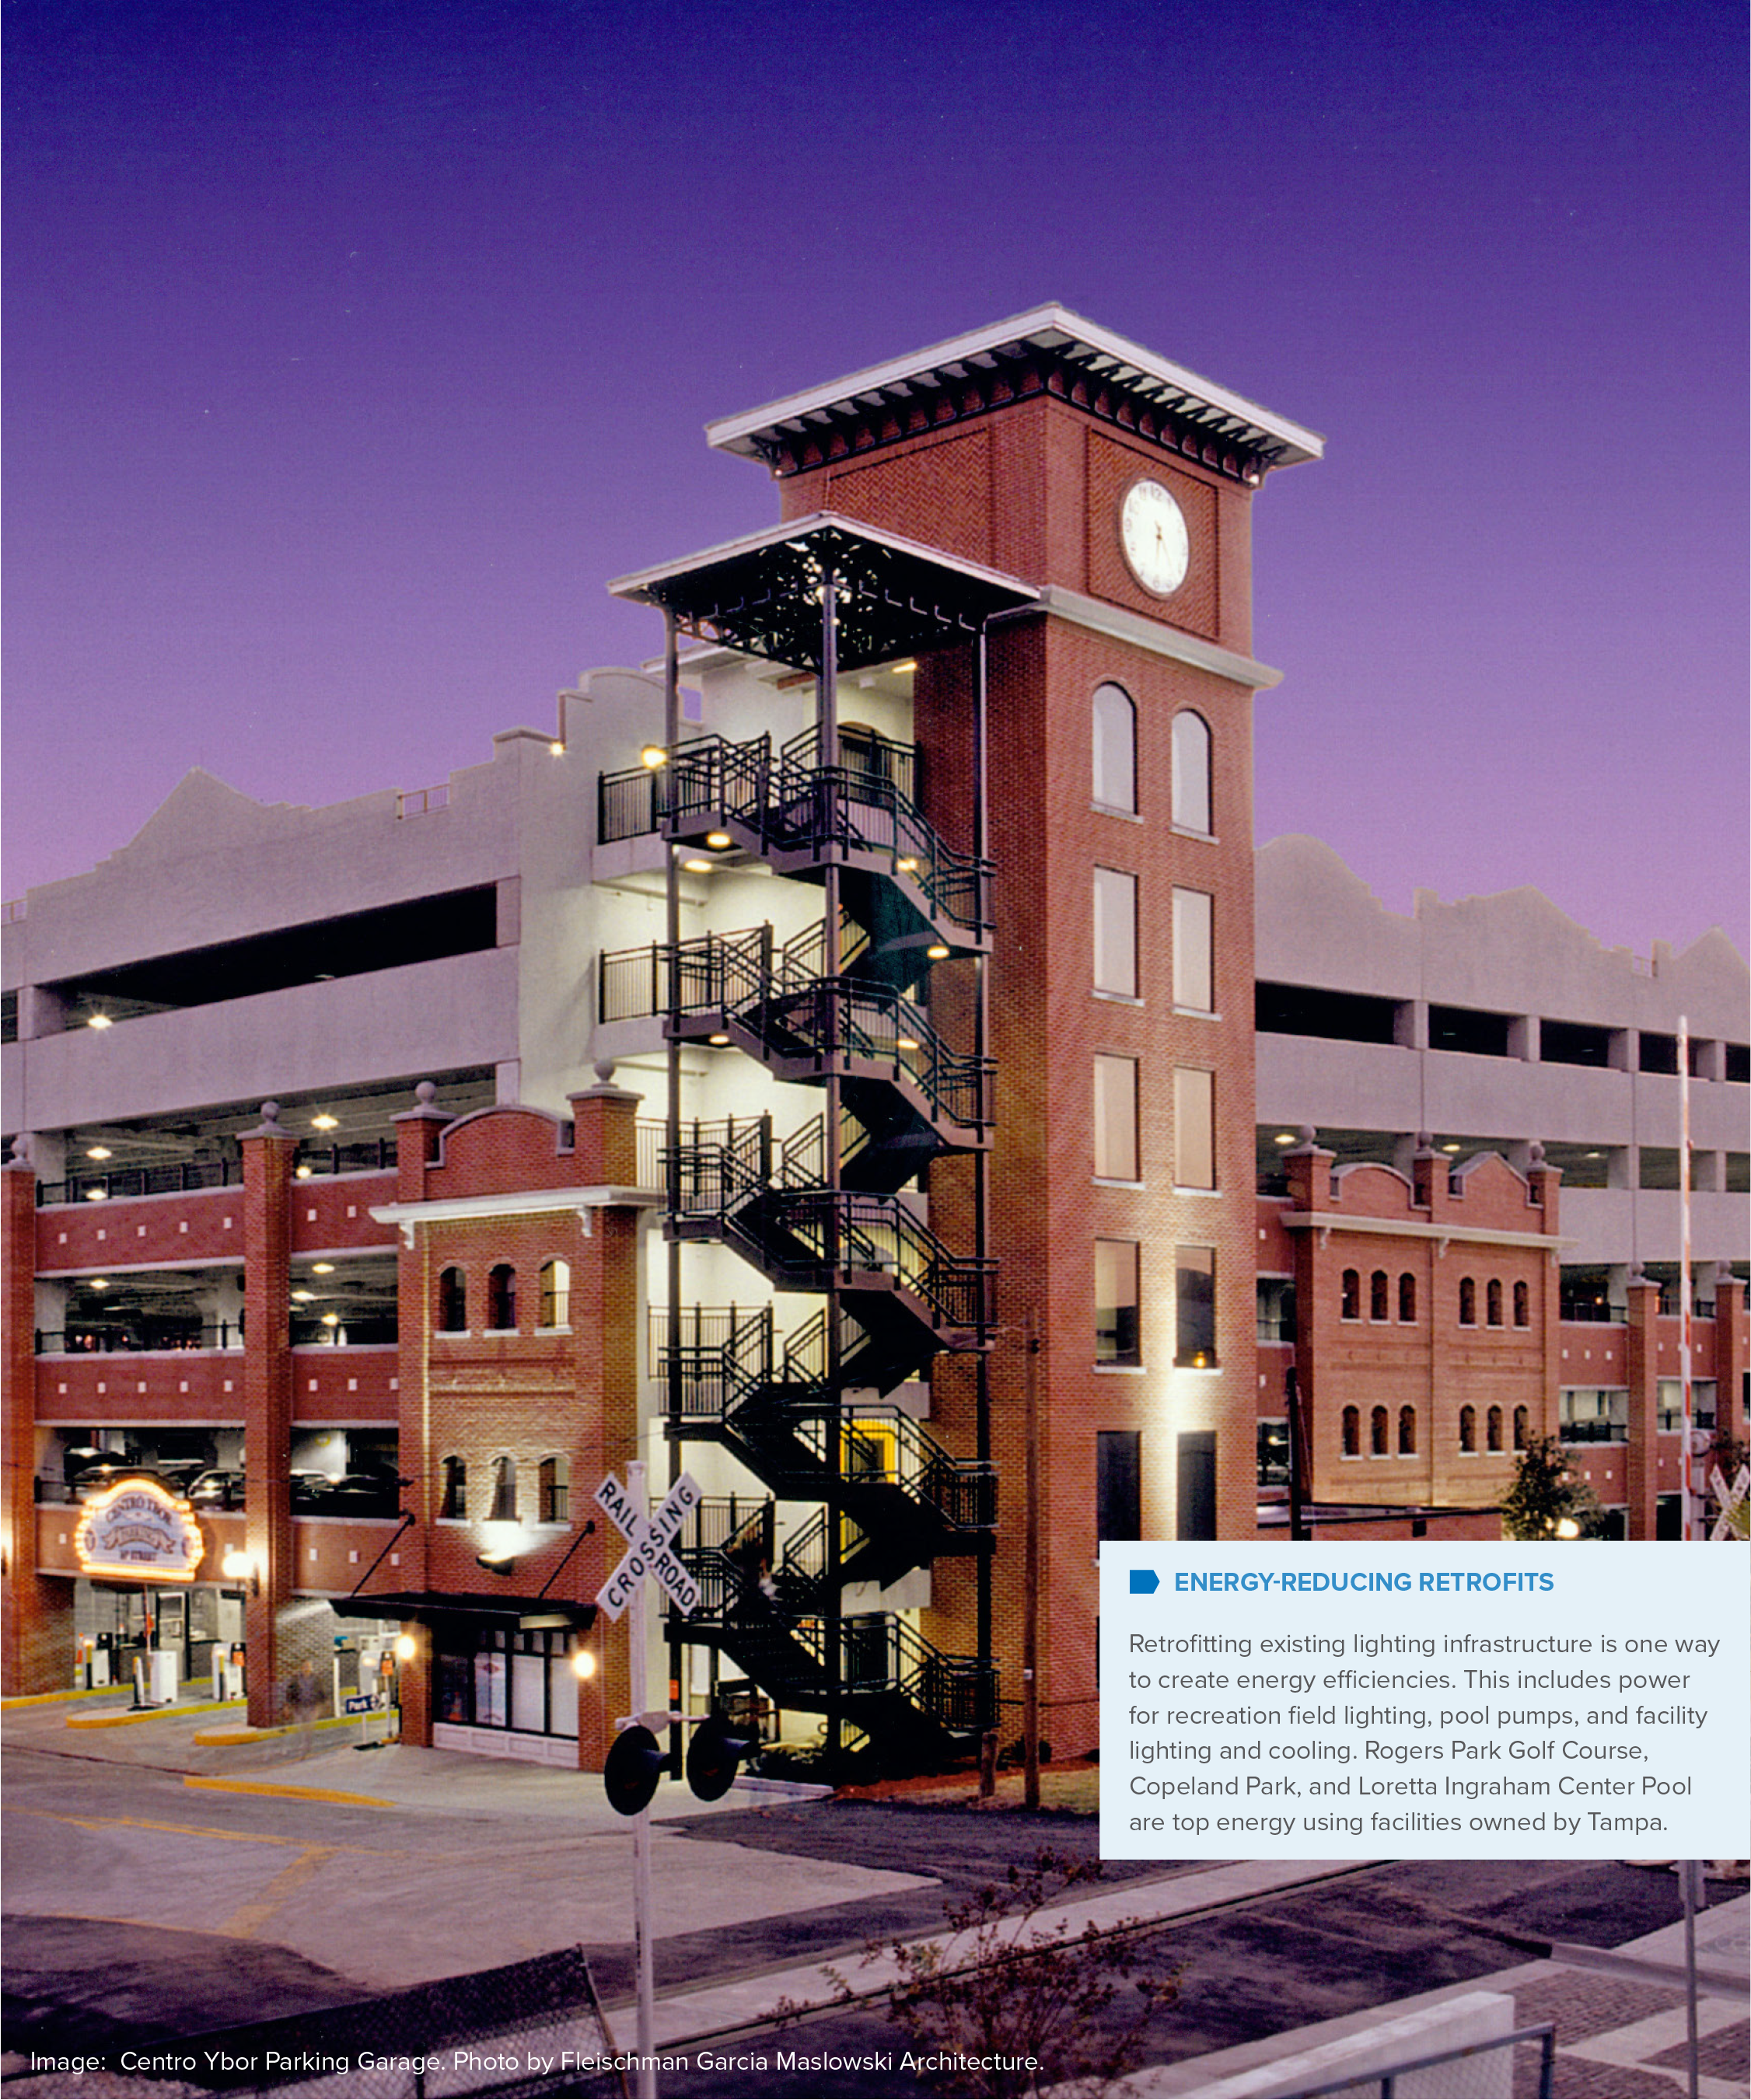




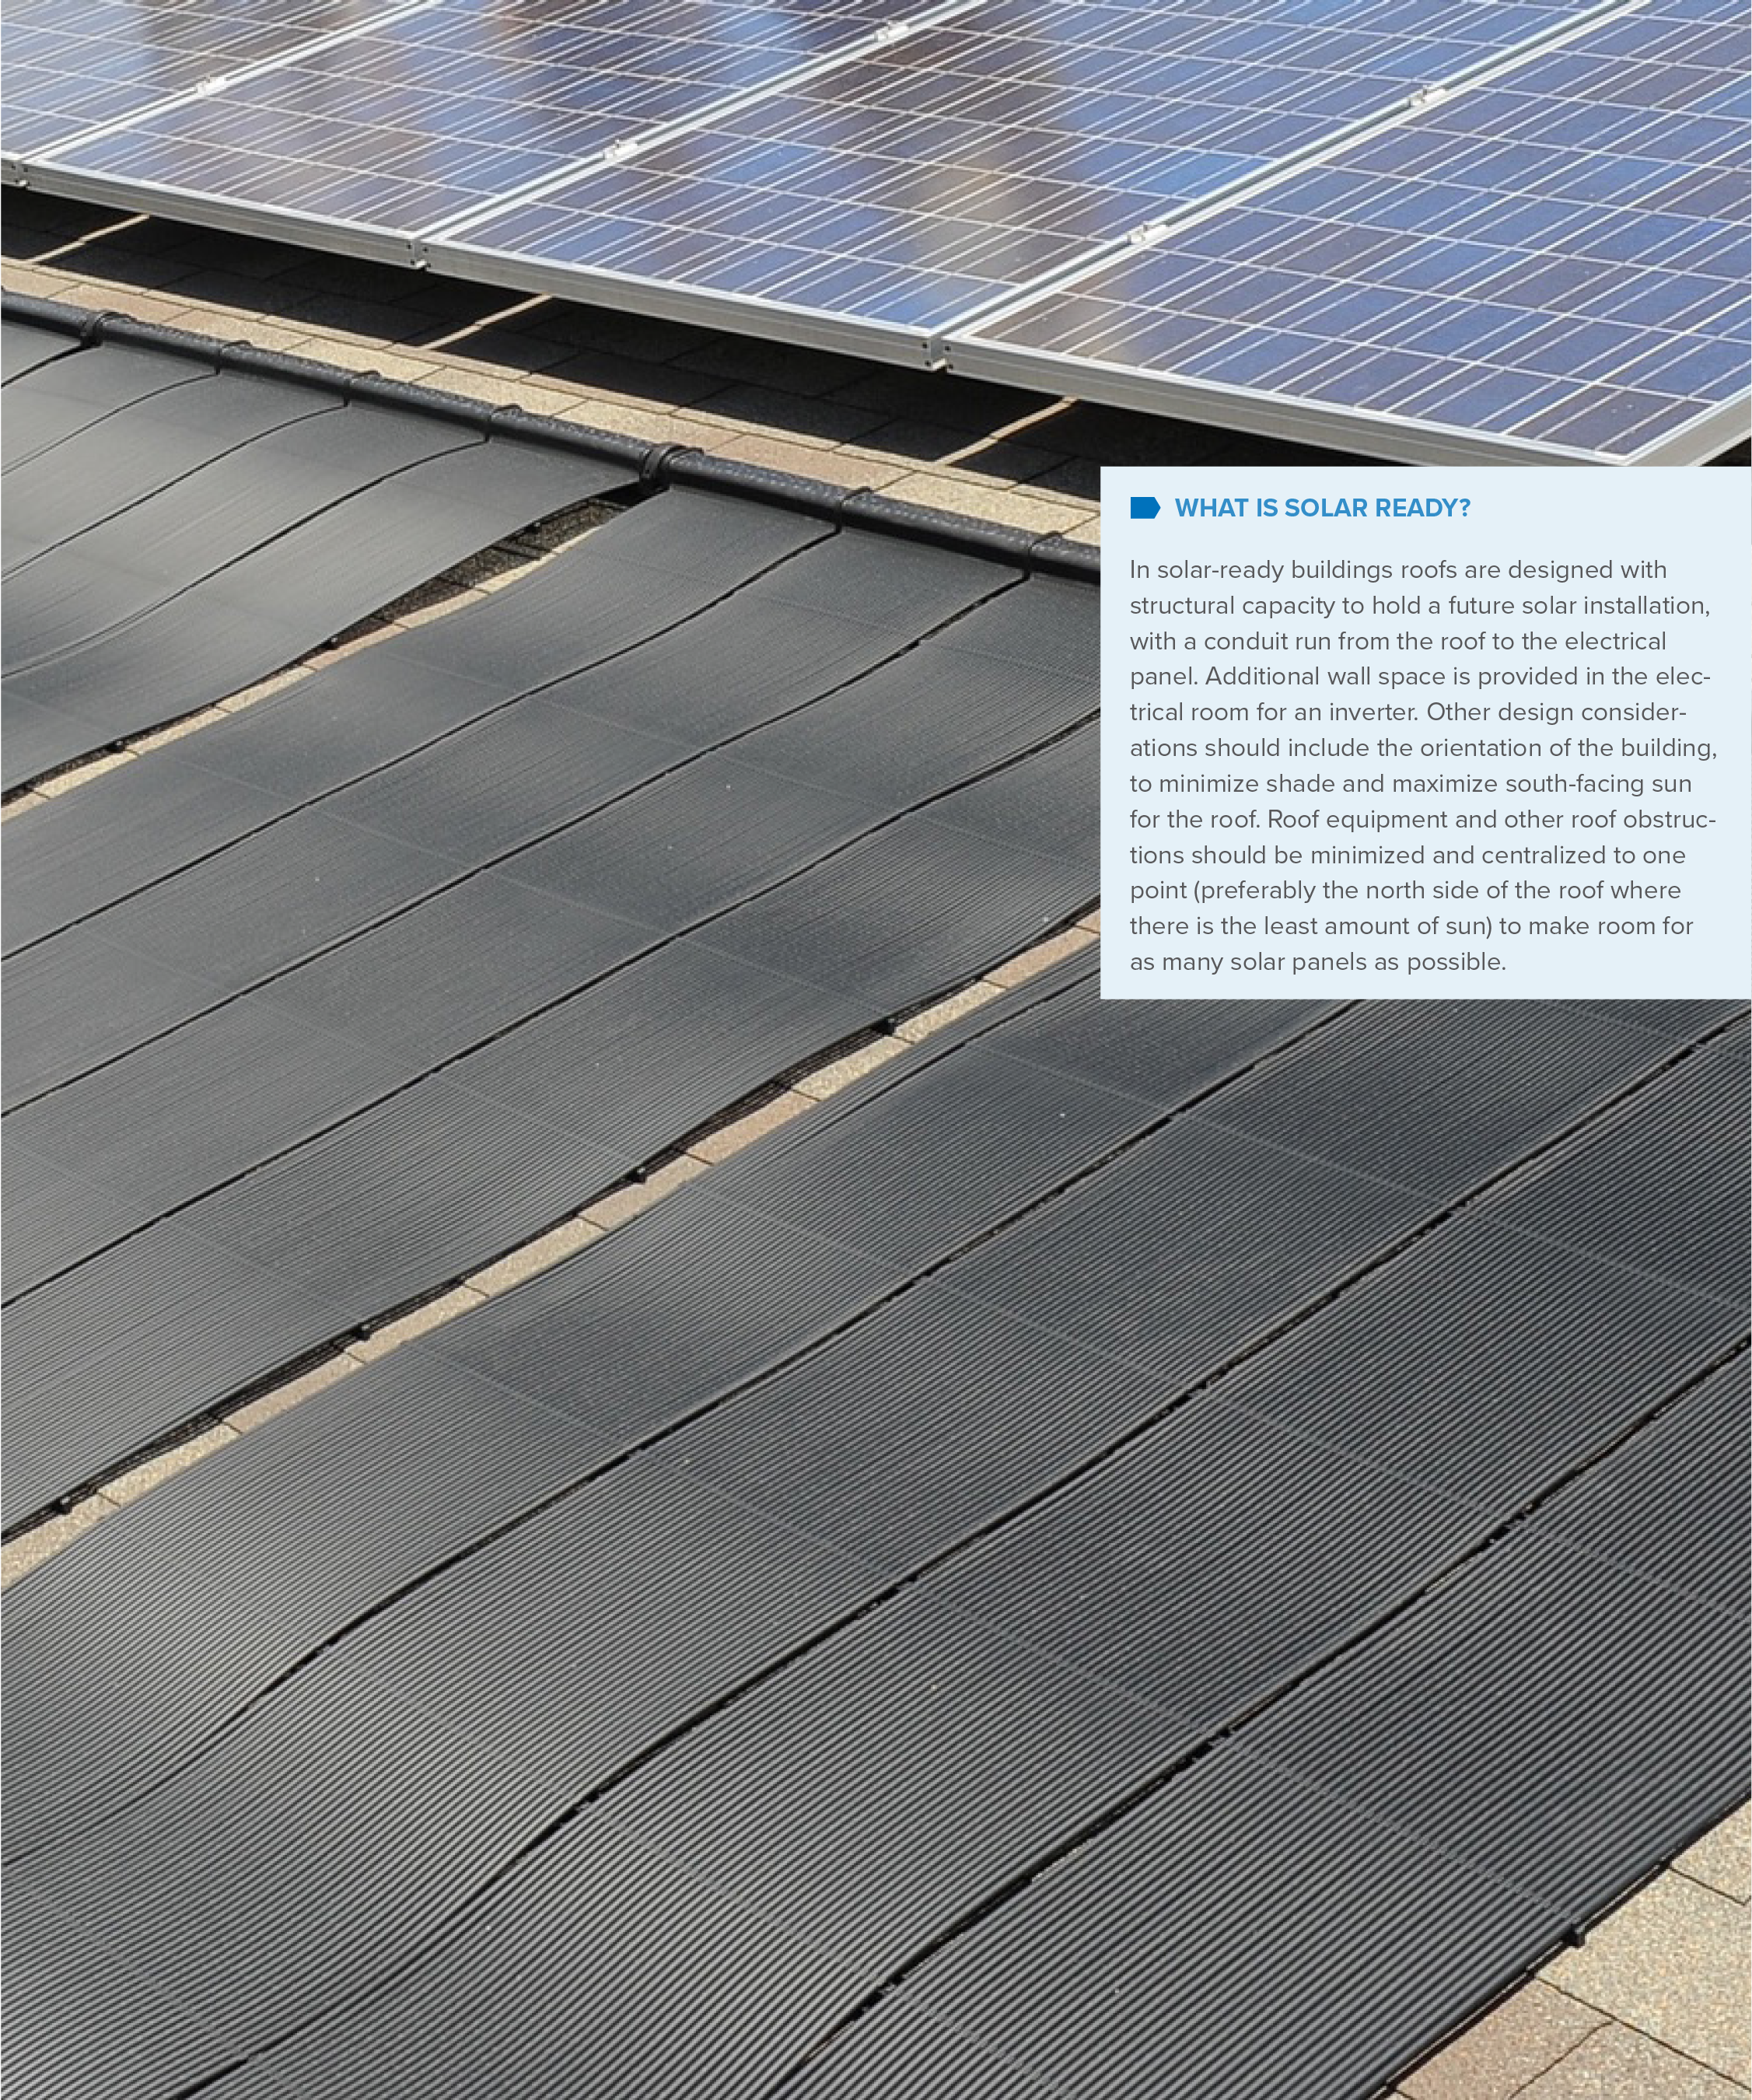
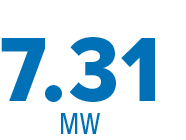
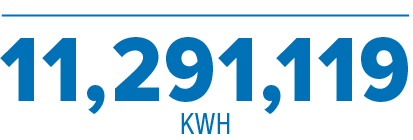
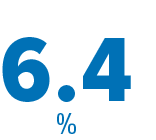
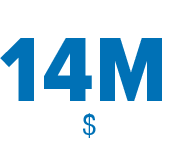
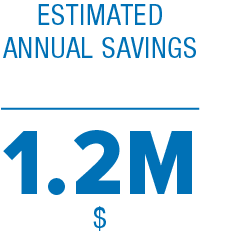
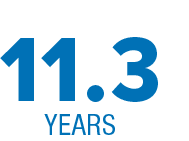
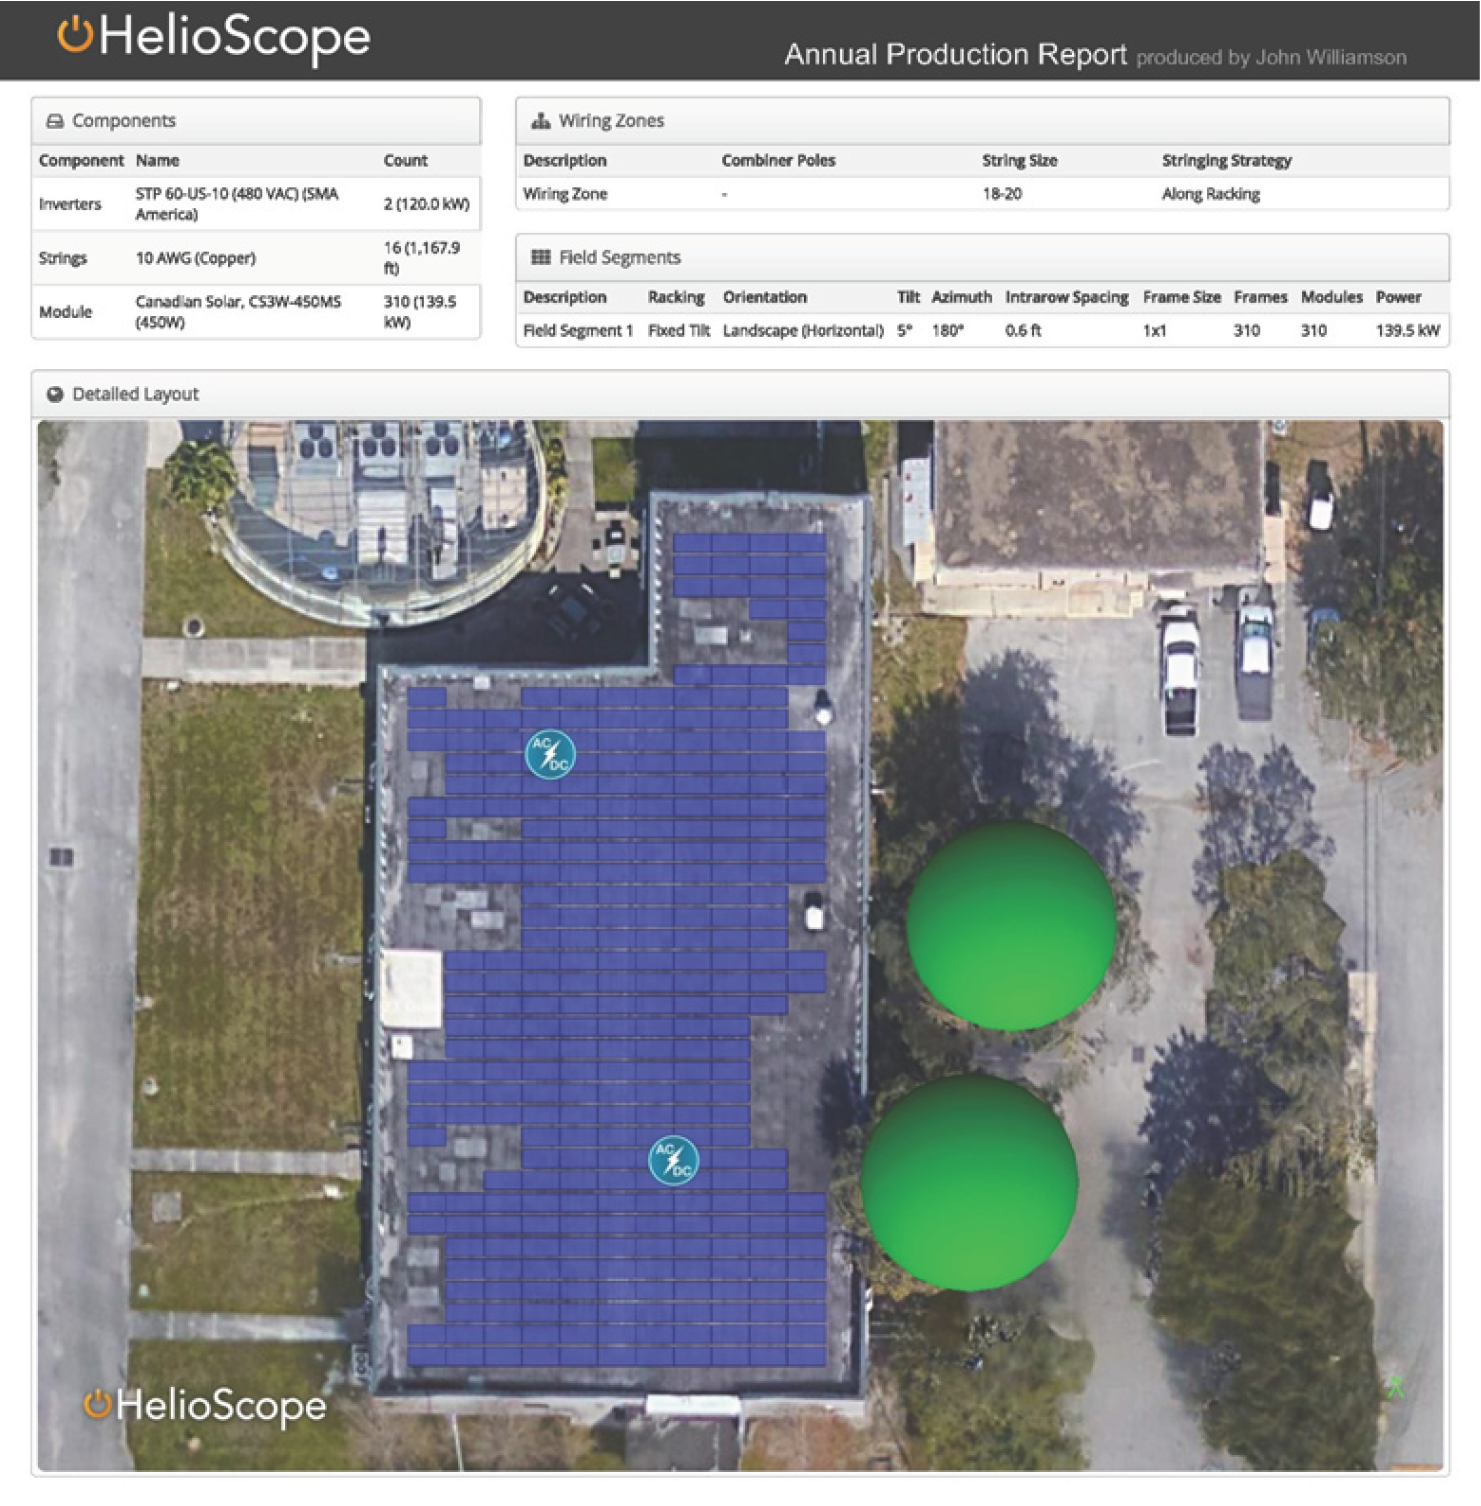
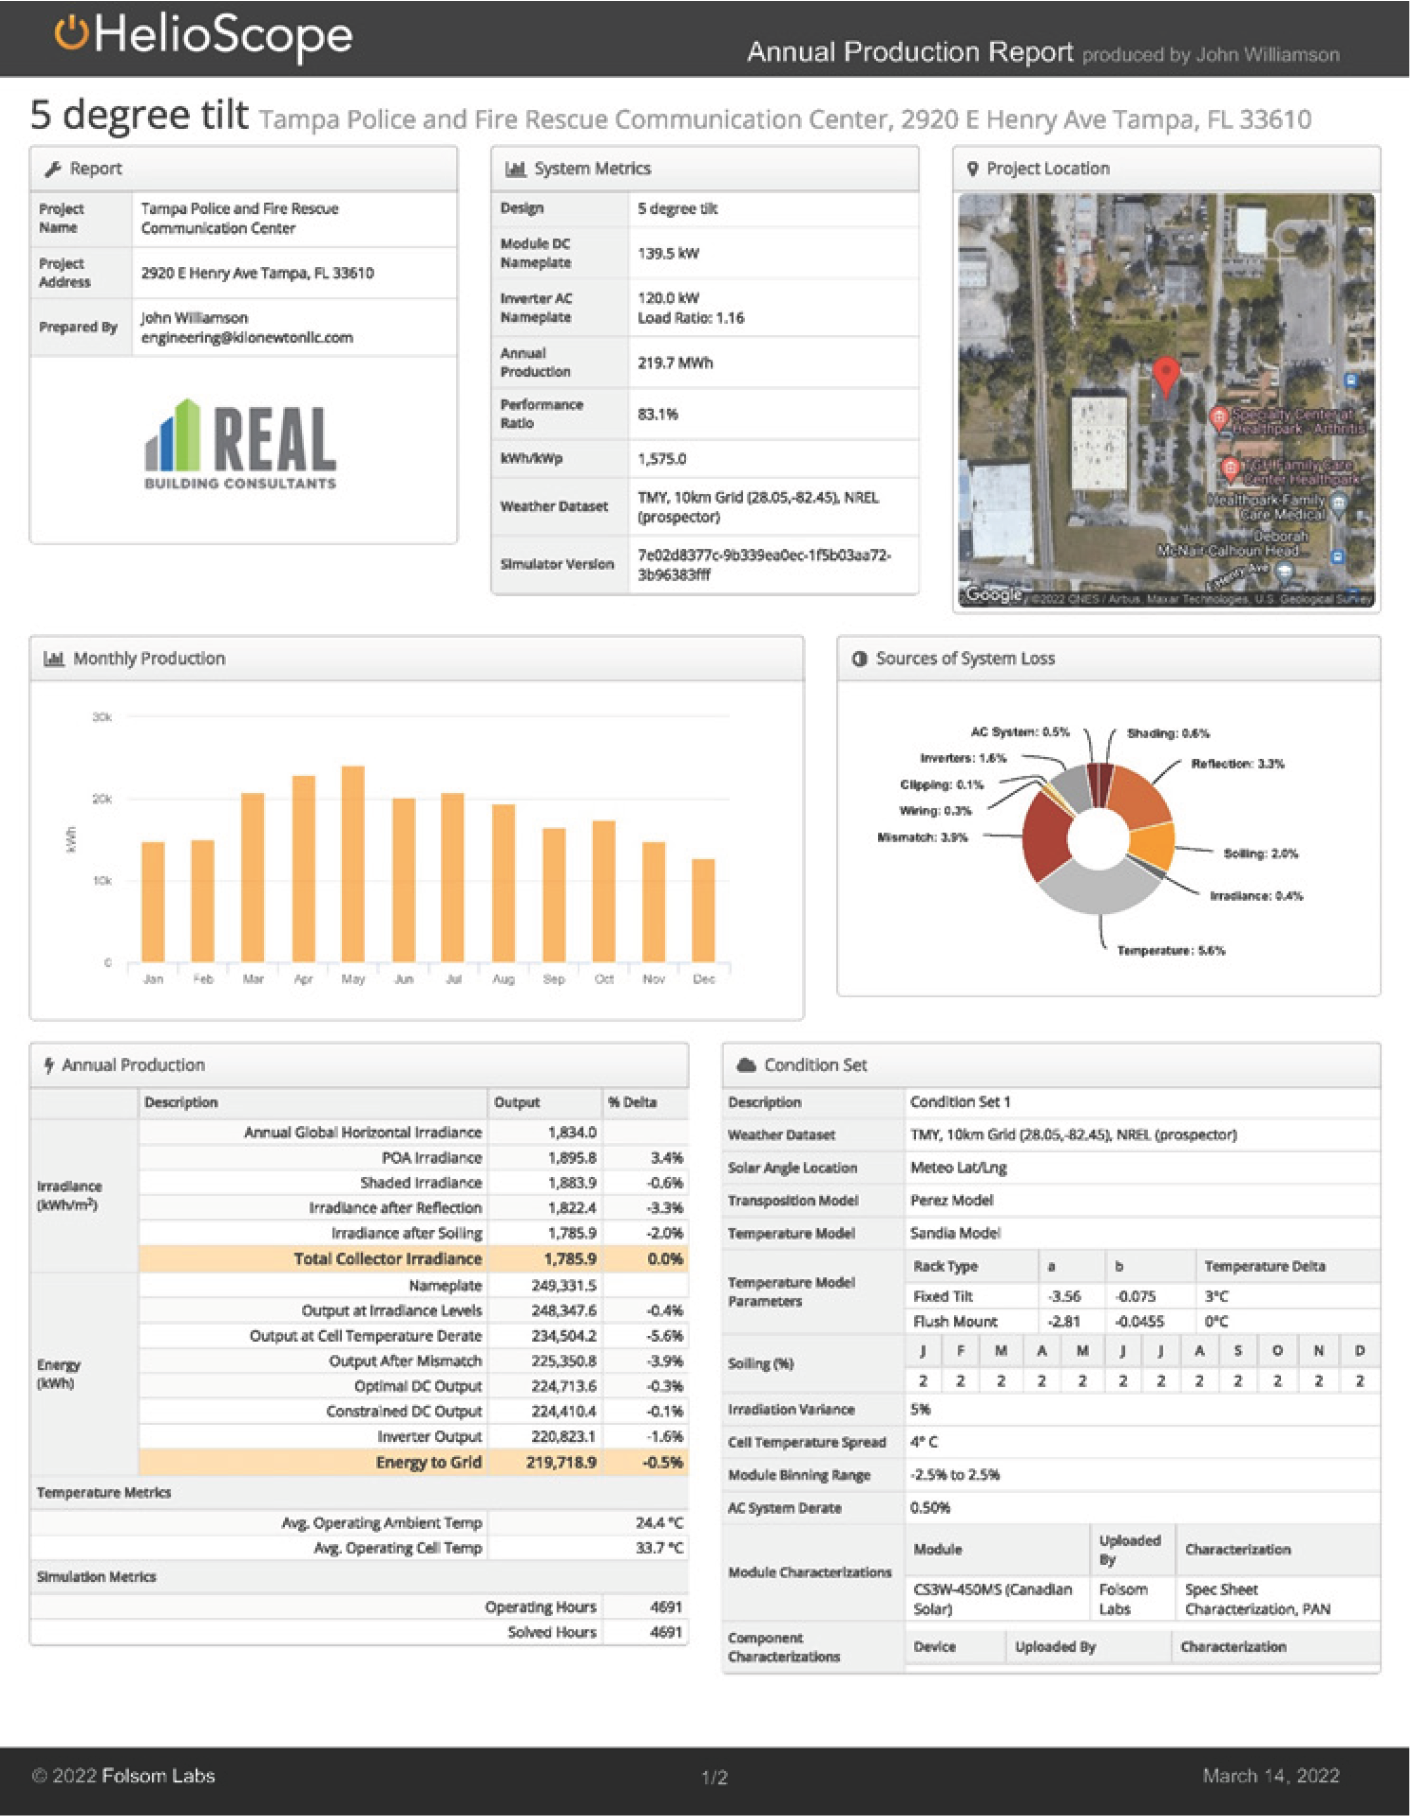
 MITIGATE
 POLICY
 MITIGATE
 ADMINISTRATIVE
 MITIGATE
 ADMINISTRATIVE
 MITIGATE
 STUDY
STUDY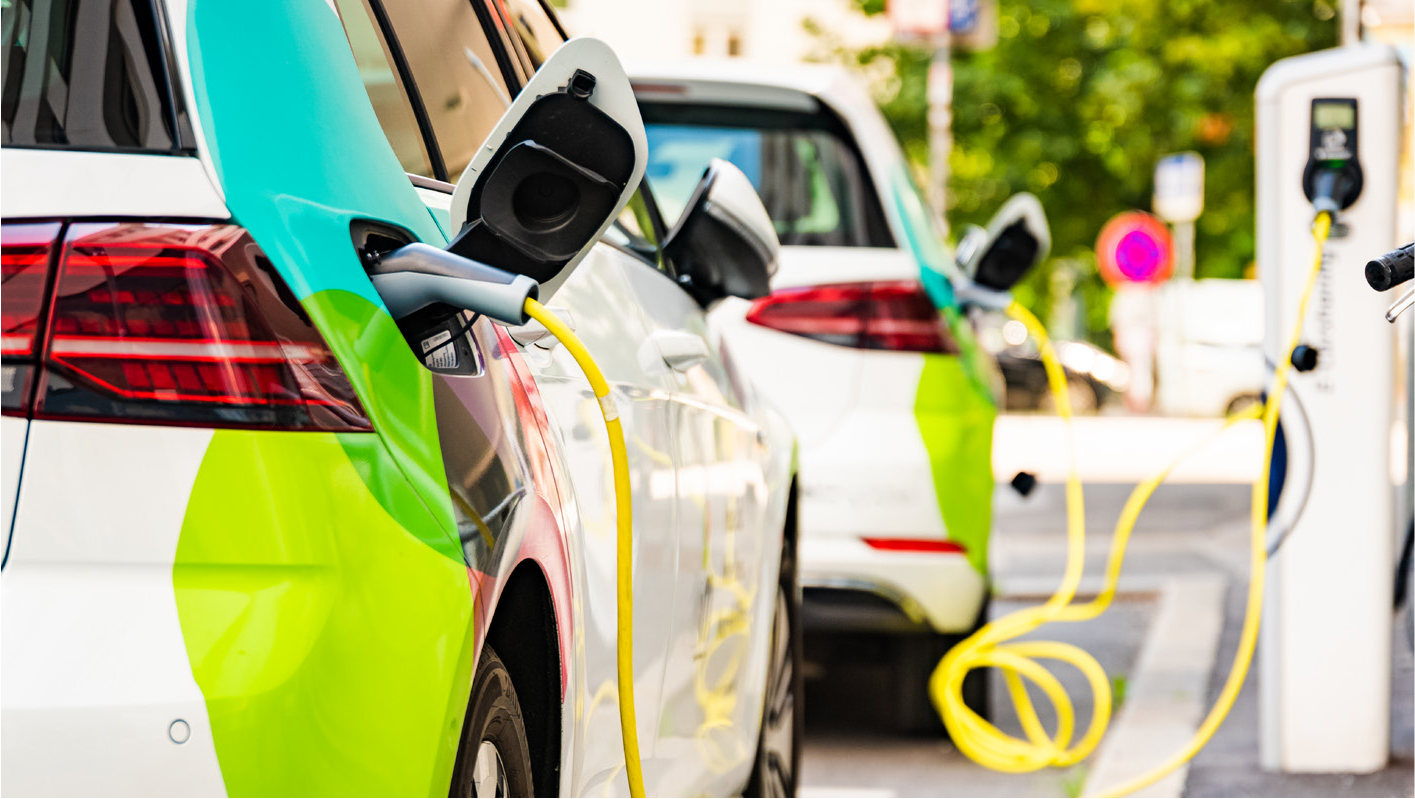


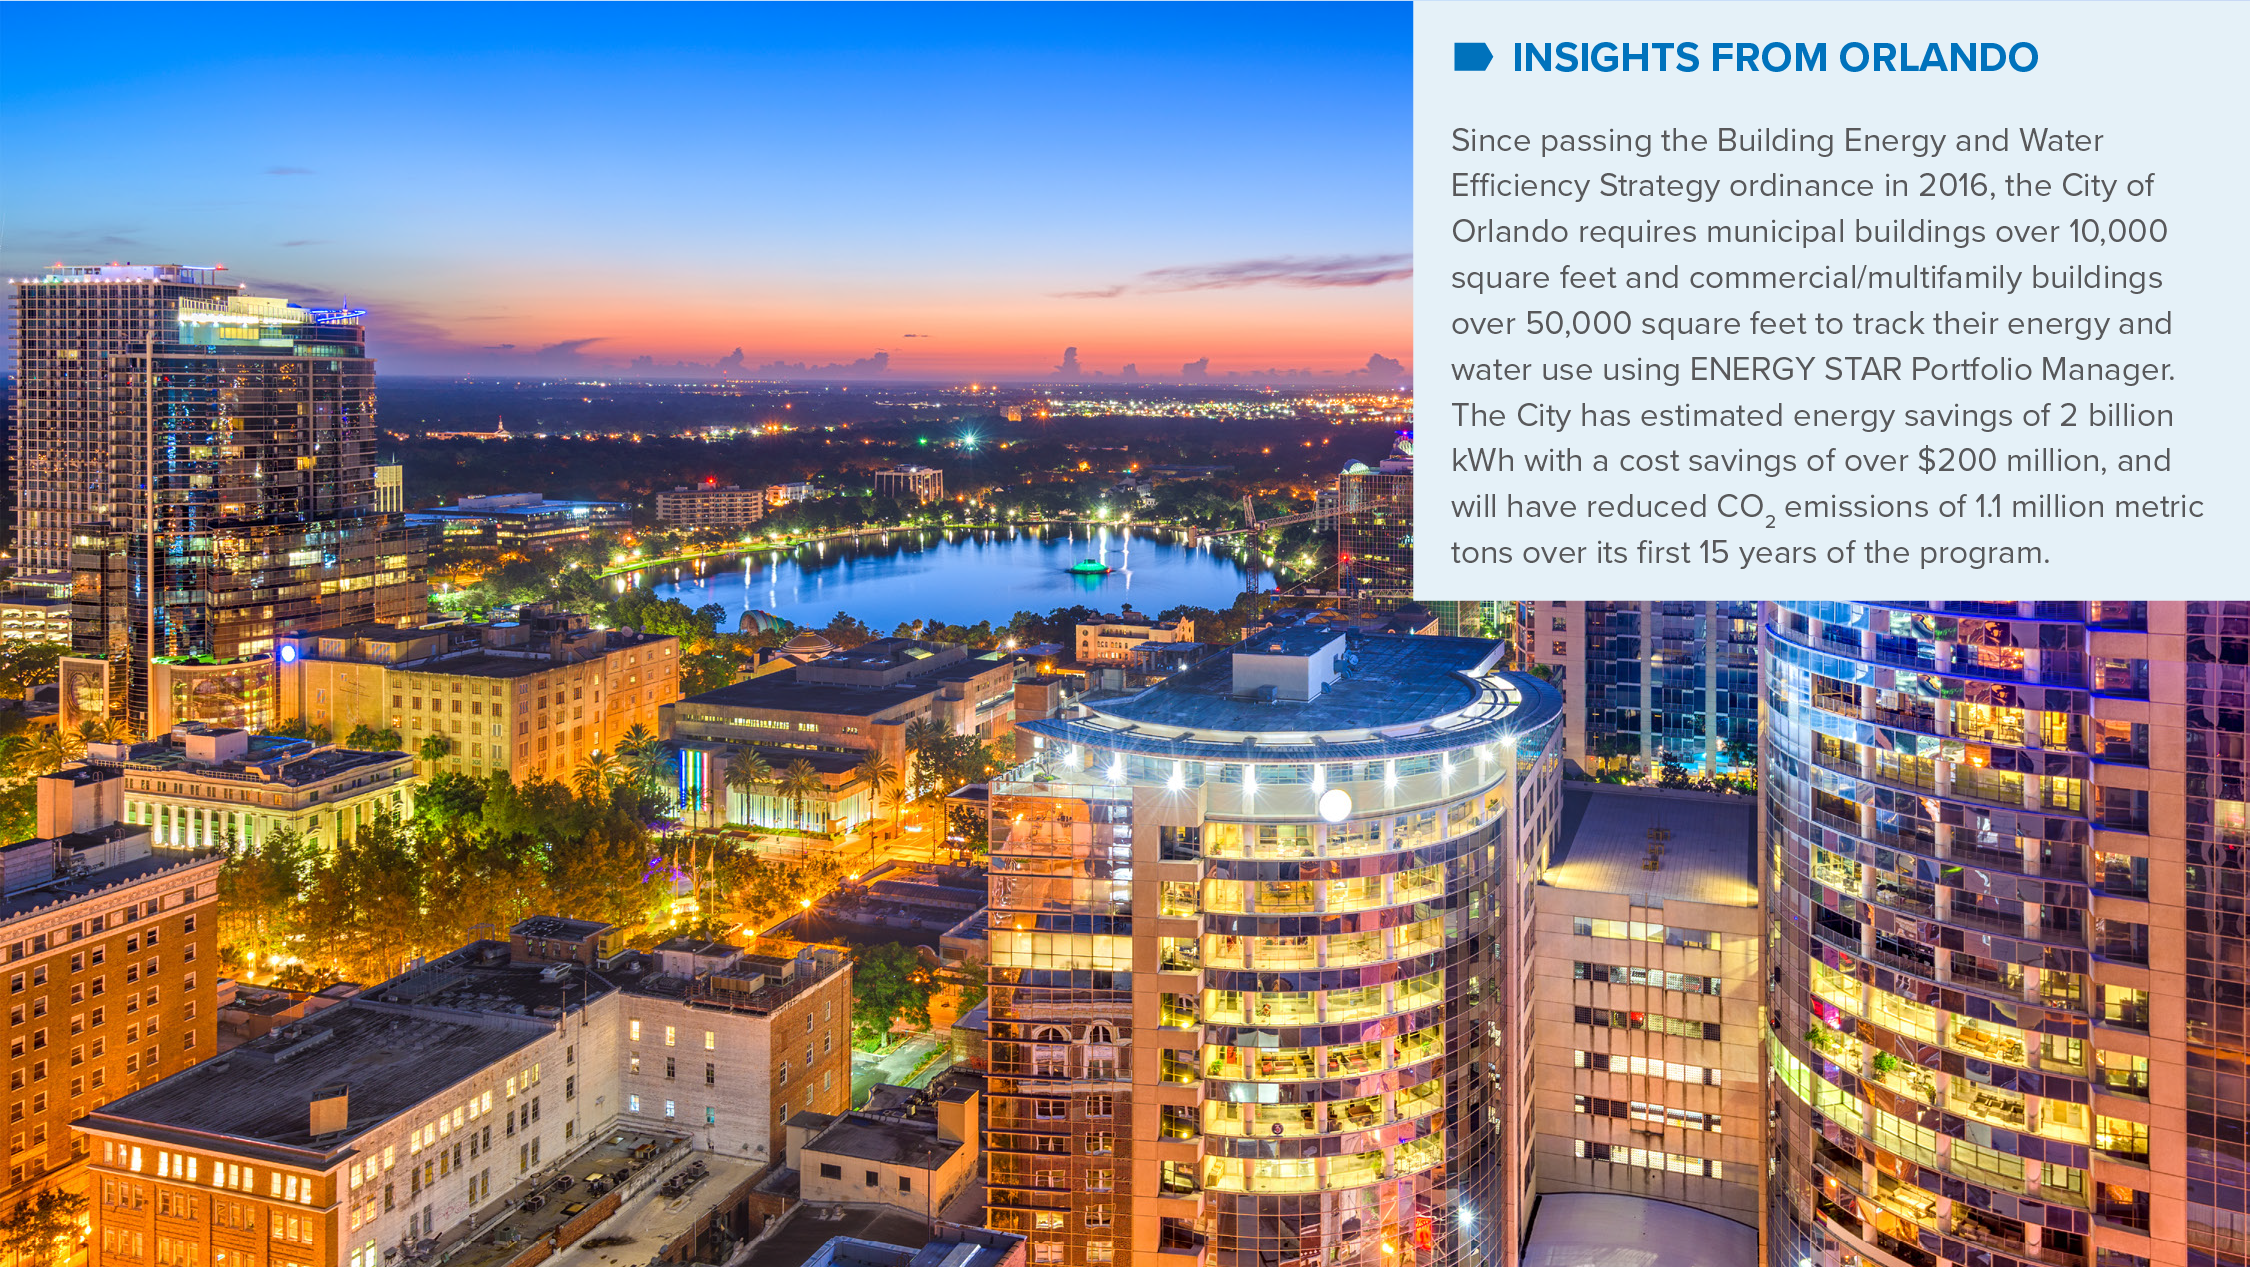
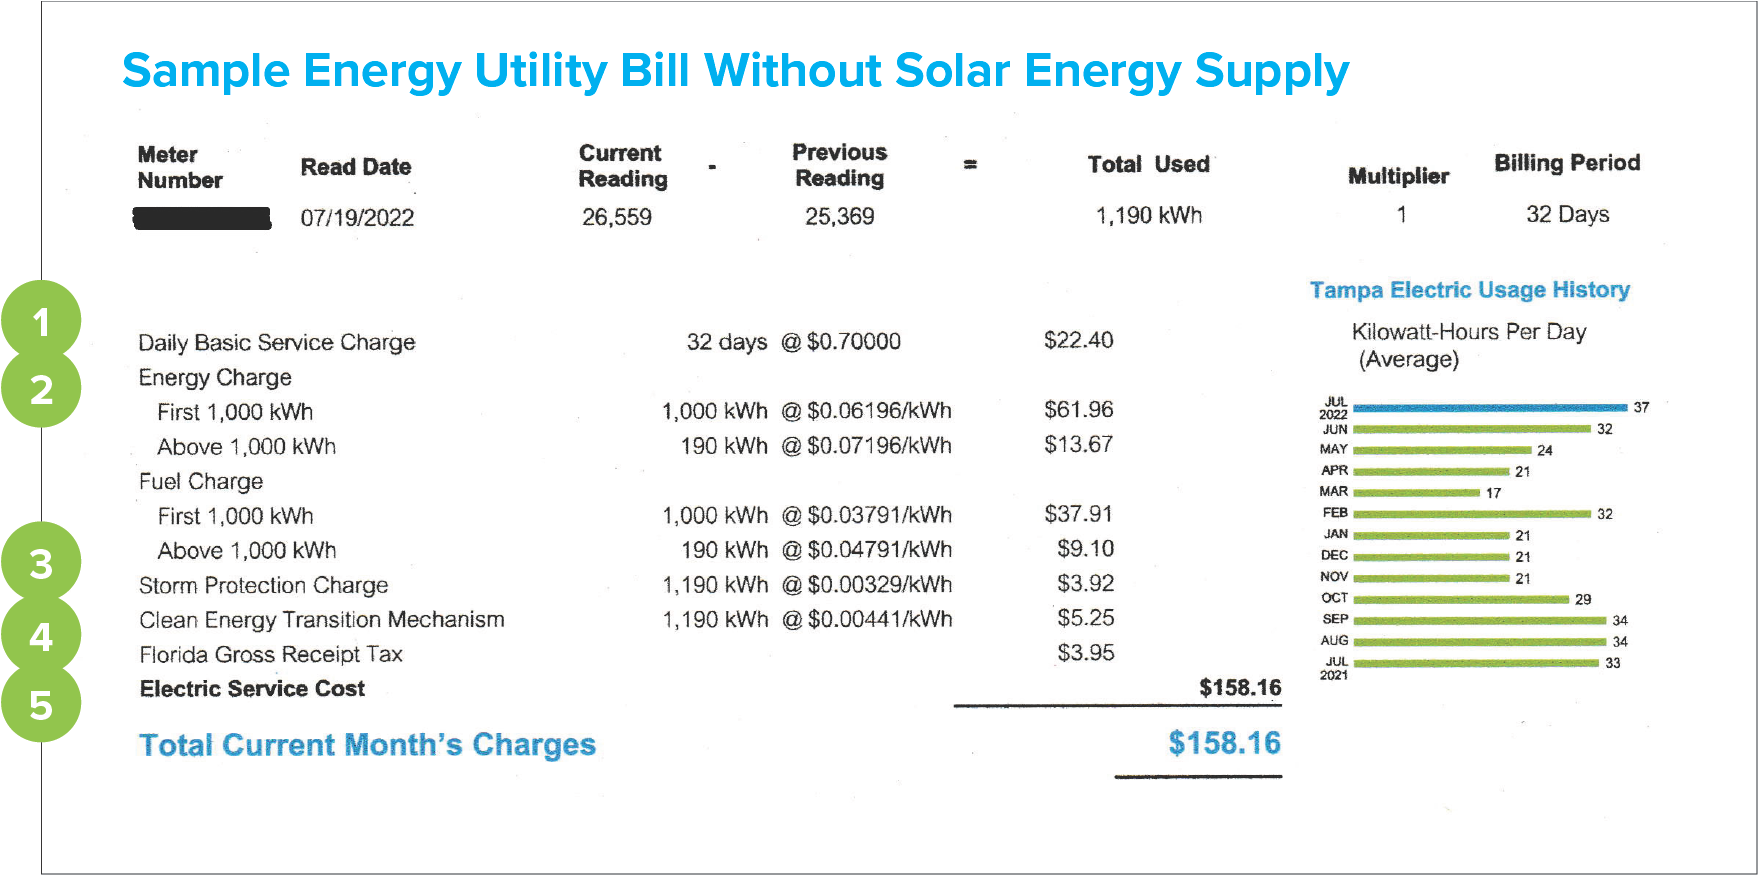
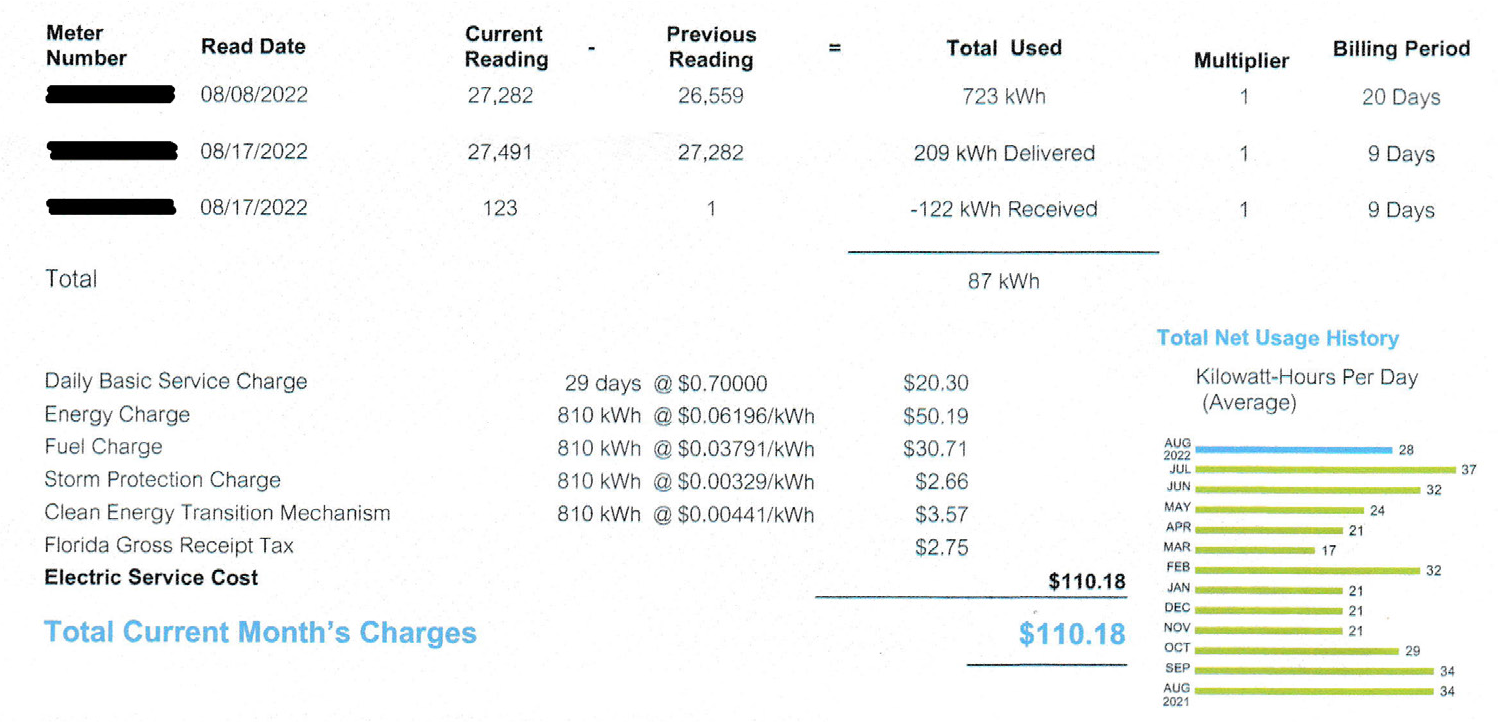
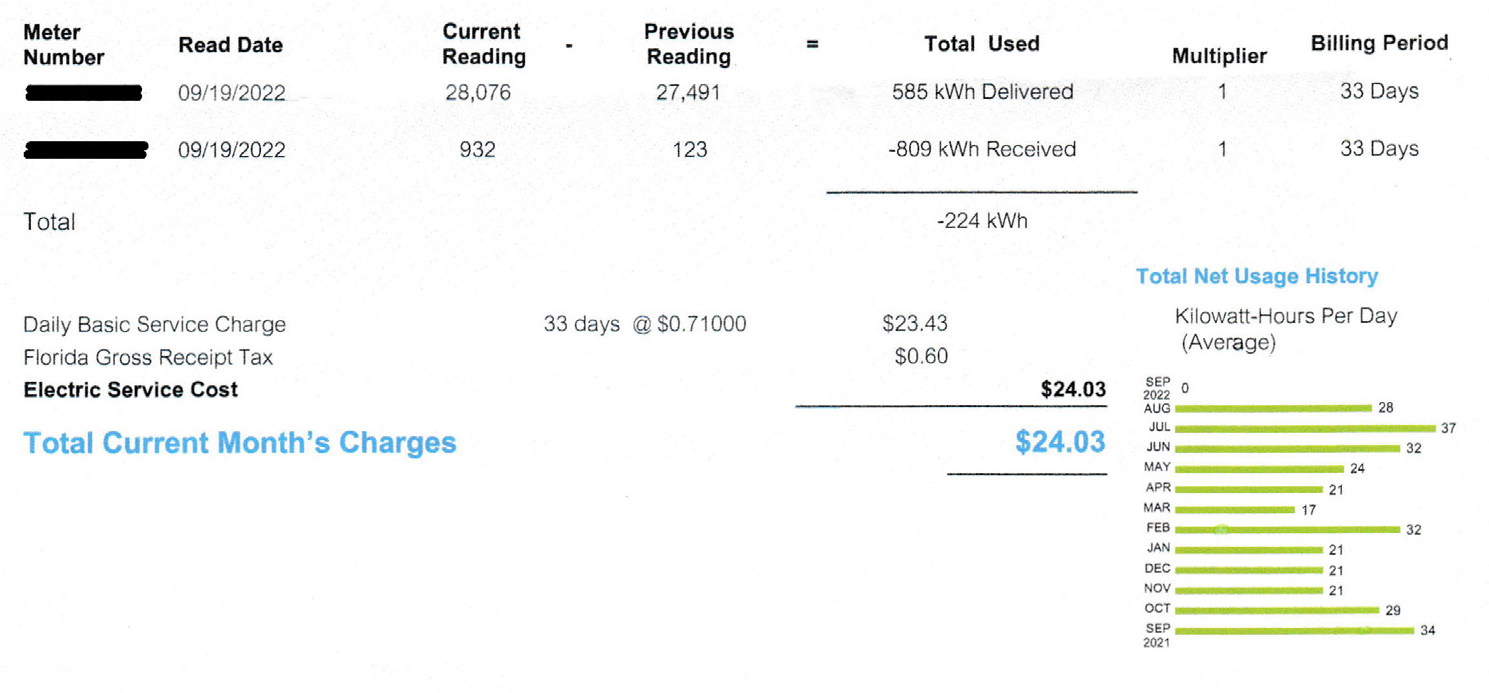
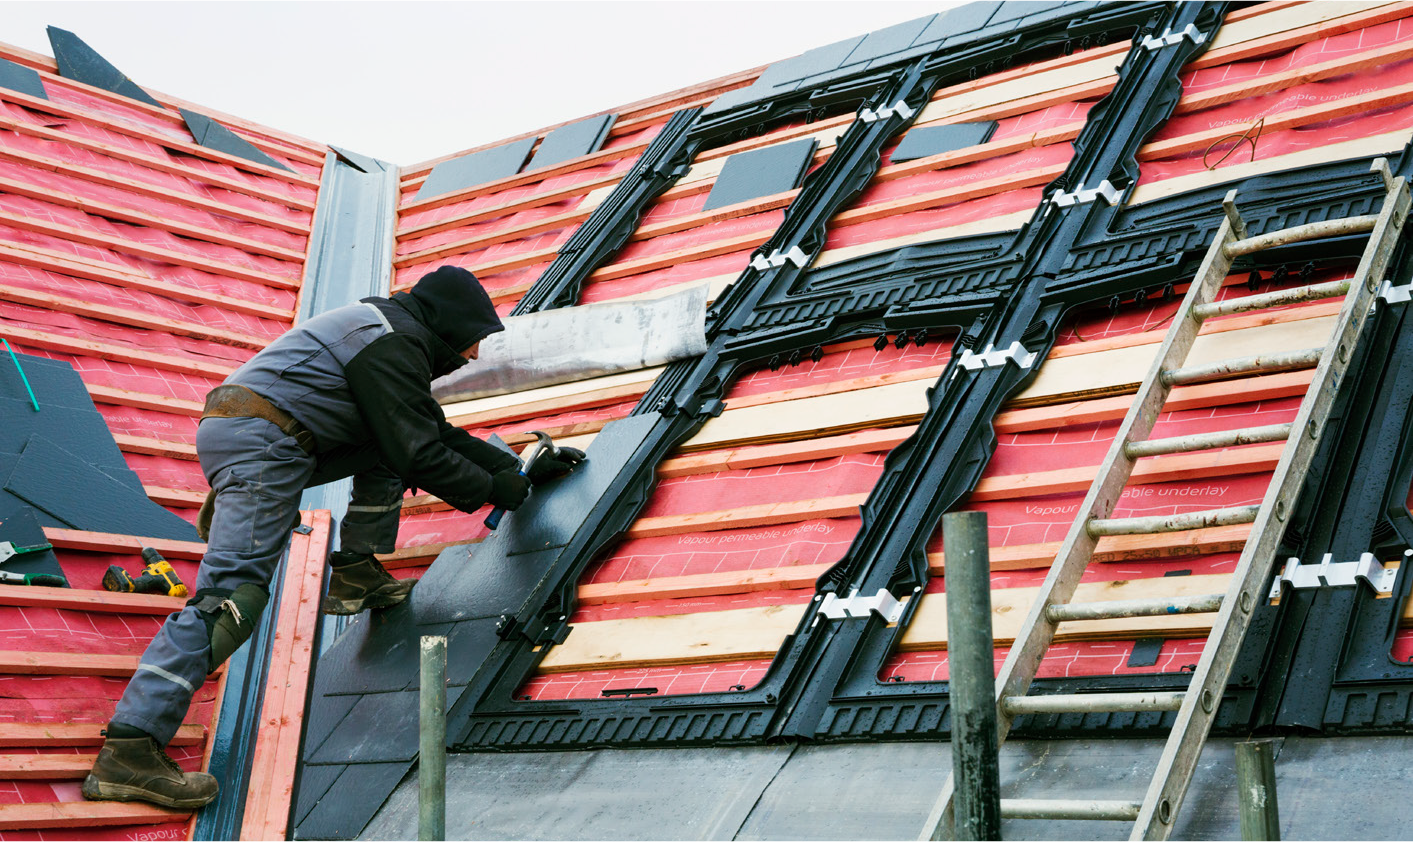













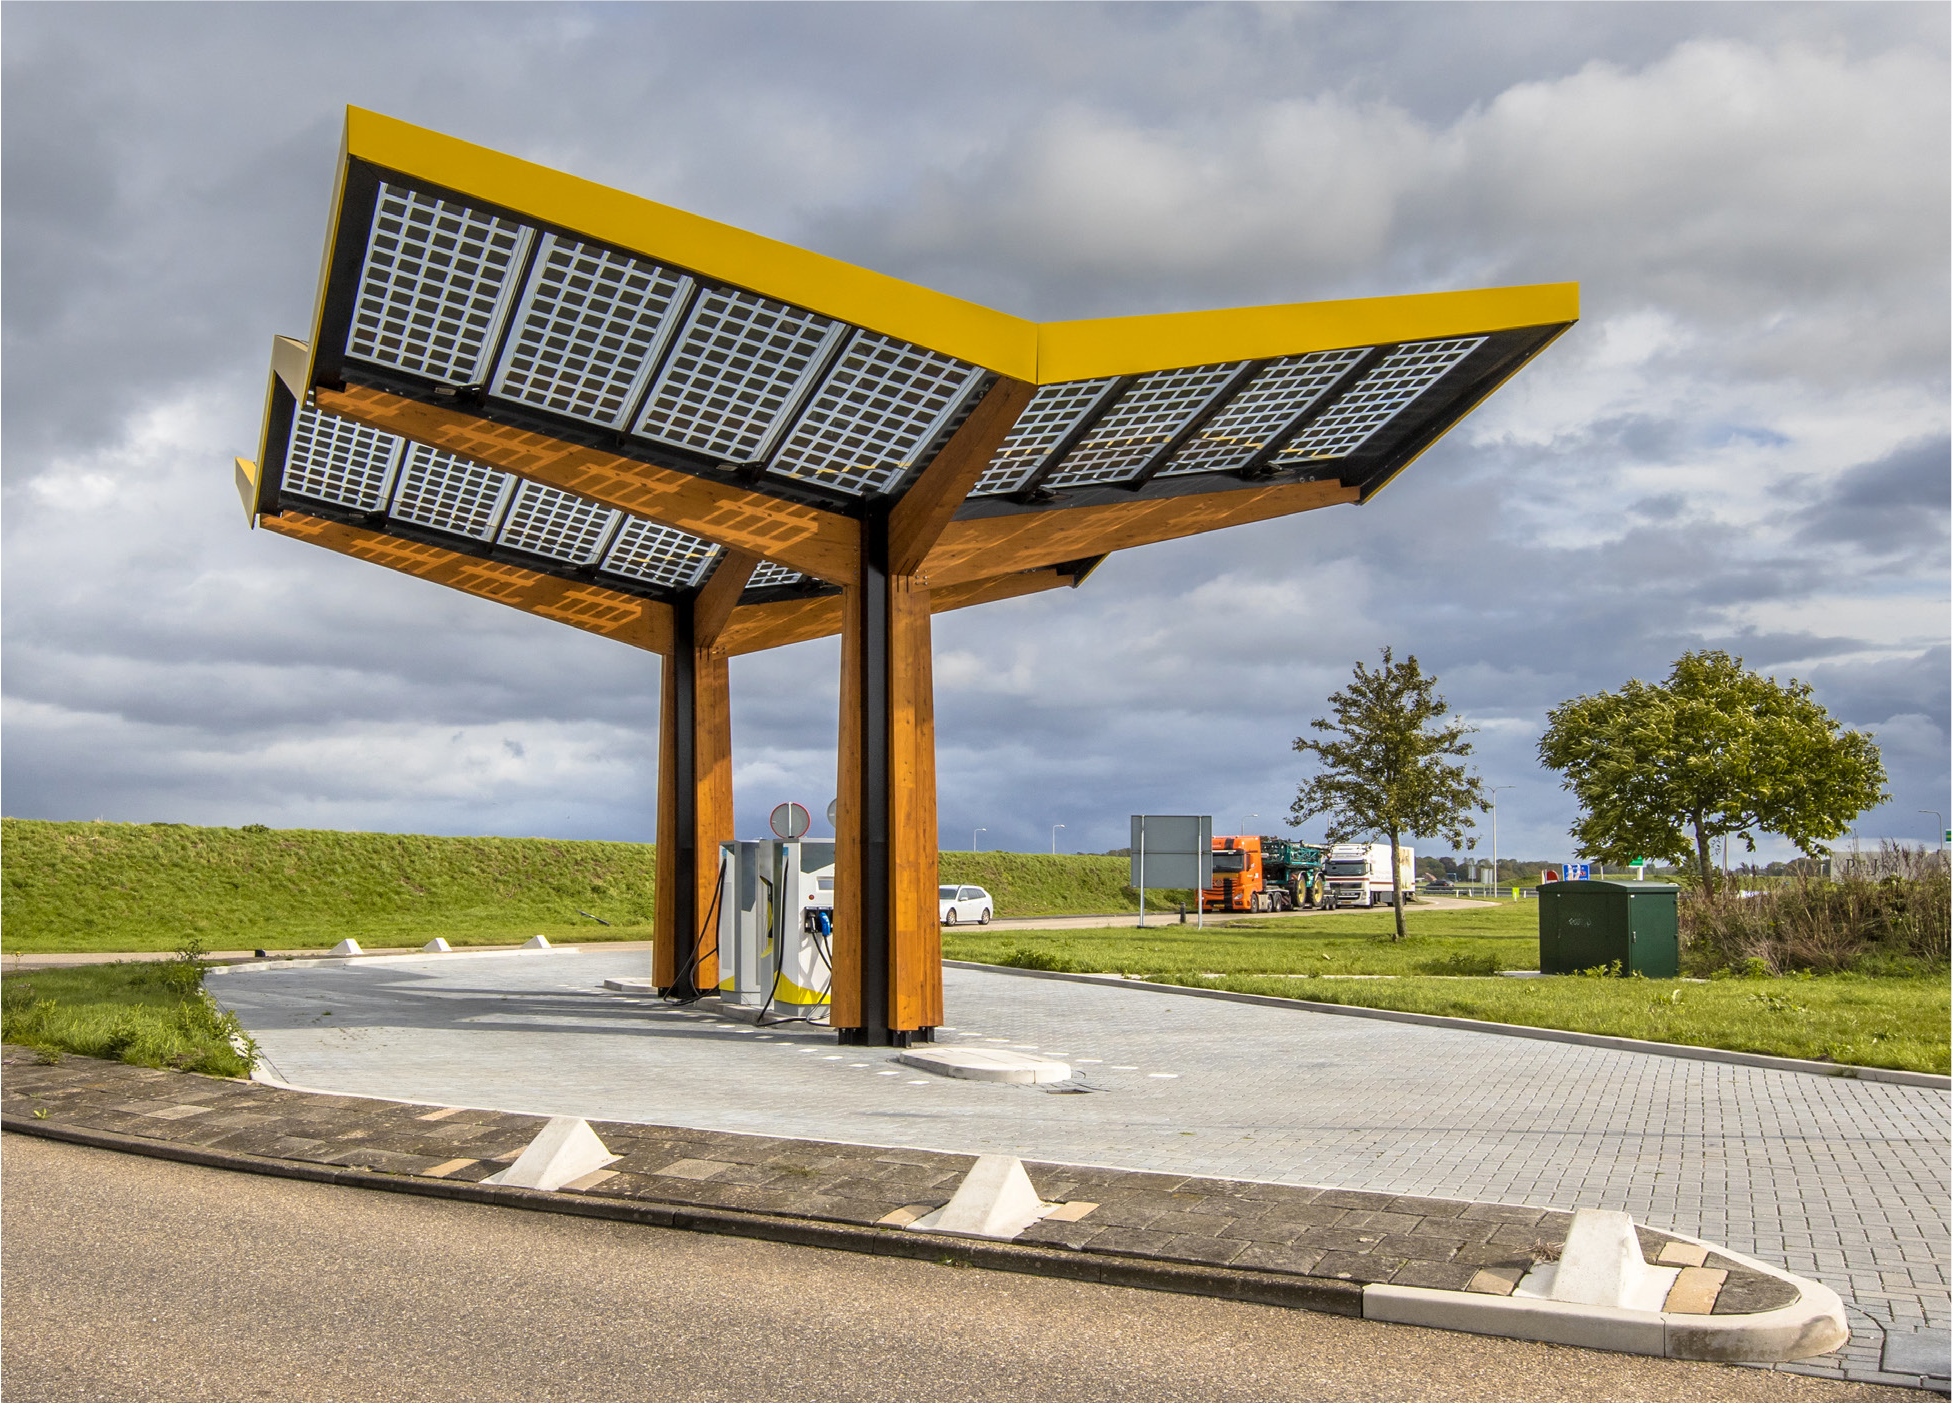
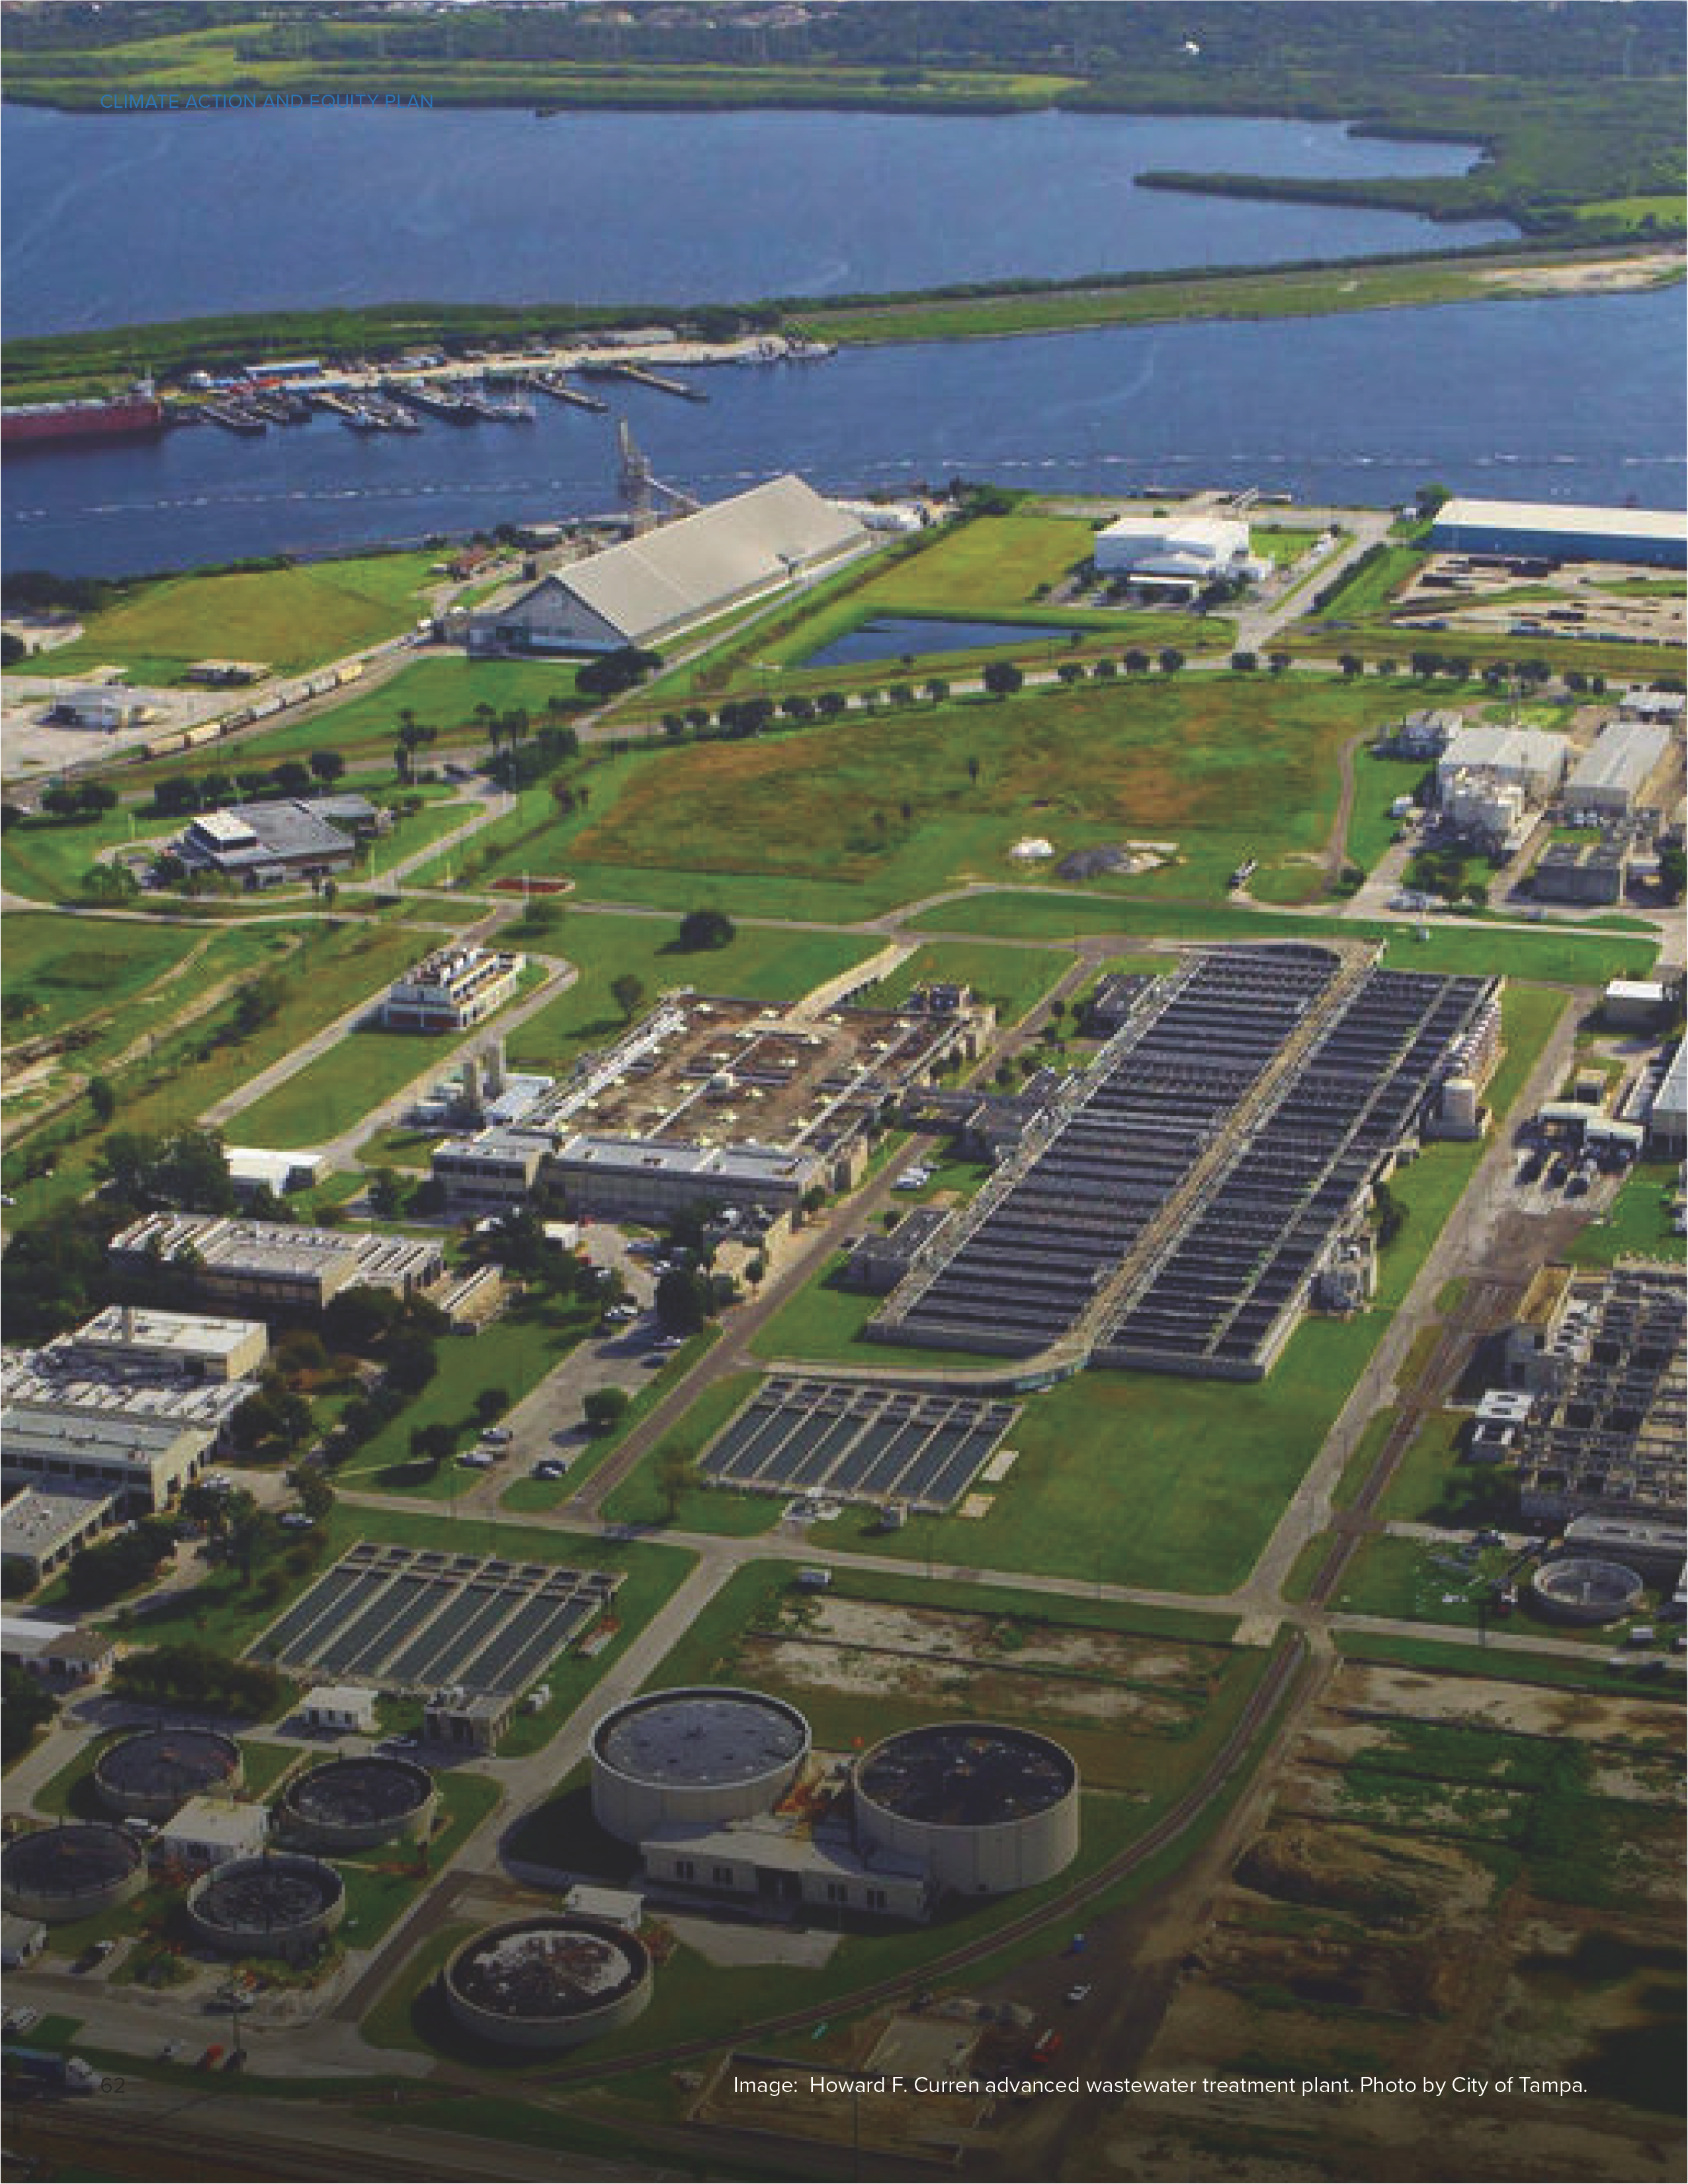
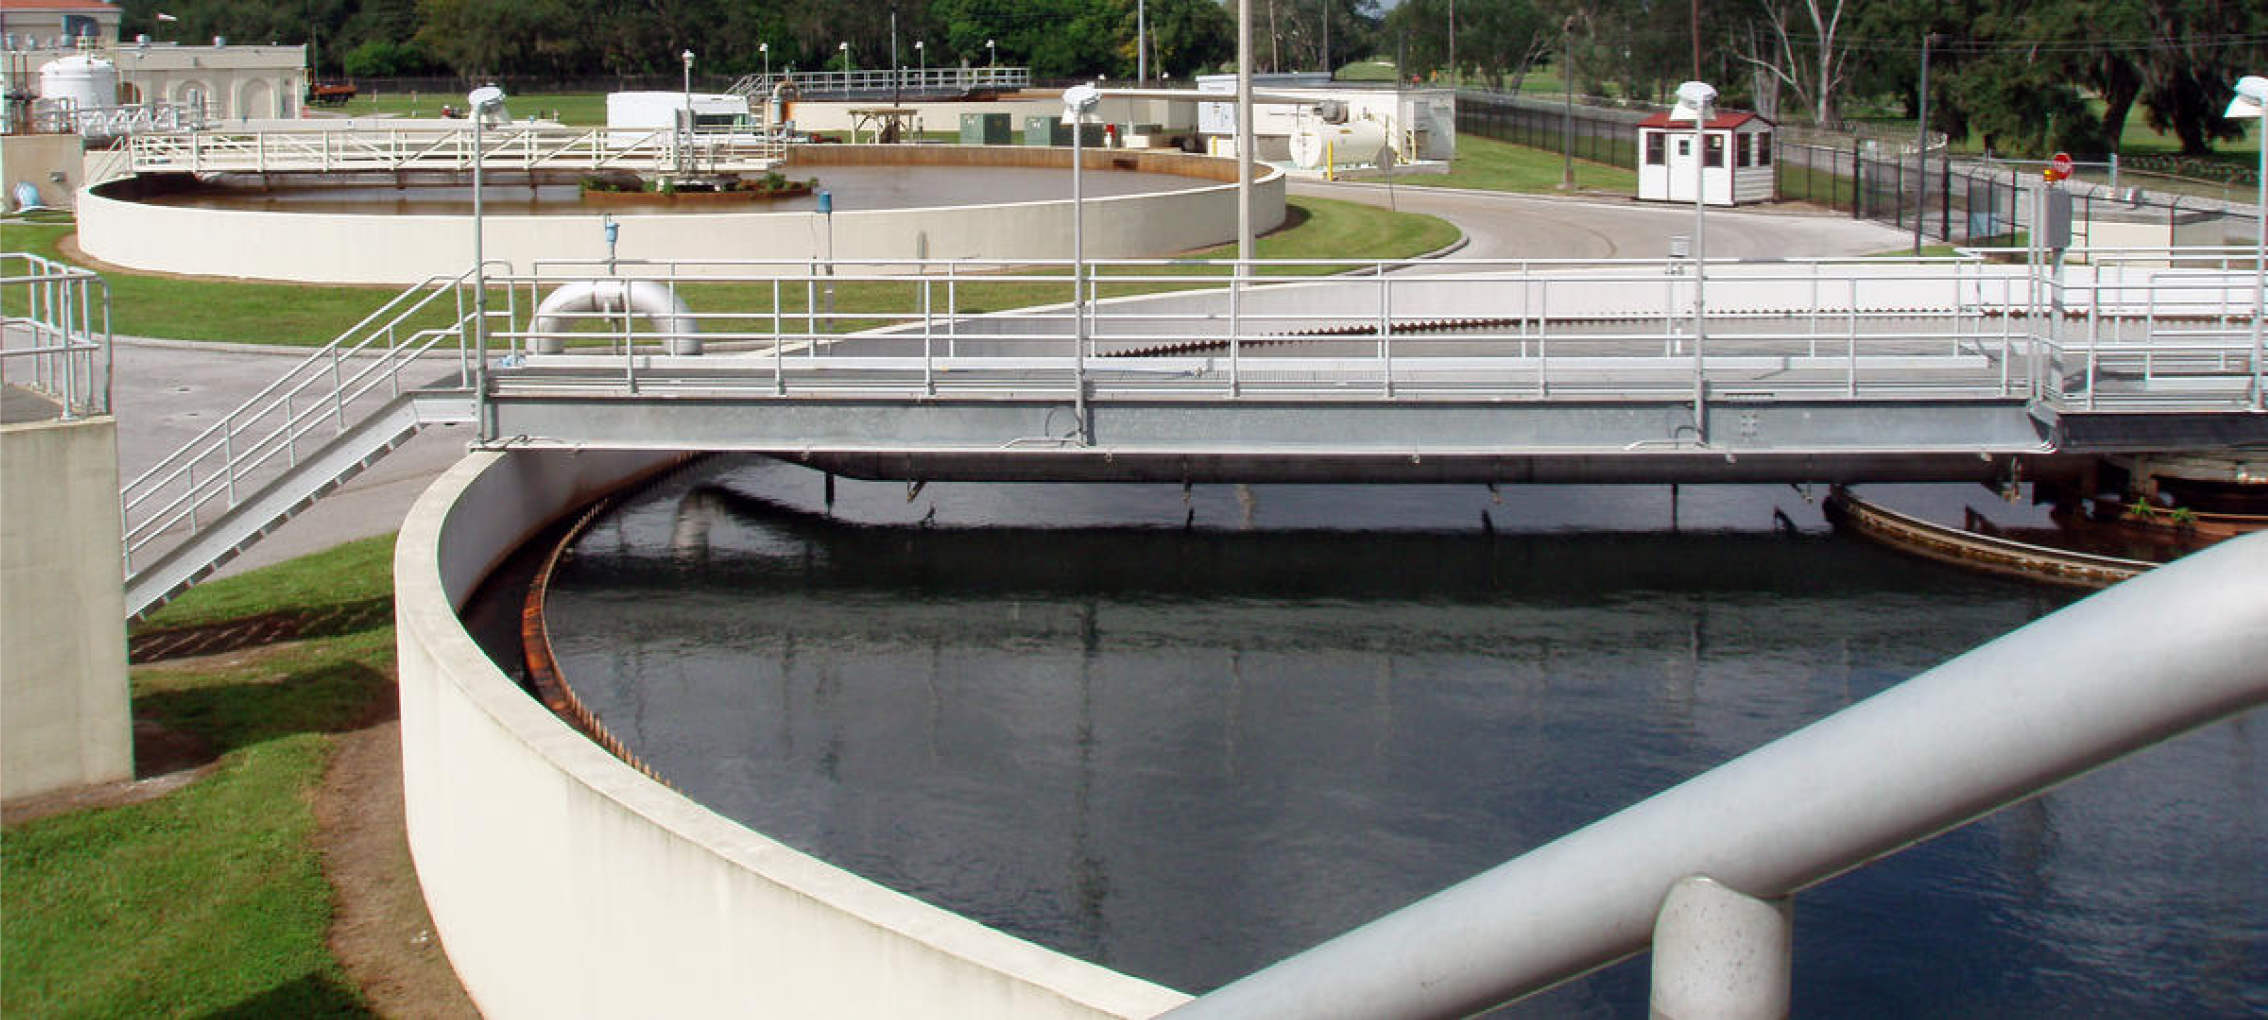
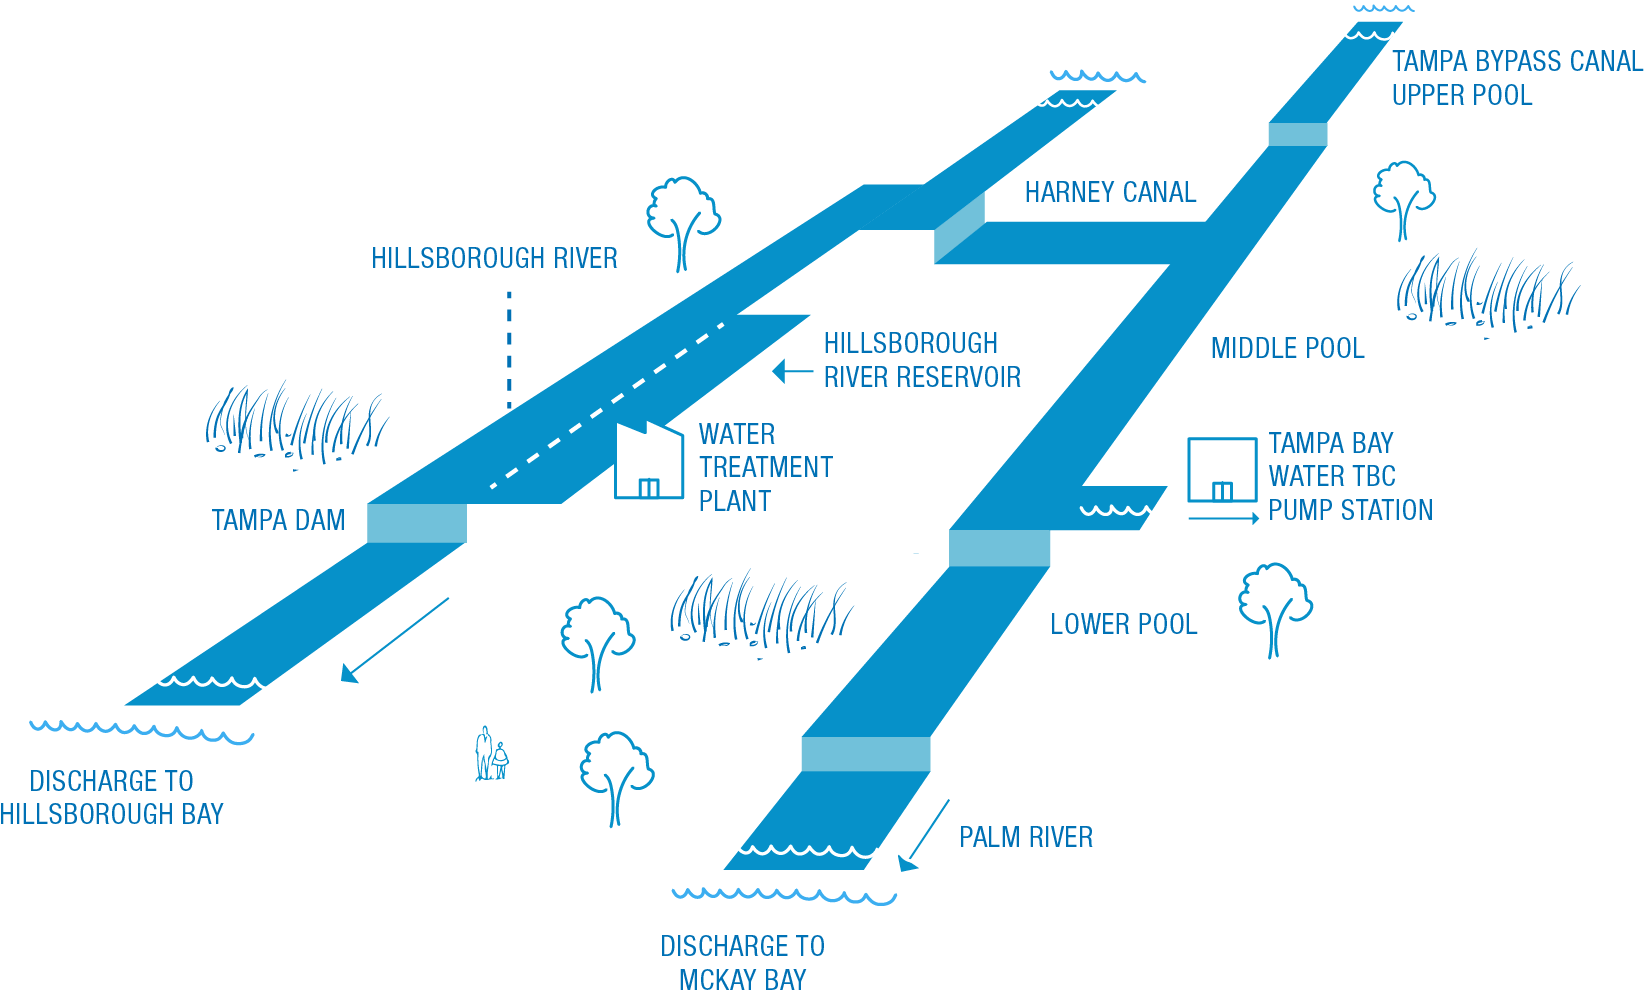

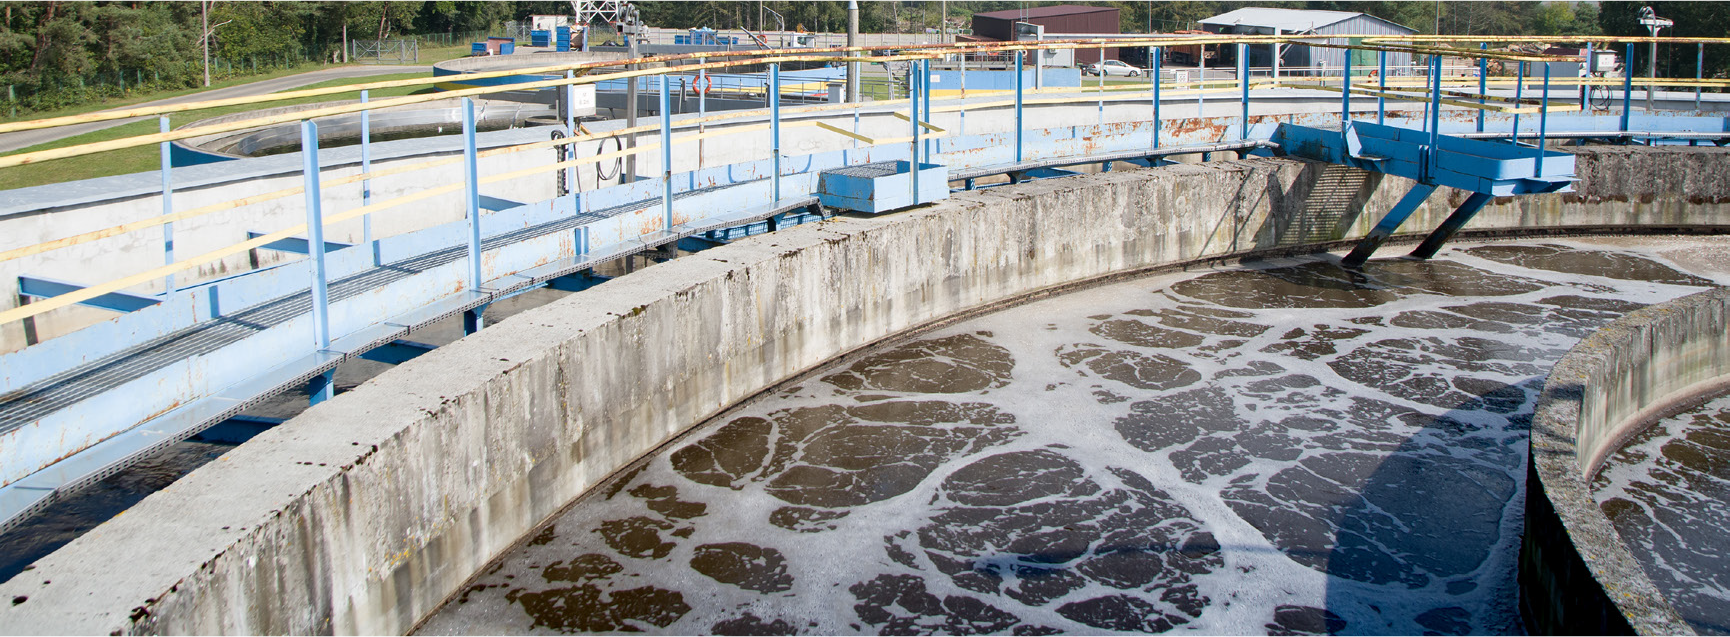
 MITIGATE
  STUDY
STUDY MITIGATE
  PROJECT
 MITIGATE
  STUDY
STUDY MITIGATE PROJECT
 MITIGATE STUDY
 MITIGATE STUDY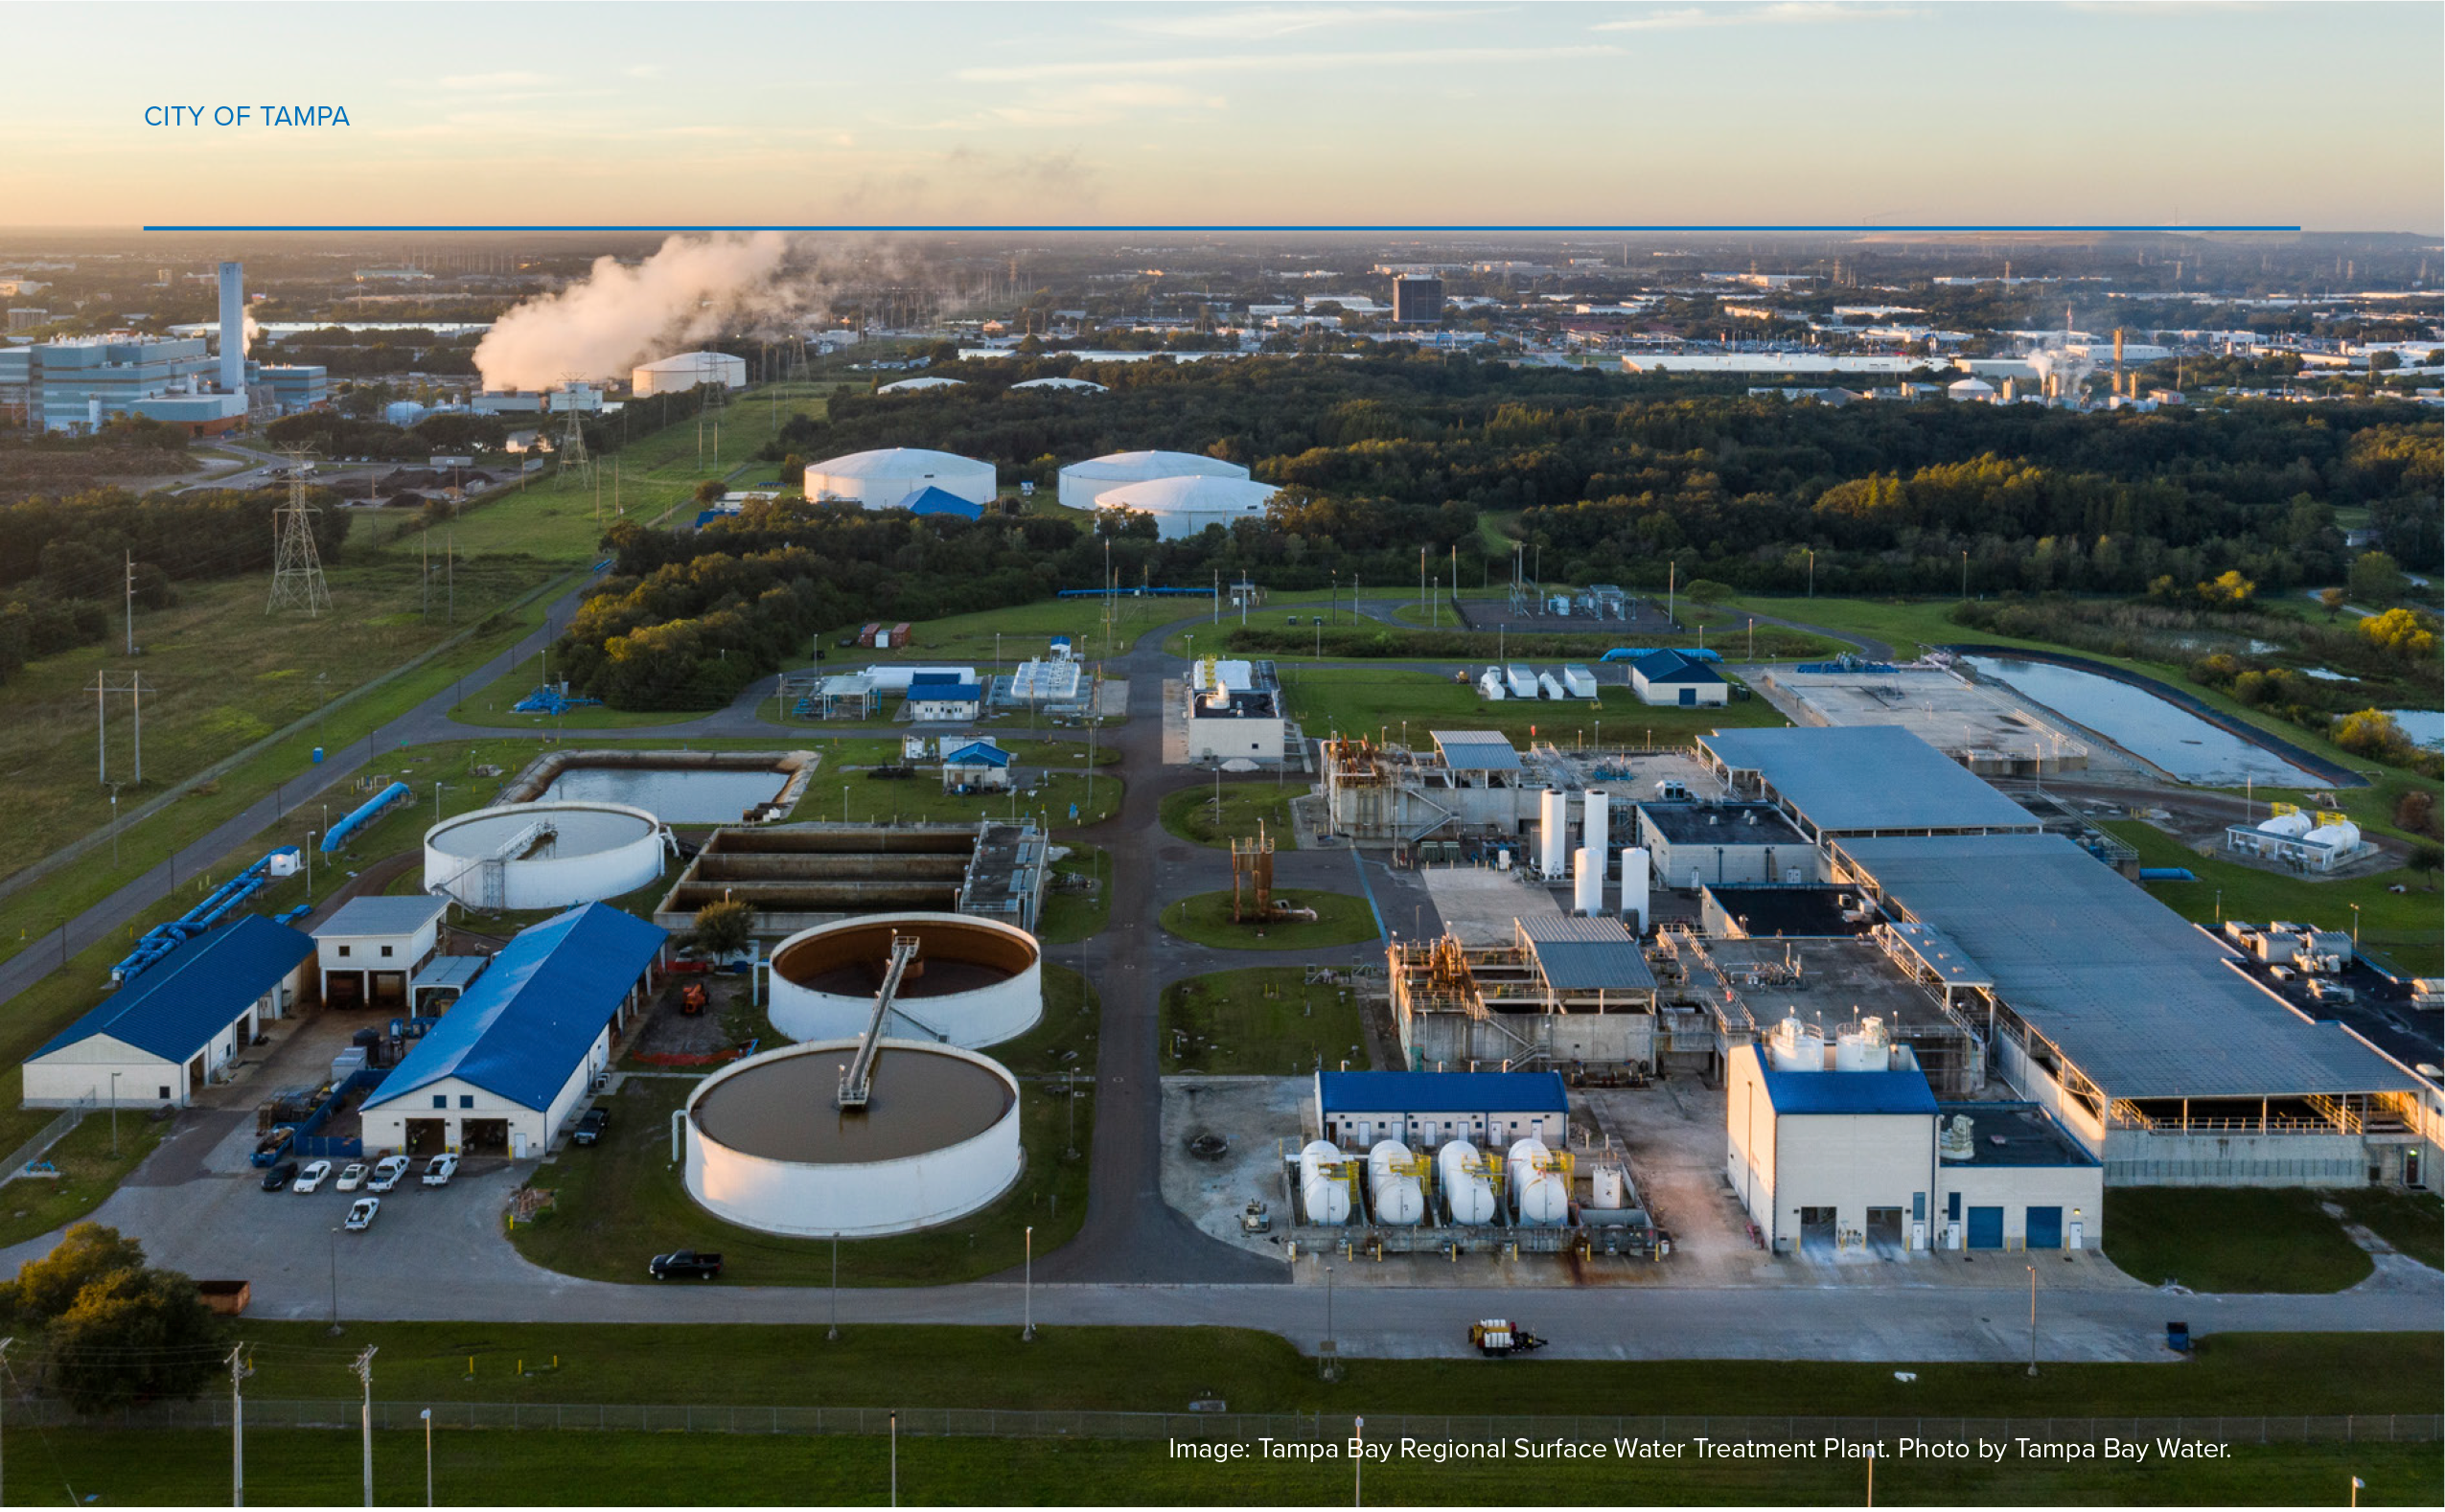

 PROJECT
 MITIGATE POLICY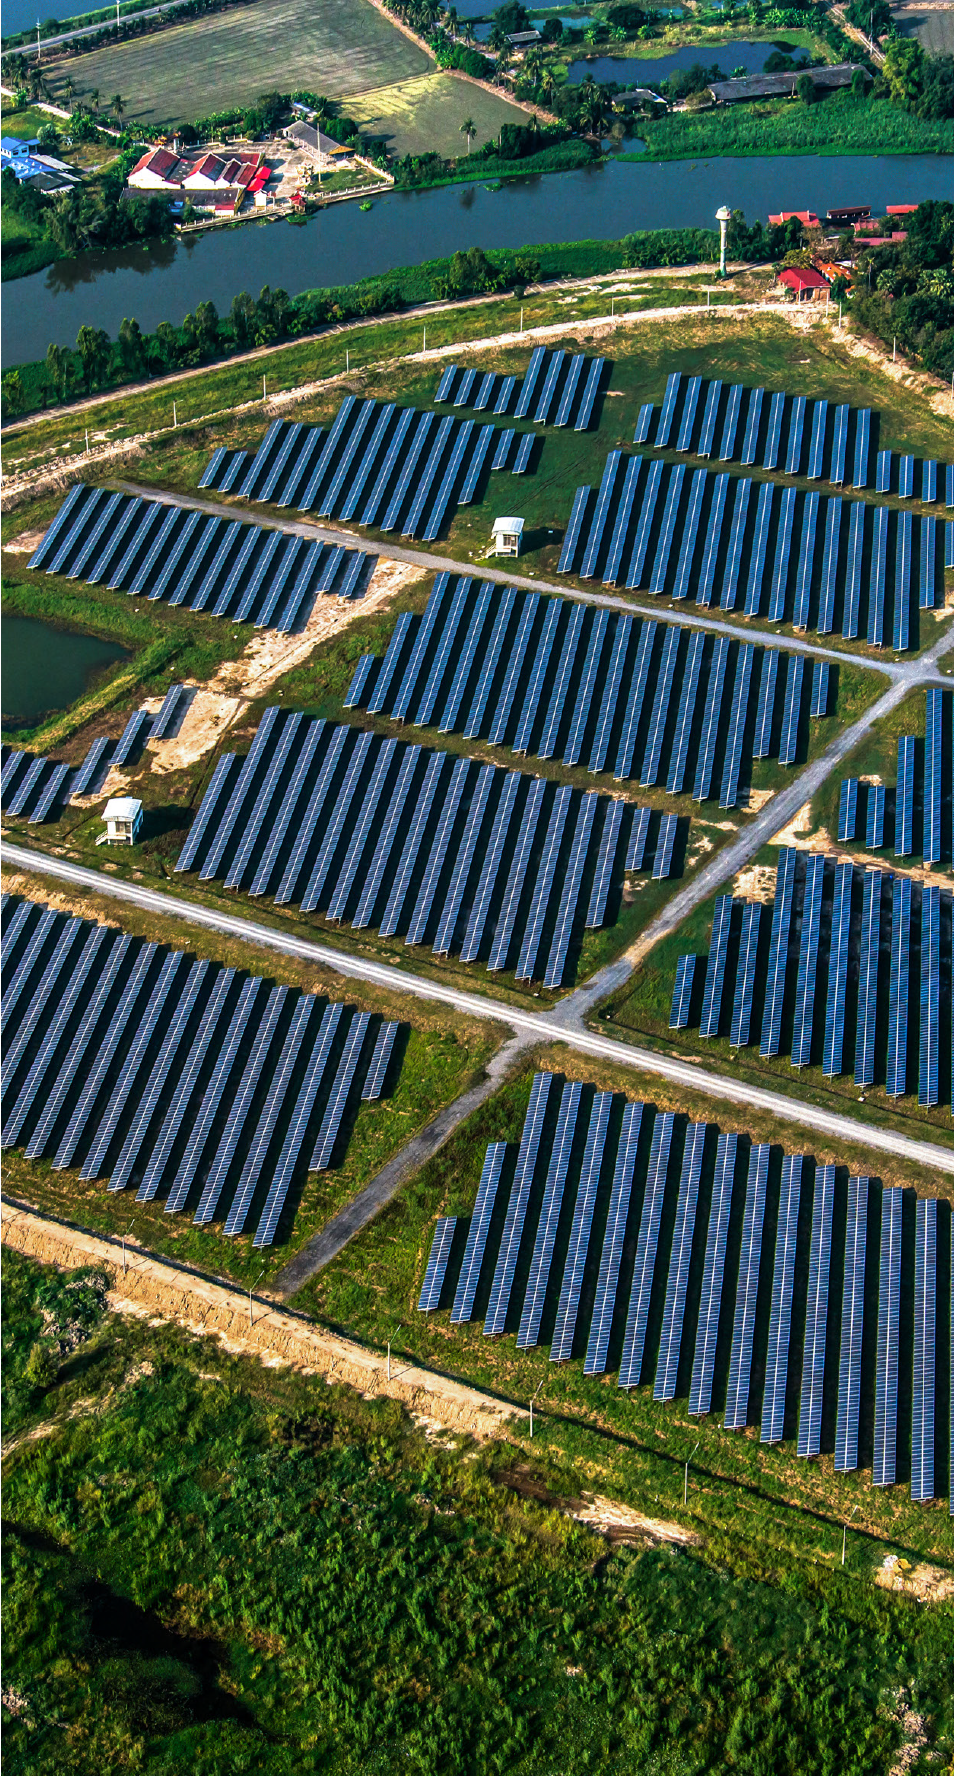
 MITIGATE
 PROJECT
 MITIGATE
 PROJECT
 MITIGATE PROJECT
 MITIGATE
 STUDY
STUDY MITIGATE
 PROJECT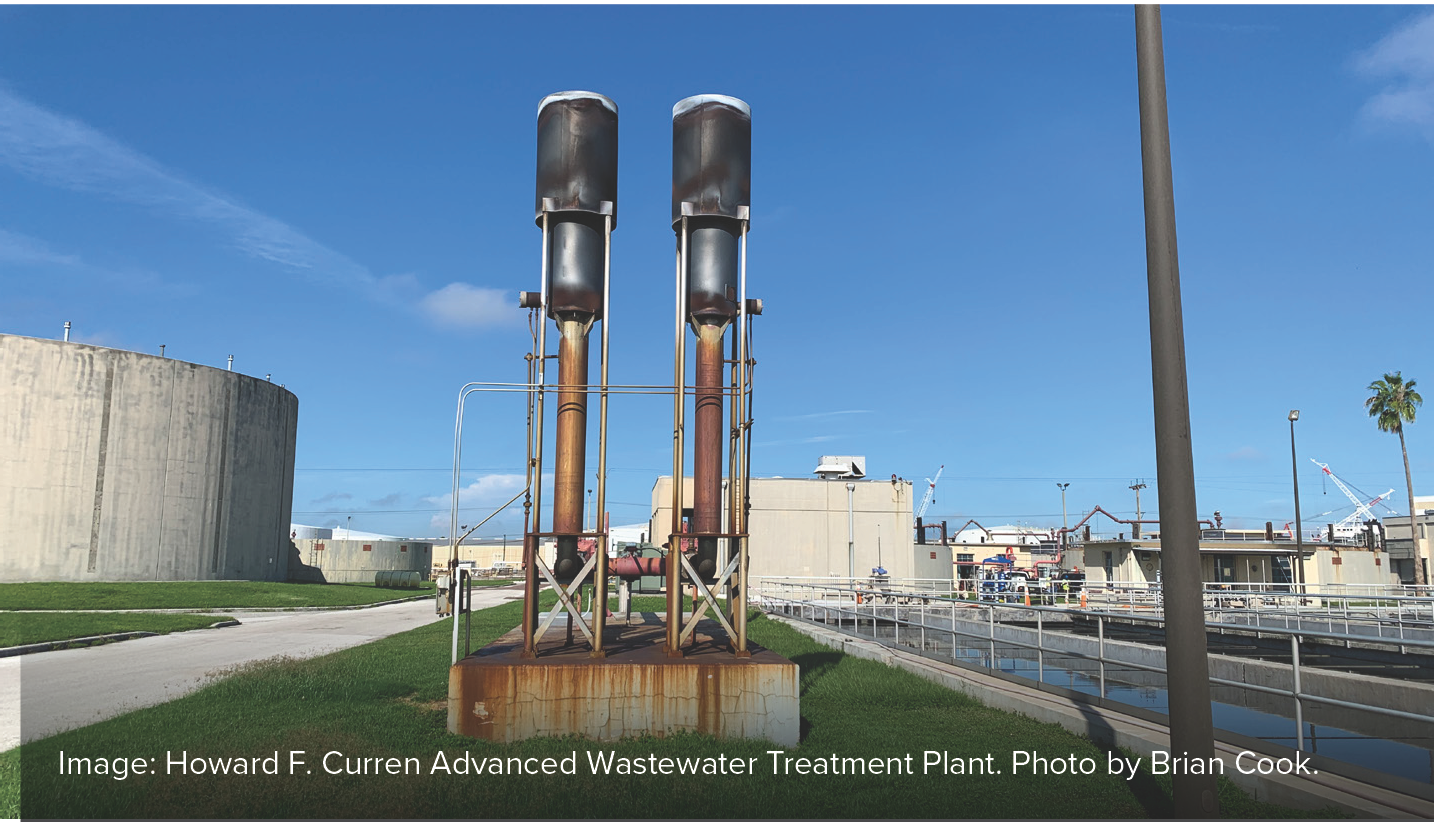
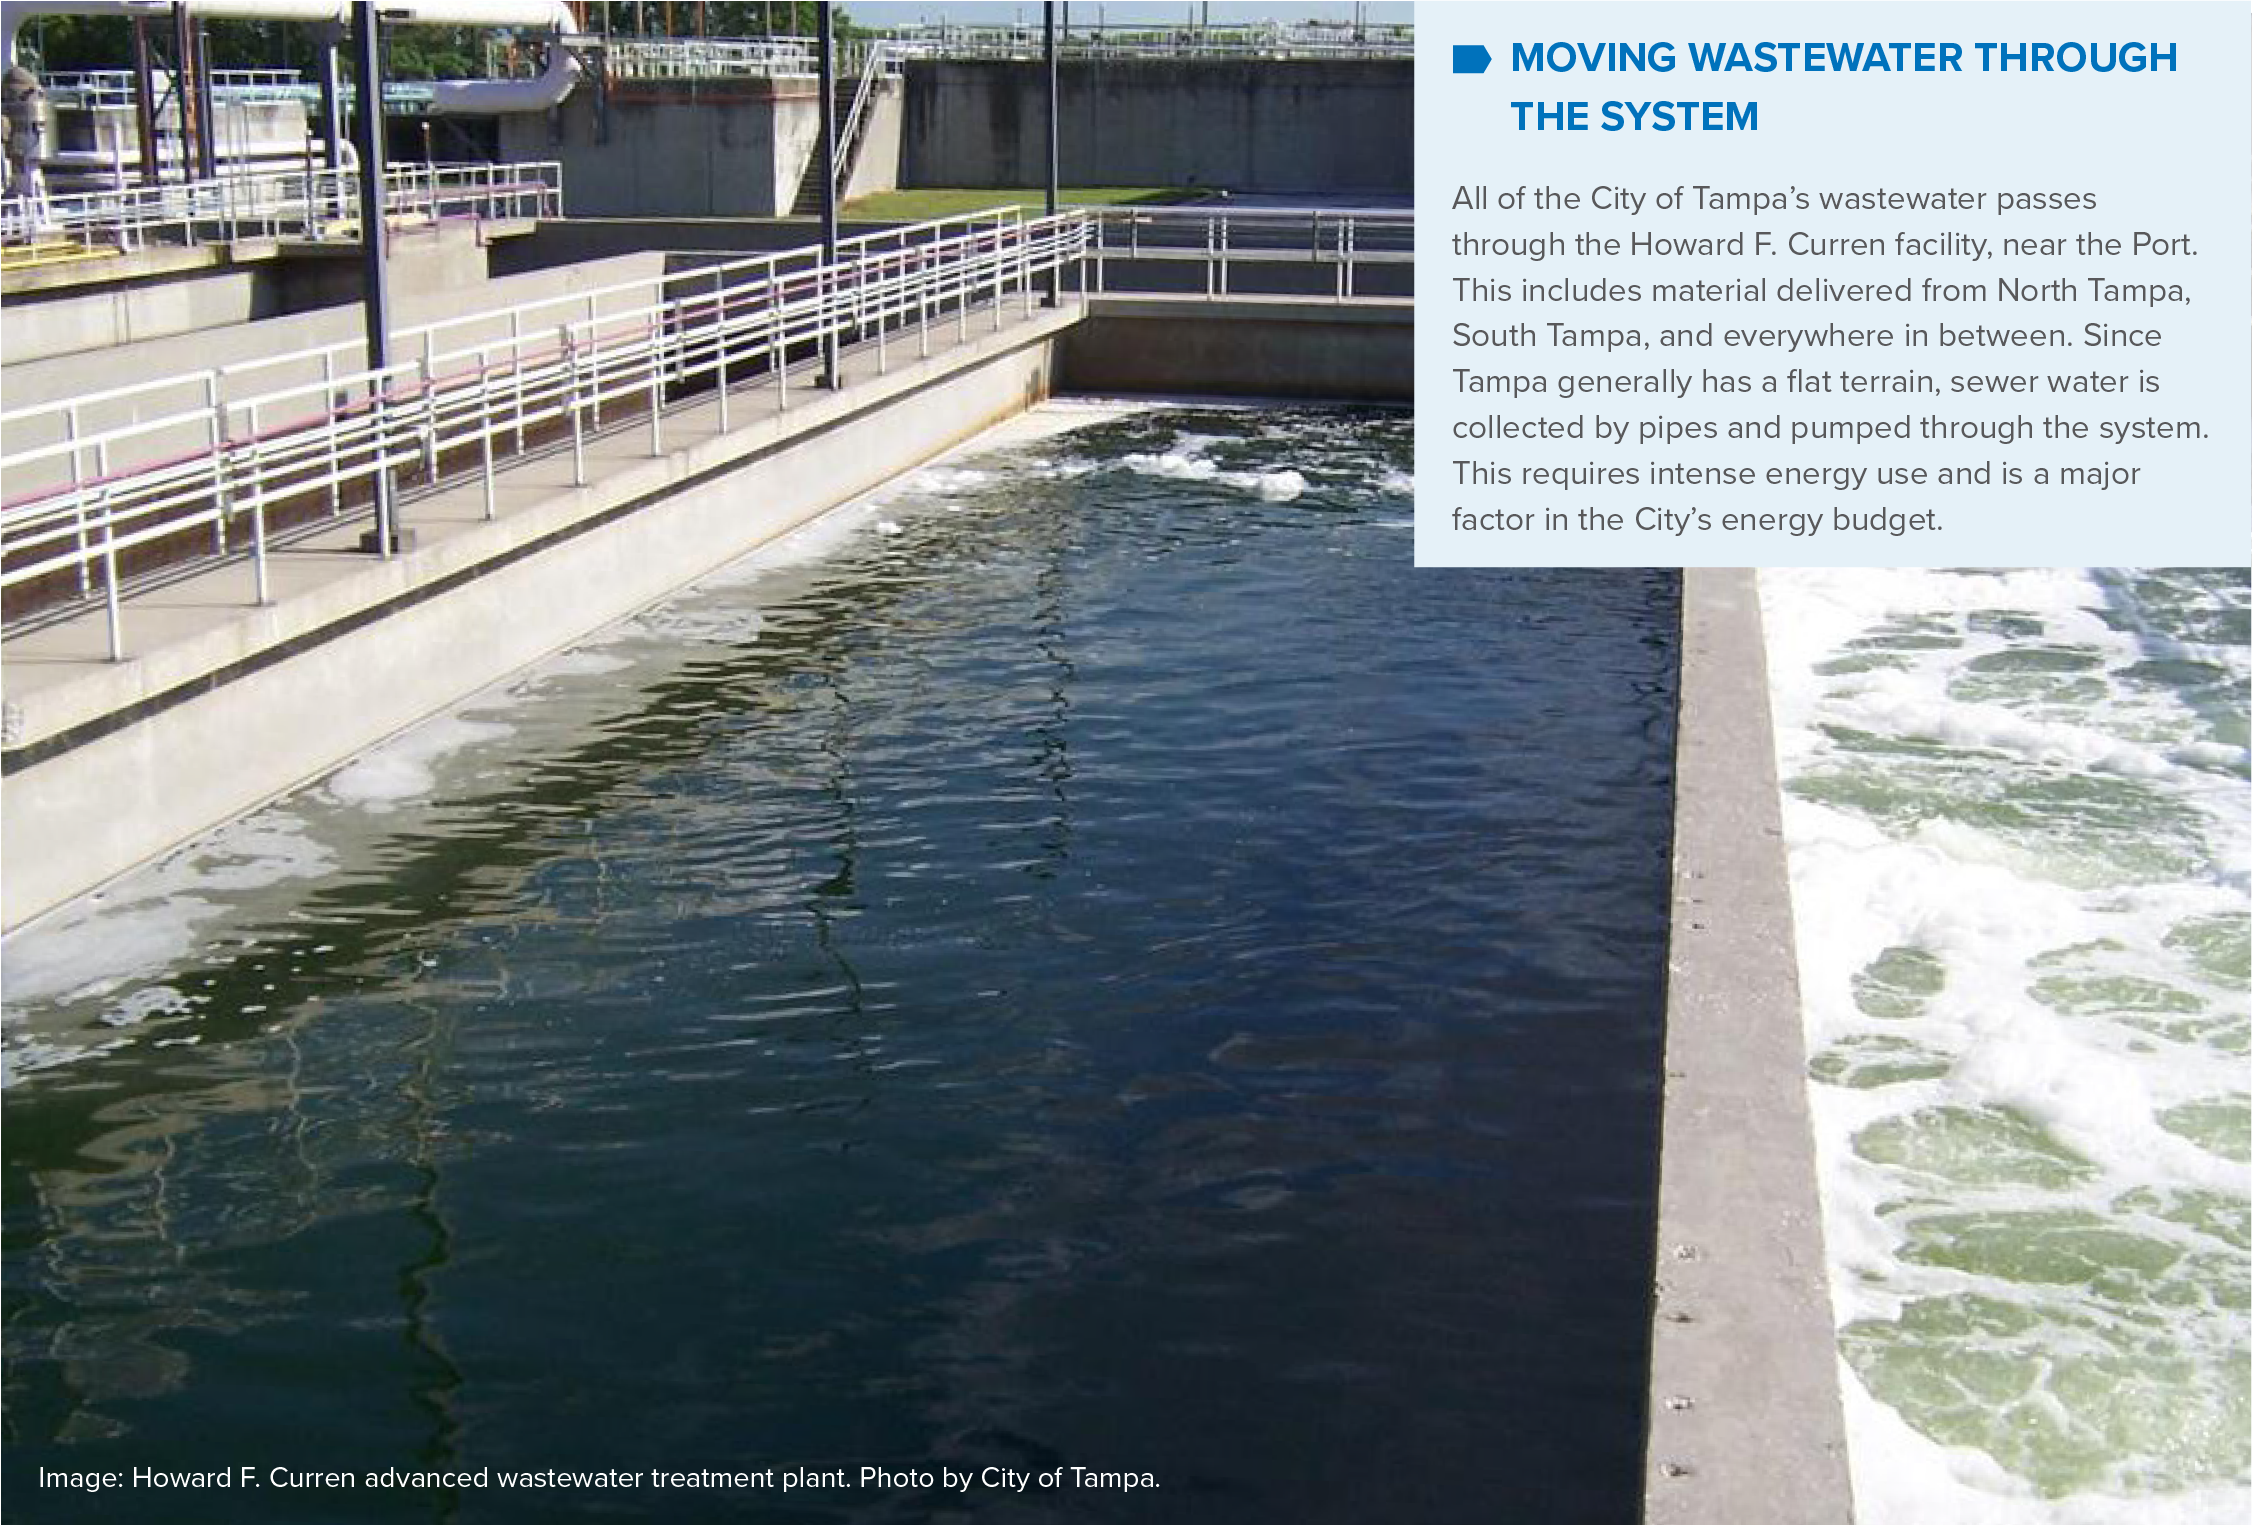

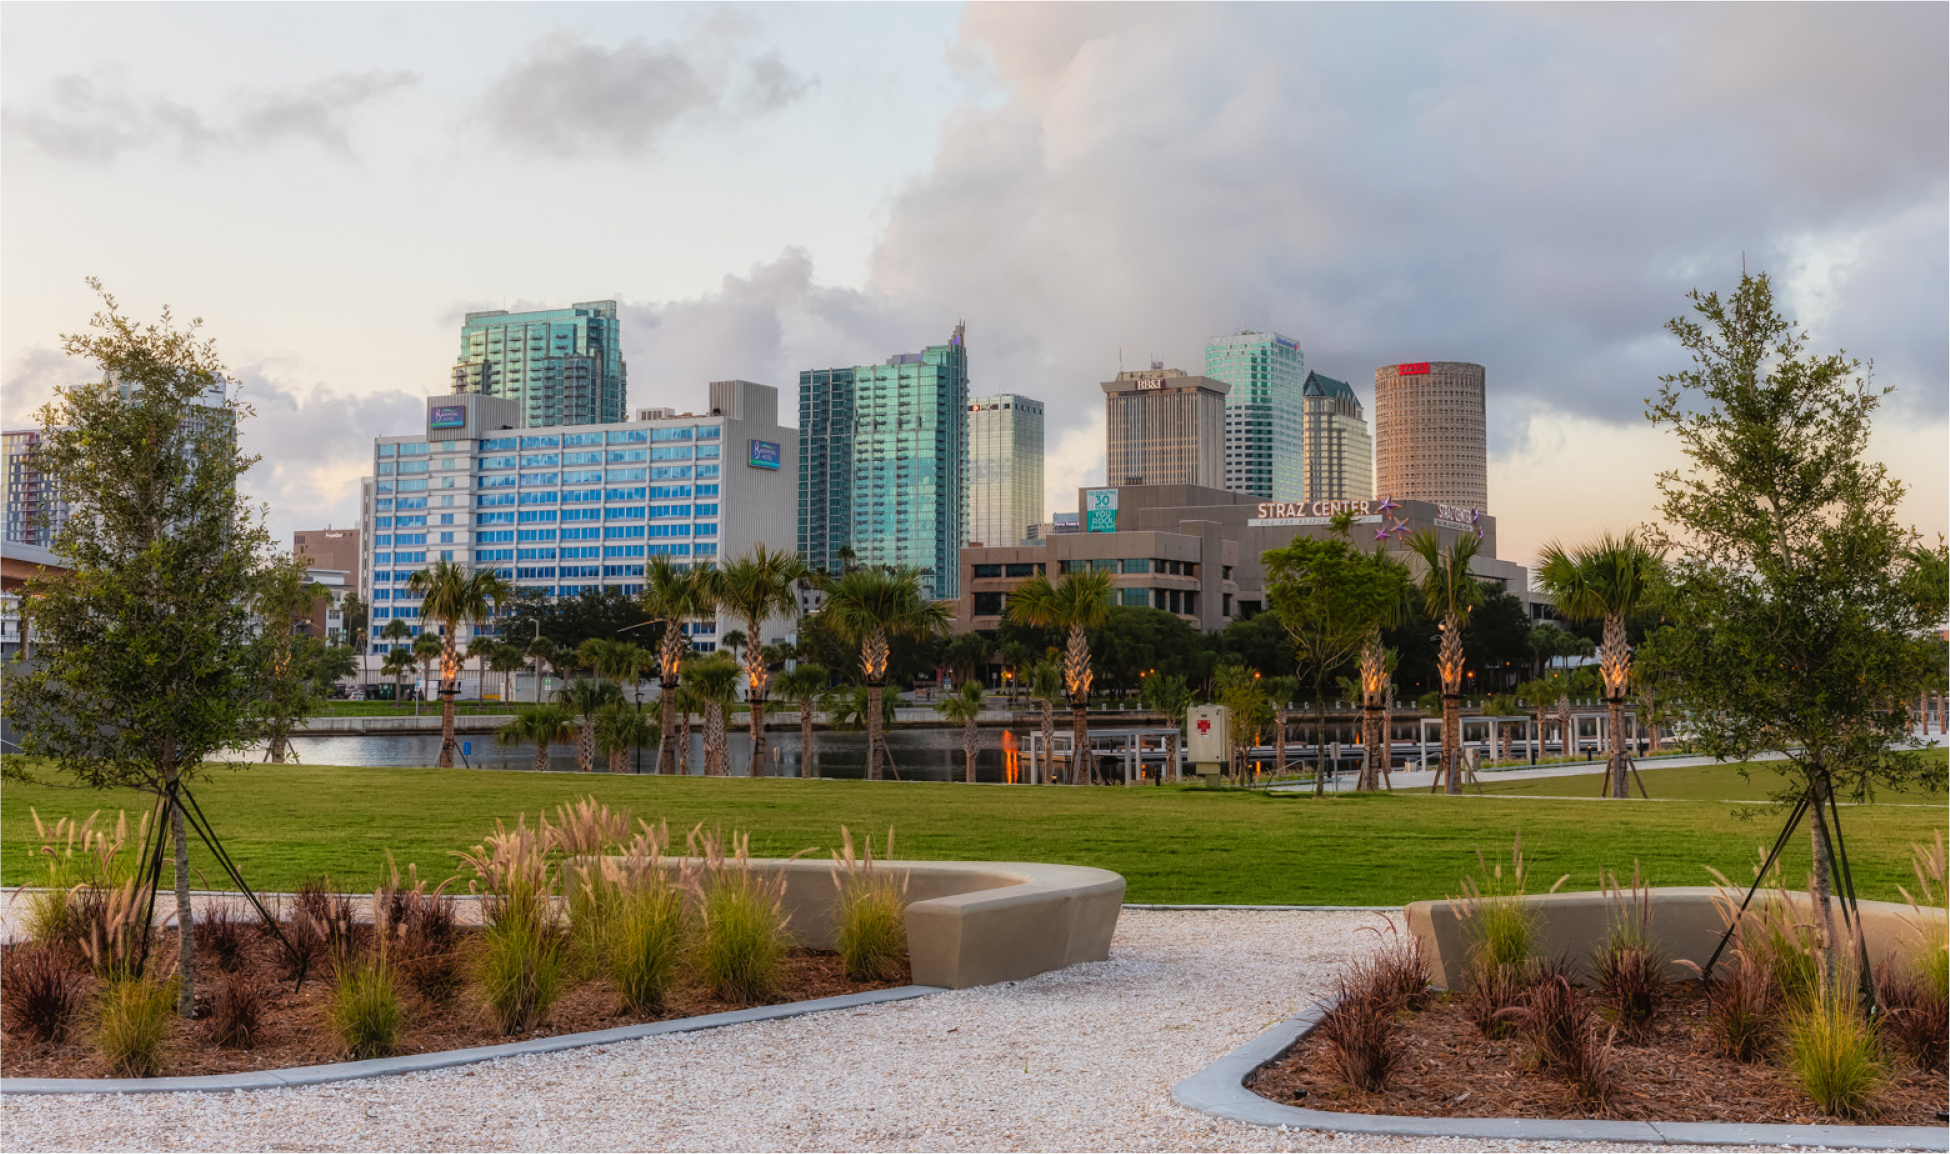
 ADAPT
ADAPT STUDY
STUDY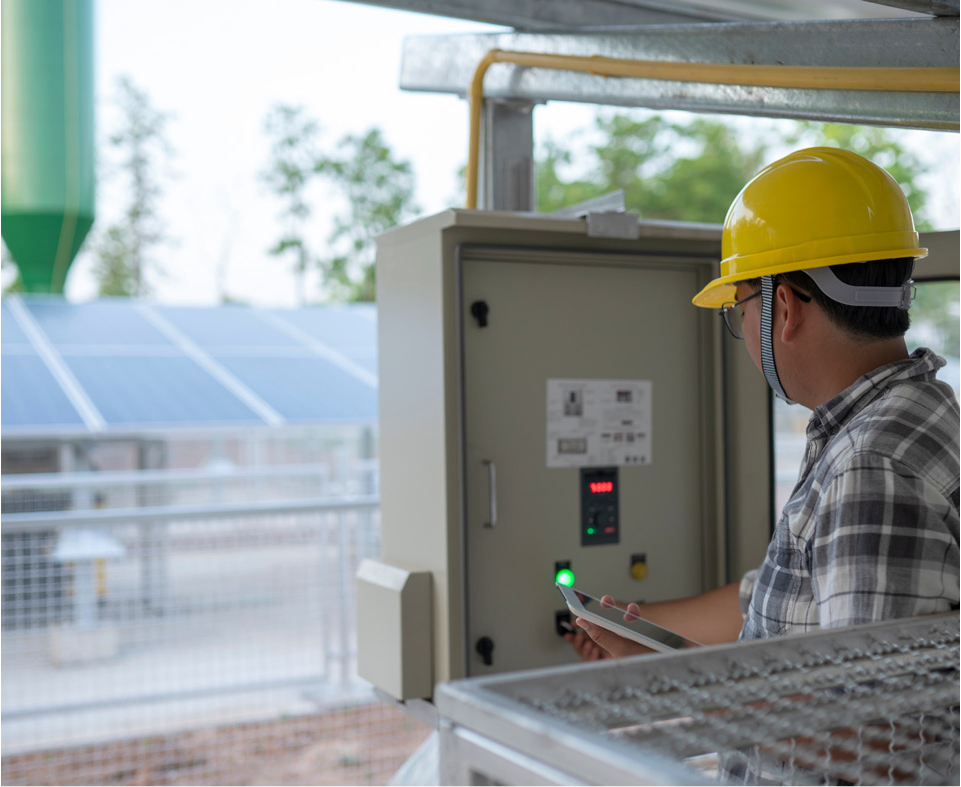
 MITIGATE PROJECT
 MITIGATE
 ADAPT
ADAPT
 PROJECT
 ADAPT
ADAPT STUDY
STUDY

 ADAPT PROJECT


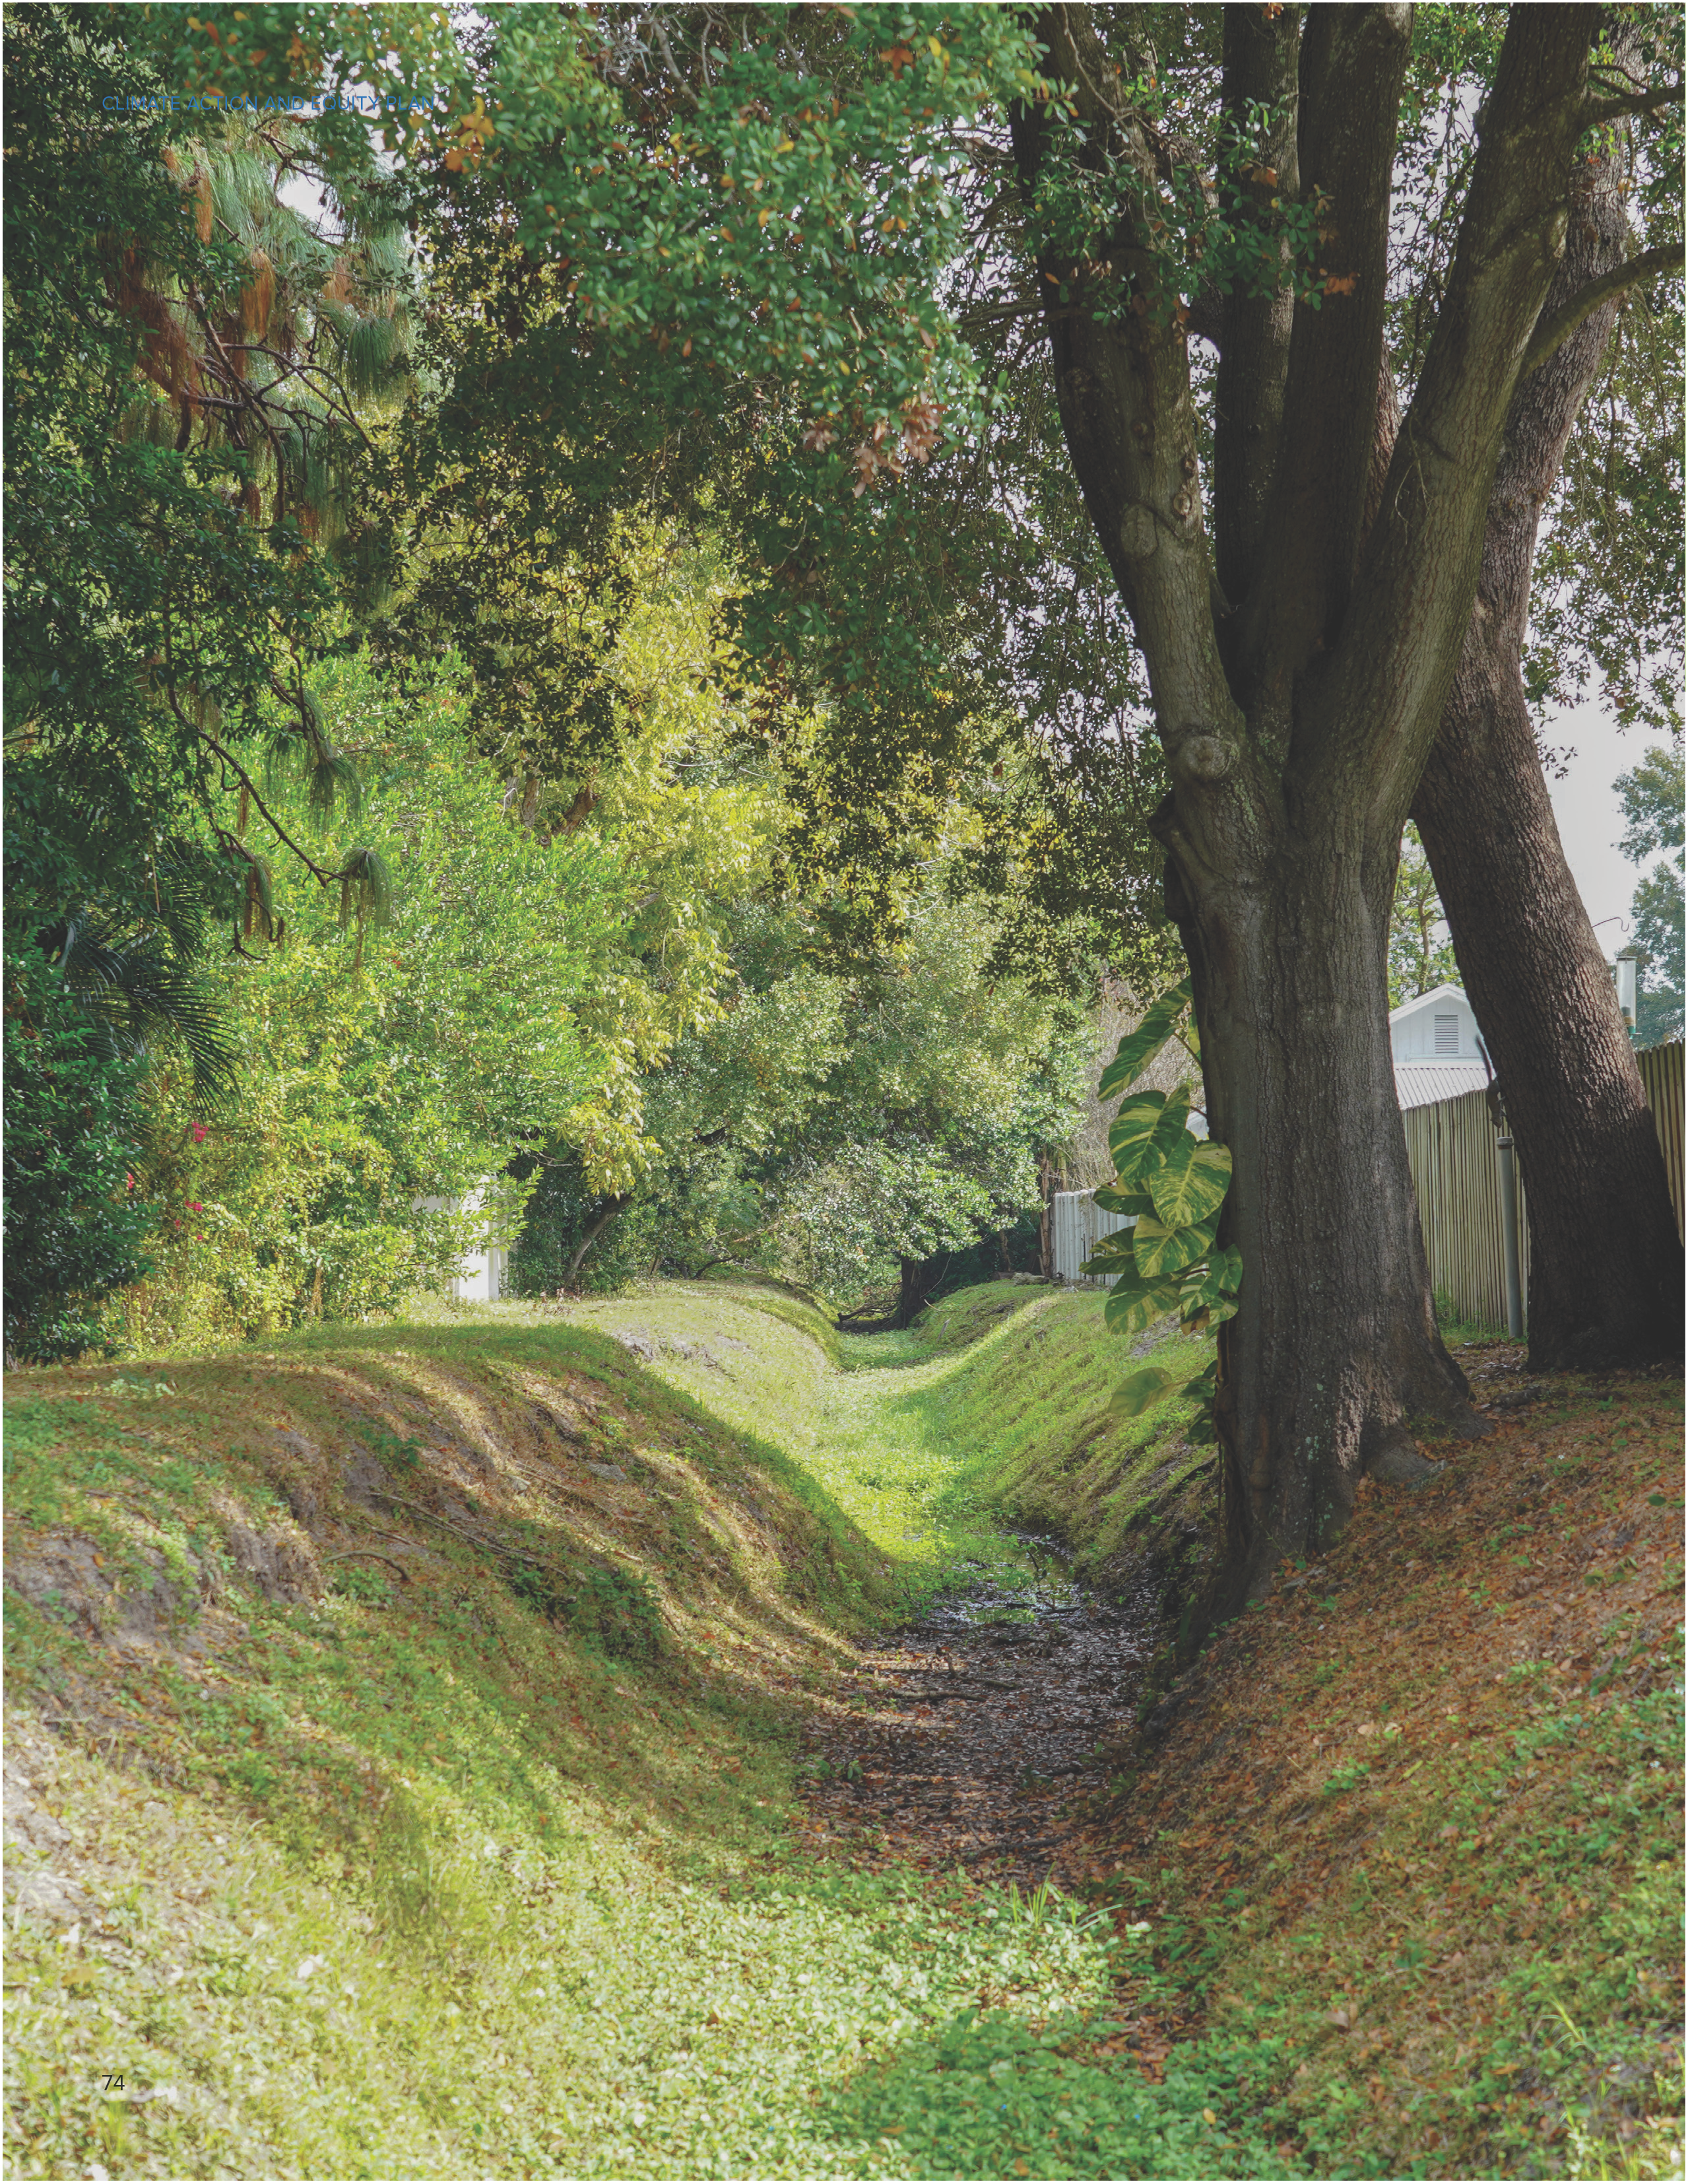






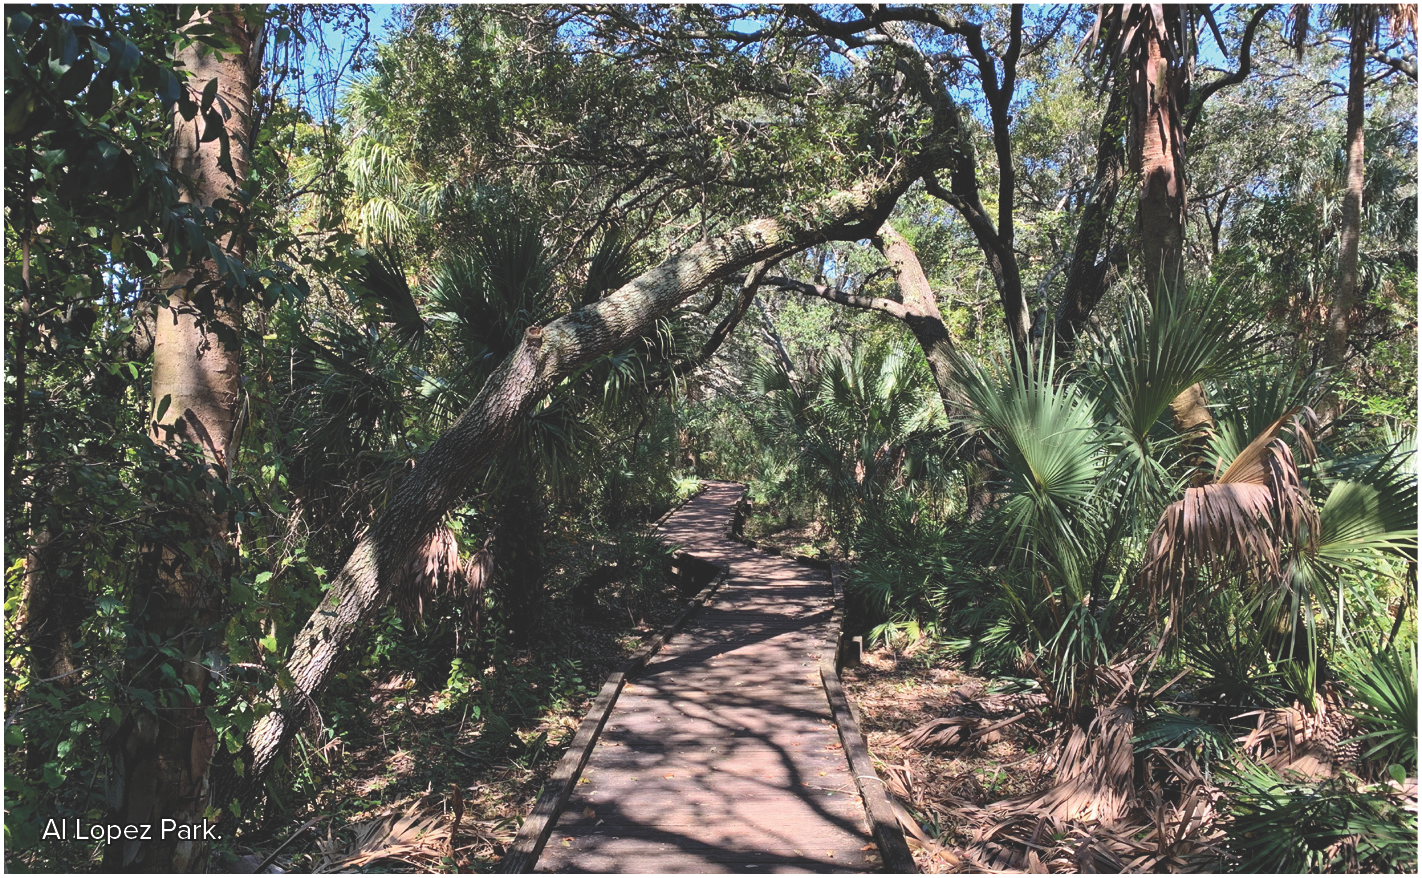













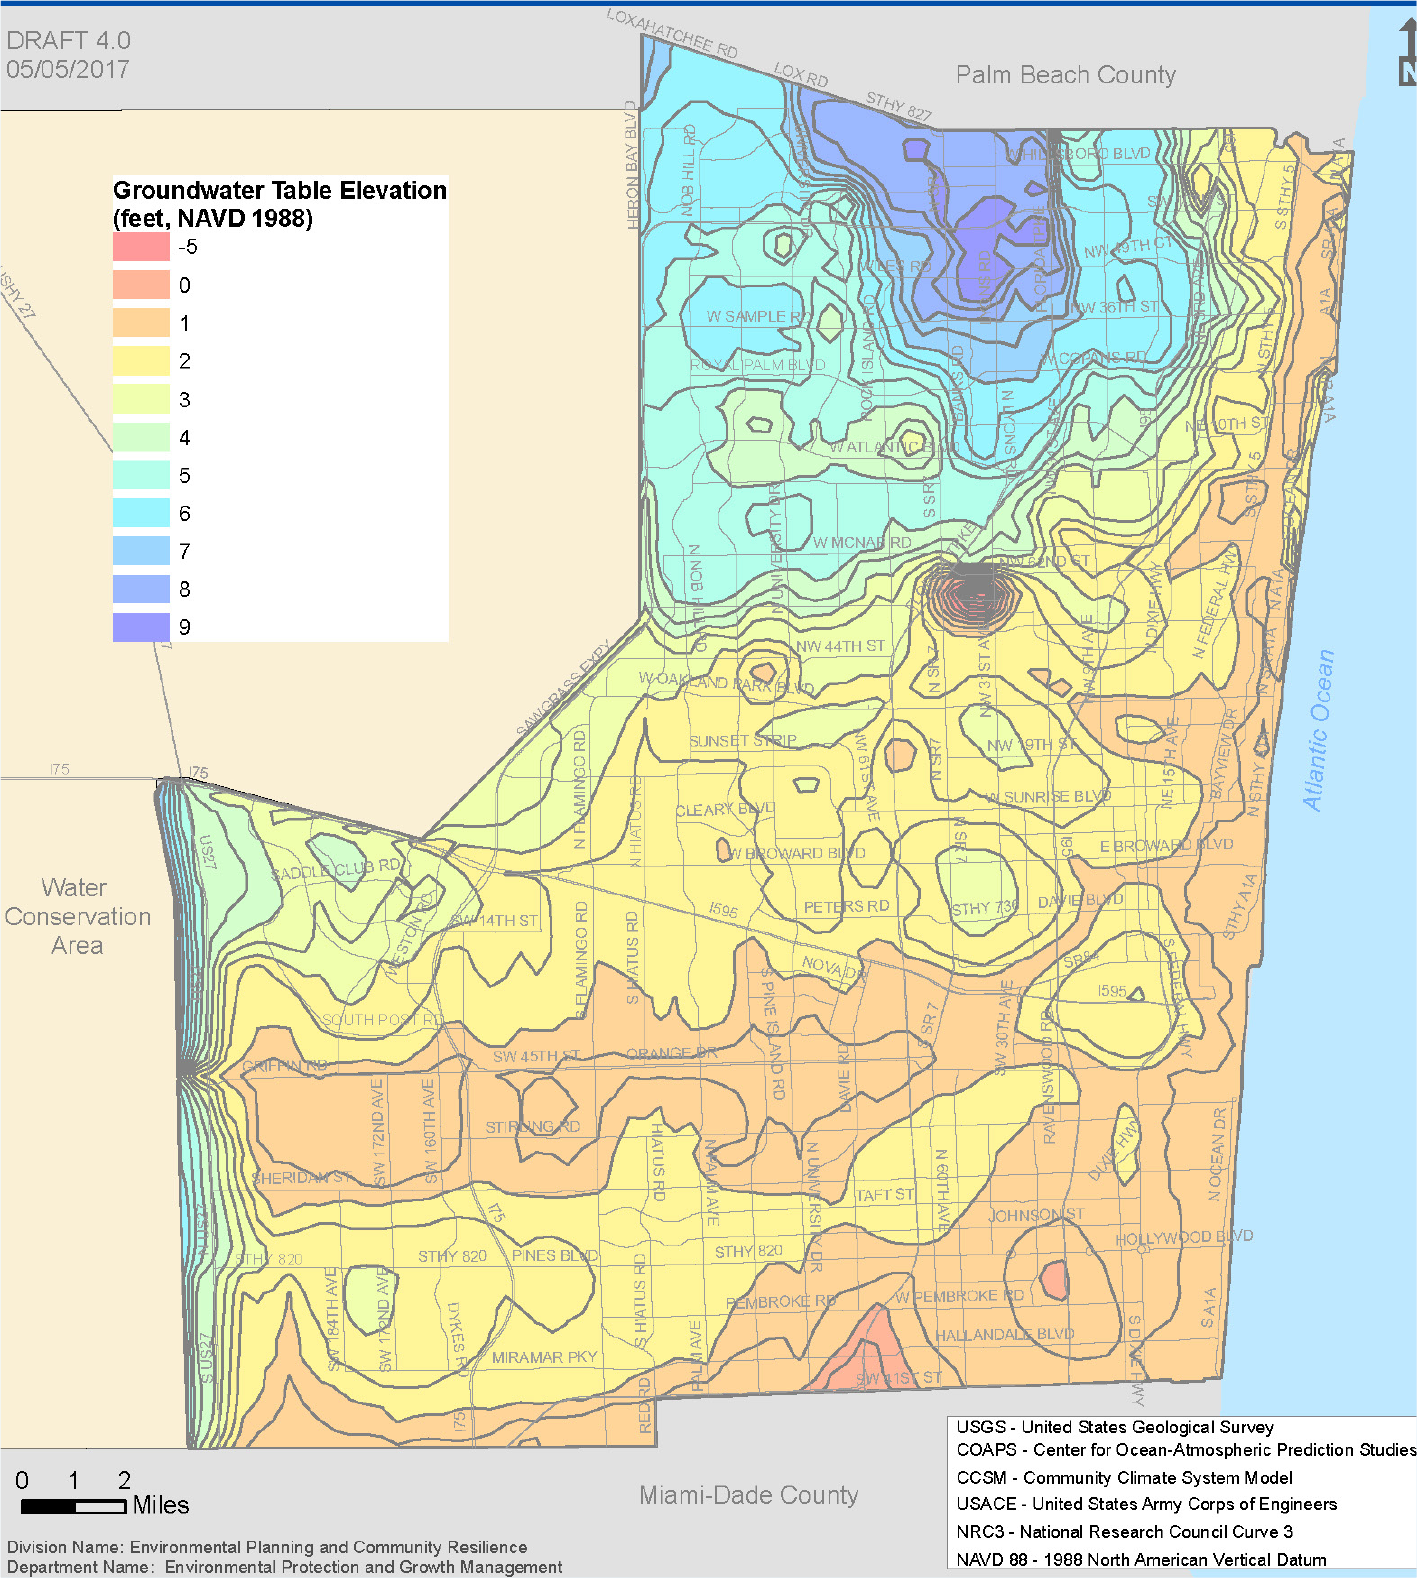
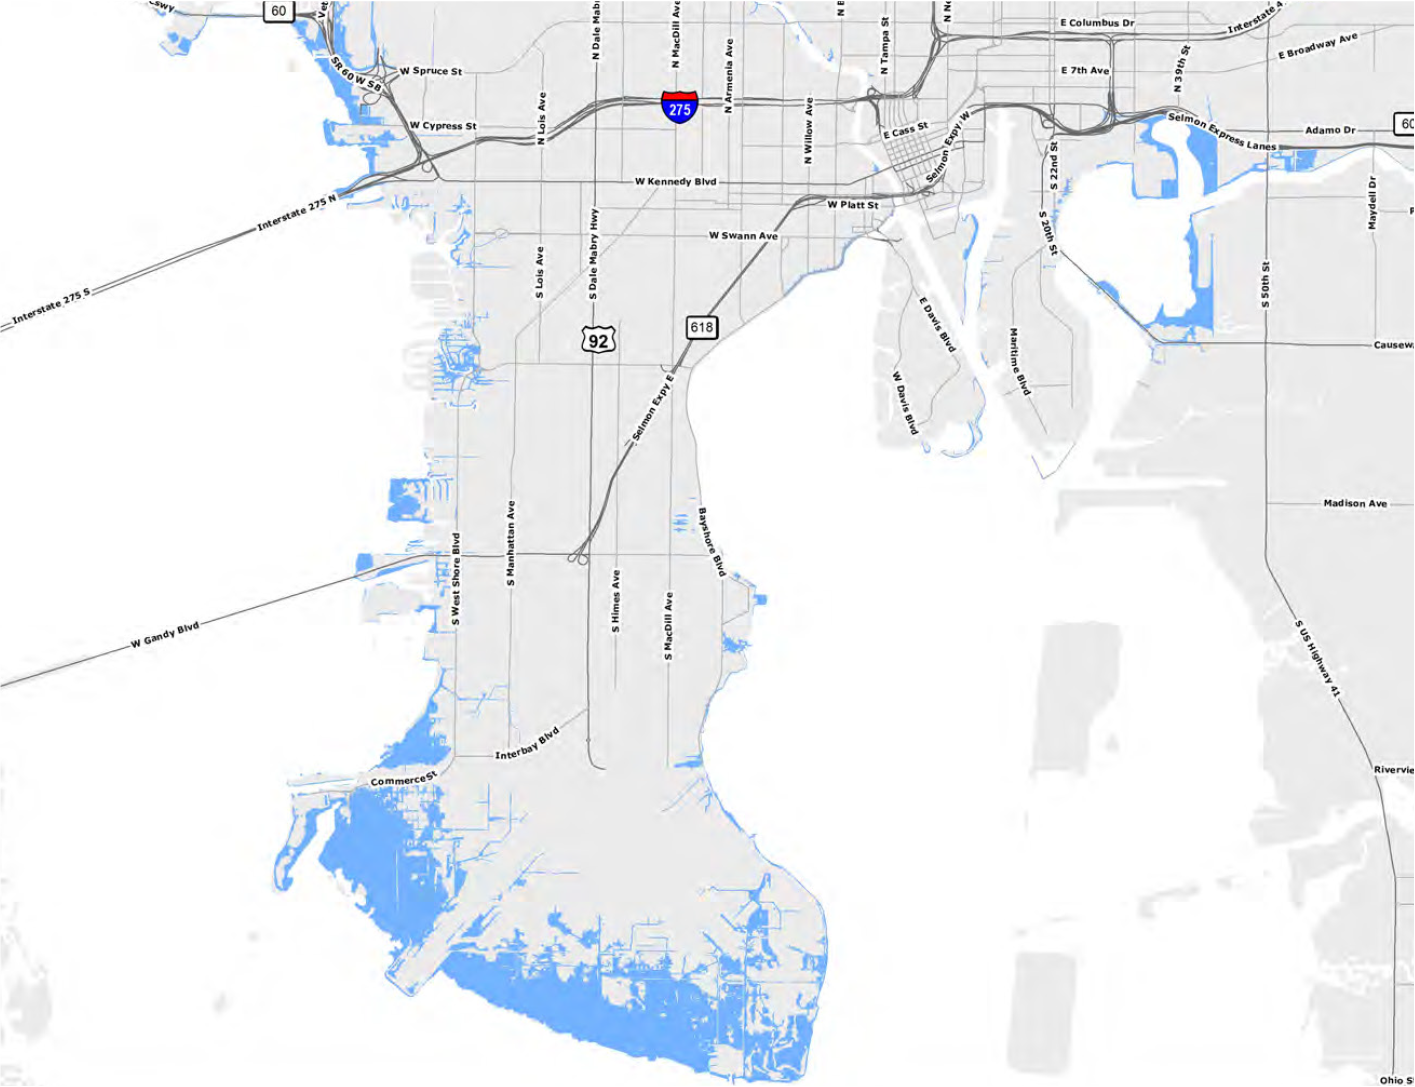
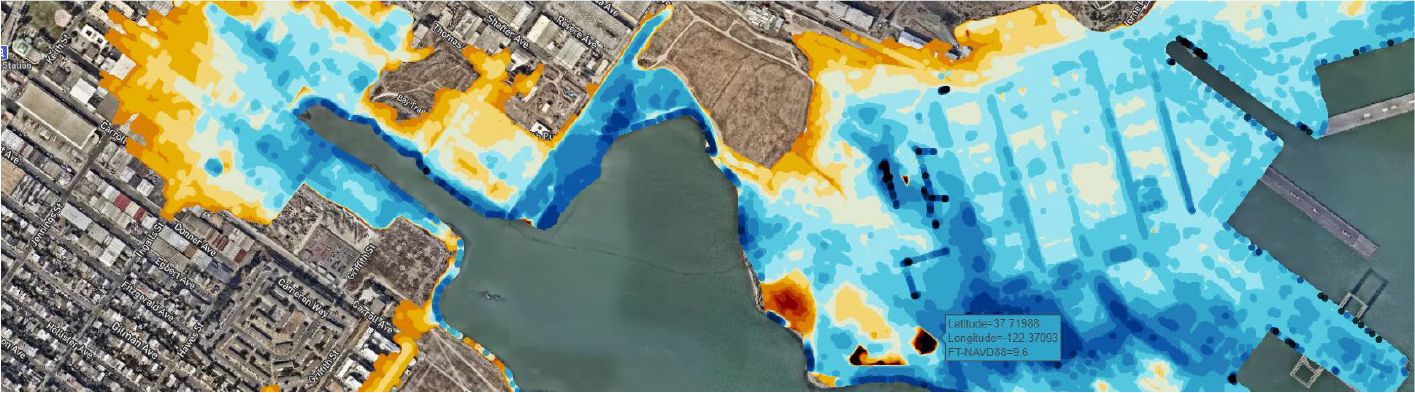
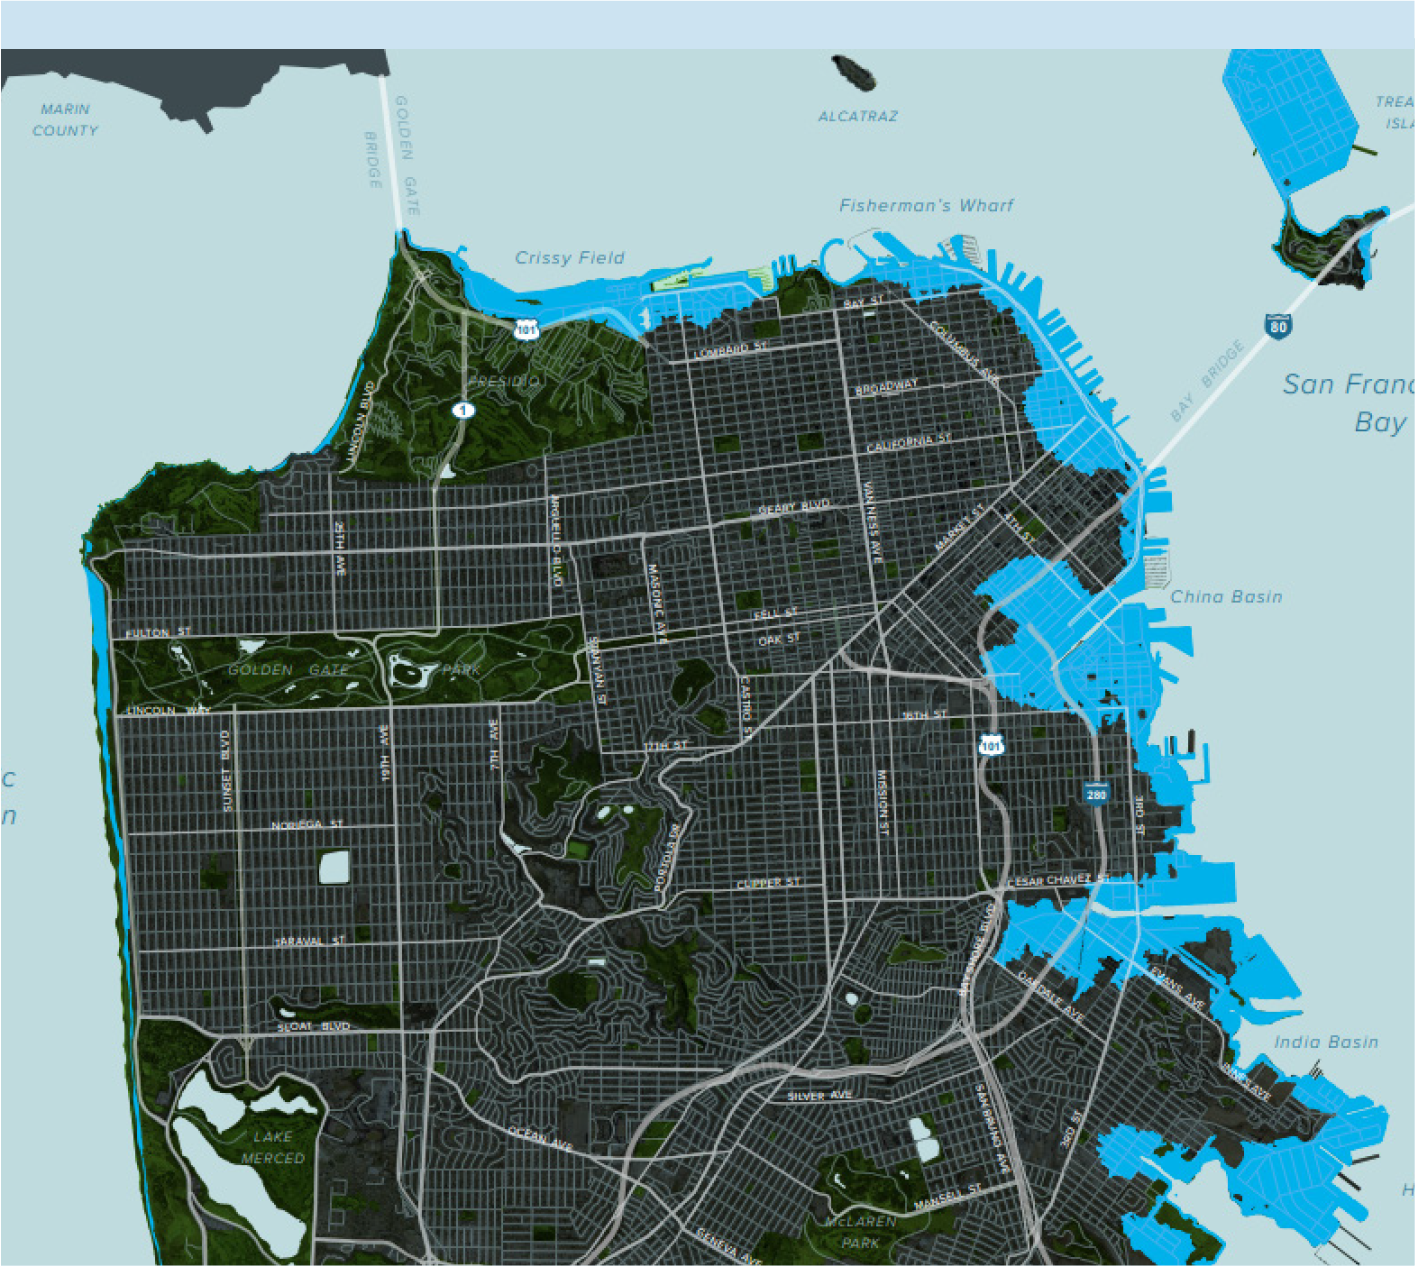
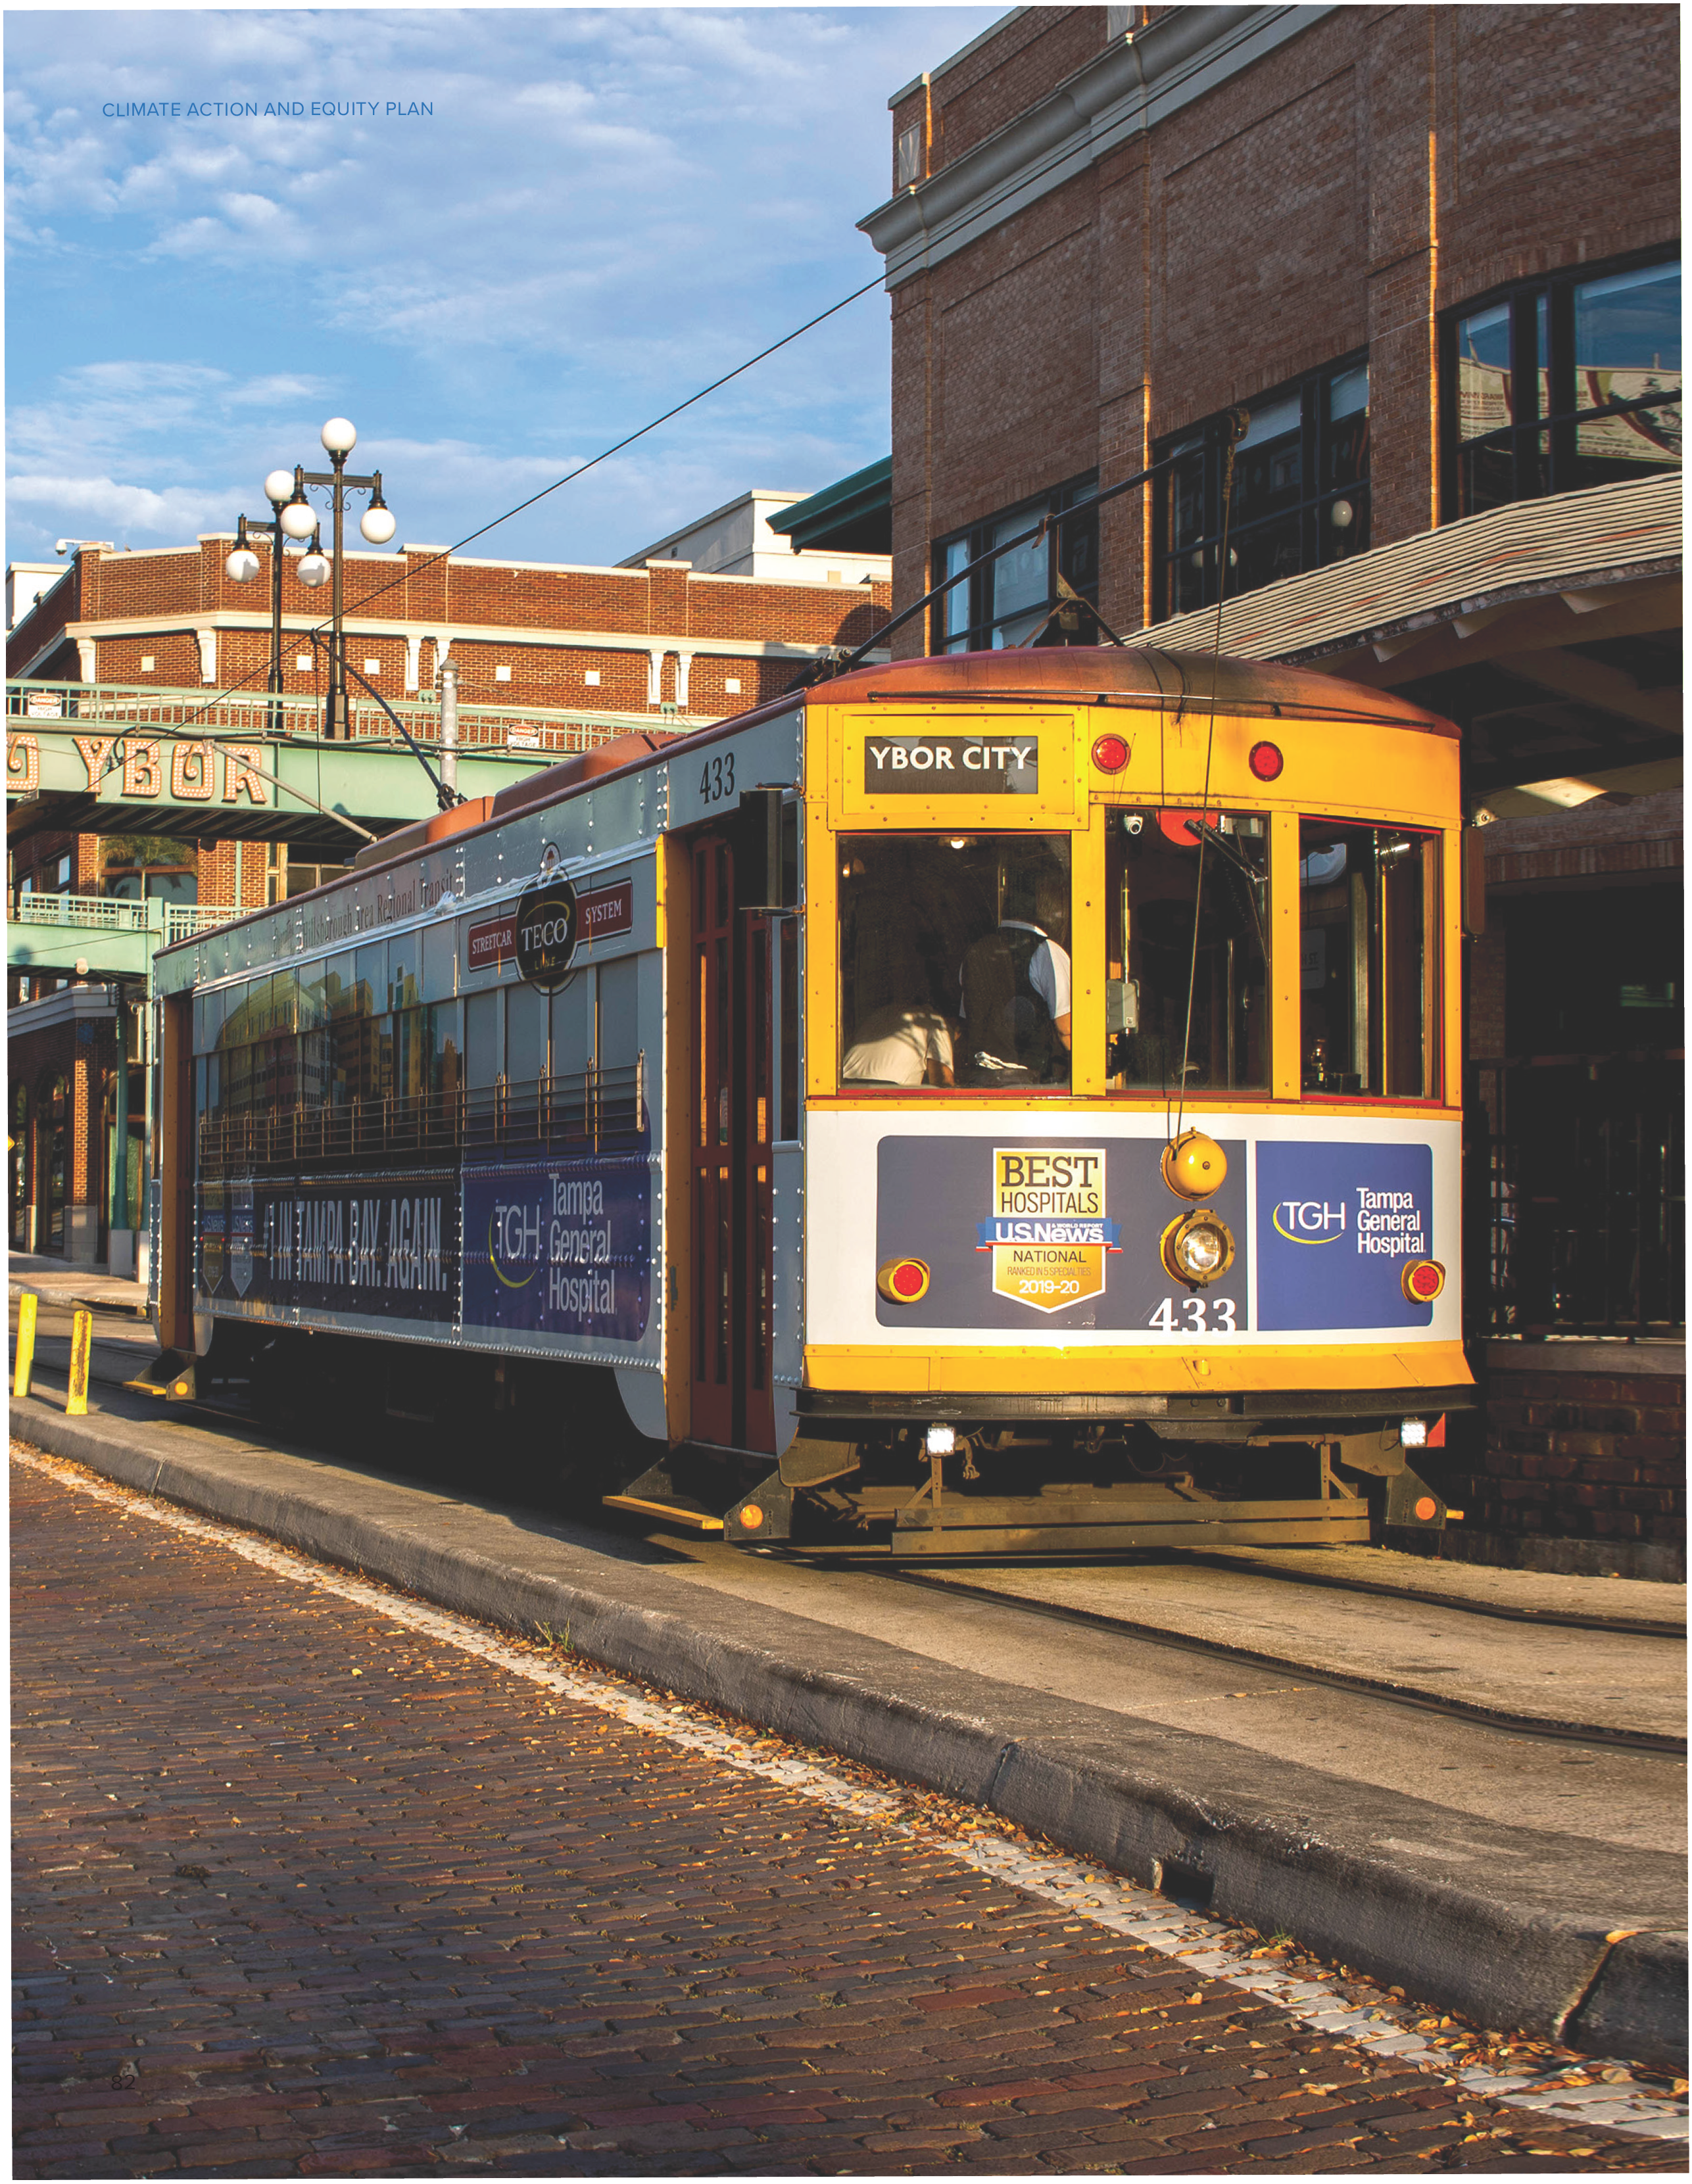

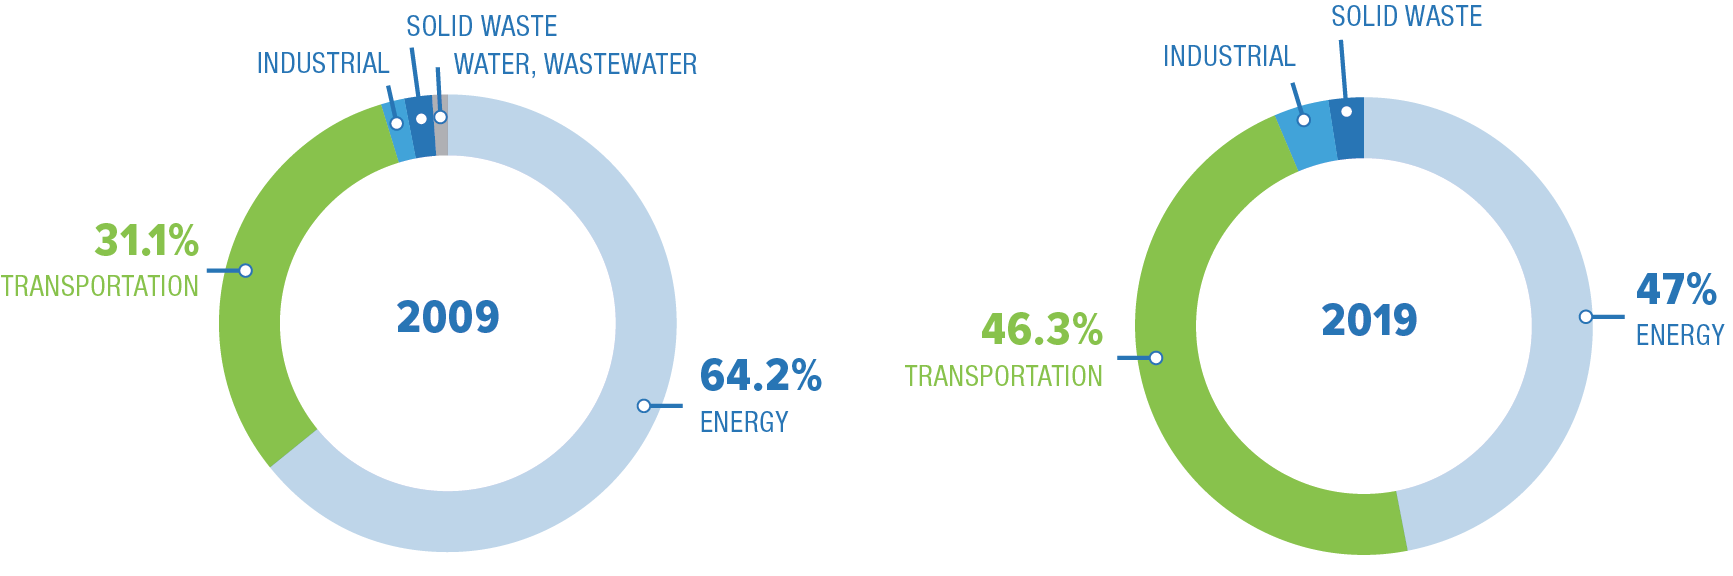

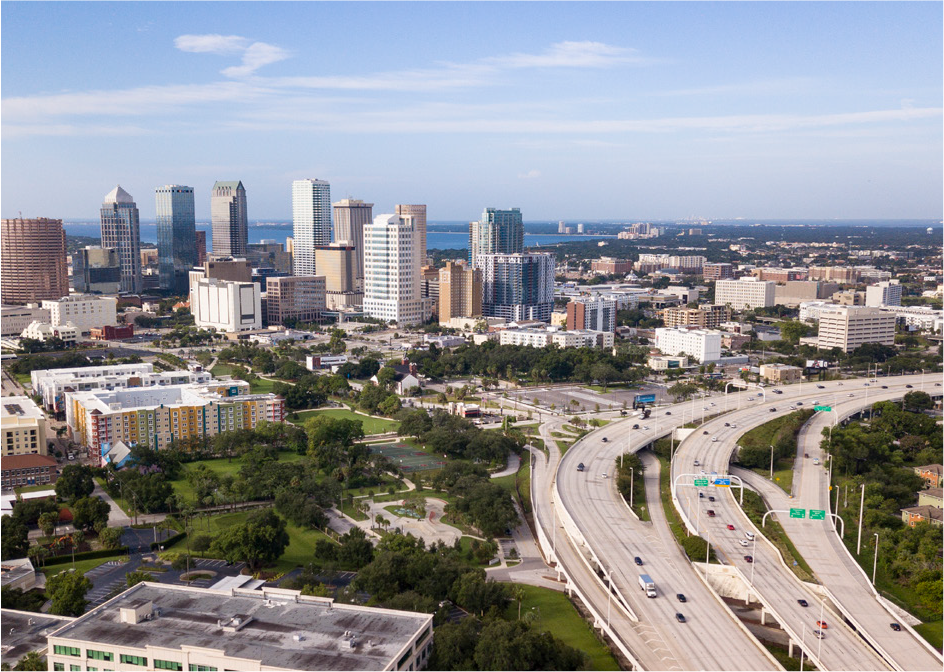
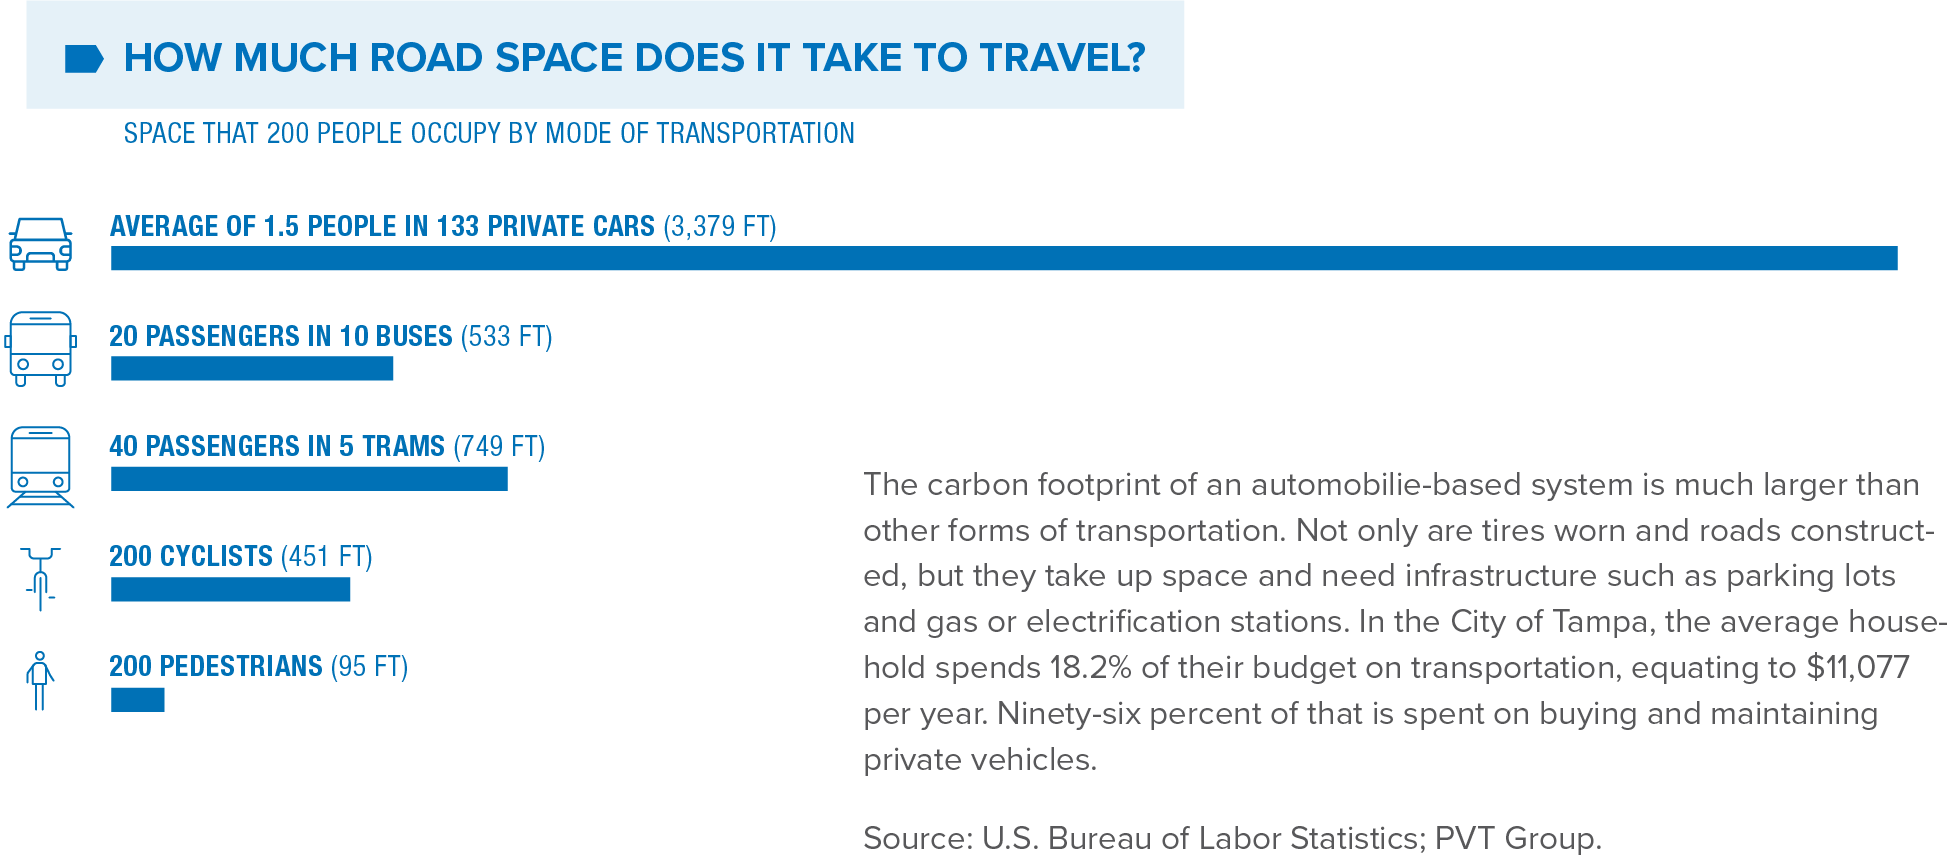
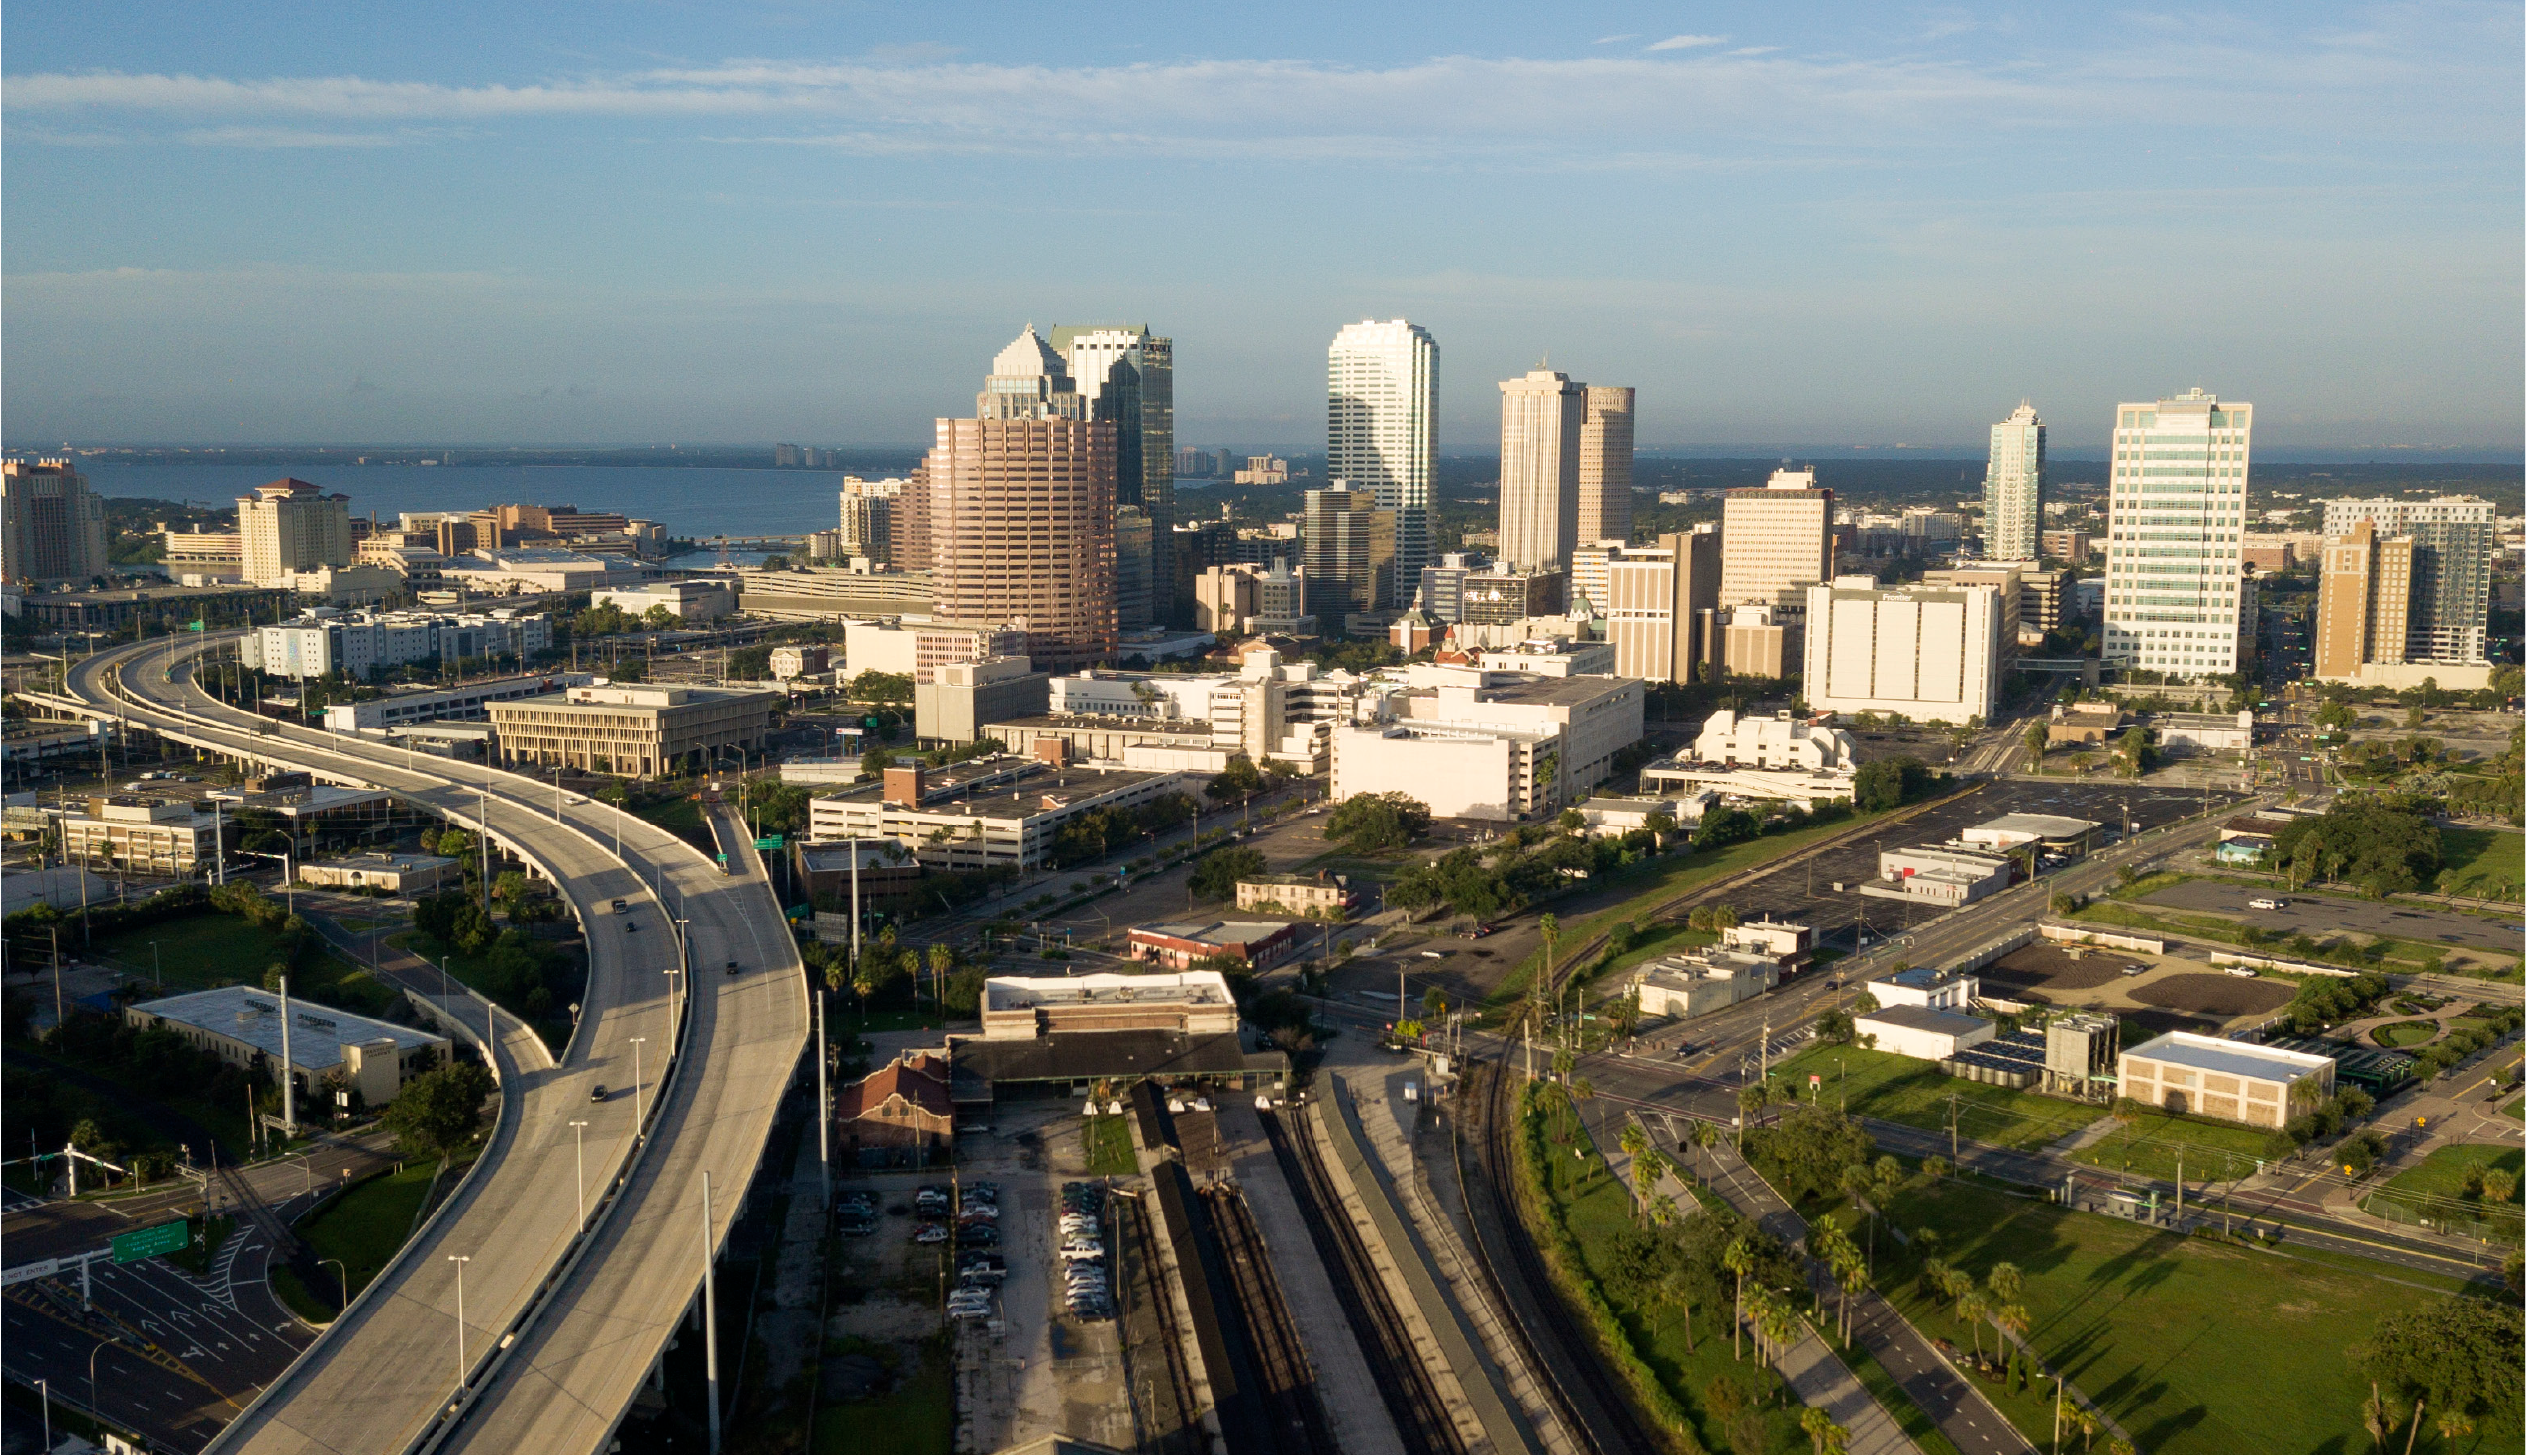











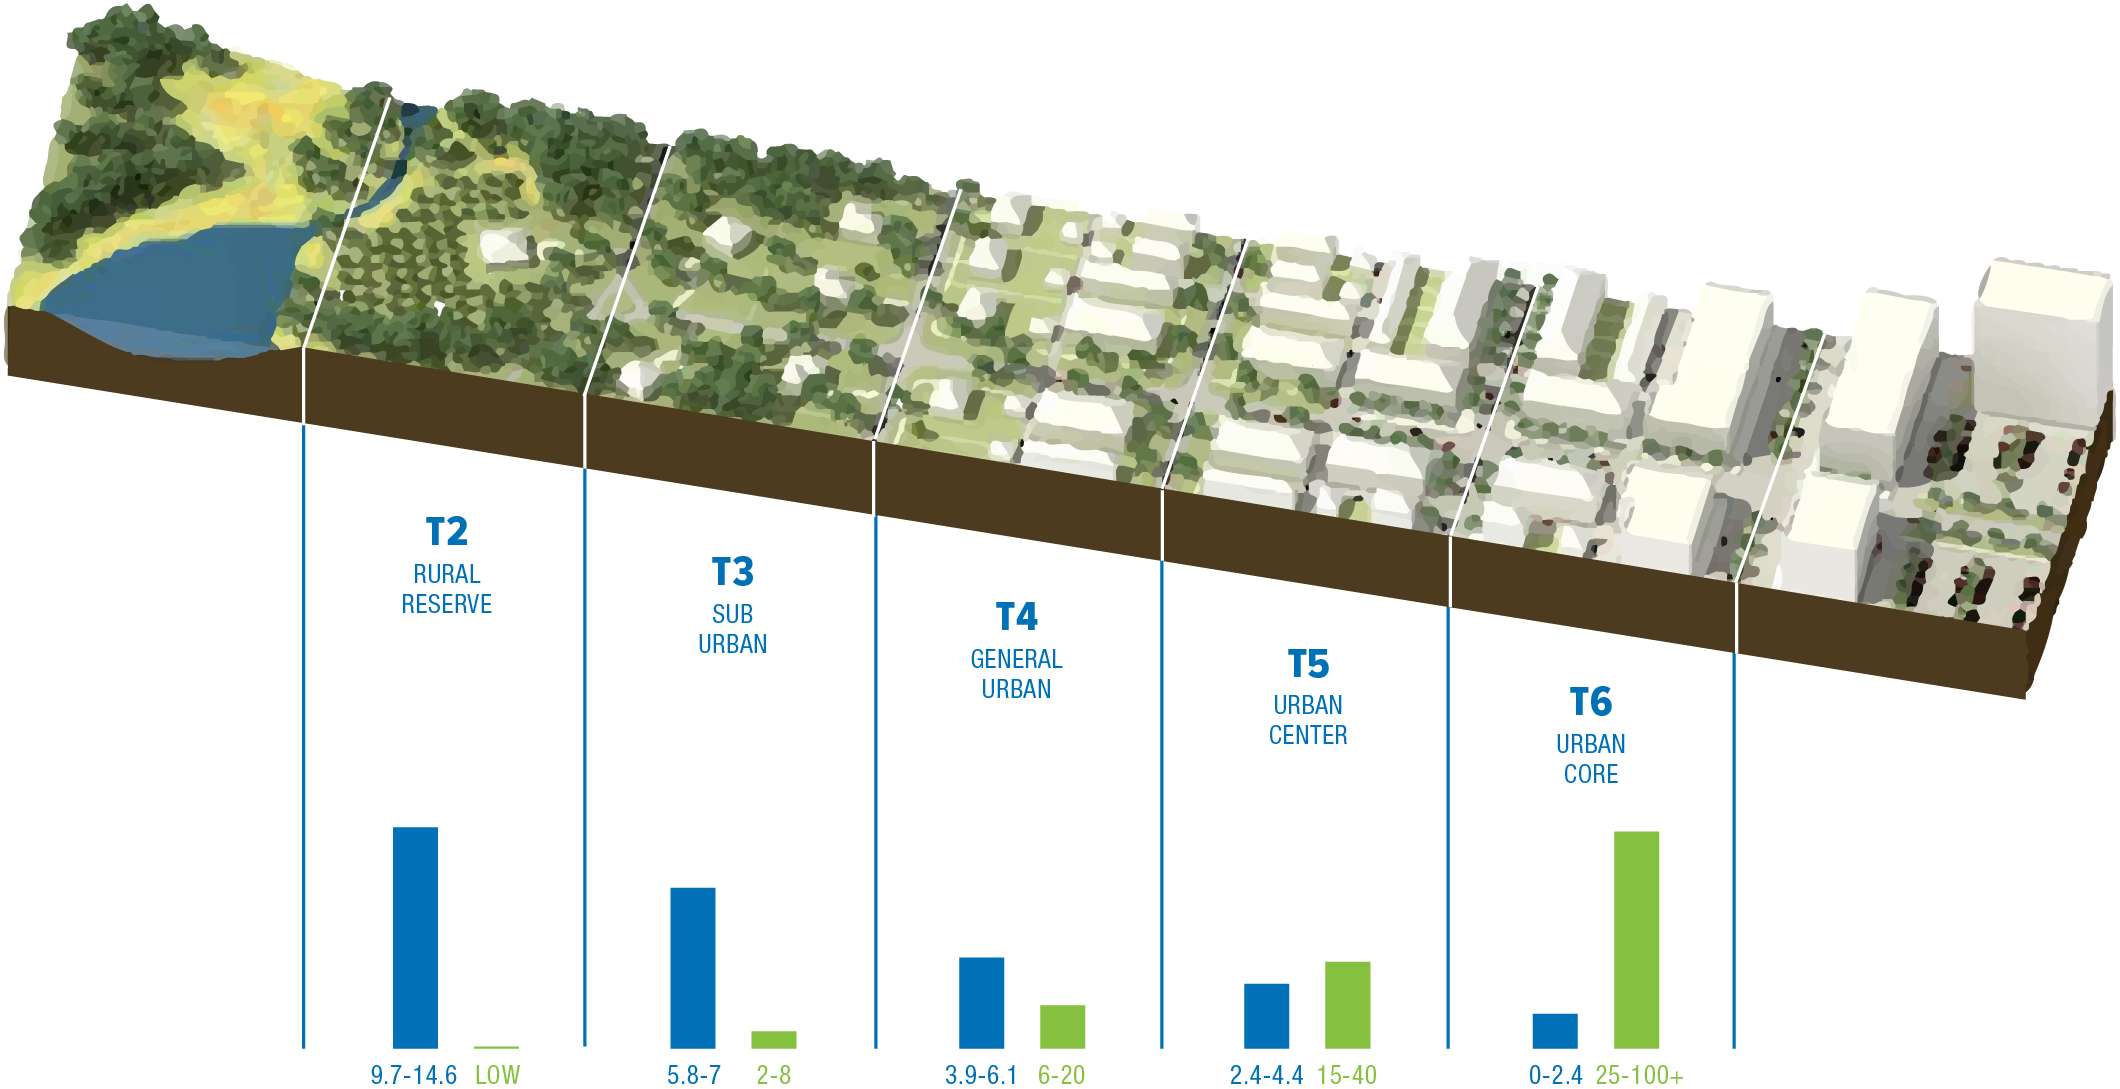









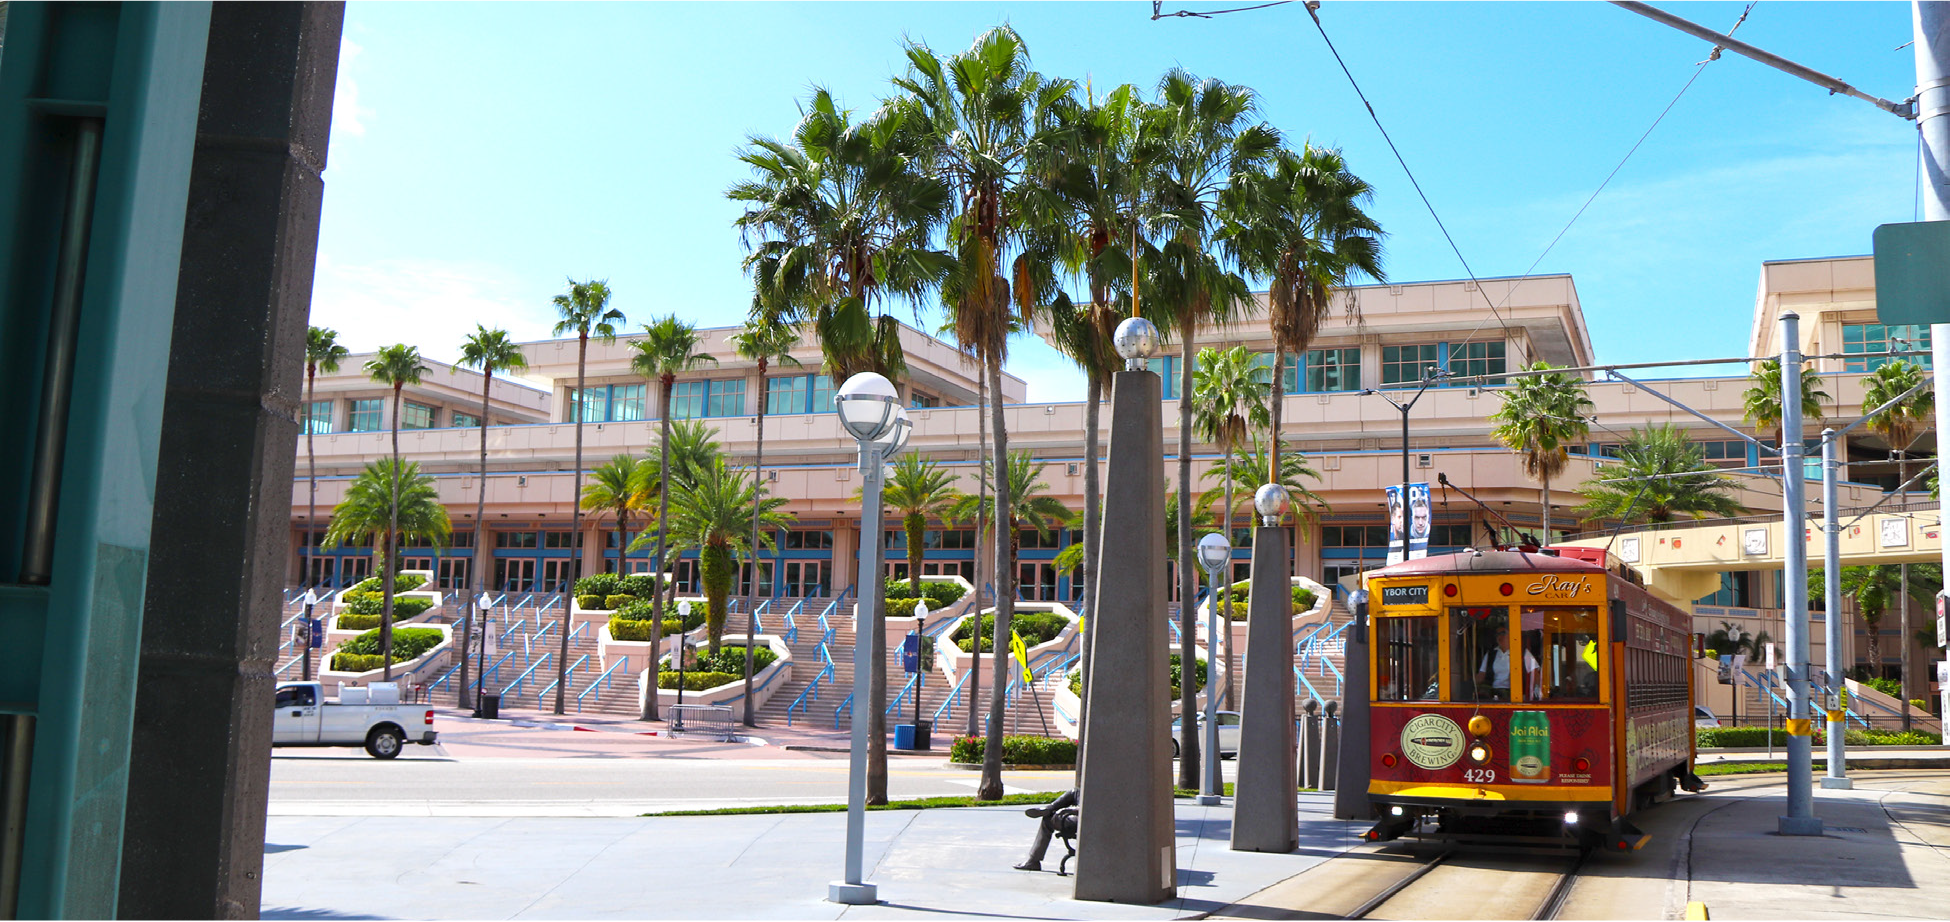
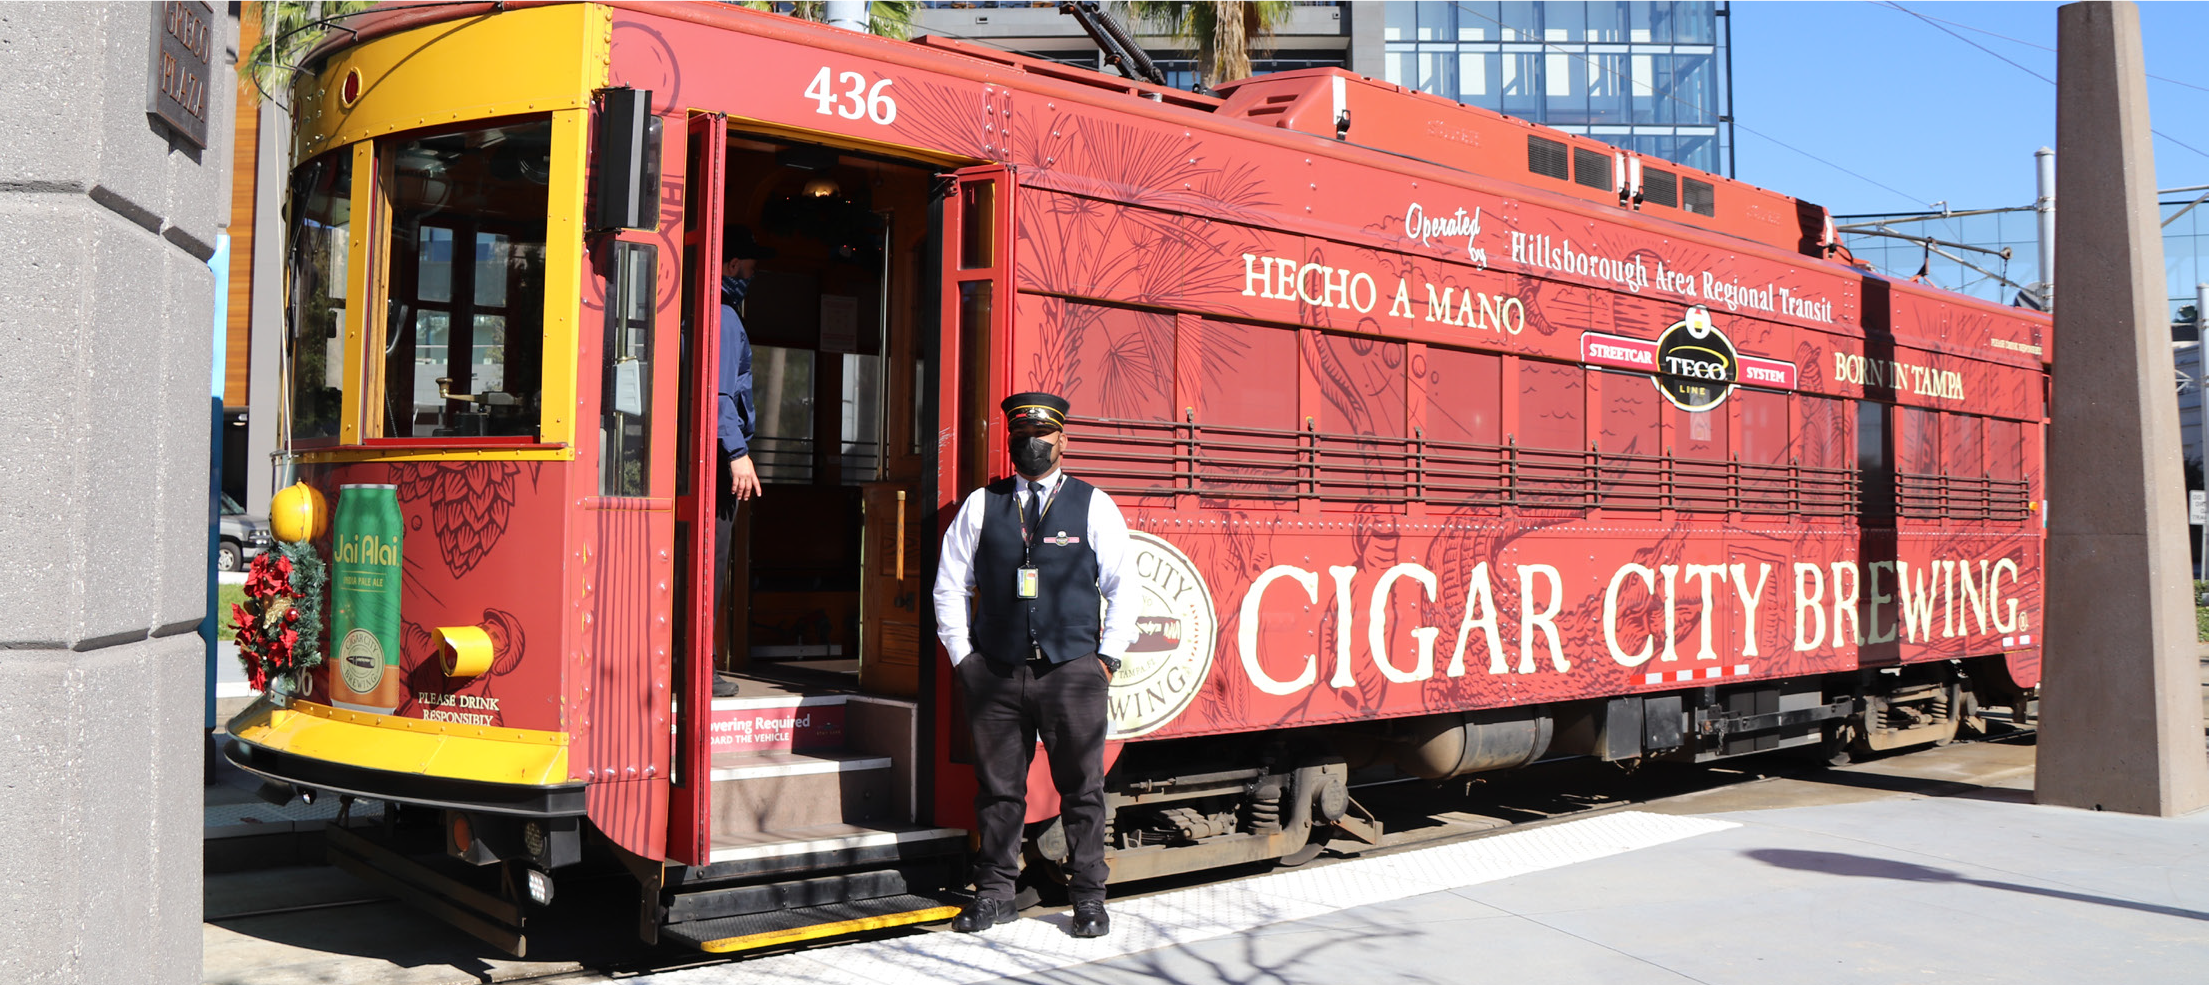
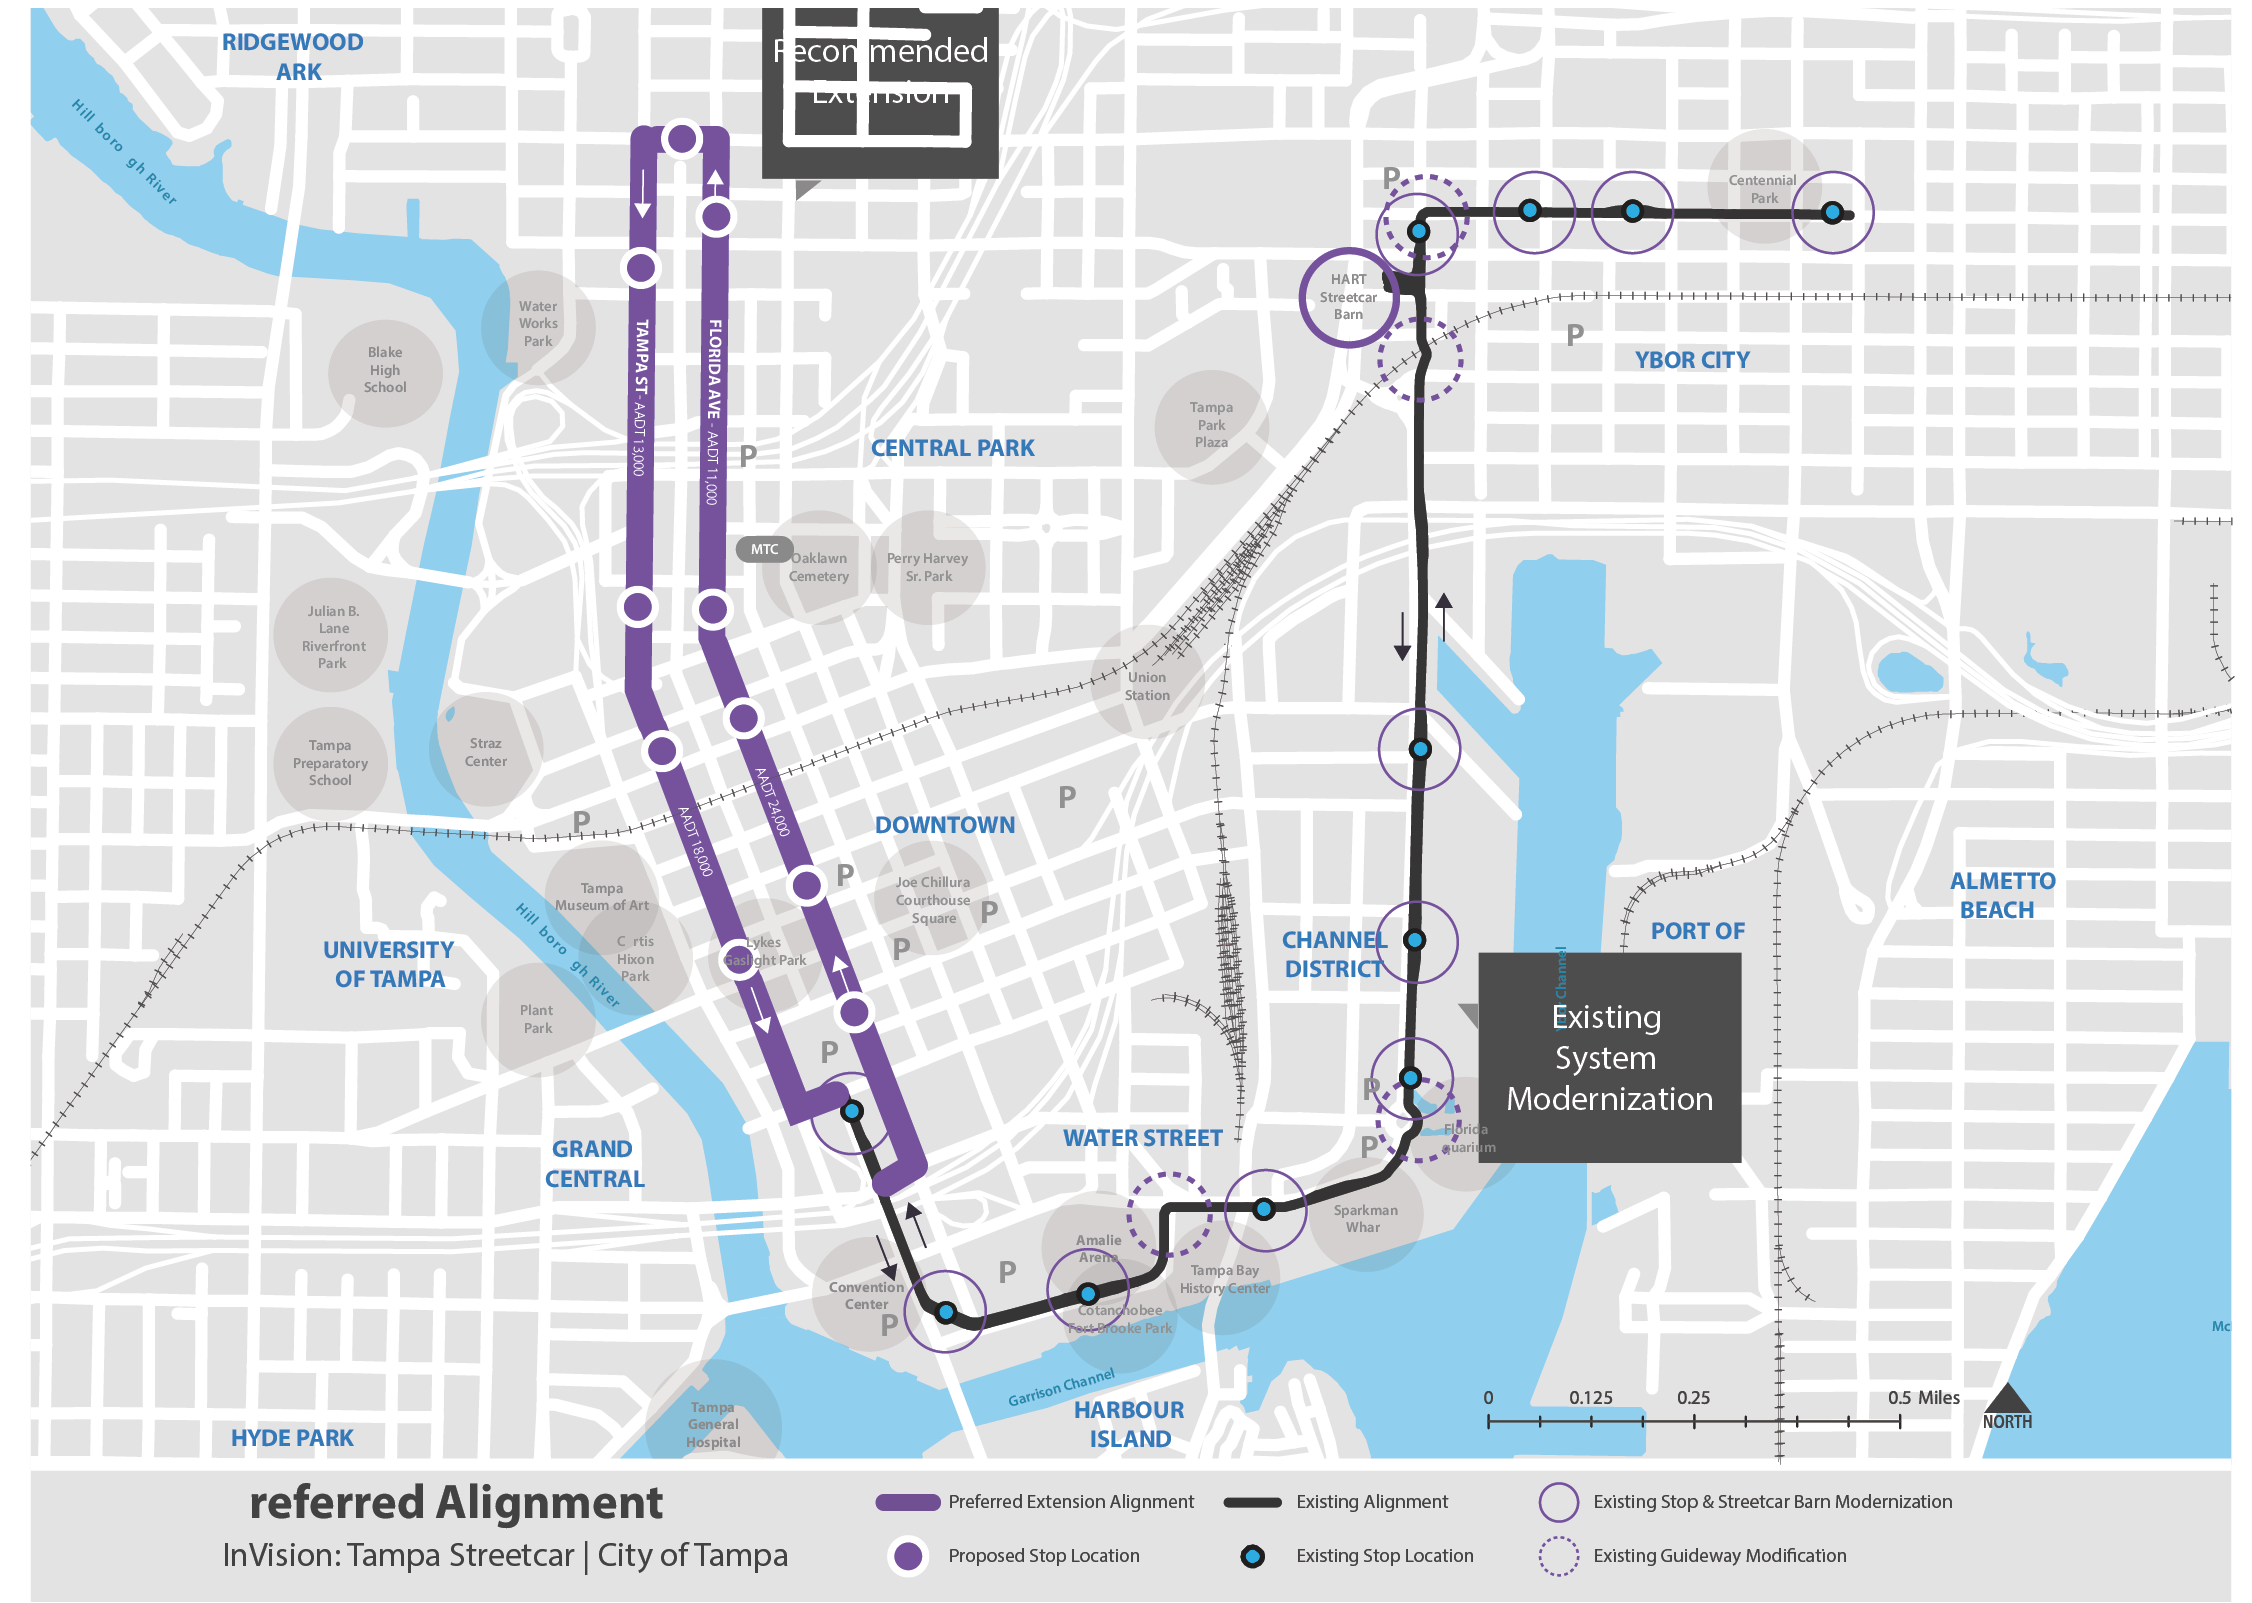



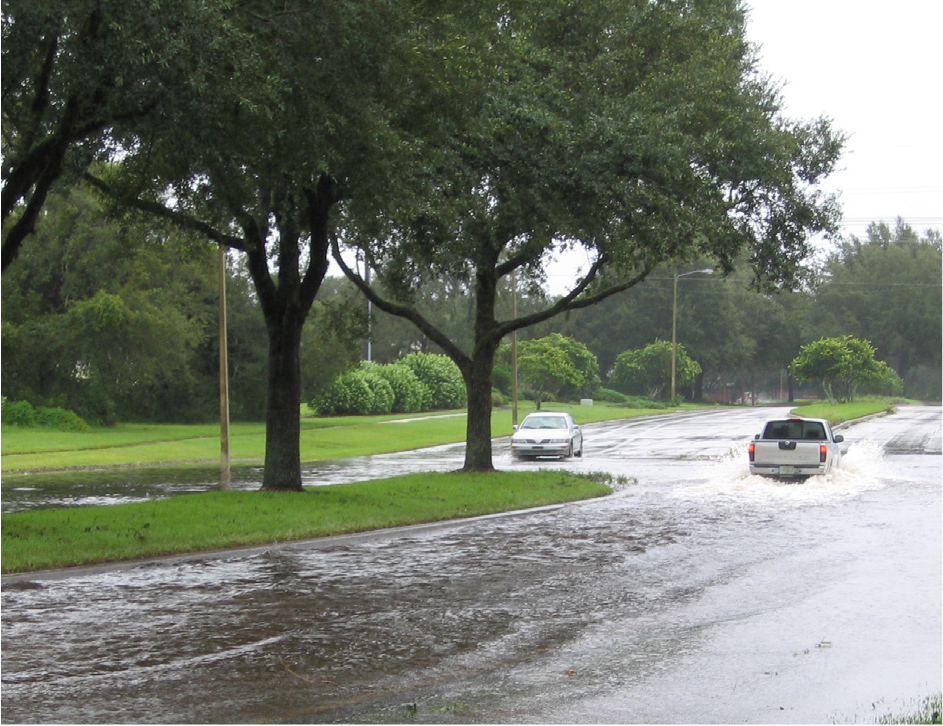
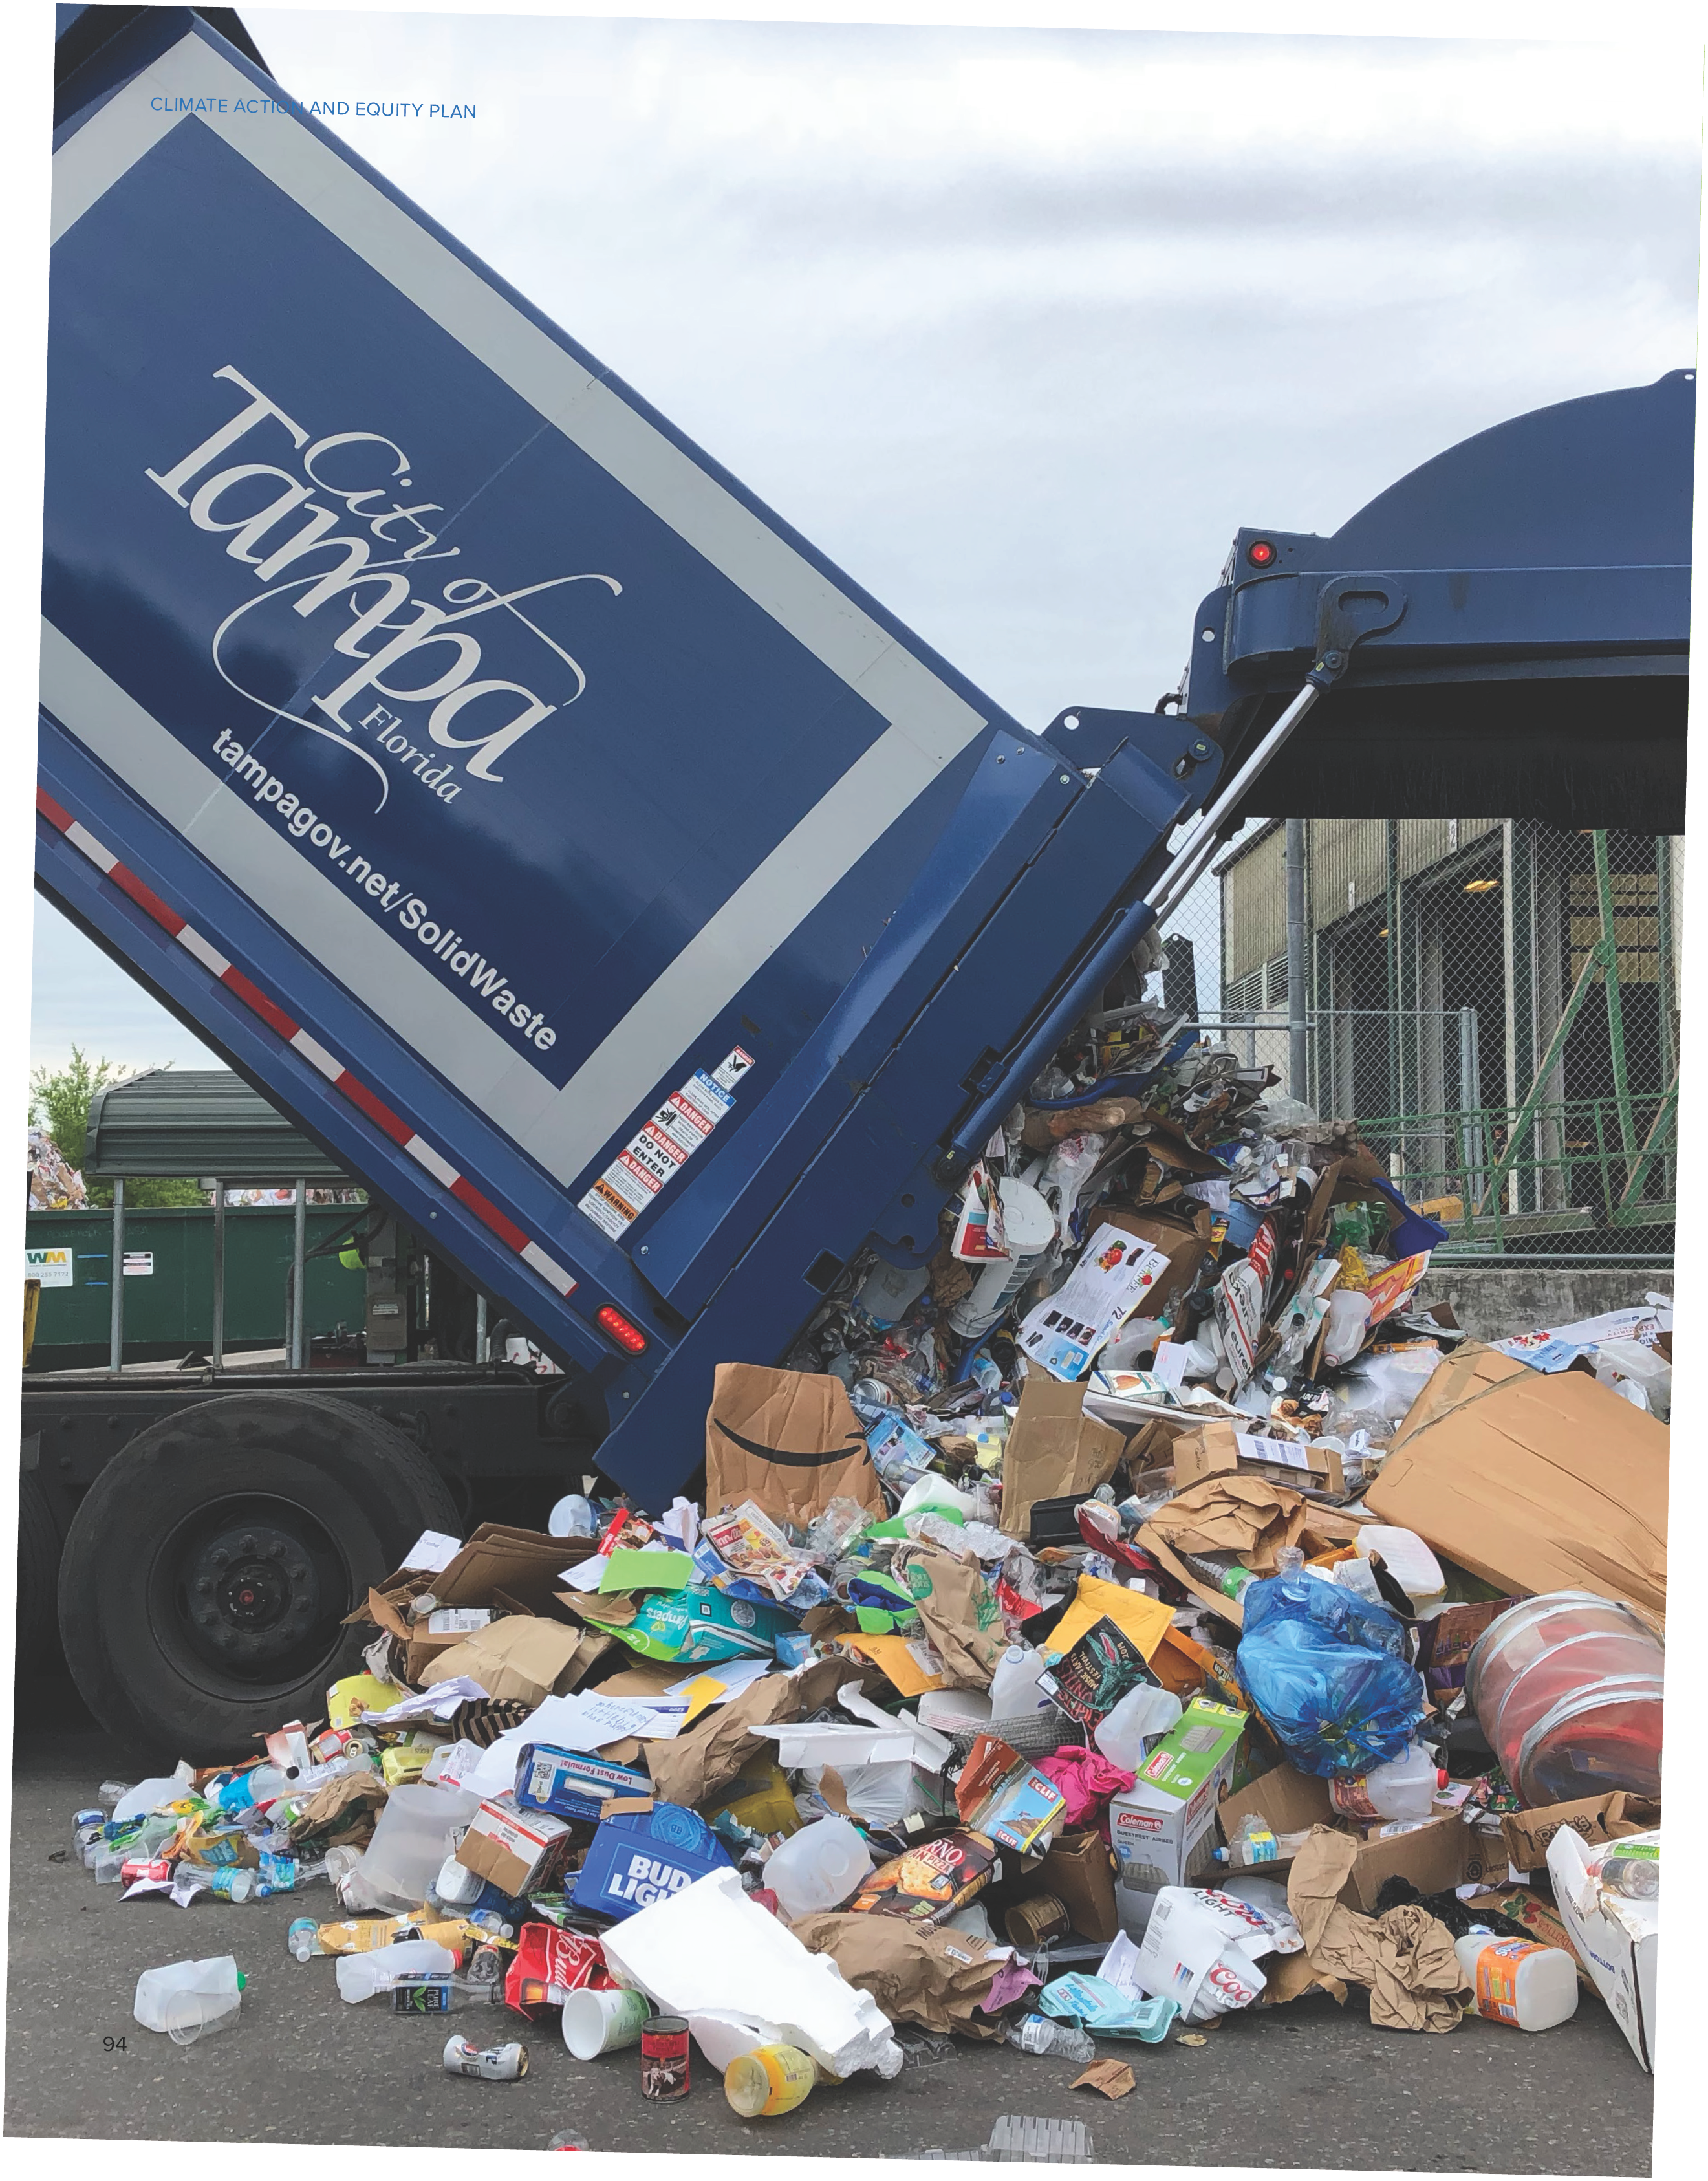
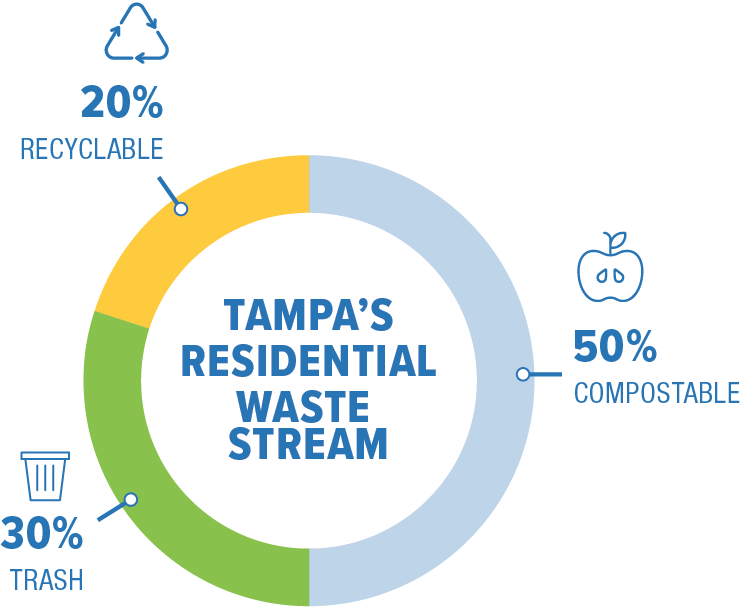
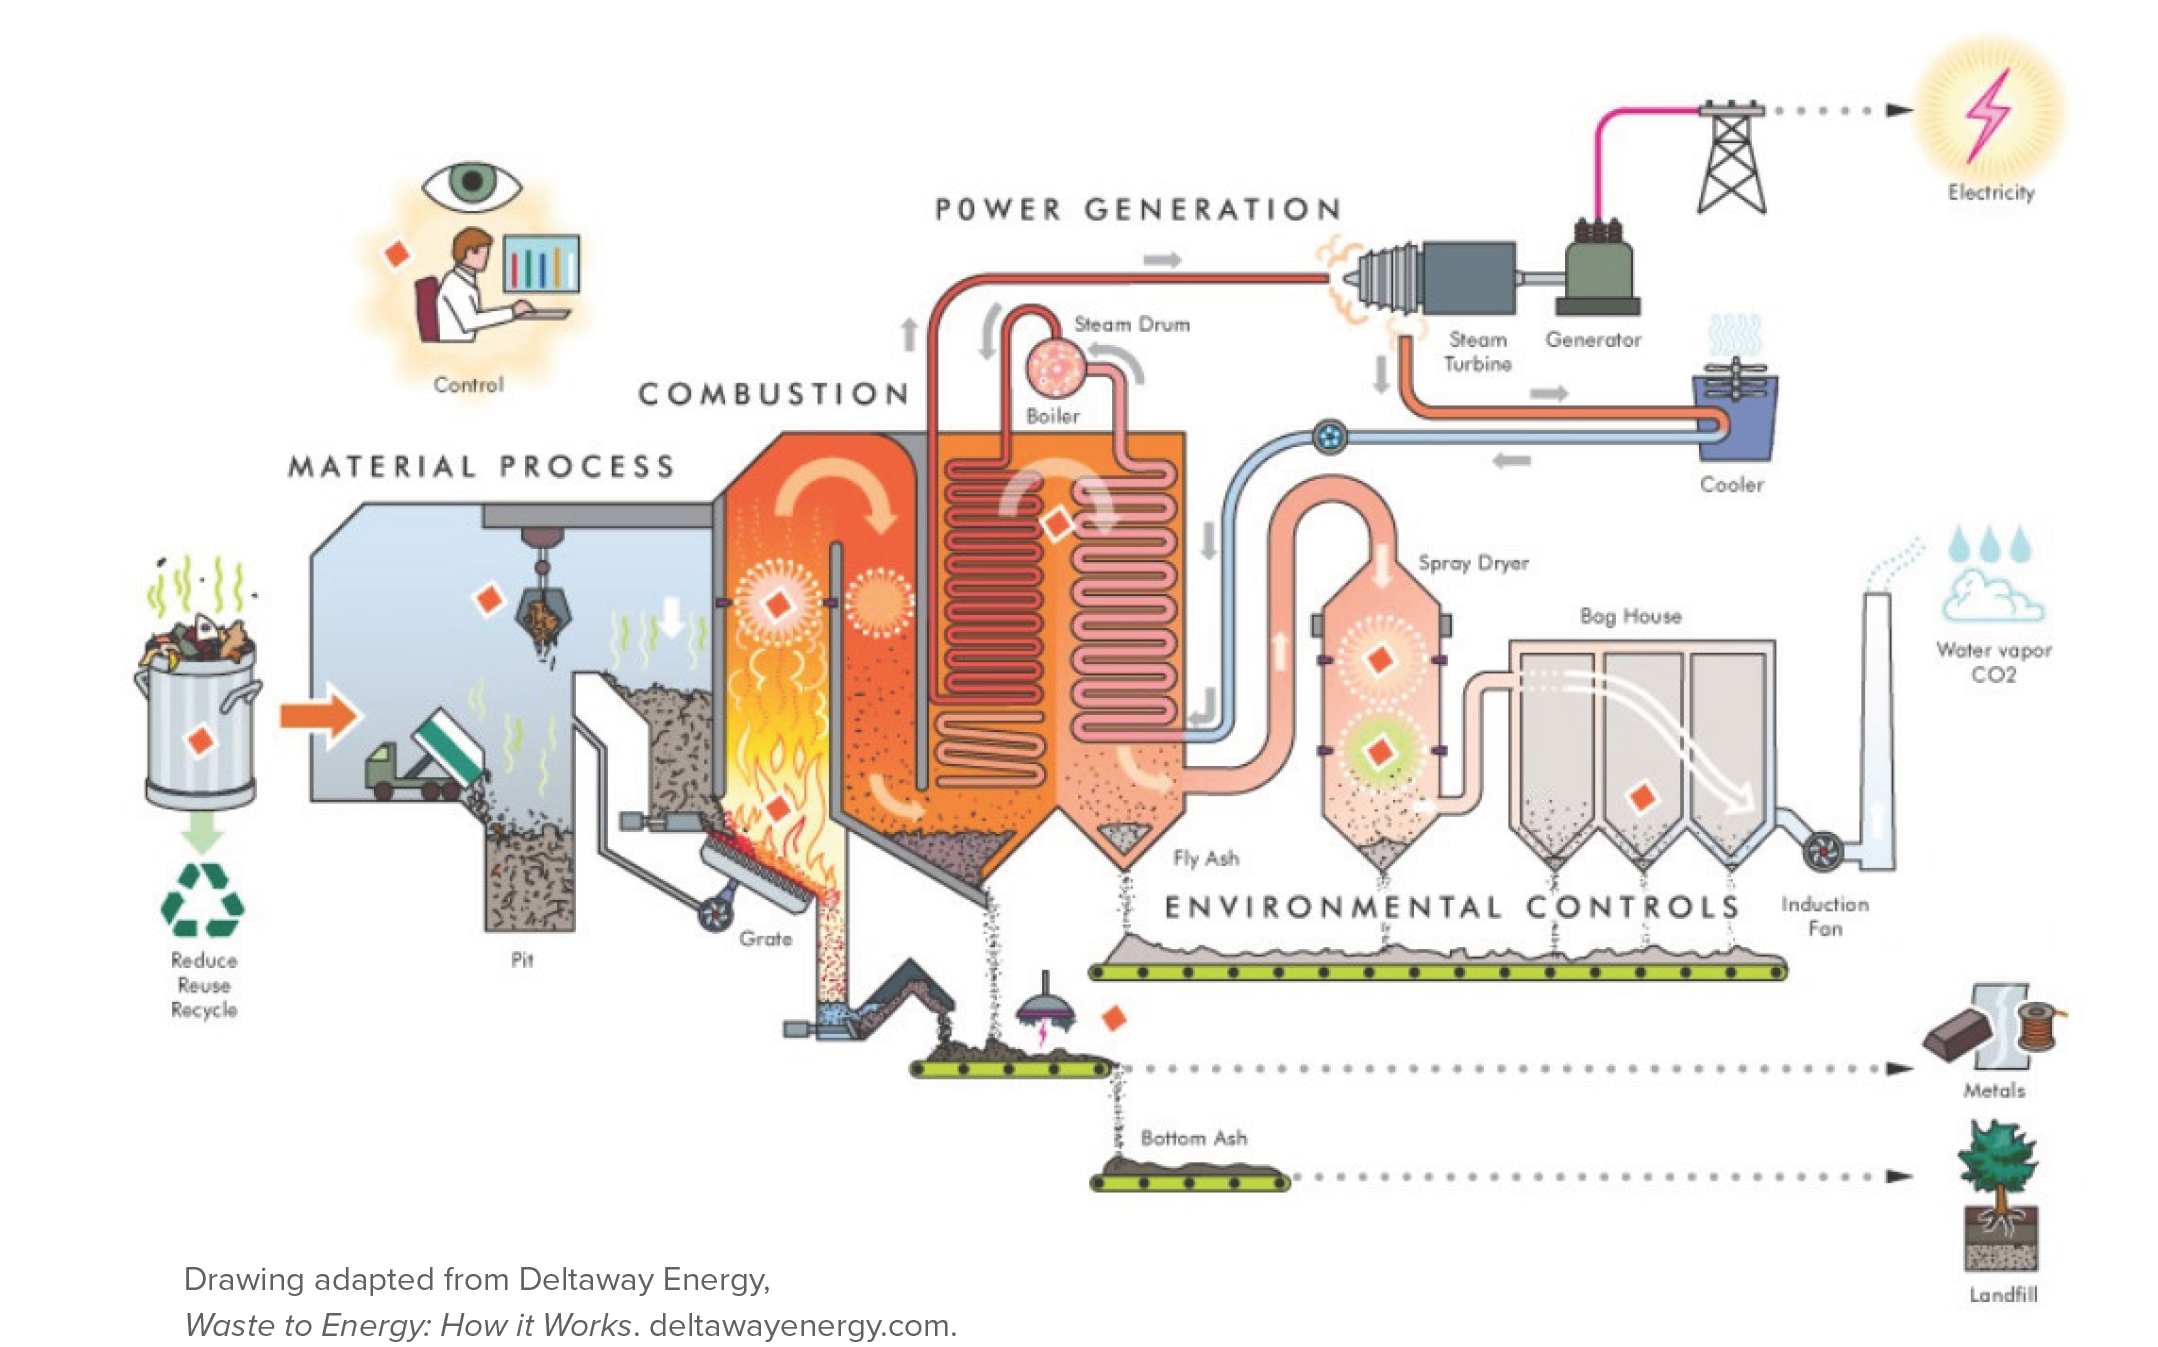








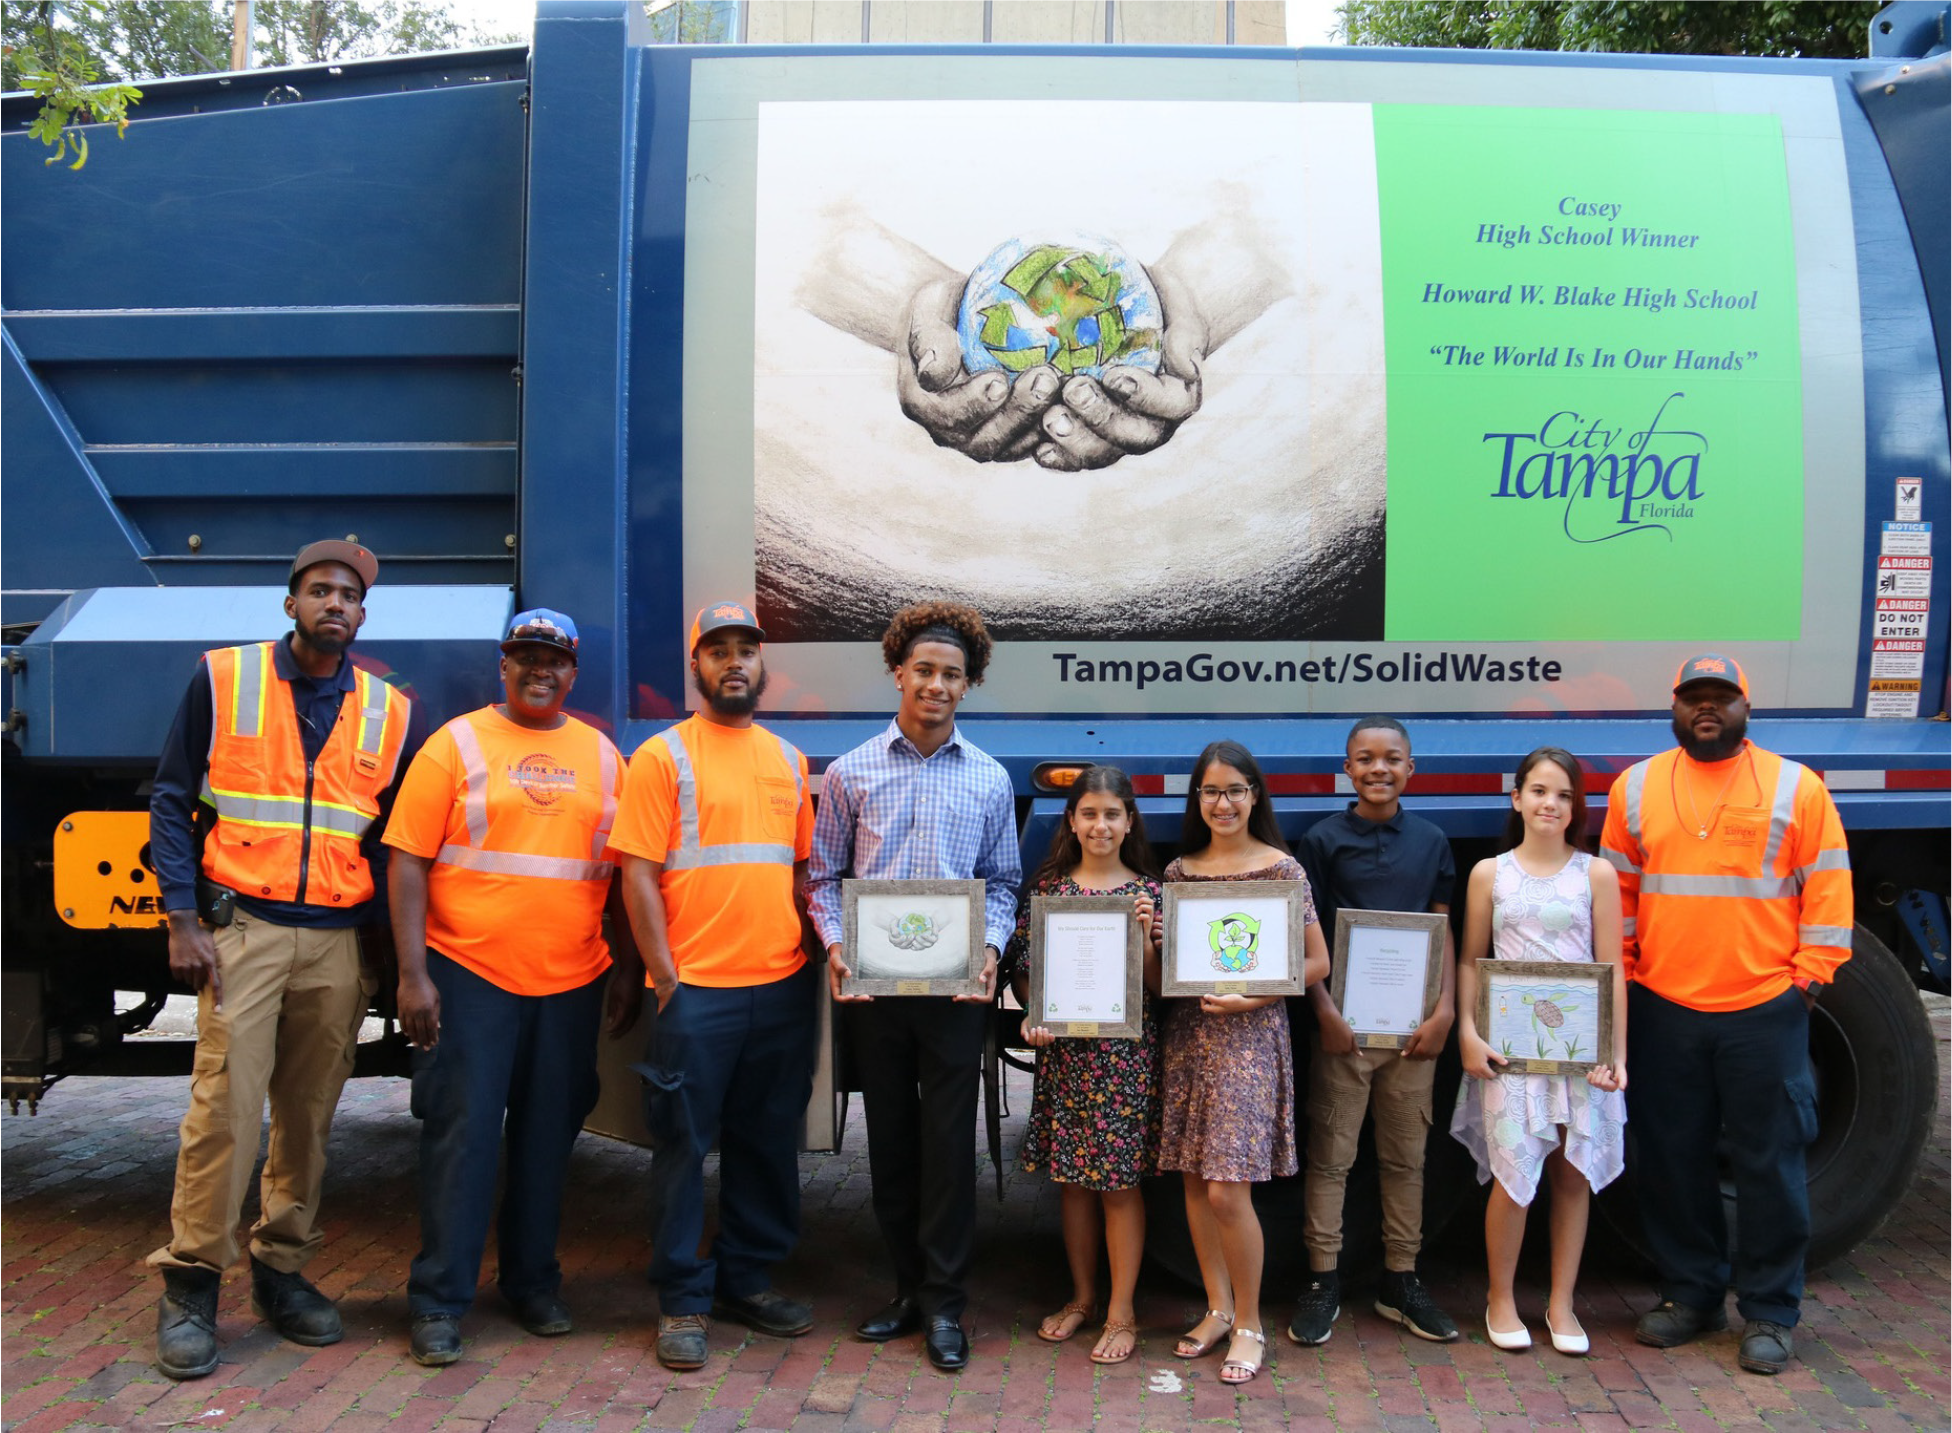










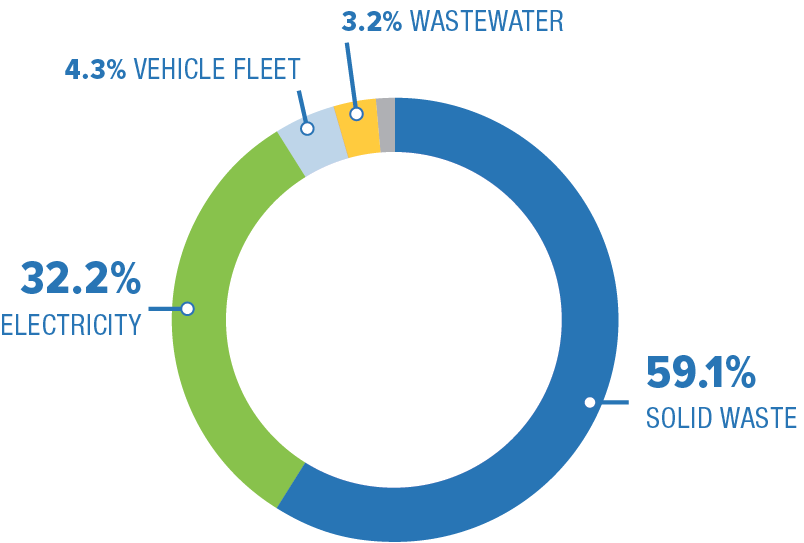





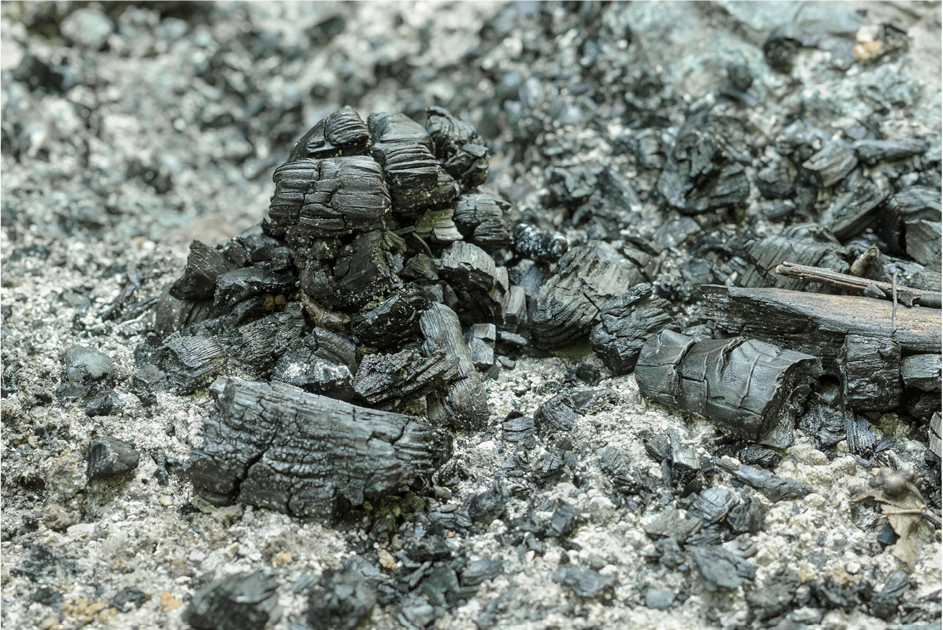


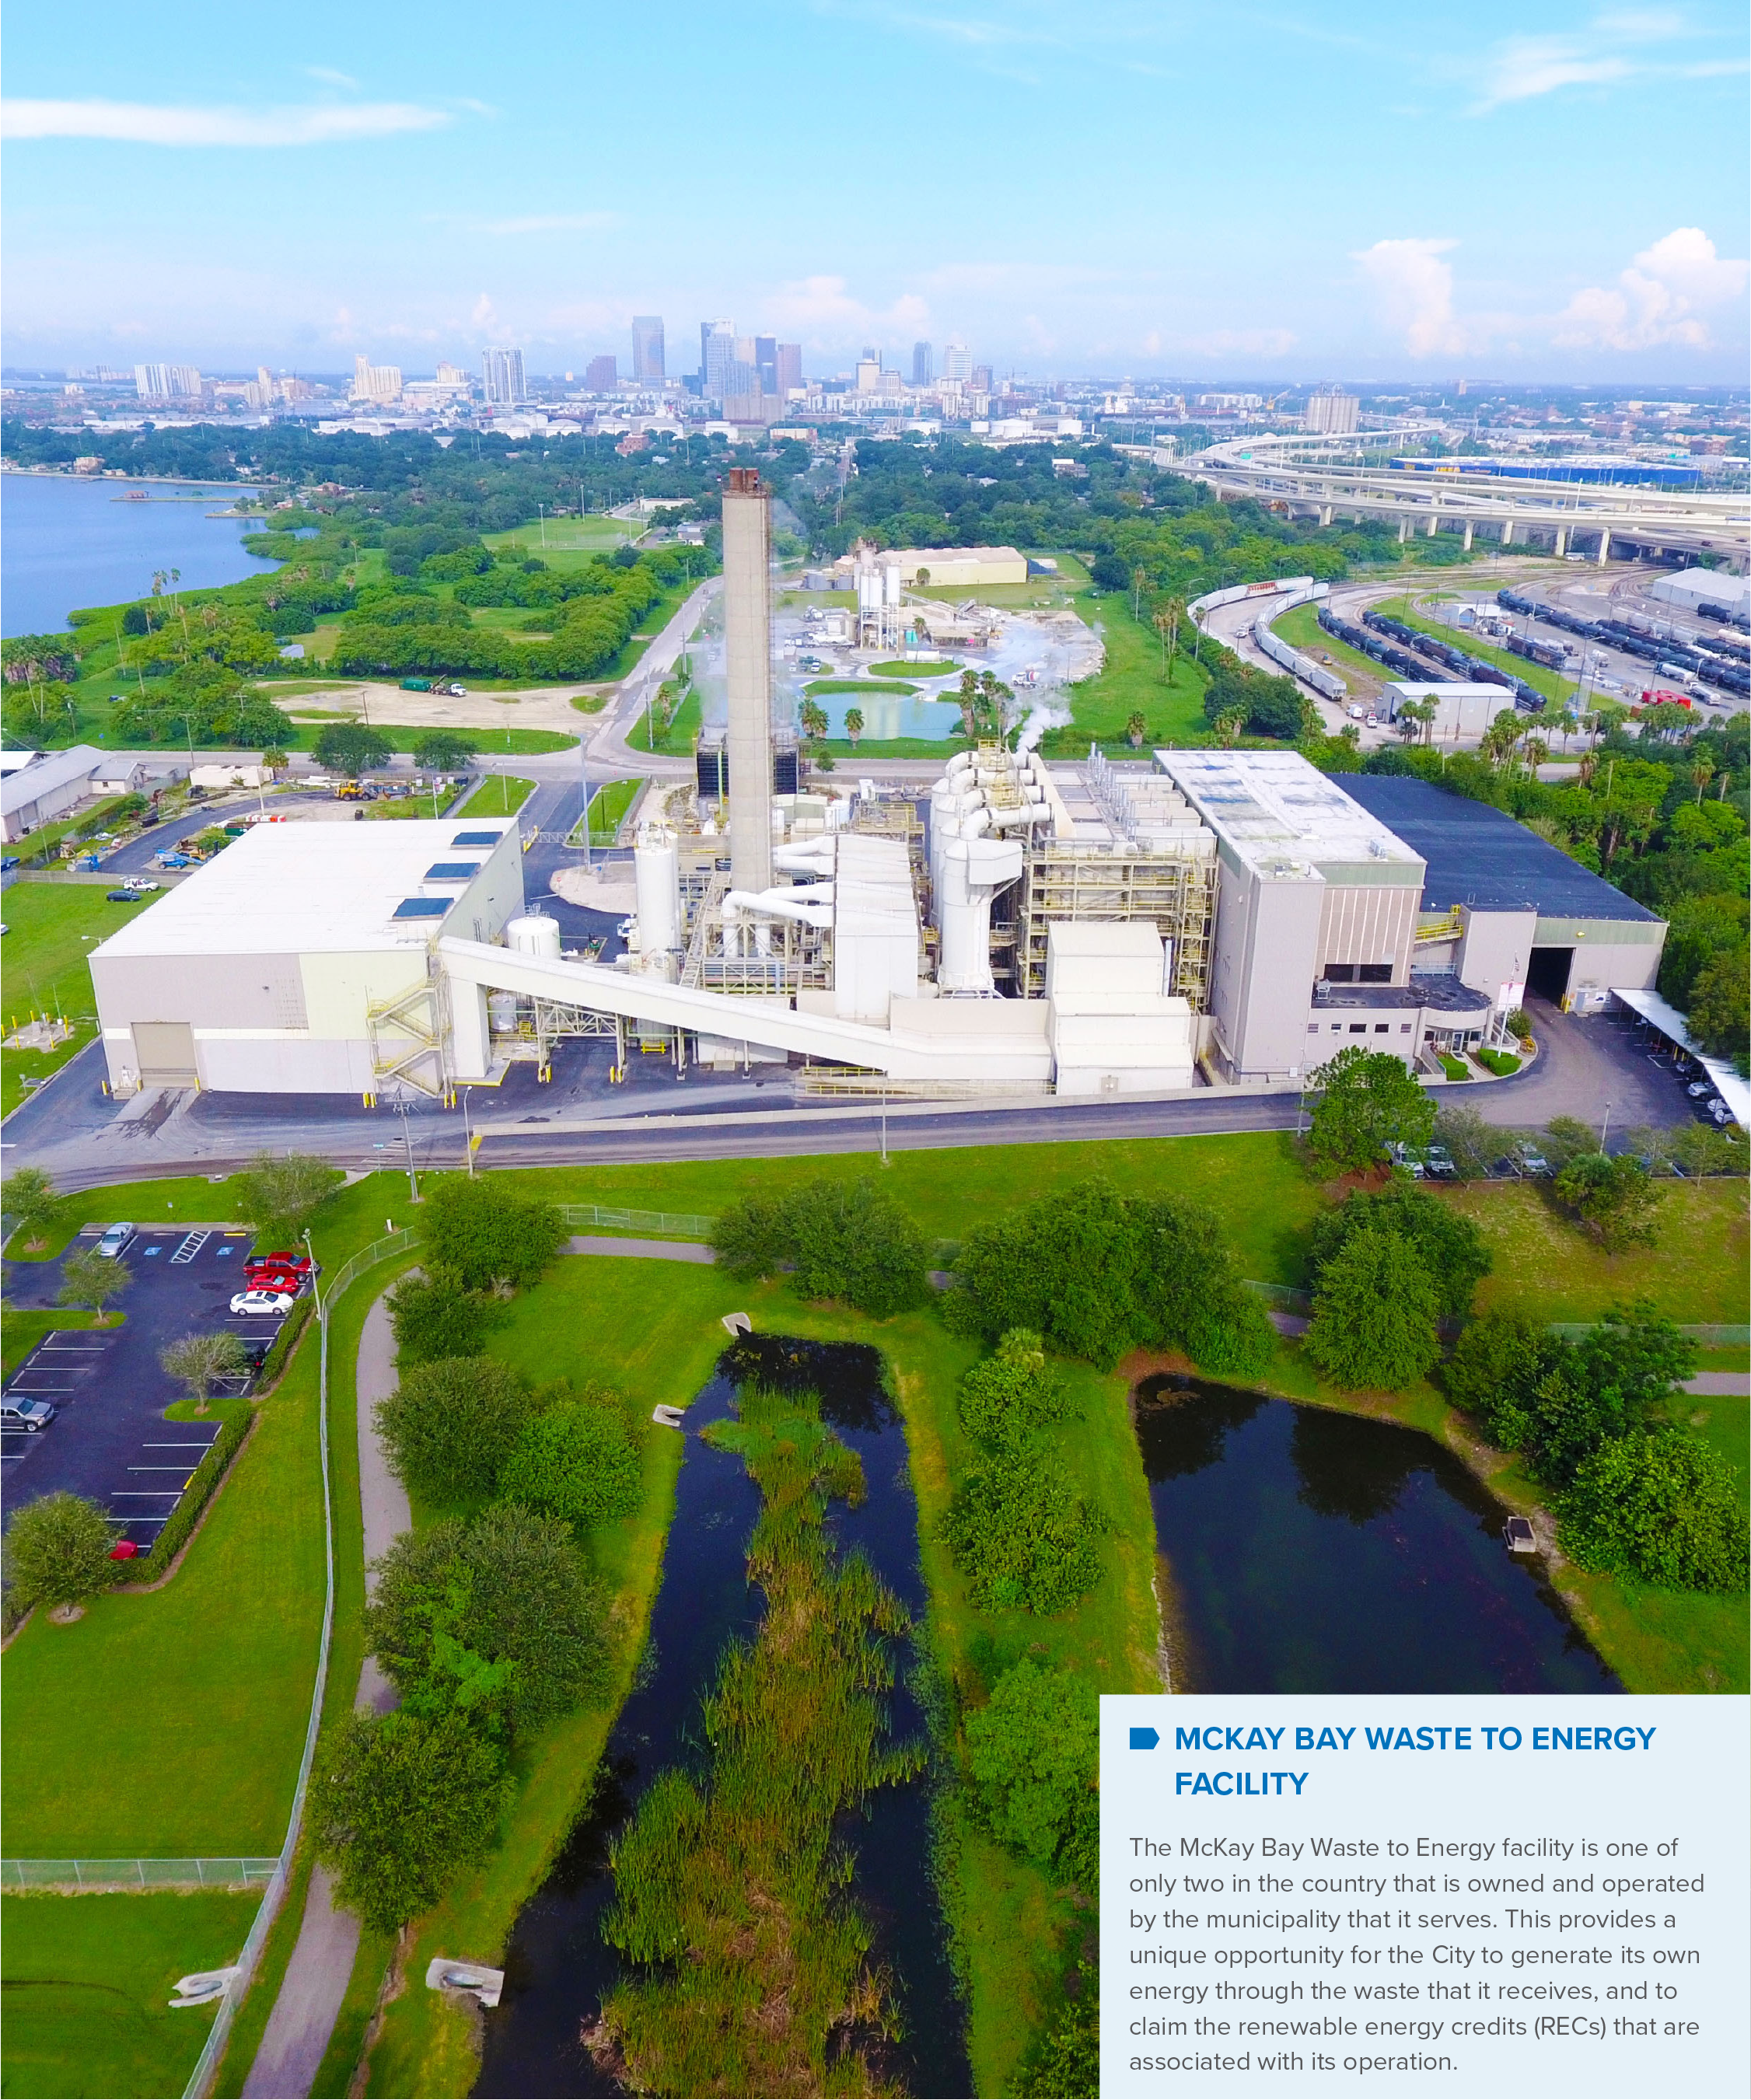













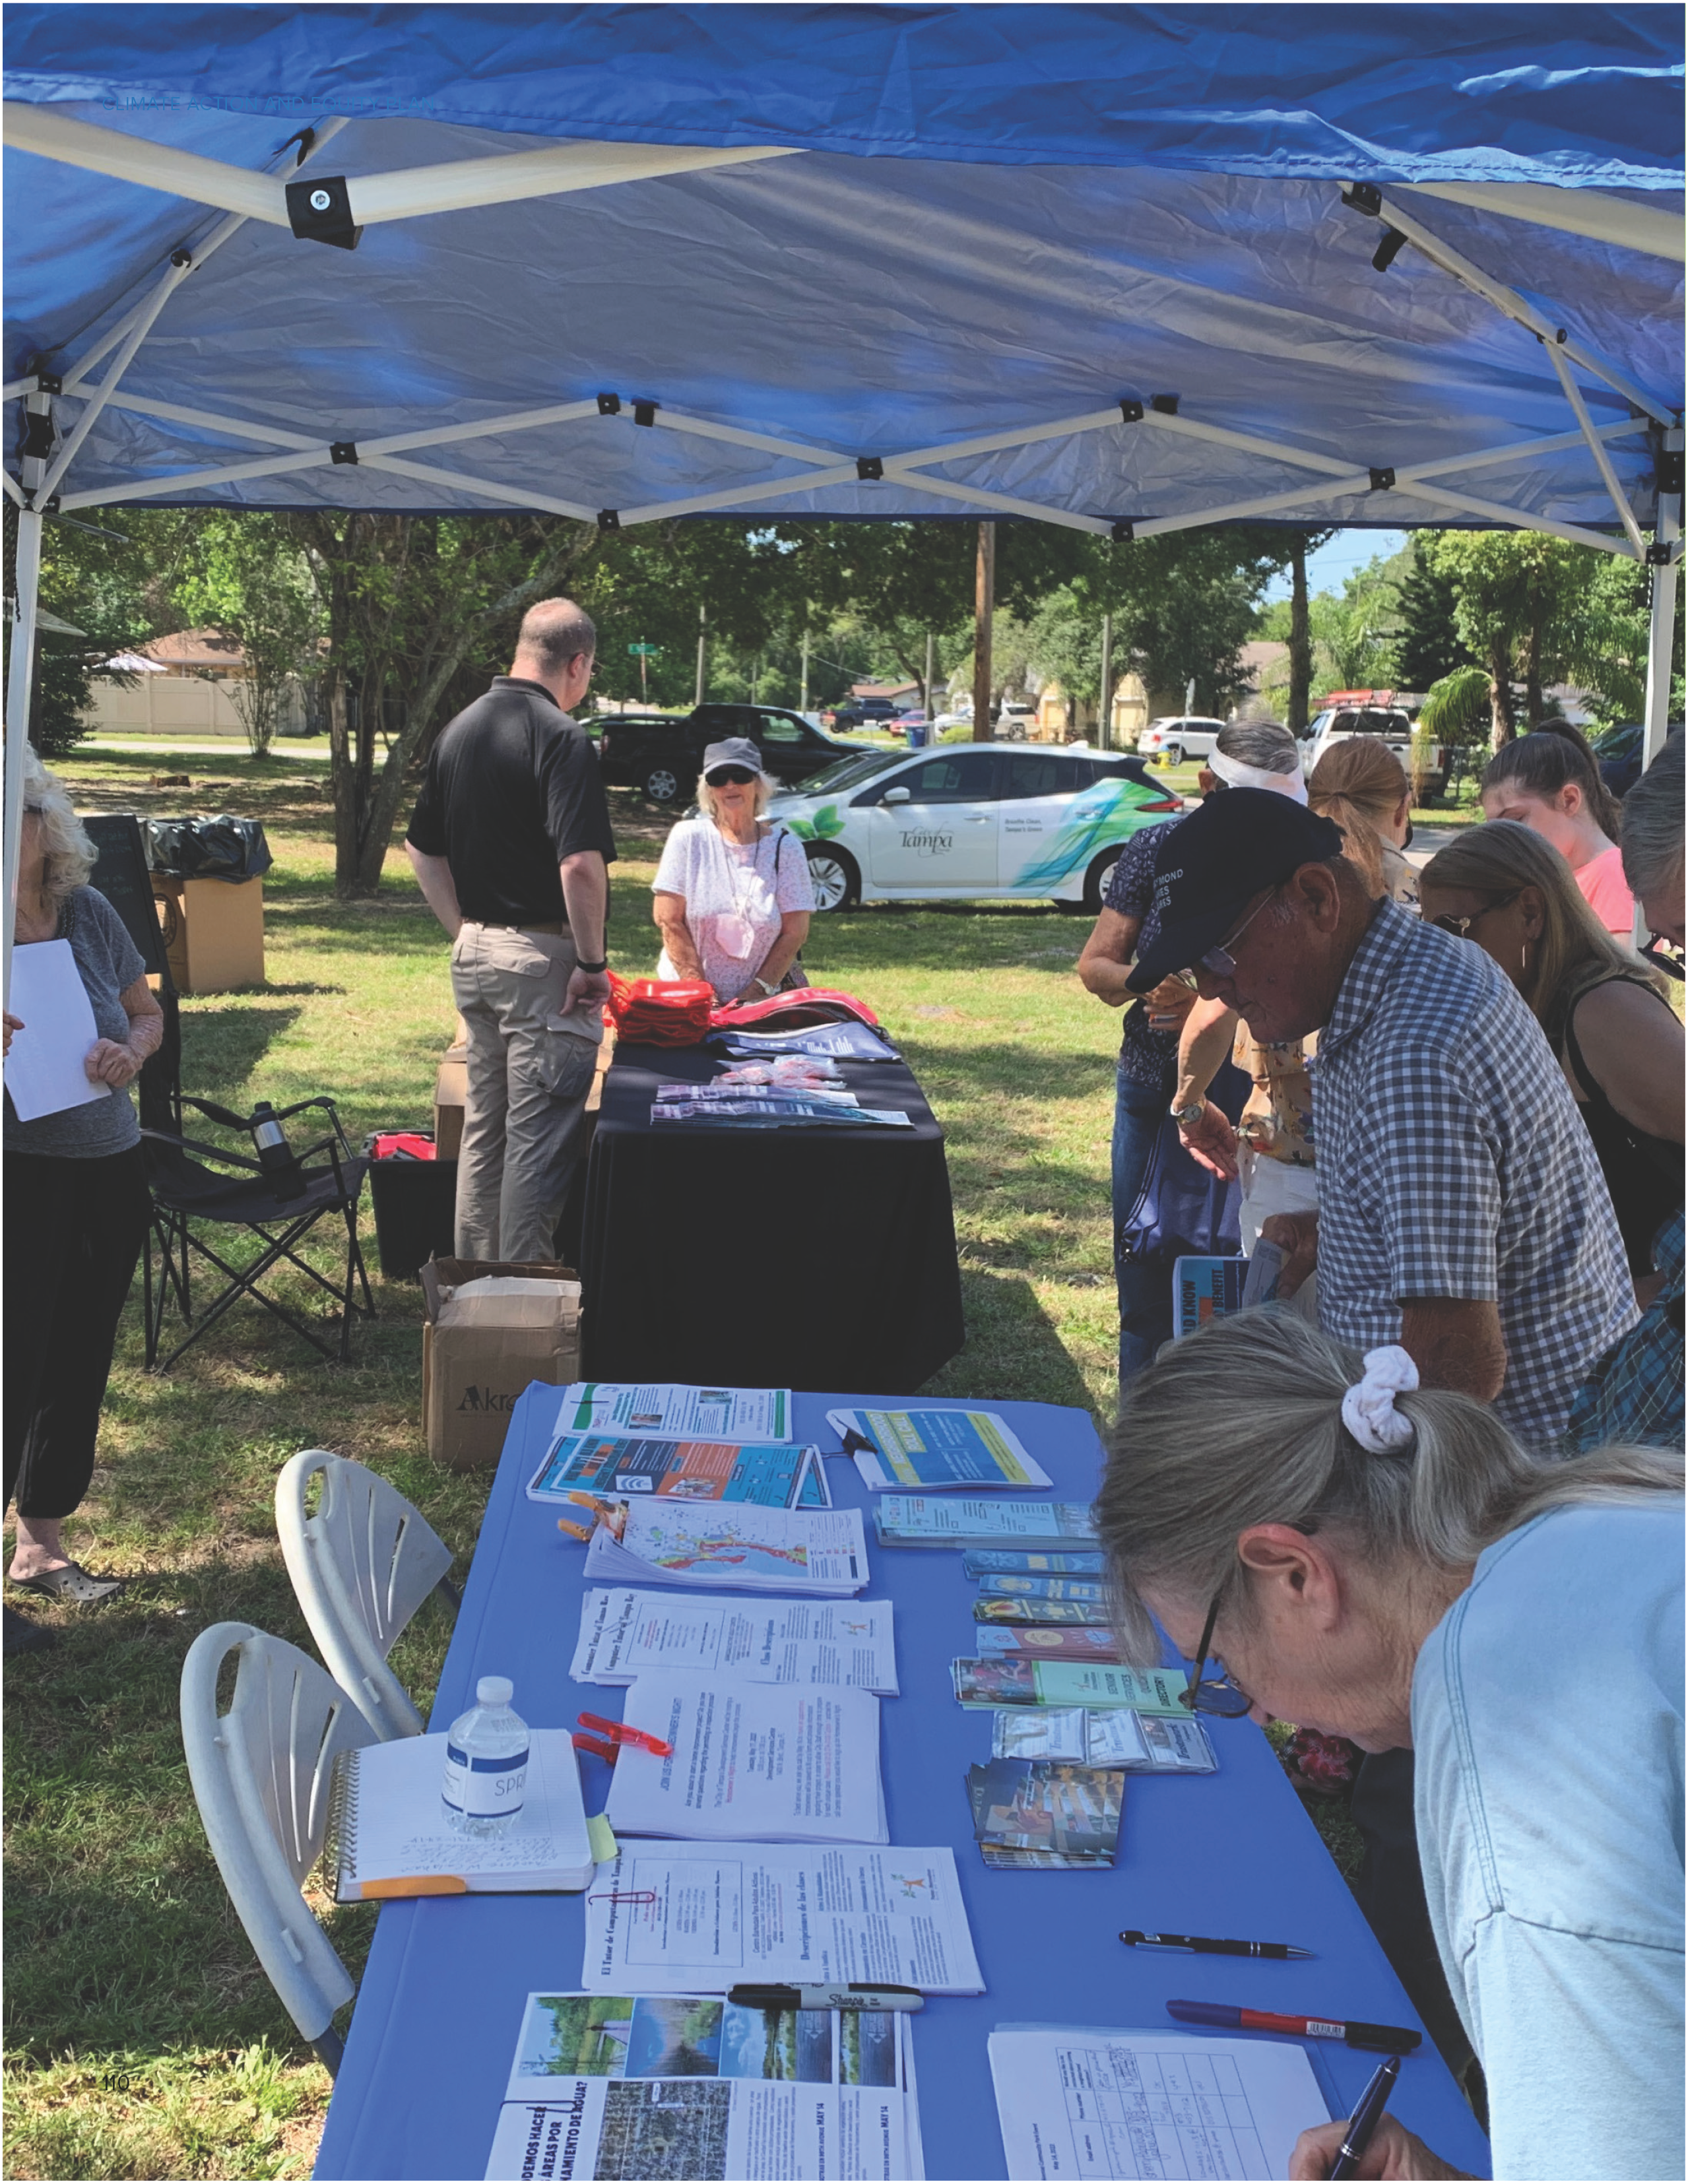






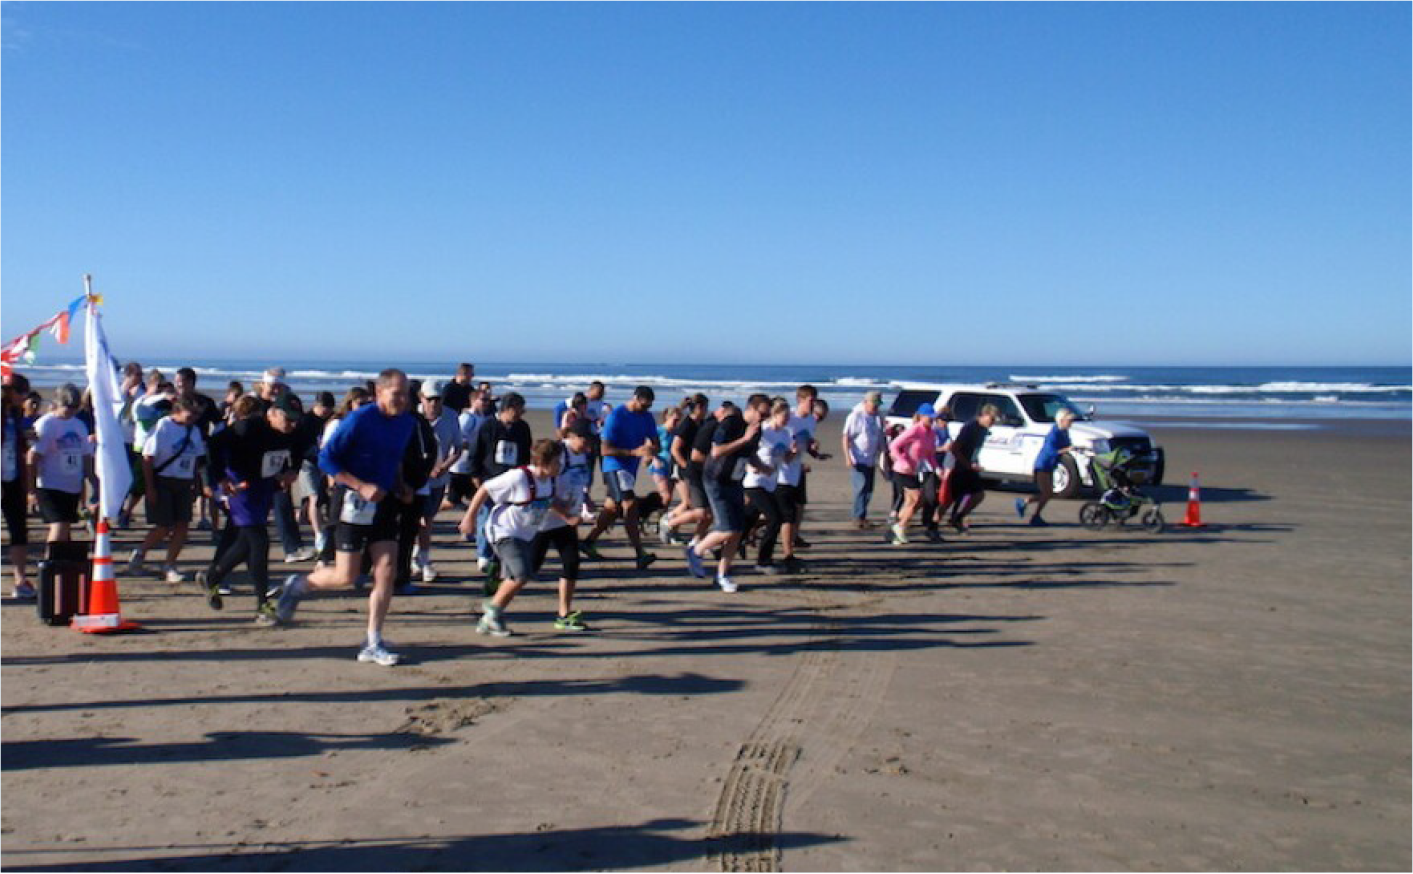



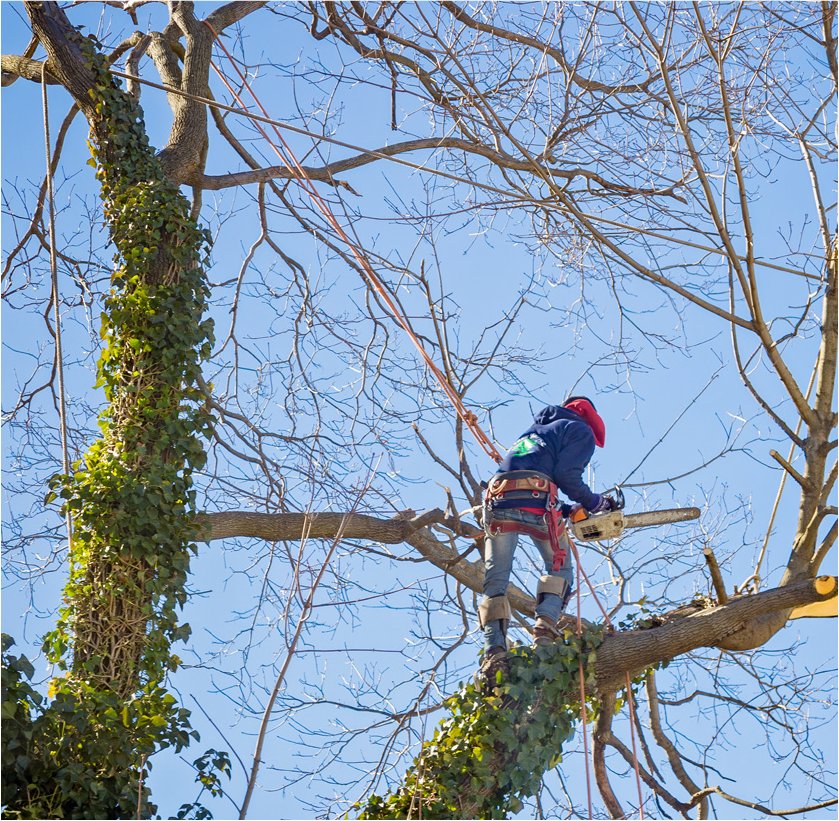

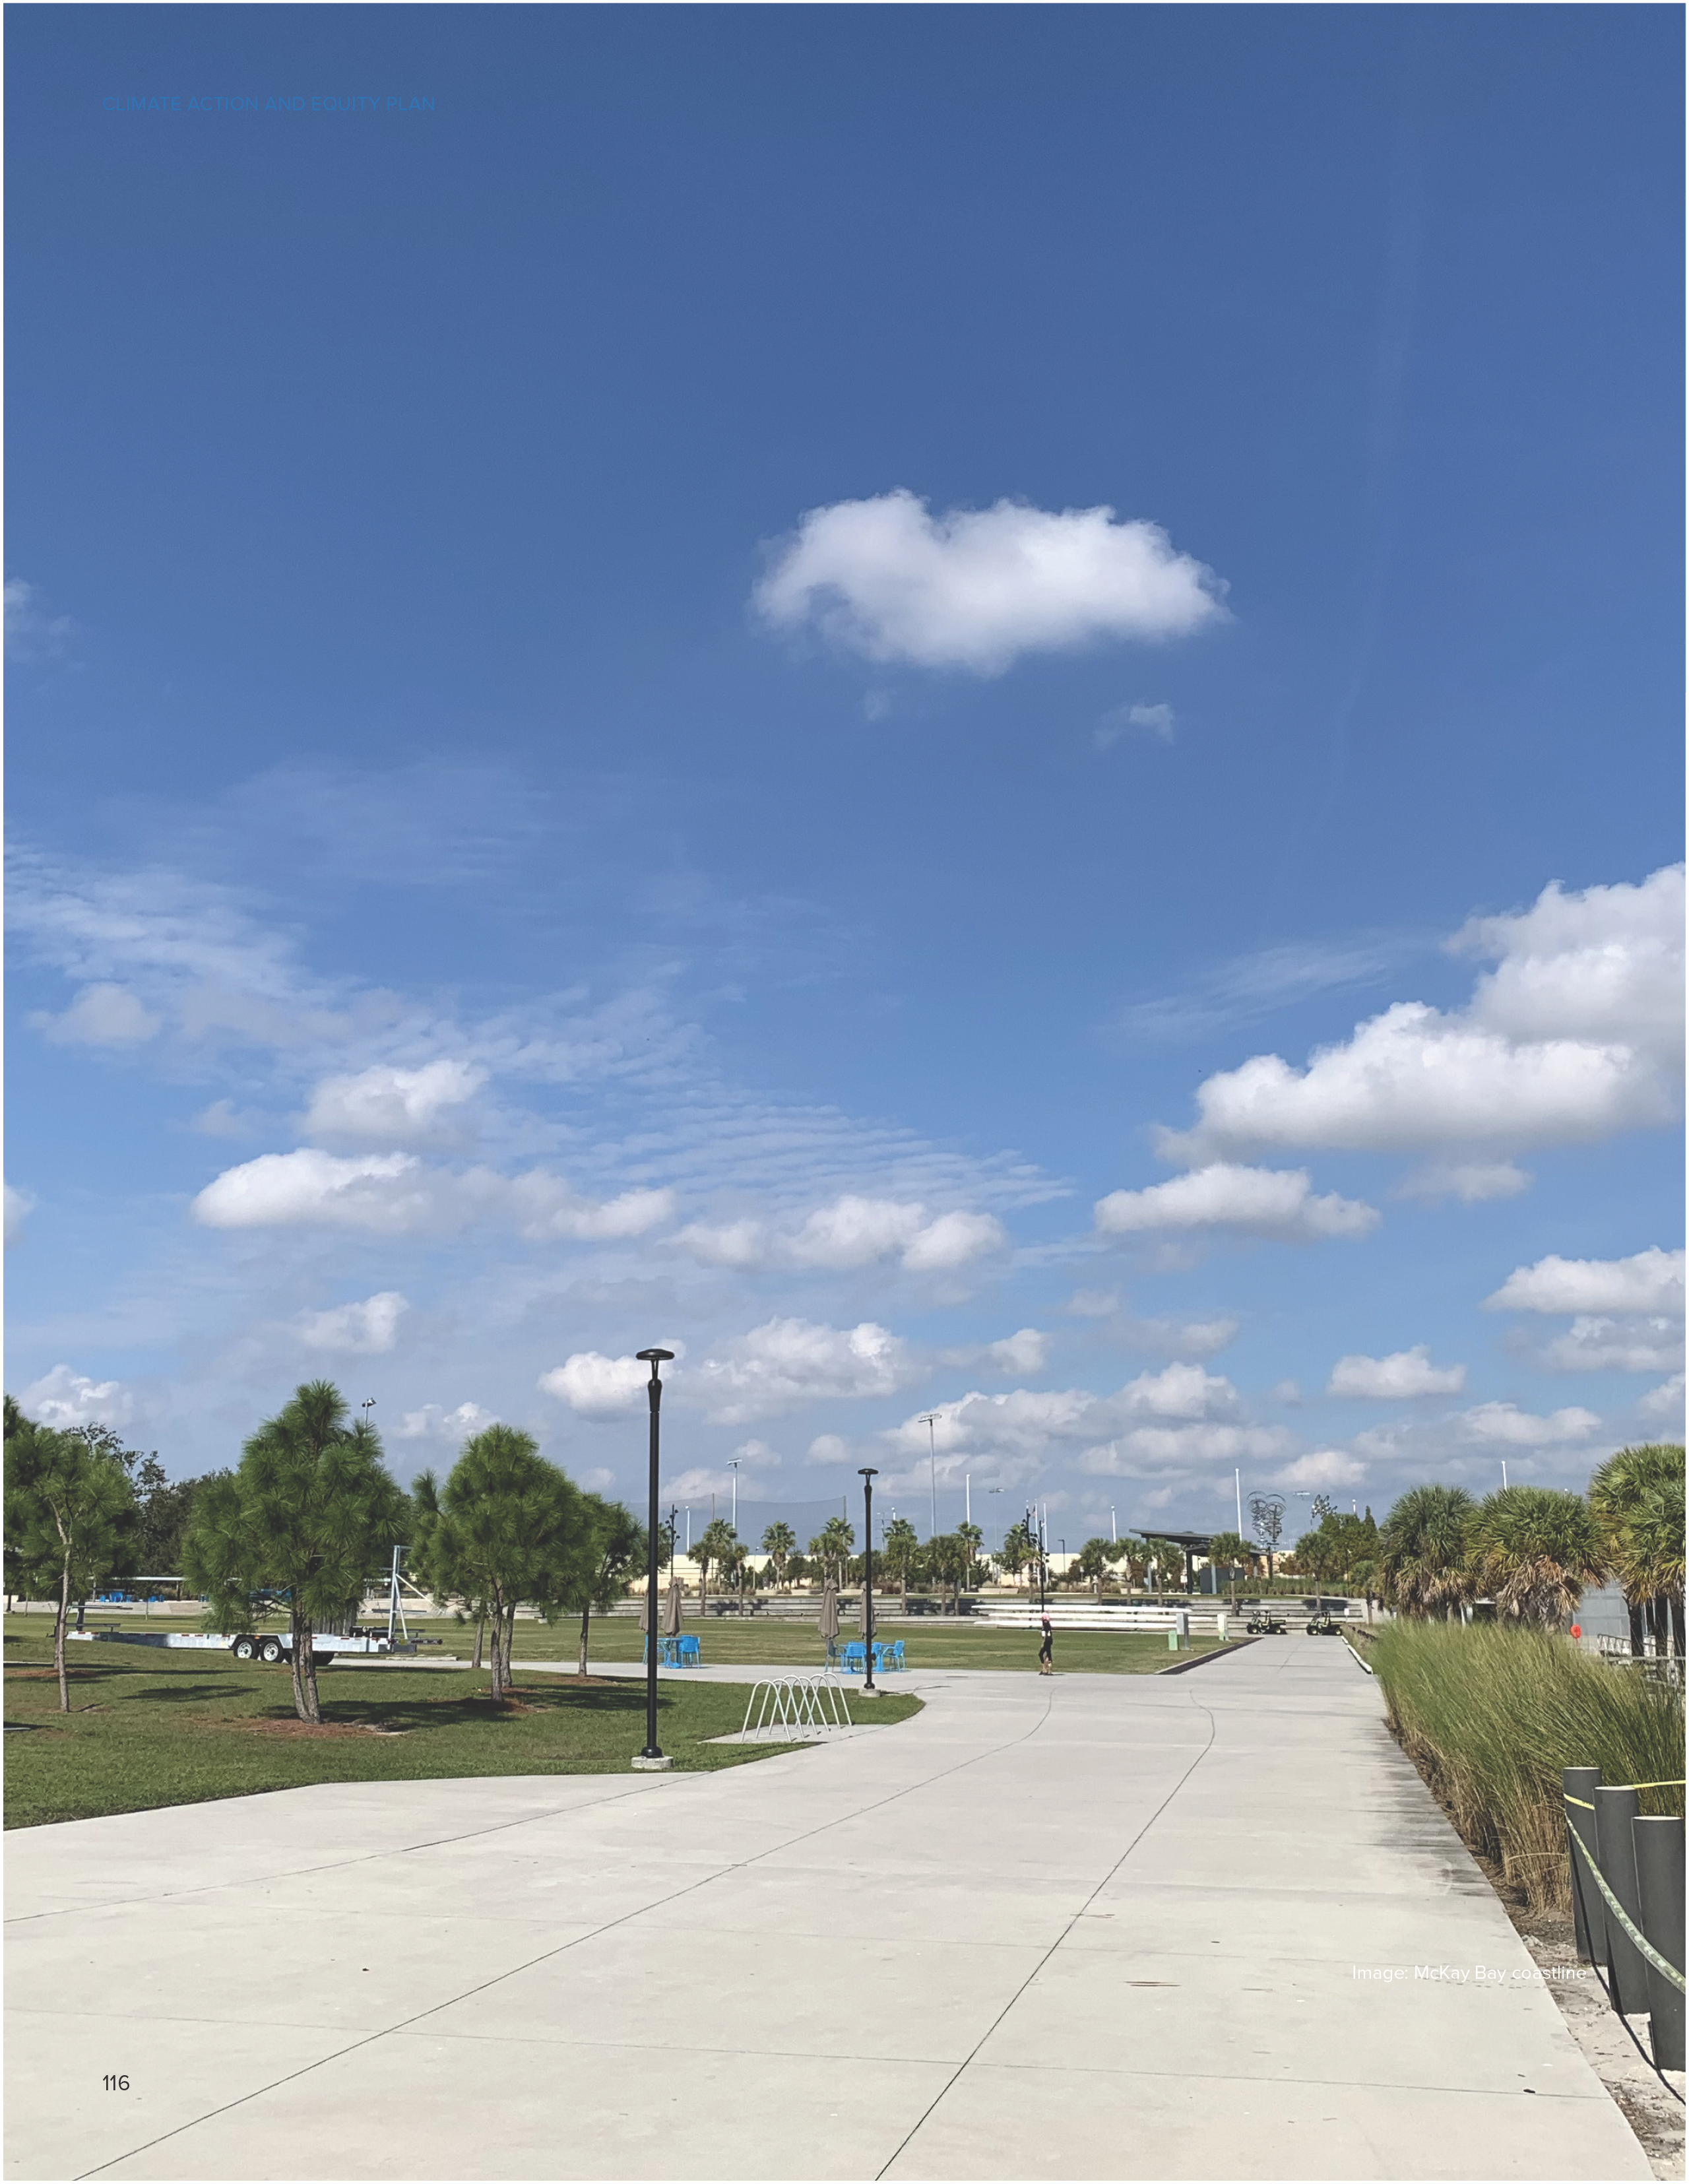
 ENV
ENV


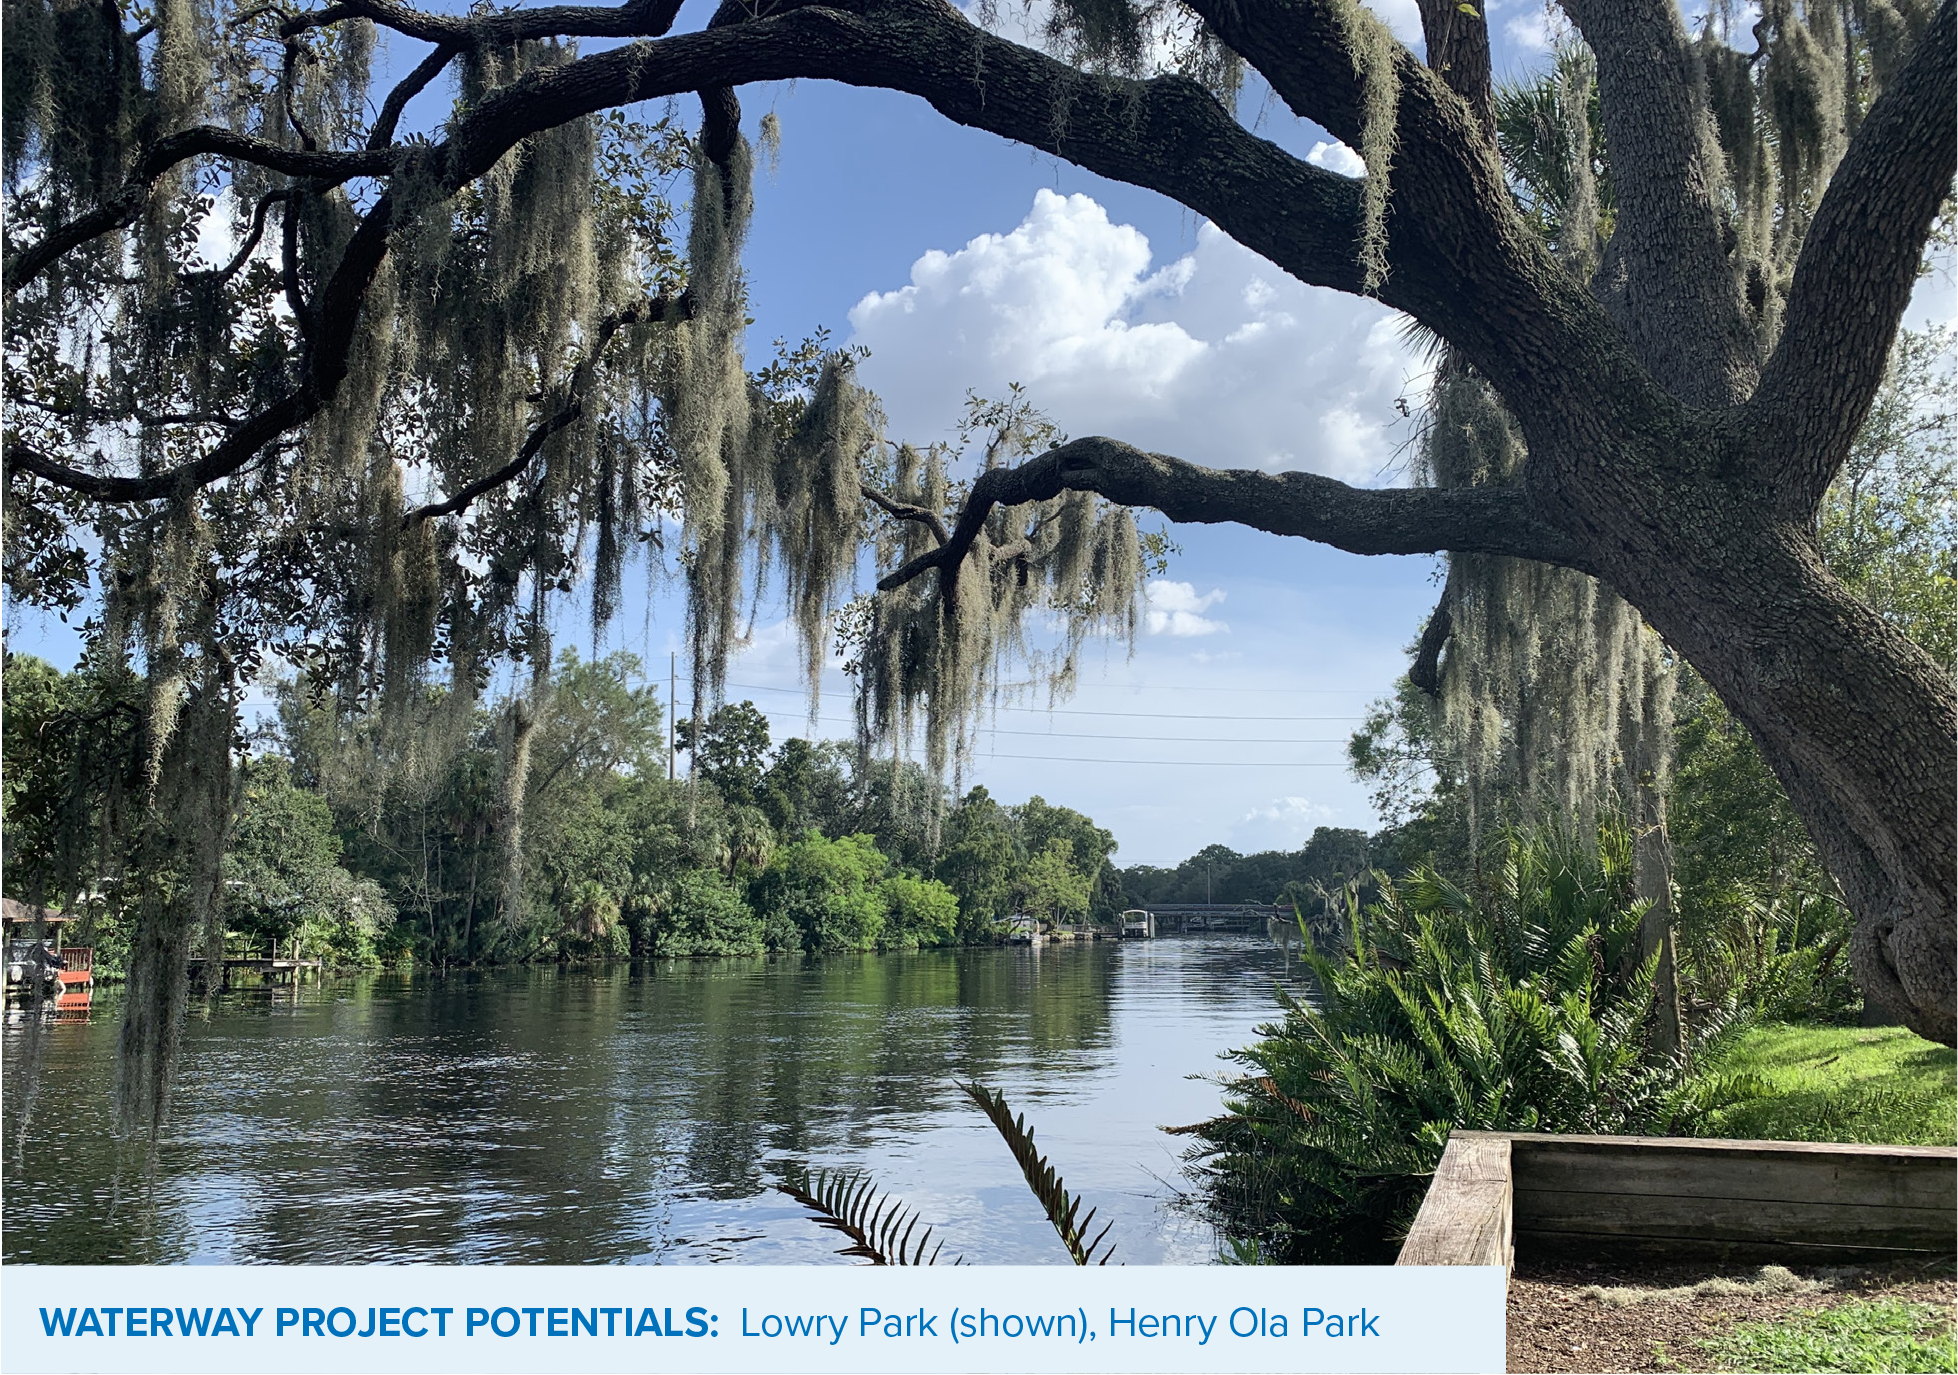














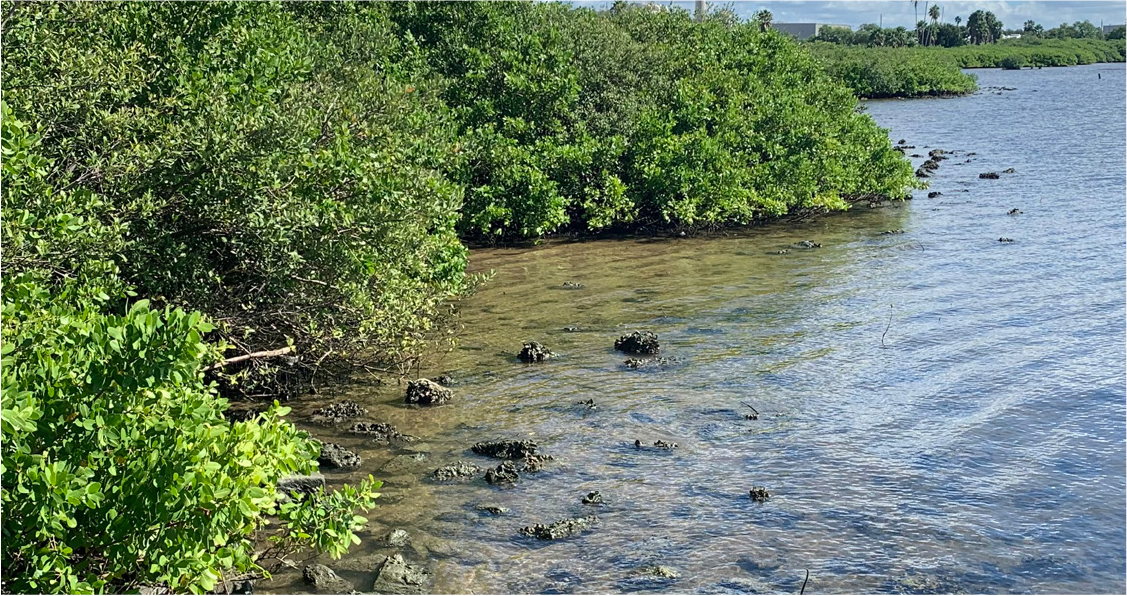


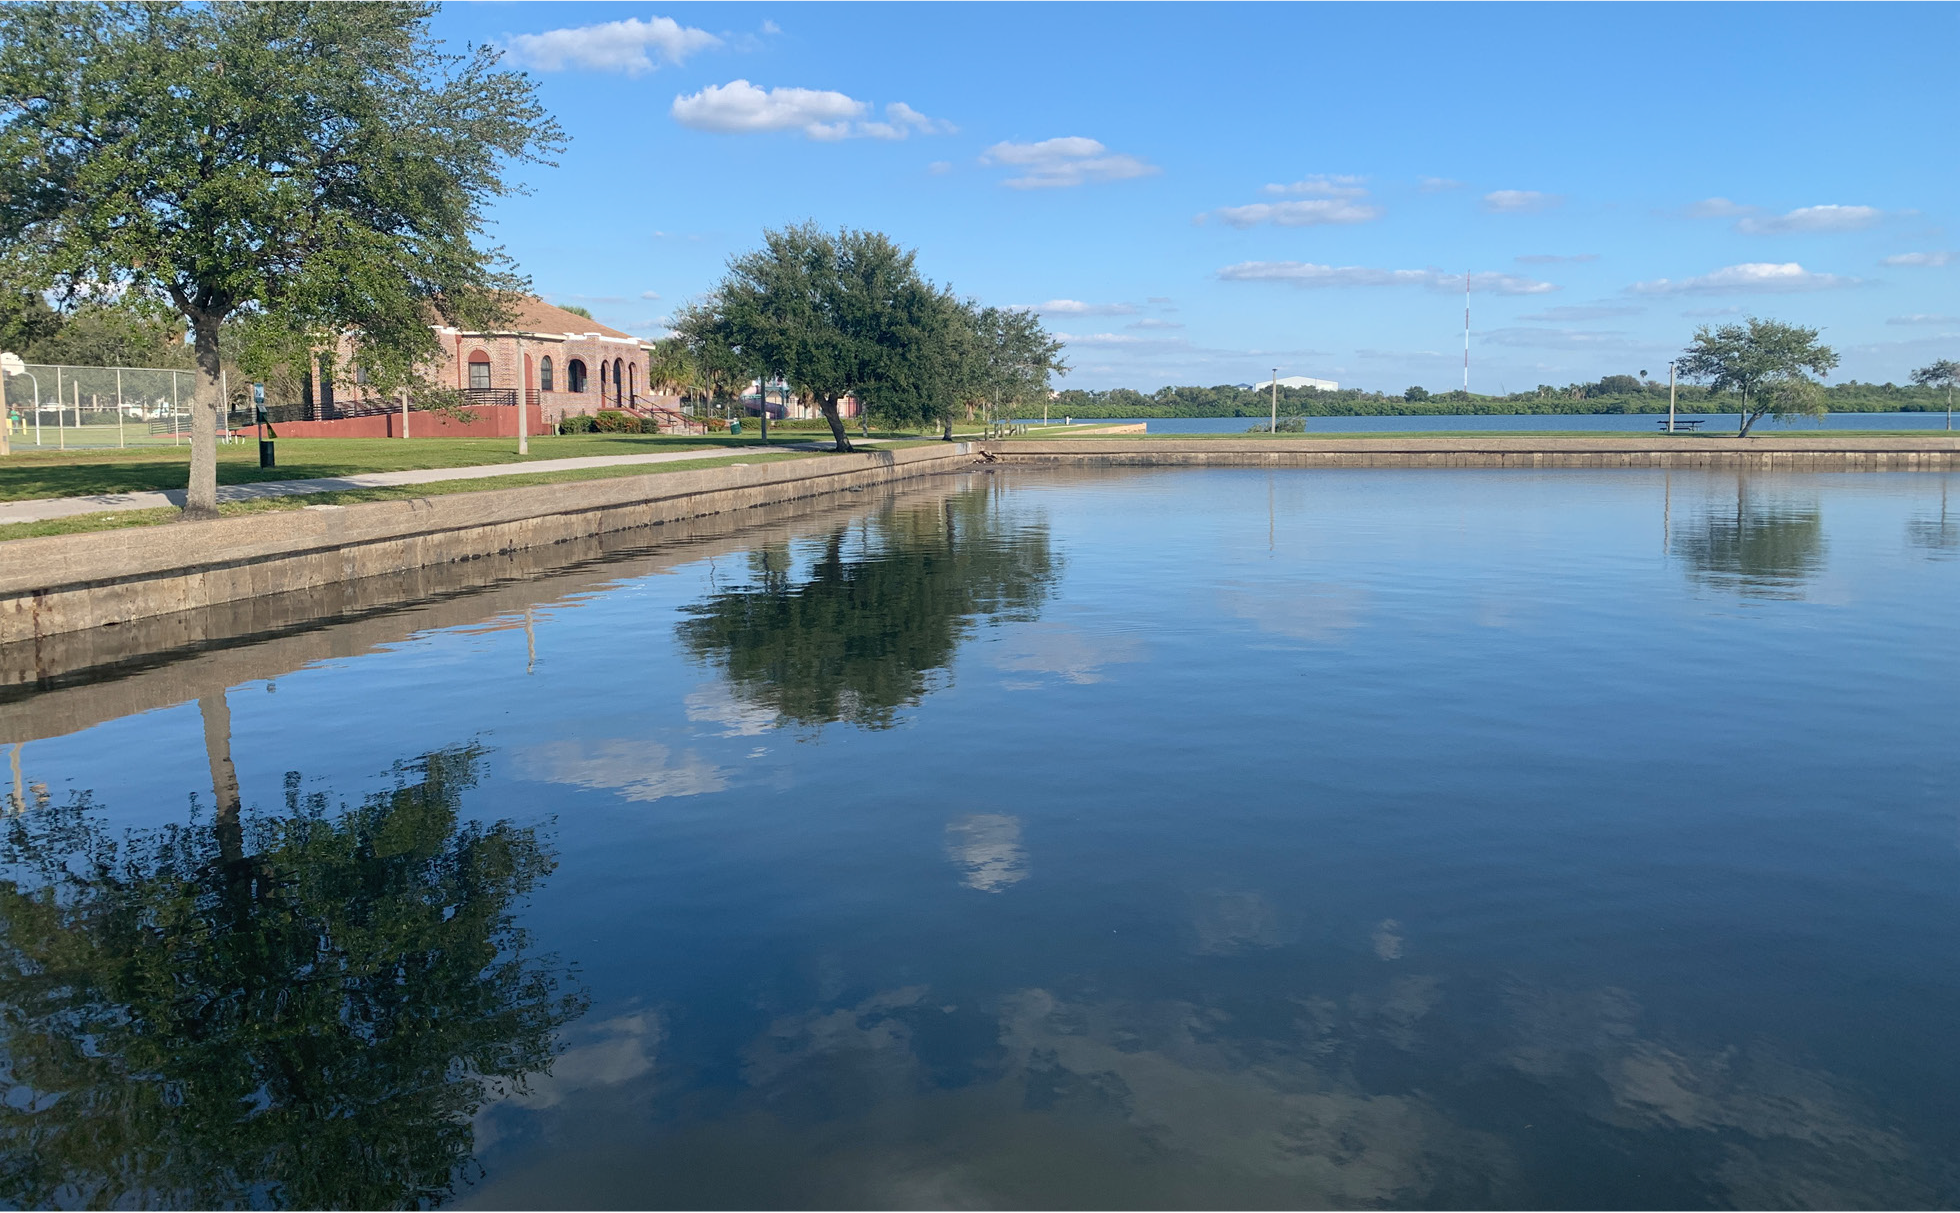
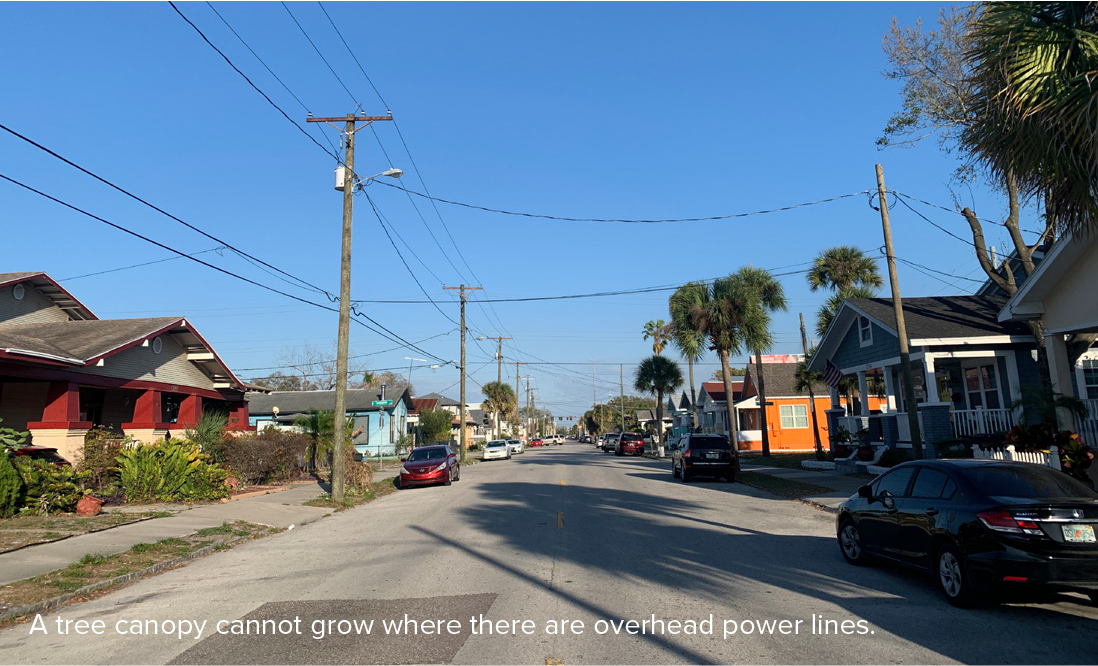
















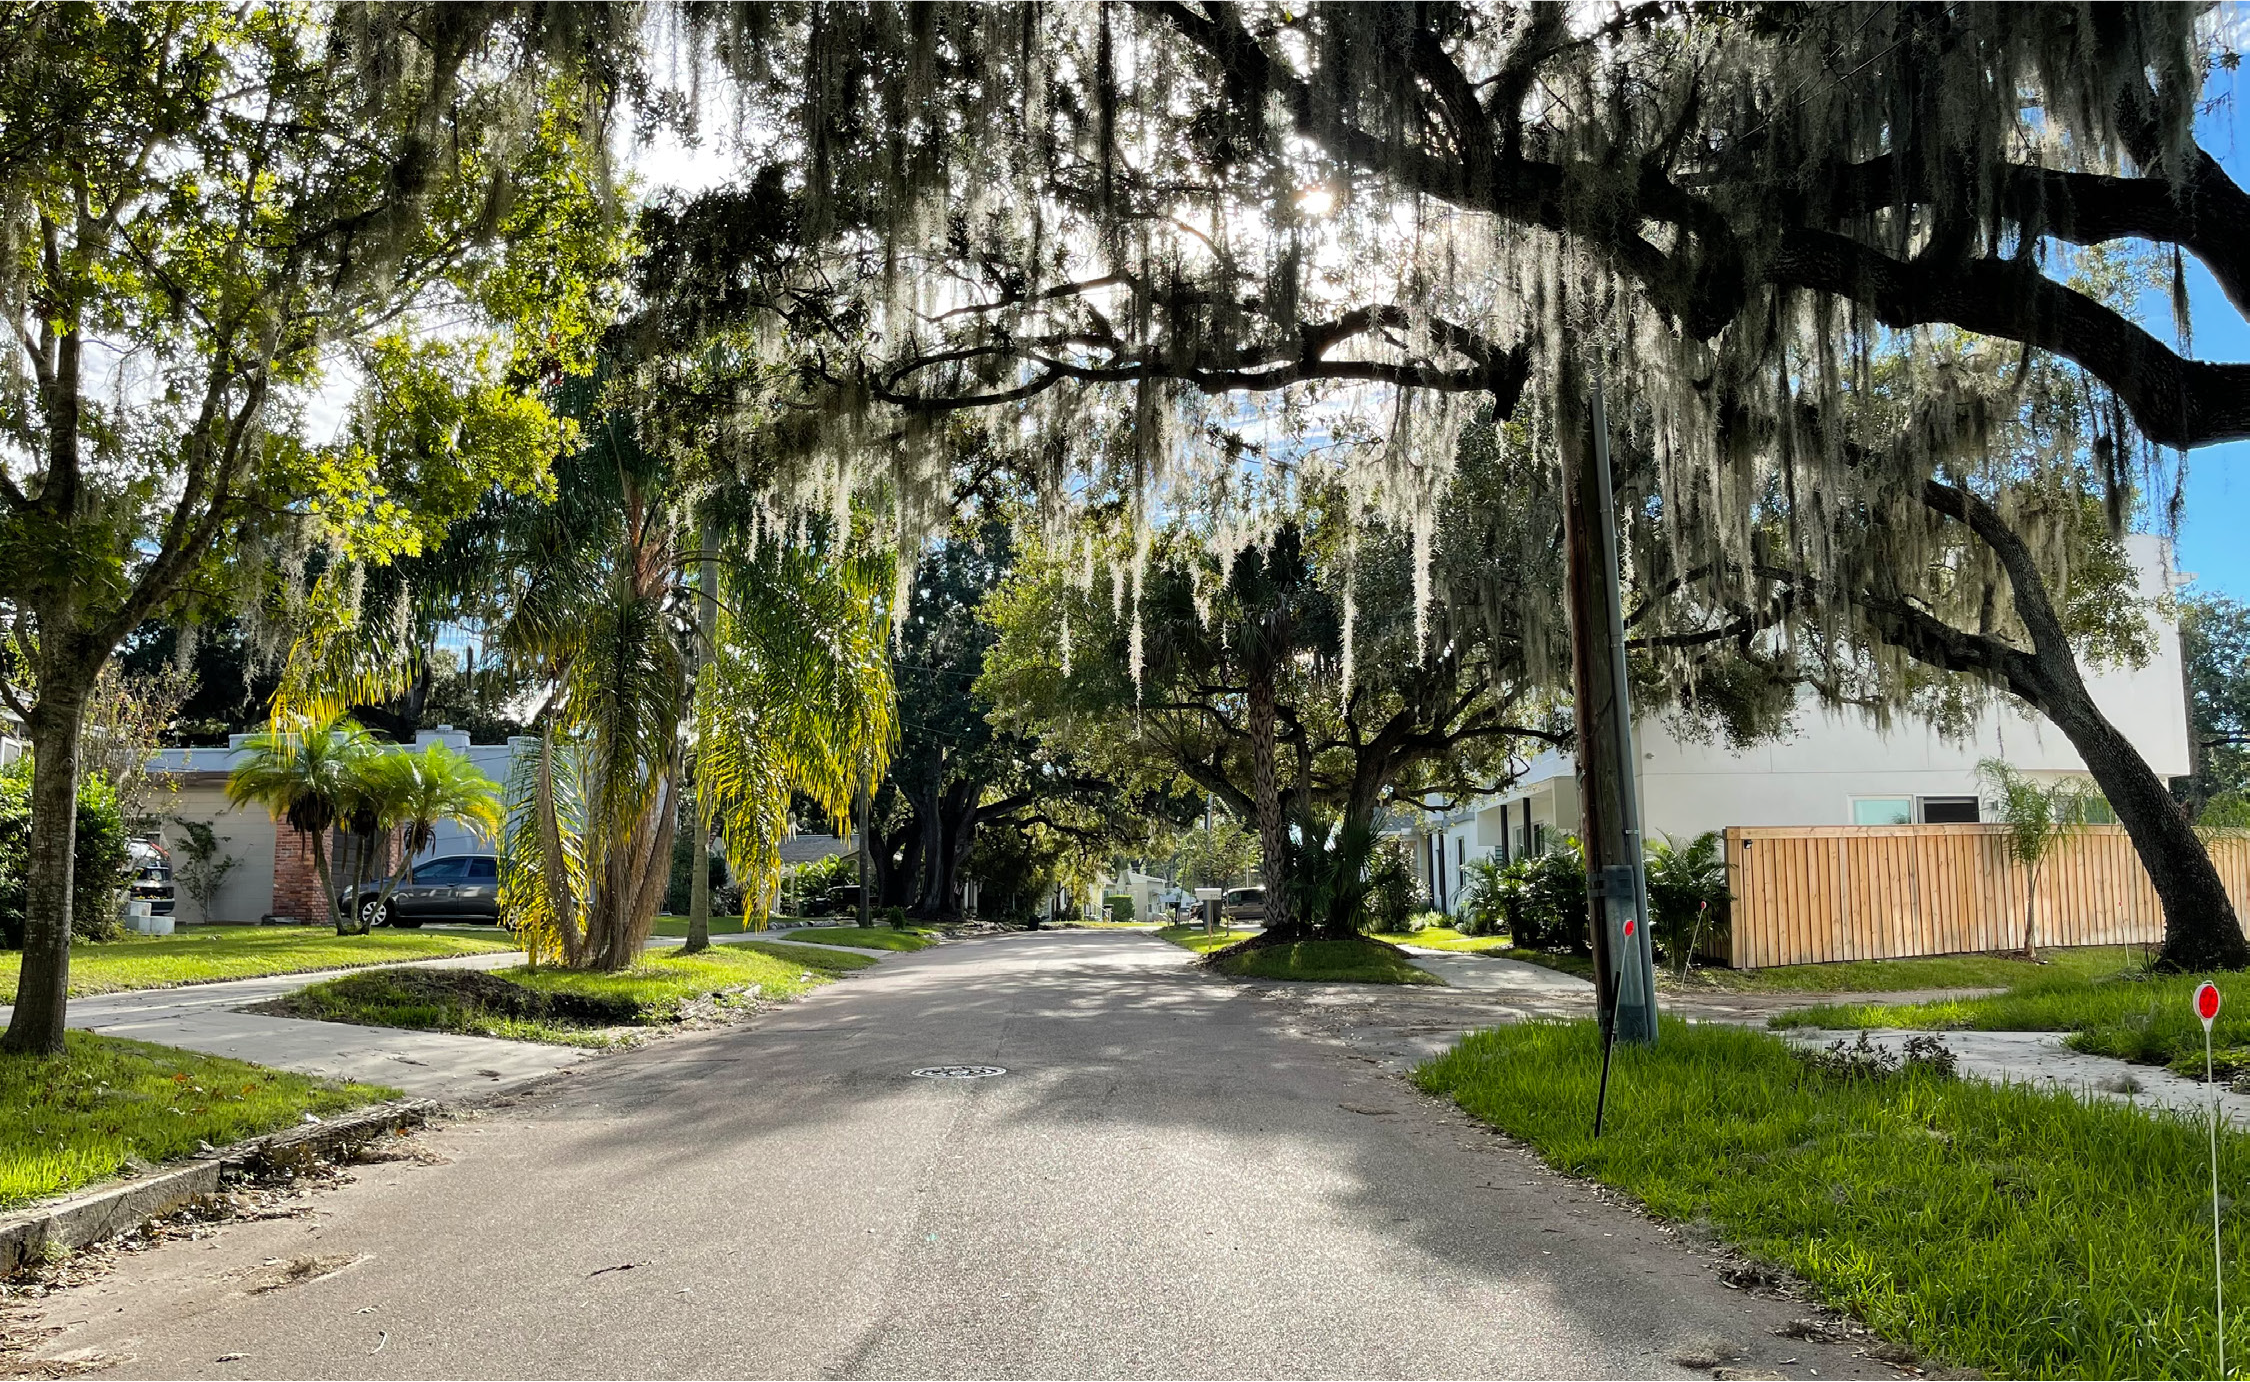







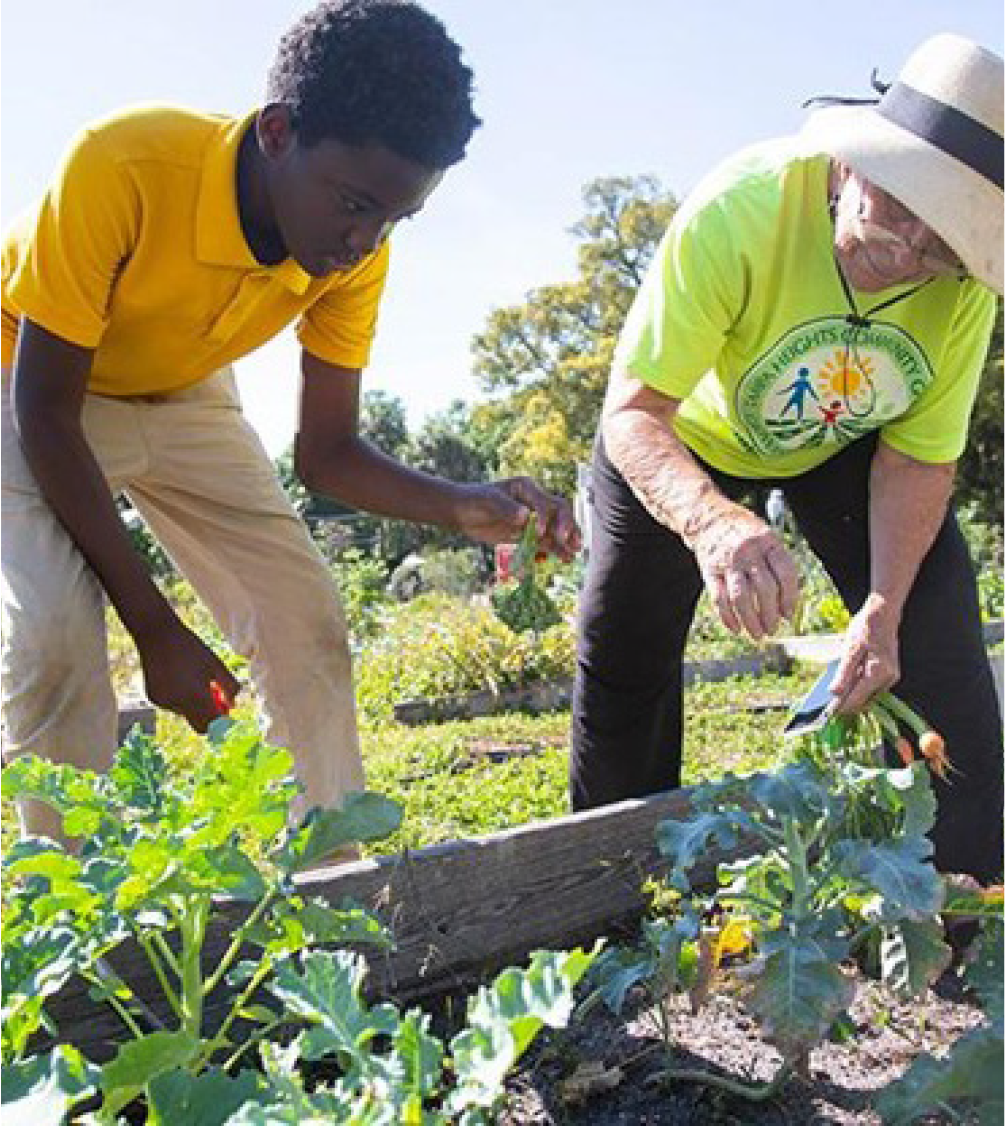



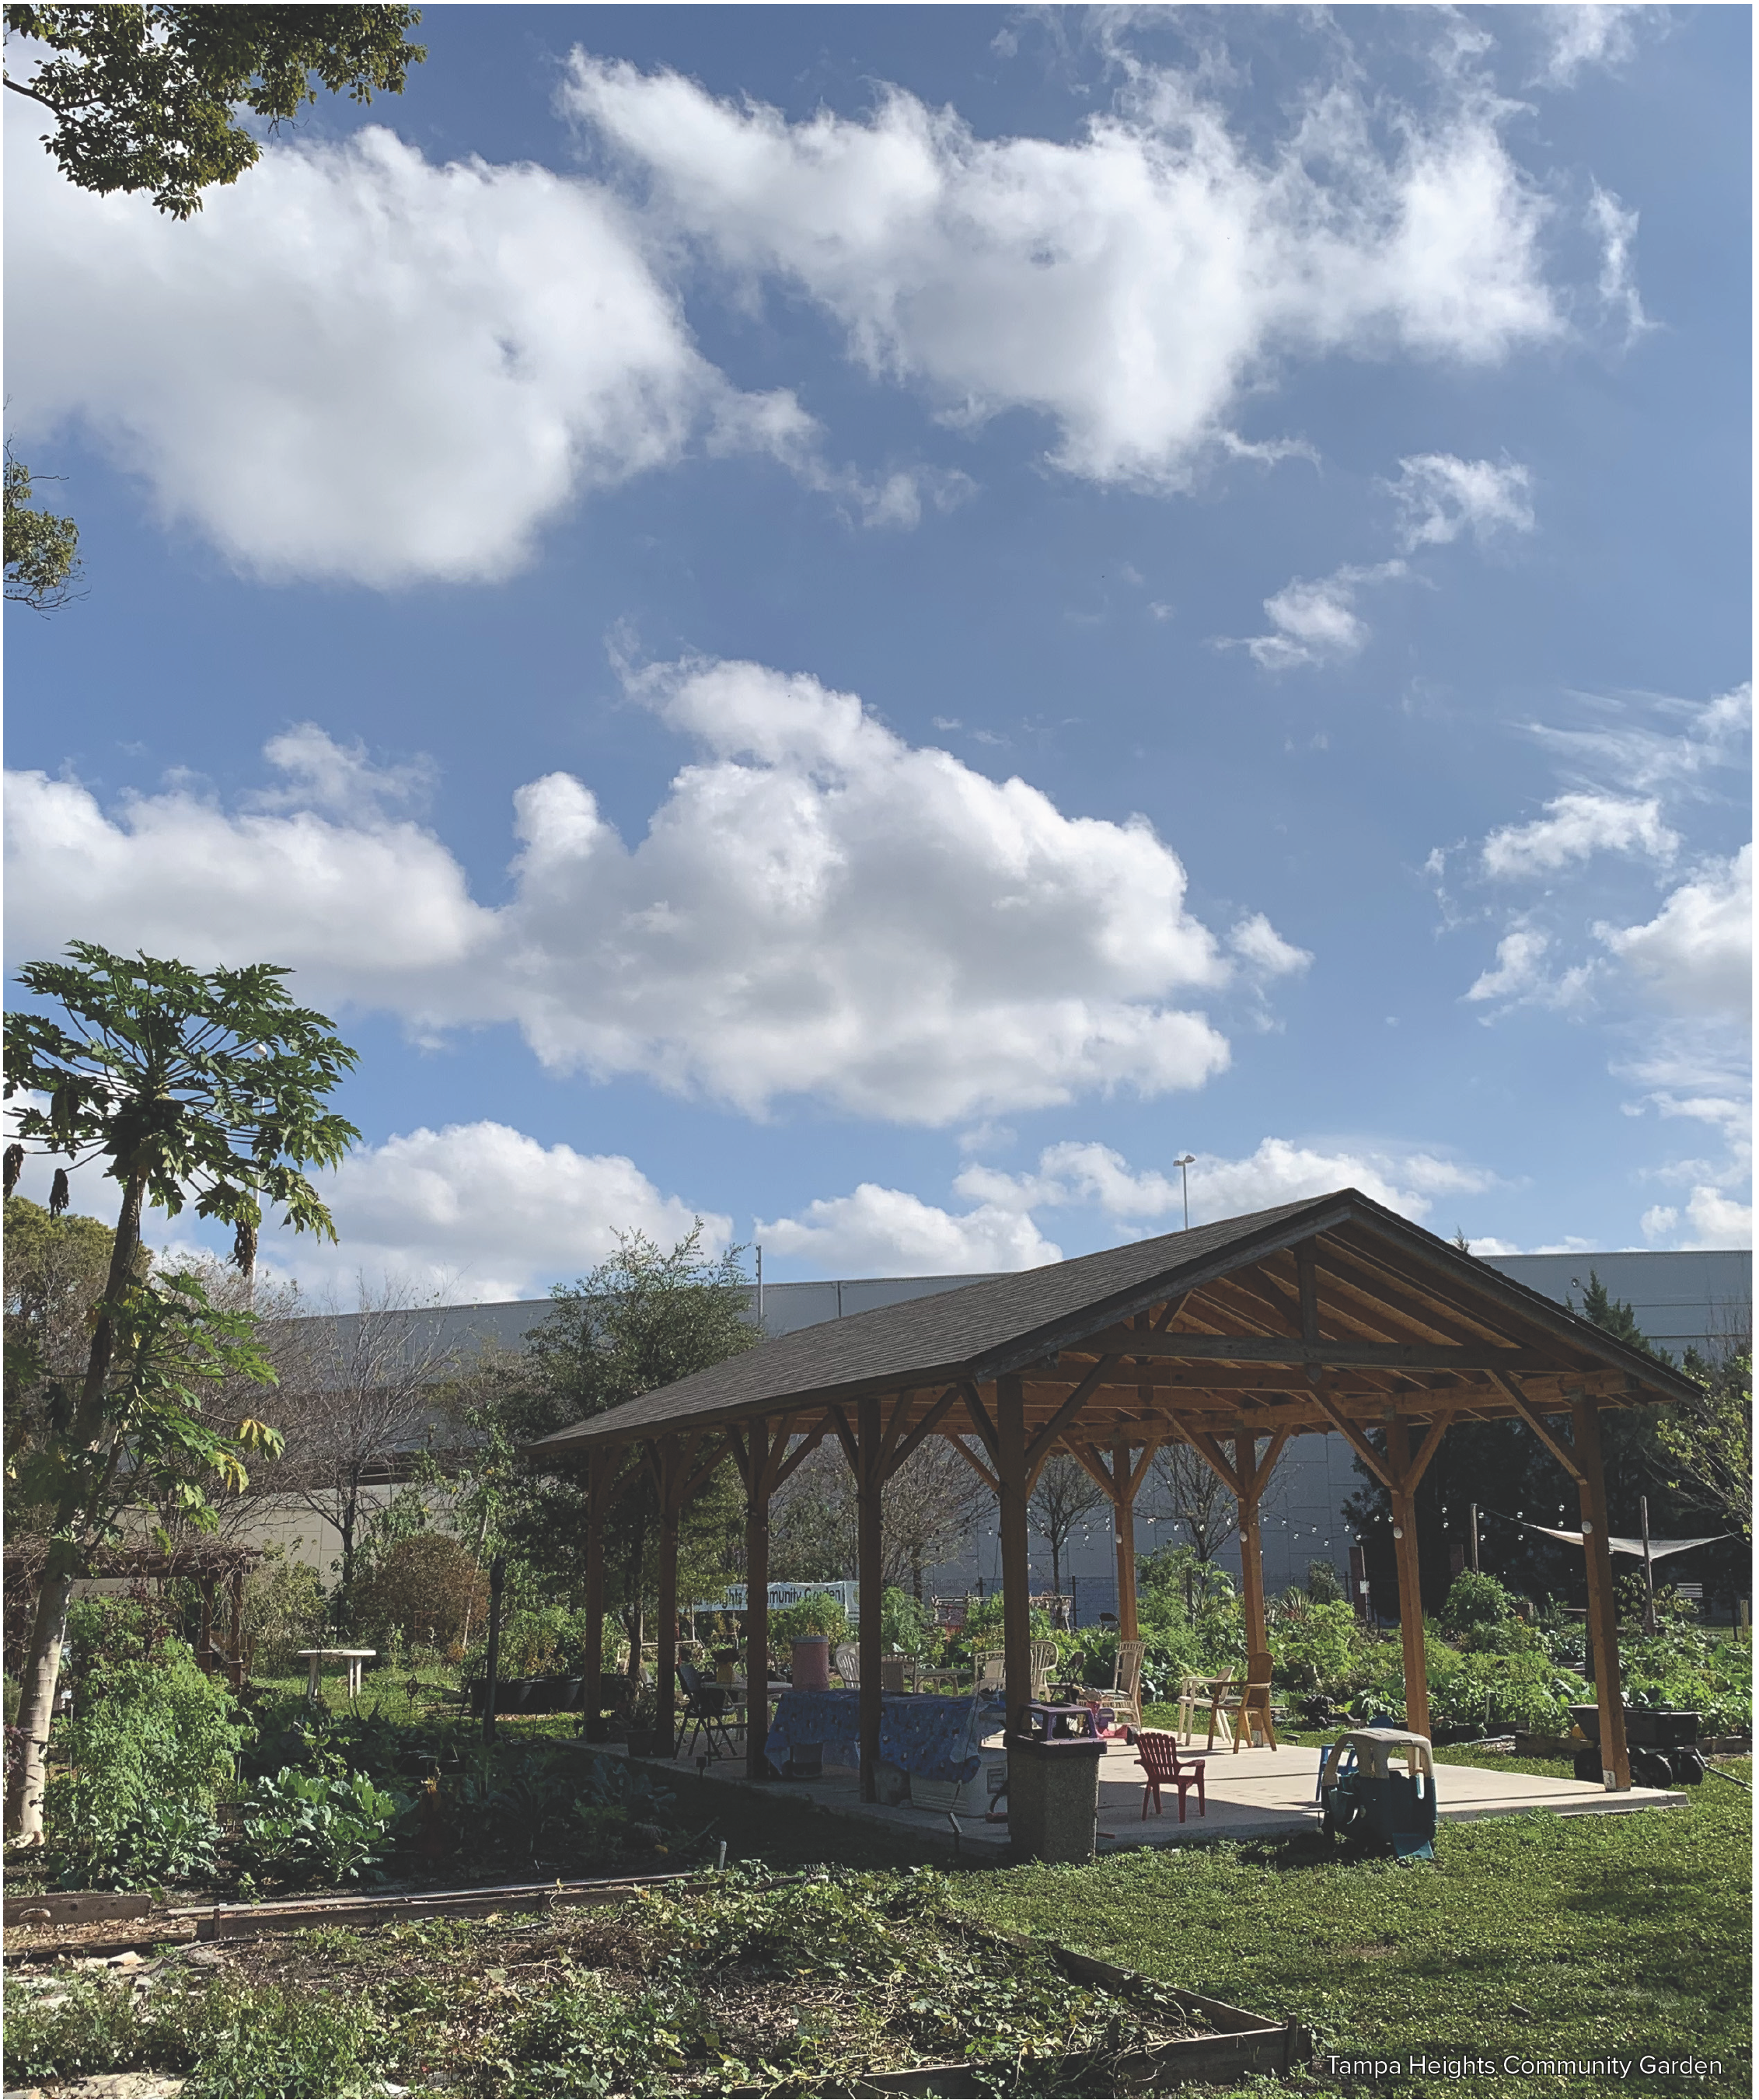



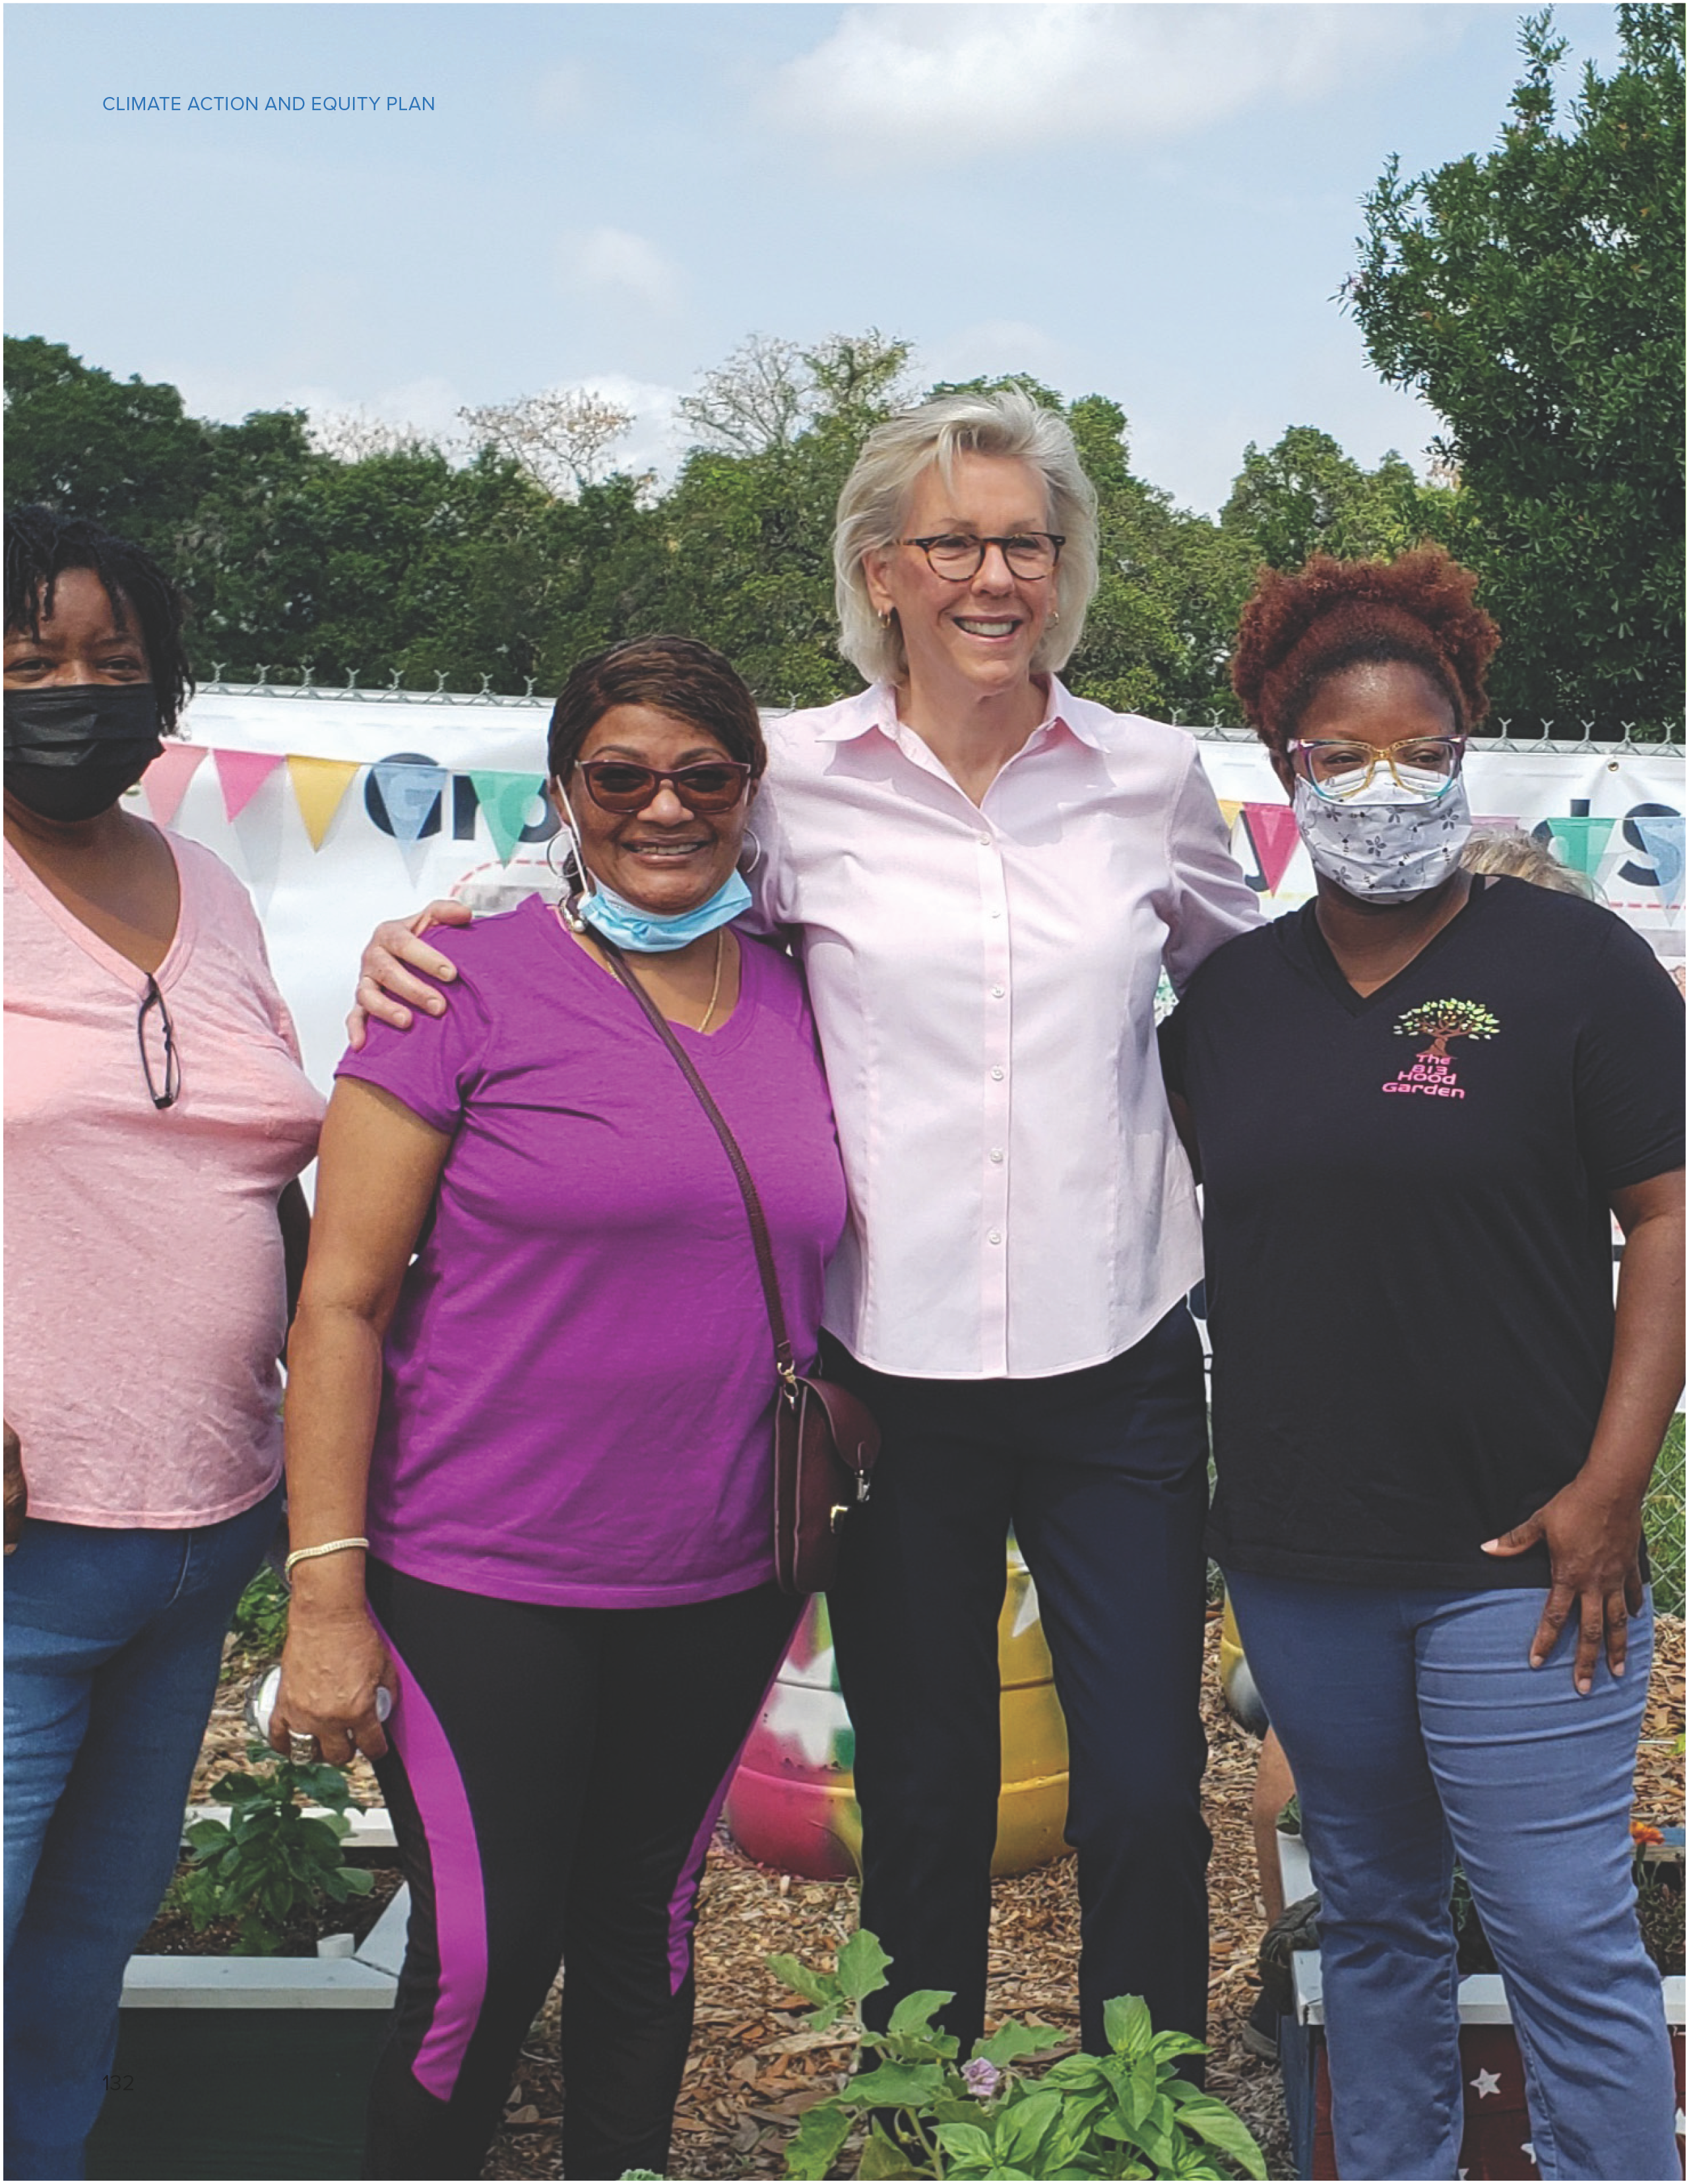









 MITIGATE ADAPT POLICY