
DISCLAIMER: This work was funded in part through a grant agreement from the Florida Department of Environmental Protections Office of Resilience and Coastal Protection Resilient Florida Program. The views, statements, findings, conclusions, and recommendations expressed herein are those of the author(s) and do not necessarily reflect the views of the State of Florida or any of its sub agencies.
Agreement# 22PLN78
TABLE OF CONTENTS
- EXECUTIVE SUMMARY 7
- INTRODUCTION 13
- SEA LEVEL RISE 16
- McKay Bay / Palmetto Beach 20
- Upper Bayshore Boulevard and Davis Islands 22
- Bayshore Beautiful Neighborhood 28
- Port Tampa City and the Tappan Tract 30
- Sunset Park 32
- Beach Park 34
- Courtney Campbell and Rocky Point 36
- RAINFALL 38
- University Square 38
- Forest Hills 38
- East Tampa 38
- South Tampa Peninsula: Culbreath Bayou / Sunset Park / Palma
- Ceia Pines / Golfview / Bay View Avenue 39
- Palmetto Beach and The Port Tampa Bay Entrance 41
- Tampa Palms 41
- STORM SURGE 43
- ASSESSING VULNERABILITIES 45
- STORMWATER SYSTEMS 55
- TRANSPORTATION 61
- PUBLIC TRANSPORTATION 72
- STRUCTURES 74
- GOVERNMENT FACILITIES 78
- COASTAL PUBLIC AMENITIES 85
- CULTURAL ASSETS 88
- PARKS AND OPEN SPACE 90
- FIRST RESPONDERS 112
- EMERGENCY LOGISTICS 118
- EDUCATIONAL FACILITIES 122
- WATER 125
- WASTEWATER 128
- SEPTIC TANKS 150
- SOLID WASTE 151
- MEDICAL CARE 155
- INDUSTRIAL SITES 158
- COMMERCIAL SITES 160
- VULNERABLE BY HOUSING TYPE 162
- ENVIRONMENTAL 165
- SUMMARY OF VULNERABILITIES 166
- REFERENCES 174
- APPENDIX 176
- CRITICAL ASSET FOCUS AREAS 197
- ACKNOWLEDGMENTS 198

REPORT INFORMATION
Abbreviations and Acronyms
- AEP
- Annual Excedance Probability
- BFE
- Base Flood Elevation
- BRIC
- Building Resilience in Communities (grant)
- CAEP
- Climate Action and Equity Plan
- CRA
- Community Redevelopment Area
- CSAP
- Tampa Bay Climate Science Advisory Panel
- CSX
- A railroad company
- DDF
- Depth duration frequency
- DEM
- Digital Elevation Model
- FDEP
- Florida Department of Environmental Protection
- FEMA
- Federal Emergency Management Agency
- FIRM
- Flood Insurance Rate Map
- FIS
- Flood Insurance Study
- FVA
- Fundamental Vertical Accuracy
- GIS
- Geographic Information System
- GHG
- Greenhouse Gas
- GPM
- Gallons Per Minute
- HCC
- Hillsborough Community College
- H & H
- Hydraulic and Hydrologic
- HFC AWTP
- Howard F. Curren Advanced Wastewater Treatment Plant
- HMGP
- Hazard Mitigation Grant Program
- HVAC
- Heating, Ventilation, and Air Conditioning
- IH
- Intermediate-High
- IL
- Intermediate-Low
- LiMWA
- Limit of Moderate Wave Action
- MHW
- Mean High Water
- MHHW
- Mean Higher High Water
- NAVD88
- North American Vertical Datum of 1988
- NCA
- National Climate Assessment
- NOAA
- National Oceanic and Atmospheric Administration
- PTB
- Port Tampa Bay
- RMSL
- Relative Mean Sea Level
- RSLC
- Relative Sea Level Change
- SFWMD
- South Florida Water Management District
- SLR
- Sea Level Rise
- SWFWMD
- Southwest Florida Water Management District
- TBRPC
- Tampa Bay Regional Planning Council
- TECO
- Tampa Electric Company
- TPO
- Transportation Planning Organization
- USF
- University of South Florida
- USACE
- United States Army Corp of Engineers
- USGS
- United States Geological Survey
- WHAFIS
- Wave Height Analysis for Flood Insurance Studies
General Notes
- The Vulnerability Assessment analysis was completed using publicly available data and data provided by the City. No surveys were completed as part of this project. As such, the information shown is meant for planning-level analysis. It is expected that some inaccuracies may occur, although all reasonable attempts were taken to validate the data.
- Flood depths relate to the distance between the floodplain level and the surface-grade topography at a facility's location. Individual components were not surveyed, nor were unique assets calculated for their unique vulnerability to flooding.
- For future scenarios analysis, maps refer to the 2070 intermediate-high condition.
- The Community Redevelopment Areas (CRAs) within the City of Tampa are shown on all maps in yellow.
EXECUTIVE SUMMARY
SUMMARY OF FINDINGS
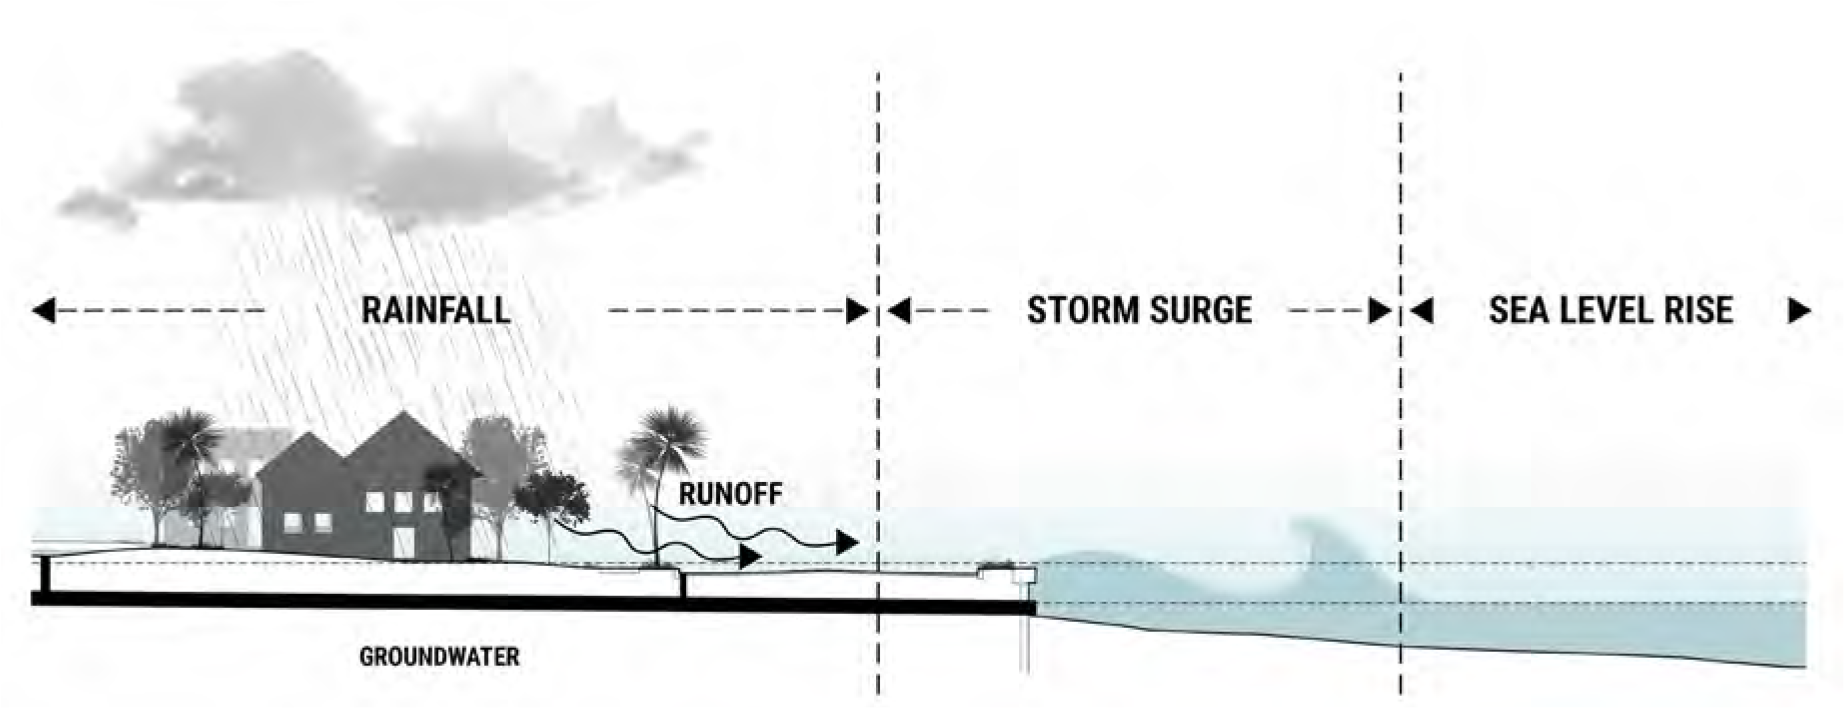
In the coming decades, Tampa will experience the combined effects of gradual sea-level rise, extreme rainfall, and storm surge. To measure the impact of these flood threats, the Vulnerability Assessment developed a range of scenarios for future-year flooding from each flood type and determined the impact to various critical assets.
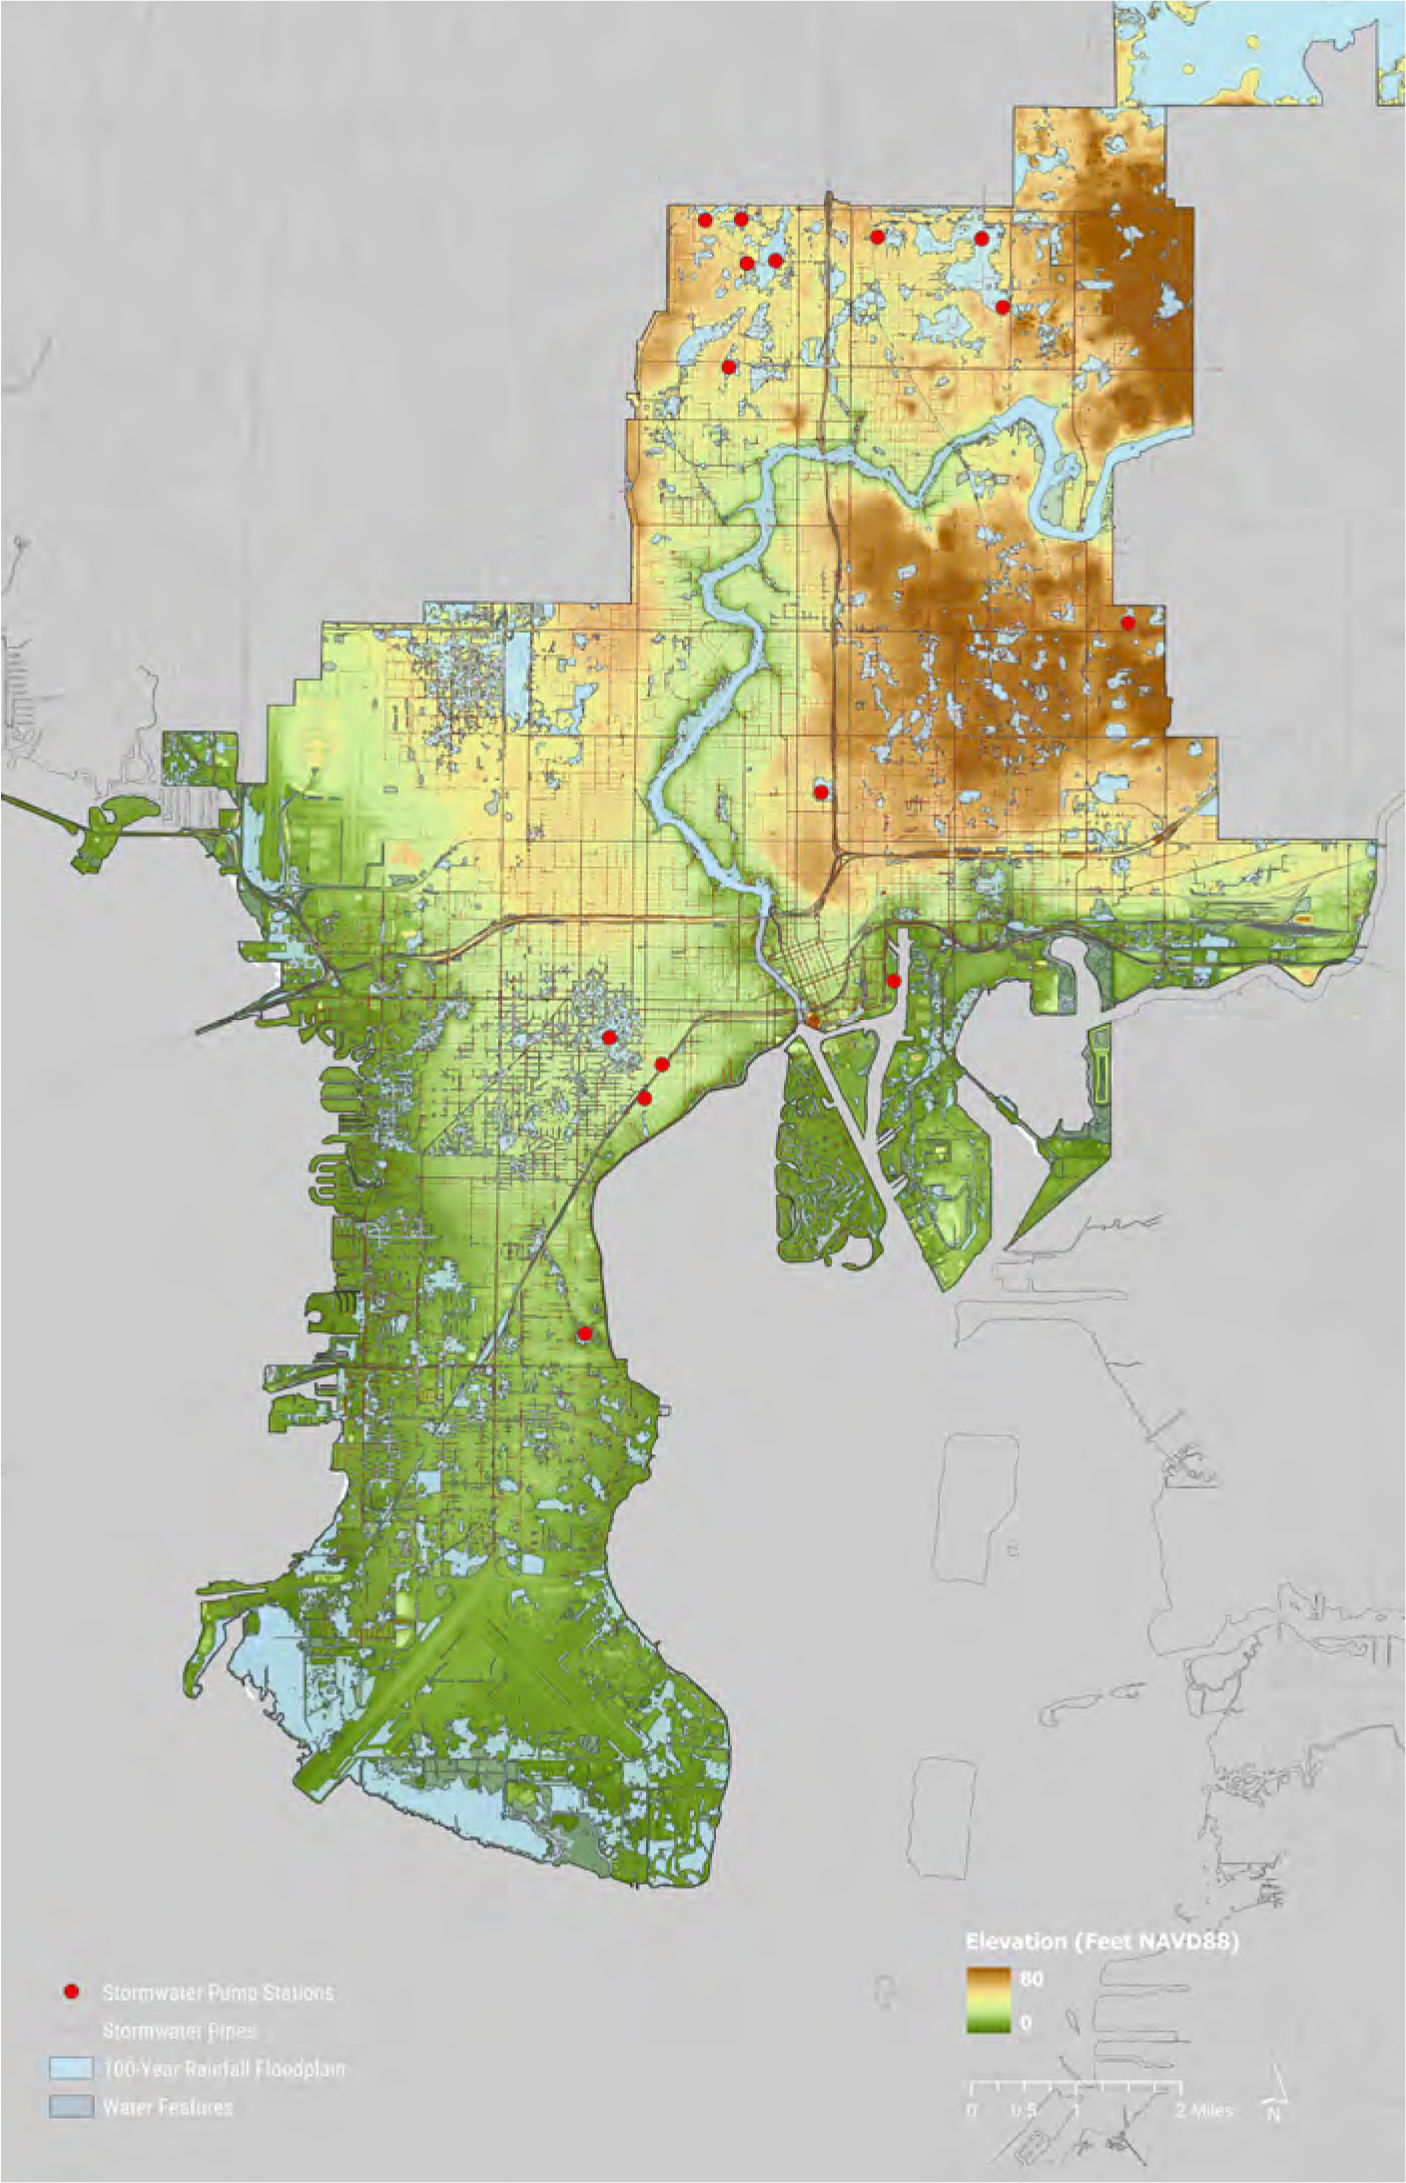
The natural defense of land elevation determines in large part the impact these flood threats will have across Tampa. A summary of elevations provides an intuitive understanding of the city’s most vulnerable areas, regardless of flood type.
Most of the city is at or above elevation 7 feet NAVD88, putting it above expected future sea elevations. Locations of early city settlement are especially well-sited. Downtown is mostly above elevation 10 feet with a few sloping park sites that bend toward the waterfront. The city’s historic neighborhoods, such as Hyde Park and West Tampa, are above elevation 15 feet.
Over the years, growth has expanded the urban footprint into low-lying areas, in some cases building new land over historic wetlands or oyster bars. Development has also filled open spaces that would have historically been part of the drainage system or lands adjacent to waterways that are within the floodplain. A few of these areas include:
- Palmetto Beach, near elevation 3 feet NAVD88 and above
- The Port Tampa City area, where most land is between elevations 3 and 4.5 feet, with some streets as low as 2 feet
- Sunset Park, near elevation 3 feet and above
- Some areas of Beach Park, near elevation 4 feet with some streets as low as 2 feet
- Near Picnic Island, where residential areas and oil-and-gas related businesses range from 3 to 4 feet
- Davis Islands, where roadways range from 4 to 7 feet
- Wellswood and West Riverside Heights, on the Hillsborough River, where elevations get as low as 3.5 feet
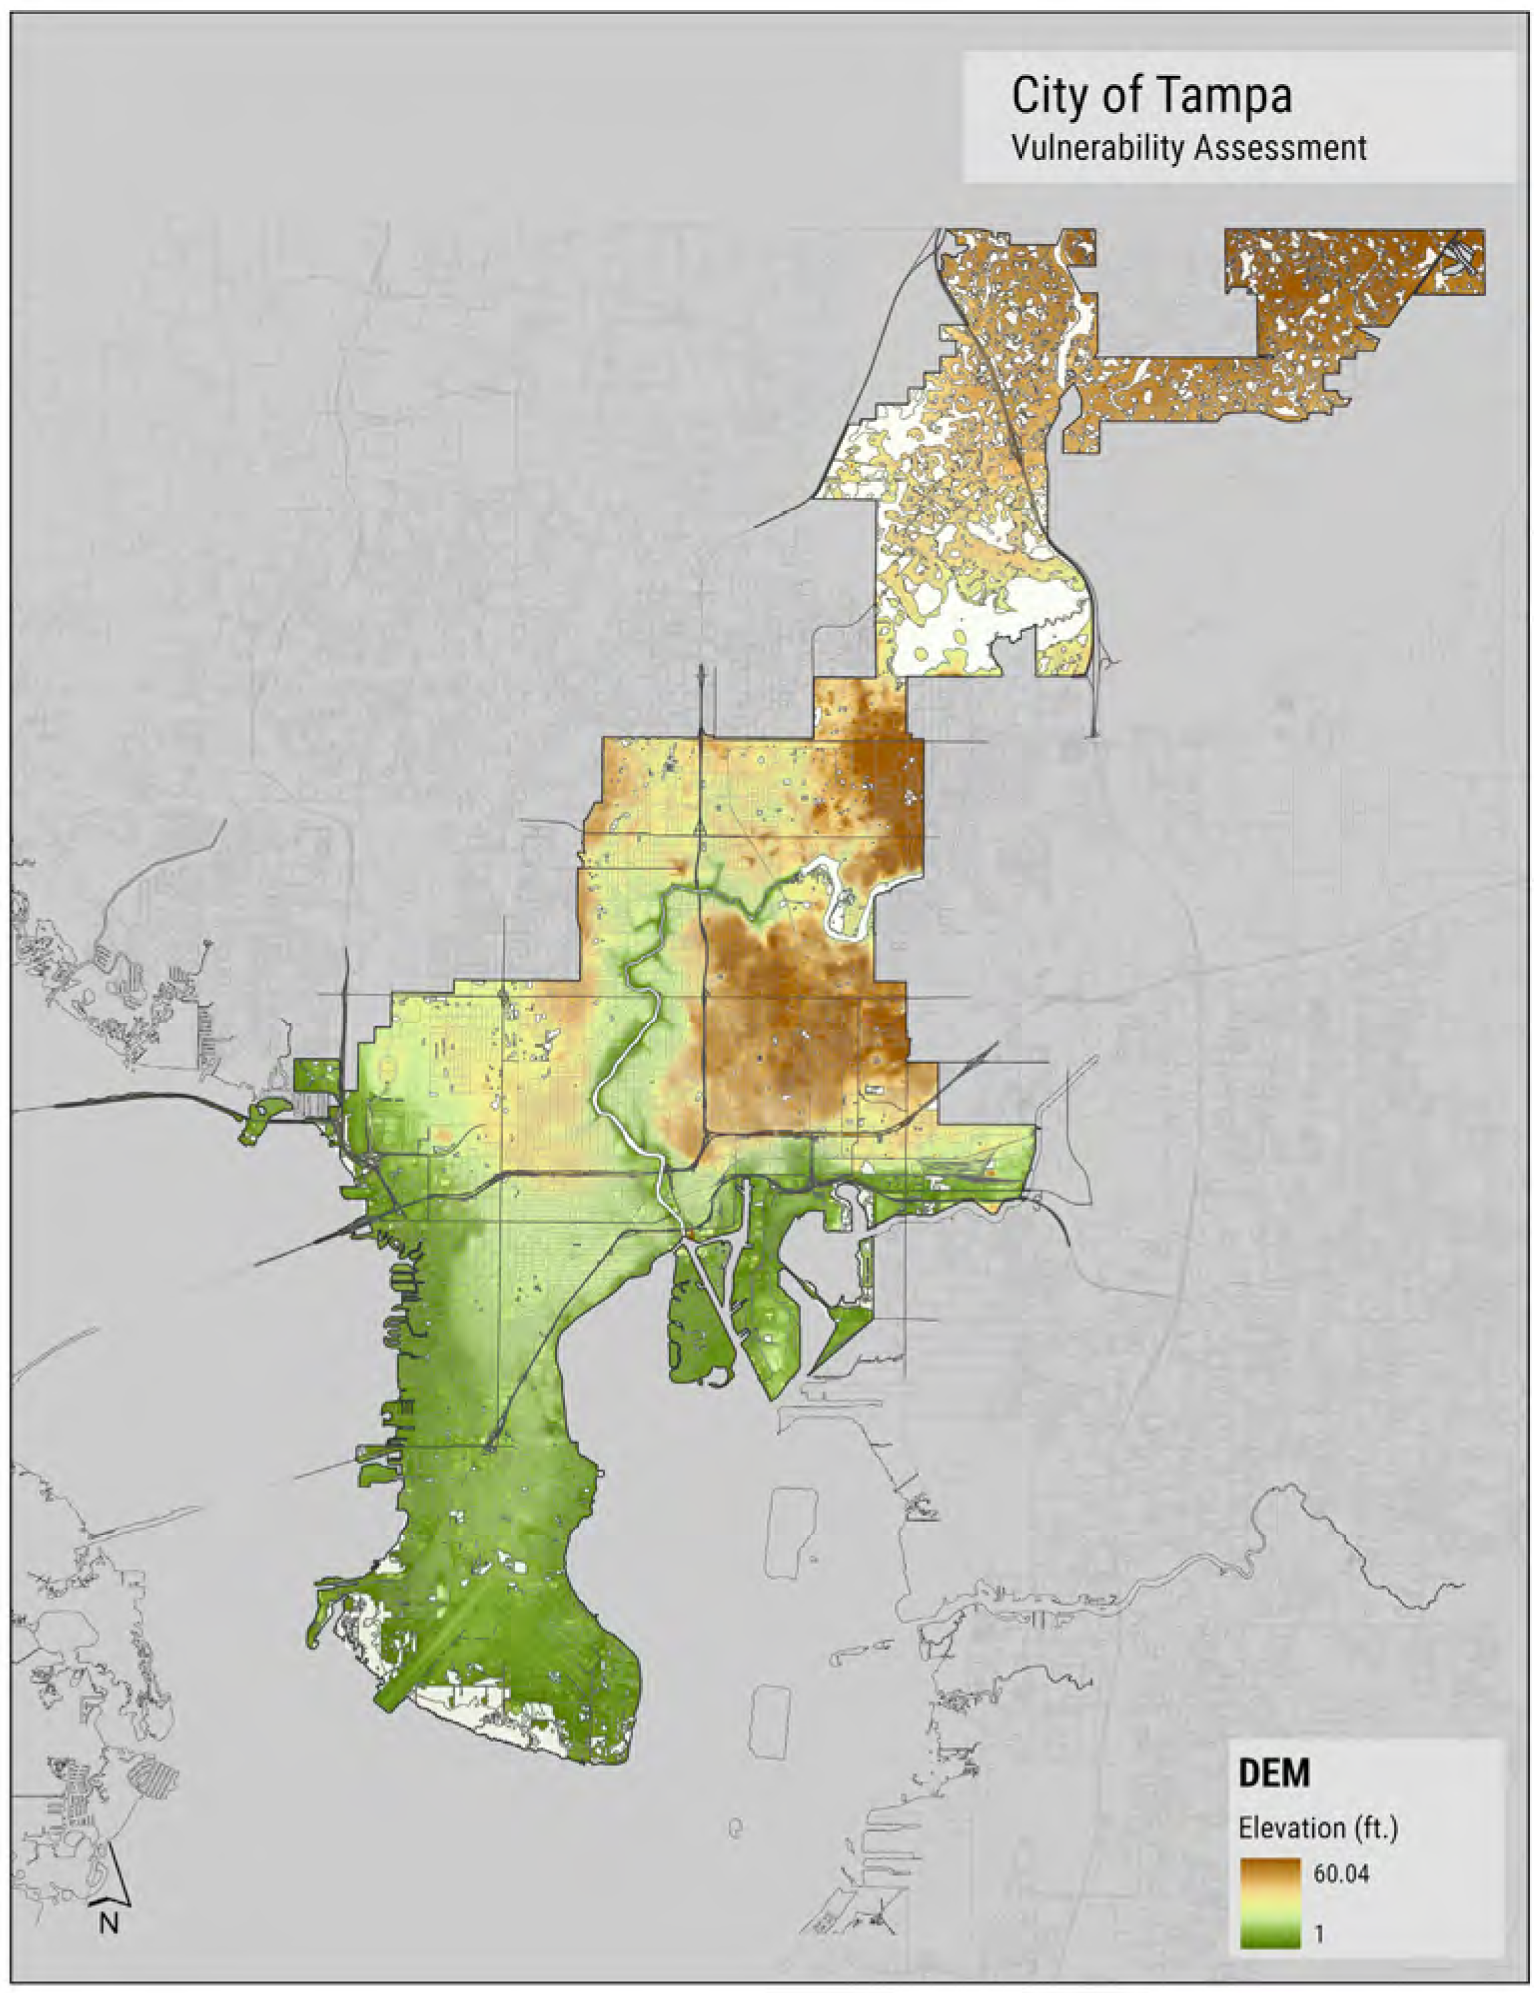
These locations are a few of the most vulnerable to rising sea levels. They would also be the most impacted if storm surge were to make its way to the city. Within these zones, the most vulnerable city infrastructure is associated with wastewater delivery systems, including pump stations and pipelines along the coastline, in addition to localized flooding and property impacts. No city buildings are within the expected 2070 intermediate-high sea level rise floodplain.
The following sections summarize the impact to critical infrastructure by flood type.
Sea Level Rise
Sea levels will gradually rise, but global factors will influence the ultimate rate and height of the increase. This assessment used four scenarios to estimate increases, in accordance with NOAA (2017), Resilient Florida (2021), and Tampa Bay Climate Science Advisory Panel (2019) recommendations. Scenarios represent localized estimates within the midrange, or “intermediate,” increase estimates from NOAA for the years 2040 and 2070. It includes the high and low end of this spectrum, referred to as the “intermediate-high” and “intermediate-low” projections.
Tides naturally rise and fall each day. To establish a reference from today’s high tides, the assessment assumed a current baseline sea-level elevation of 2 feet NAVD88 (this is the 1-year stillwater elevation, a statistical highest guaranteed tide in a year). At this elevation, approximately 3,400 linear feet of minor roads (classified as local, collector, and neighborhood collector roads) are below the current 1-year stillwater elevation and approximately 20 feet of railroad. By 2040, with the intermediate-low (IL) sea level rise projection (.36 feet higher), almost 2,000 additional feet of minor roads would be impacted, and approximately 150 feet of major roads (defined as freeways, minor arterials, principal arterials, and ramps; see 2040 intermediate-high (IH) list below for lowest roadway segments). By 2040, with the intermediate-high sea level rise projection (.79 feet higher than 2020, and .2 feet lower than the 2070 intermediate-low projection), roadway impacts are concentrated to a few areas
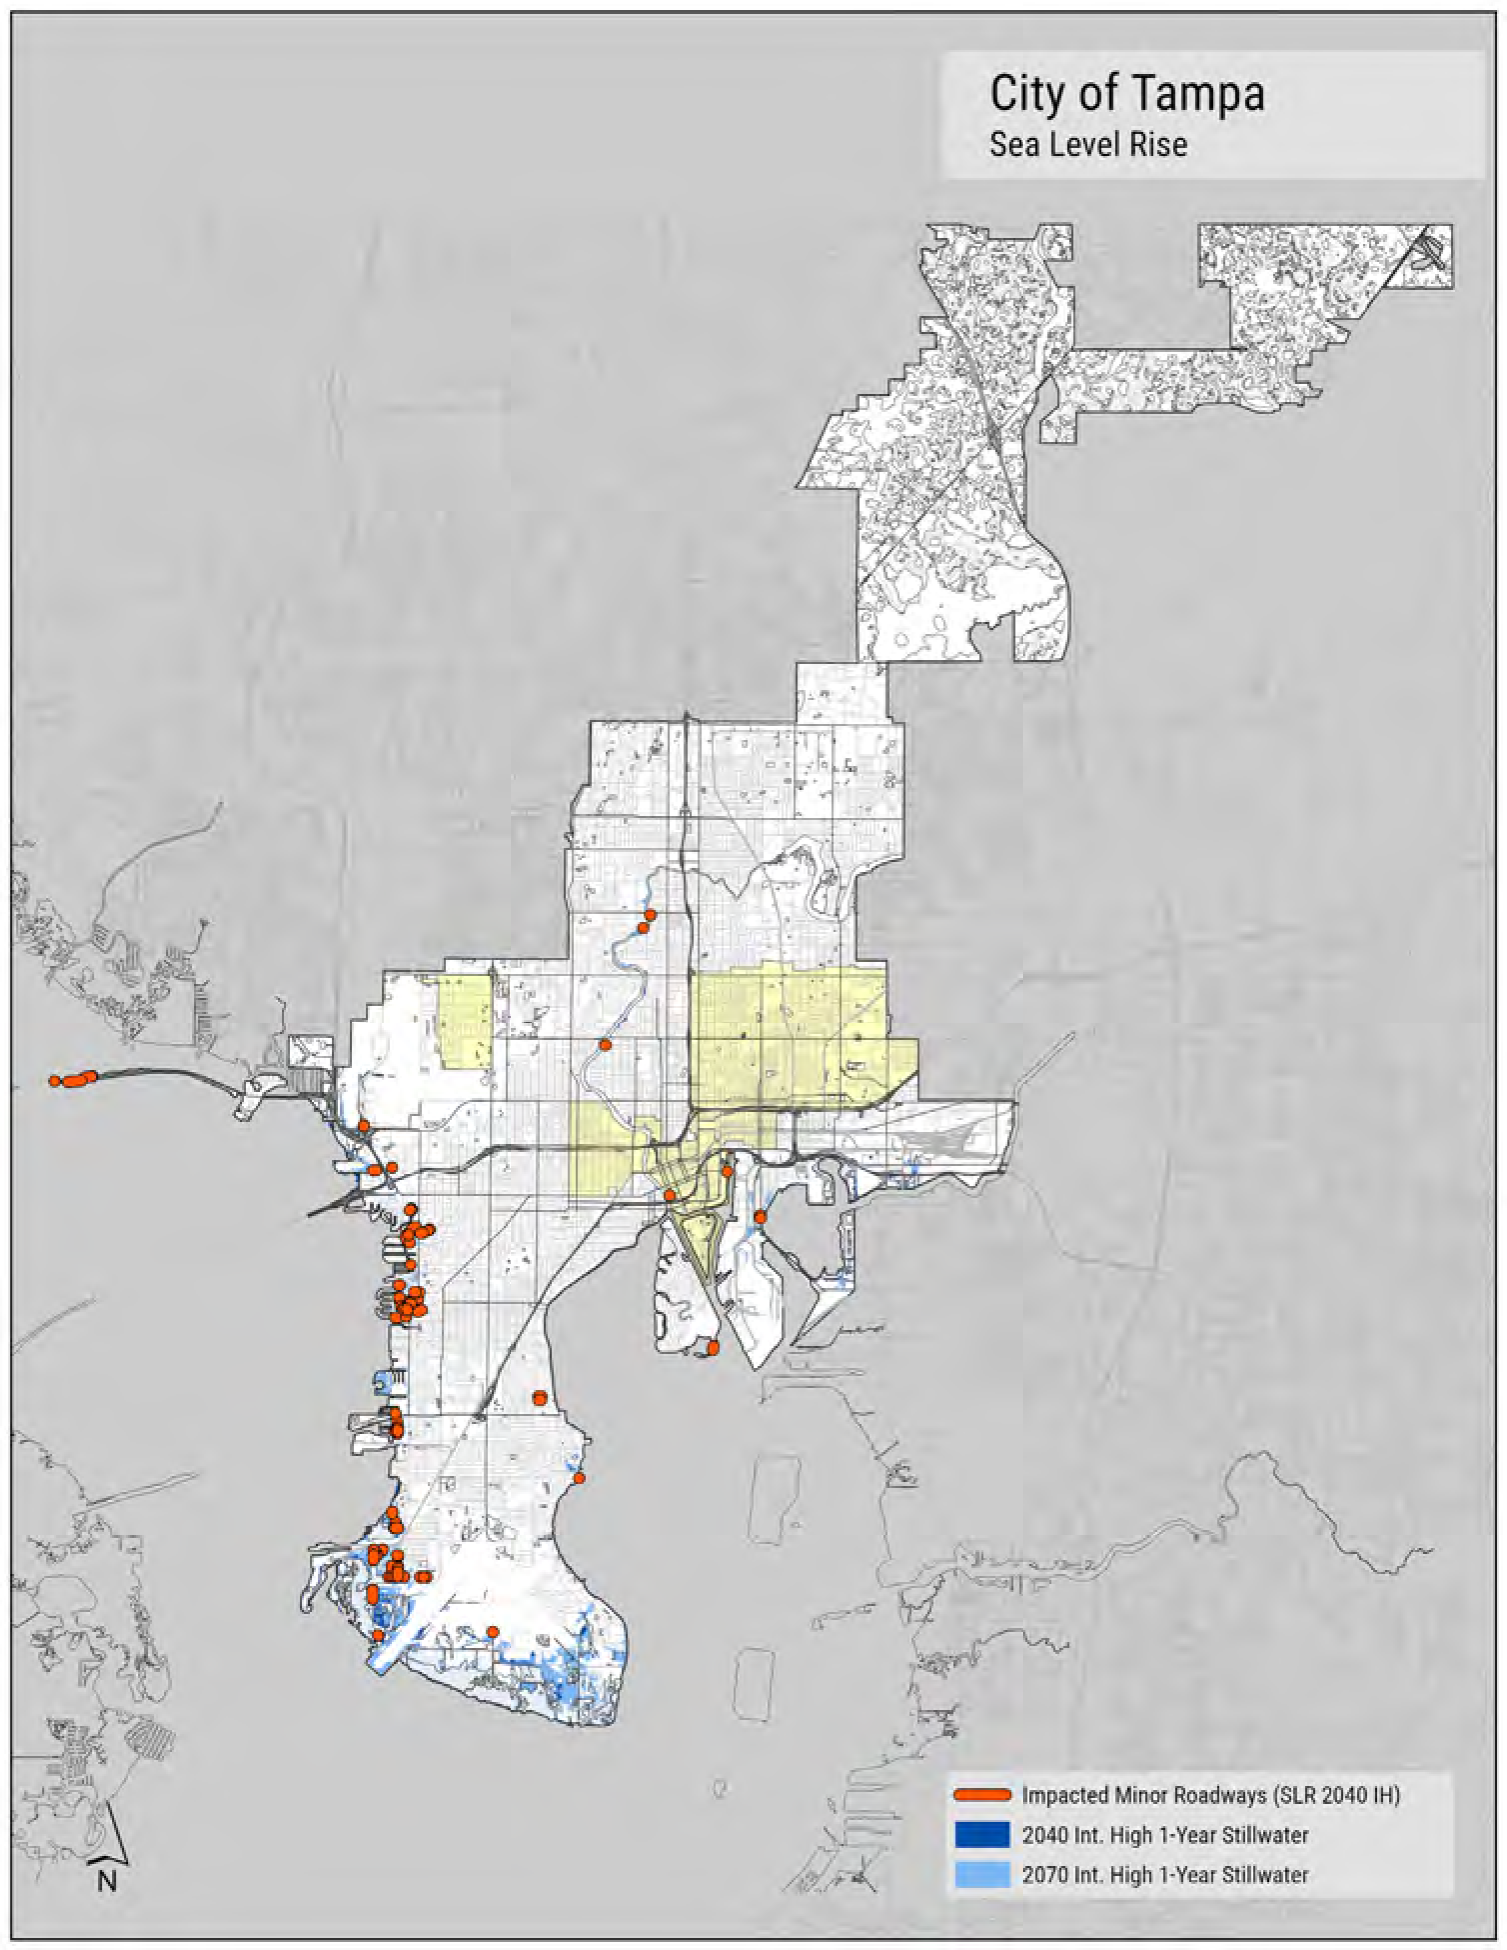
and there are isolated wastewater pump stations and open spaces such as parks and conservation lands that could be affected. Highest risk locations in 2040, with the intermediate-high sea level rise scenario, are:
- The Courtney Campbell Access Roads
- Bayside Drive in Beach Park
- Roadways in Sunset Park
- Roadways in Port Tampa City
- The south end of 22nd Street in Palmetto Beach
- A minor pump station could be impacted by the 2070 intermediate-low scenario at River Place Apartment Homes on West River Place East
By 2070, with the intermediate-high sea level rise projection, the extent of impacts is much greater. In addition to the items listed previously, this scenario would affect:
- Coastal amenities such as beaches, marinas and boat ramps
- Three small pump stations (described in the wastewater section), including Neptune Way, Epps Park, and Virgina Avenue
- Six additional minor pump stations
- Eighteen (of 92) cultural assets (not including cemeteries)
There are minimal impacts to education, first responder, government, medical, solid waste, or water facilities by sea level rise alone. However, higher tides do not occur in isolation. They can contribute to greater impacts from rainfall and surge events, clogging the downstream outfall of water, or putting minor surge events closer to breach points for seawalls or low inland inlets. They can cause changes to inland hydrological conditions, stormwater systems, and the ability to move water toward the sea, ultimately creating additional flood risk within the community.
Other privately-owned assets such as residential, commercial and industrial sites are described further in individual sections of the report.
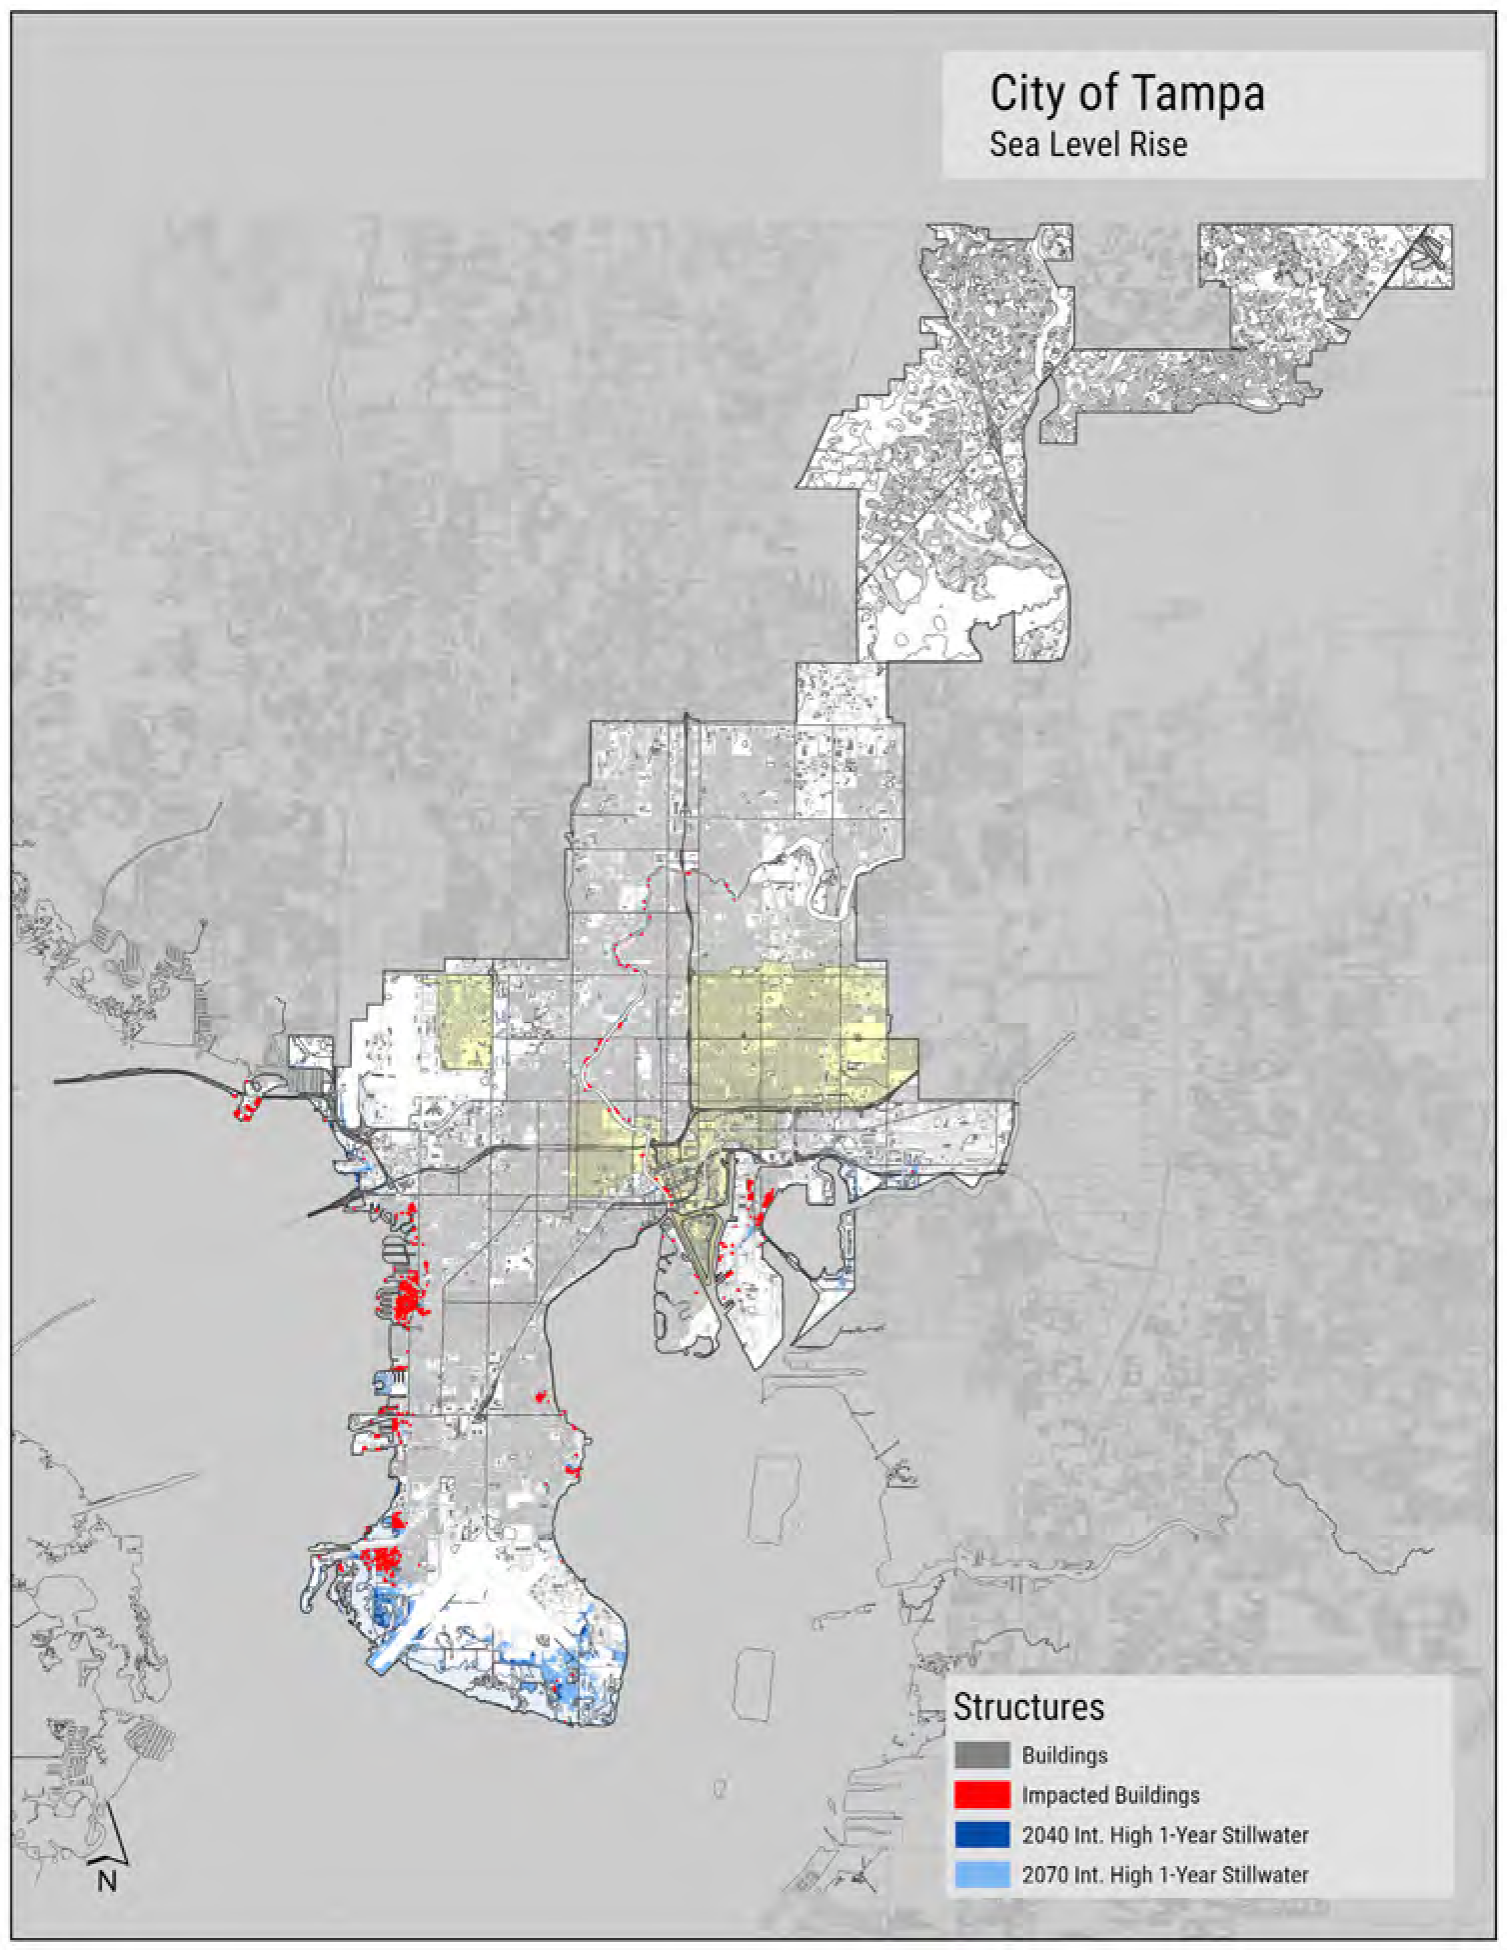
FIGURE 3: STRUCTURES IMPACTED BY THE 2070 INTERMEDIATE-HIGH SEA LEVEL RISE SCENARIO.
Rainfall
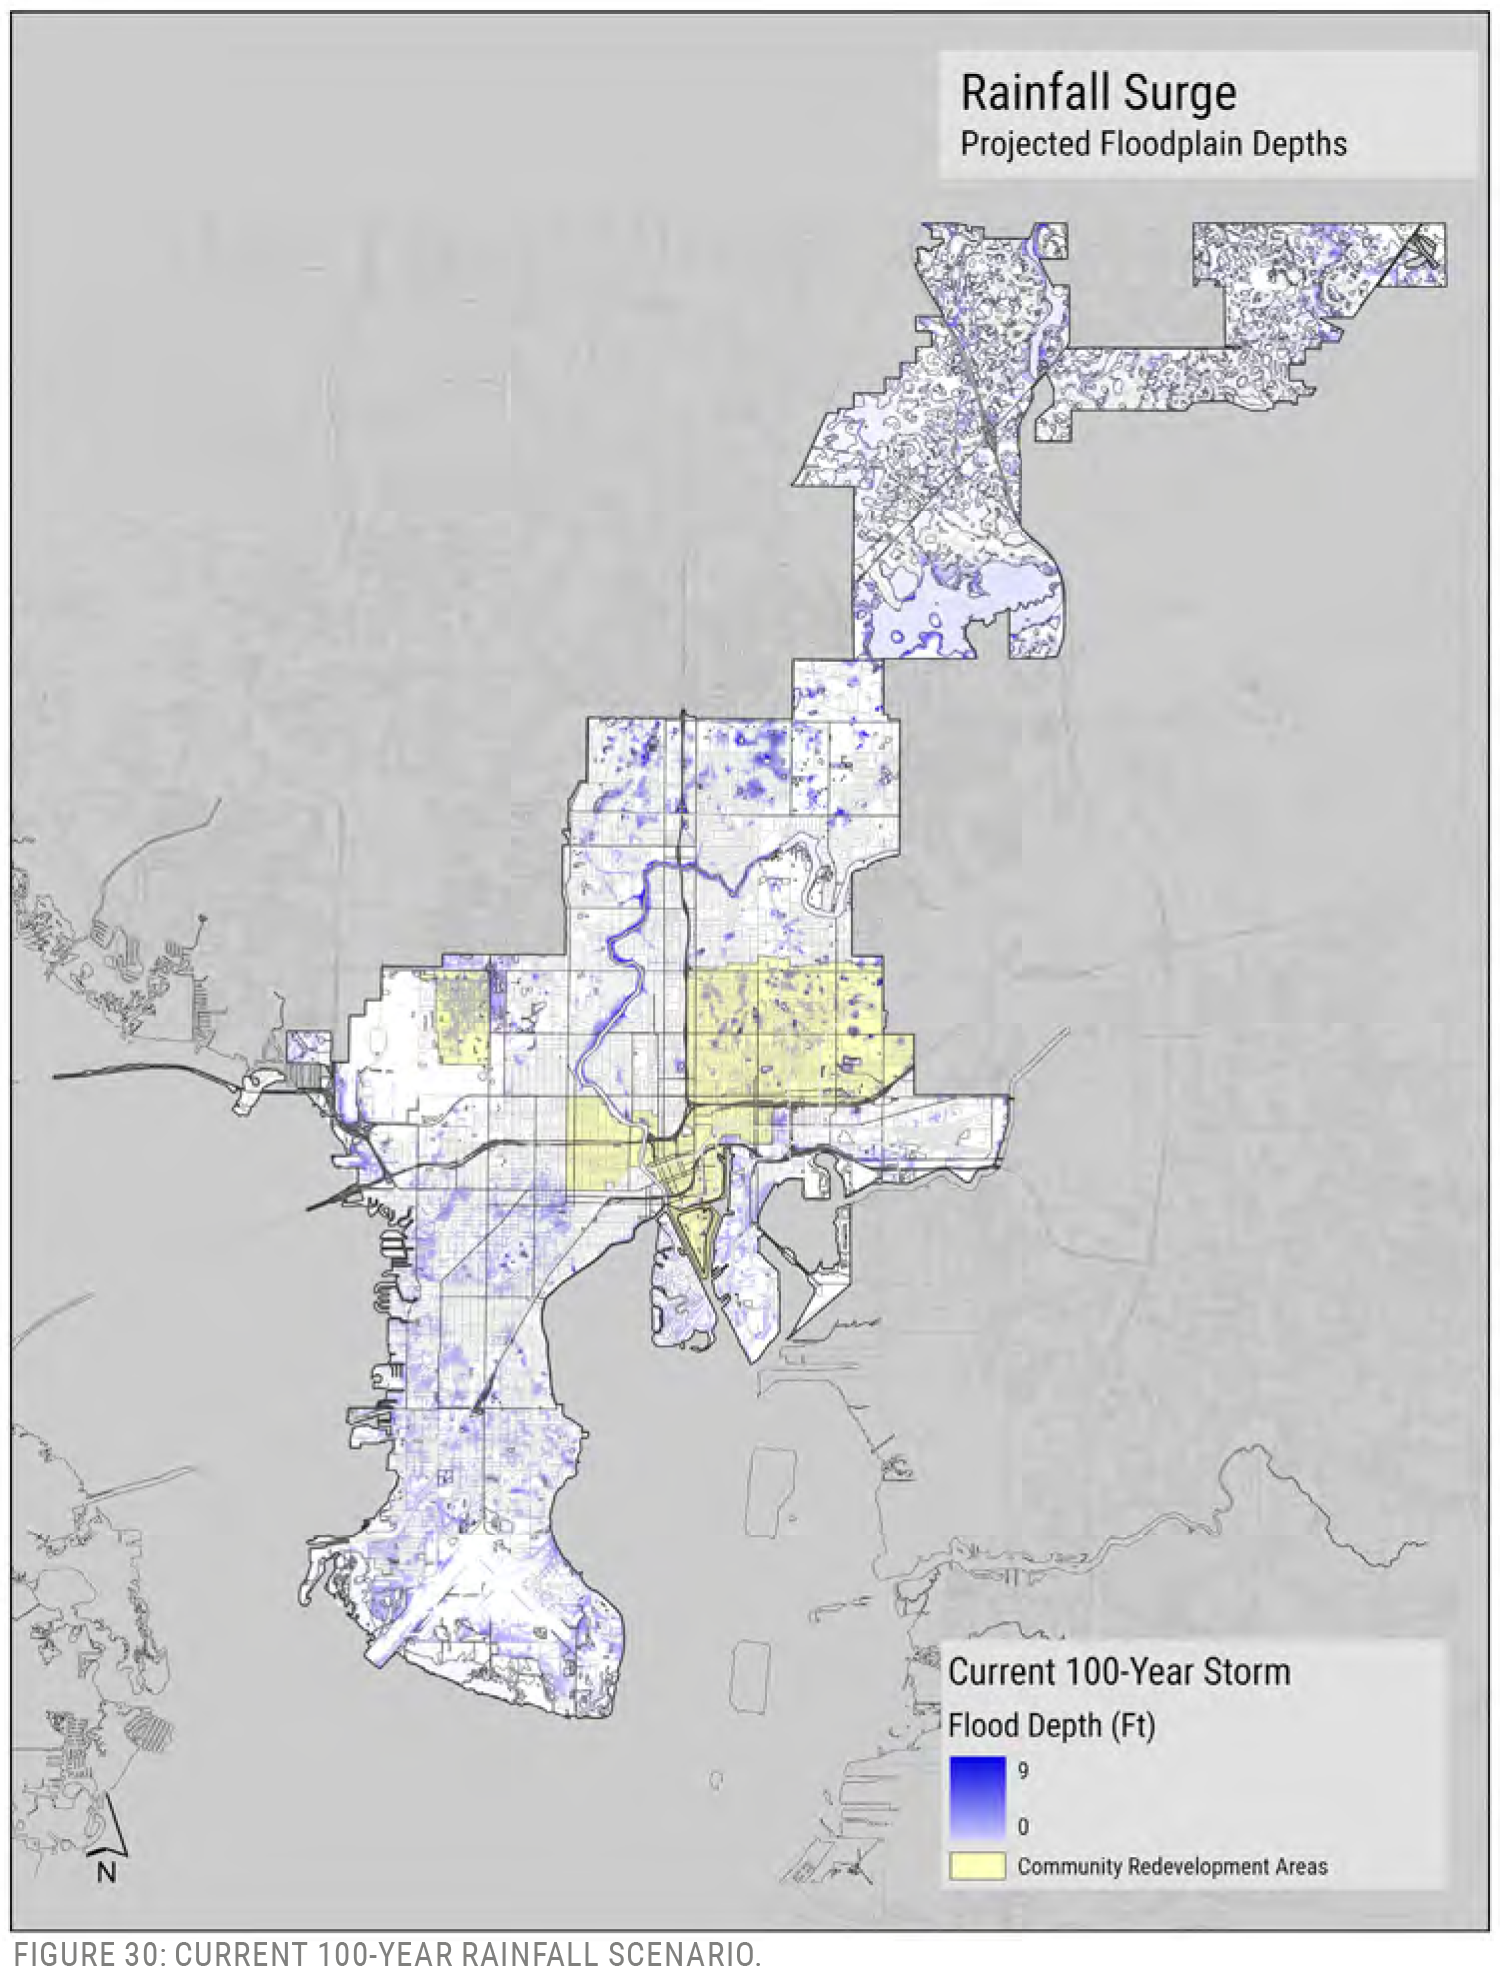
A 100-year rainfall event has the potential to cause major impacts and disruptions to Tampa communities, as was seen after Hurricane Milton dropped approximately 13 inches of water.). This is due in part to Tampa’s natural topography and the impact of development on that topography. The city’s landscape includes multiple closed basins – areas where water cannot escape by surficial flow. These areas would have historically drained only at sinks and by soaking into the soil. Sinks are inland openings in the ground with direct connection to subsurface aquifers where water migrates laterally below-ground to downstream locations, eventually coming to the surface at springs or in the Hillsborough River. This closed-basin condition exists in the Tampa Overlook neighborhood, in East Forest Hills and Forest Hills, University Square, and Palma Ceia Pines/Parkland Estates. Drew Park was once a large expanse of muddy swamp that was turned into an airfield. It is now an industrial part of town with a mix of residences and businesses, and widespread projected flooding with the 100-year rainfall scenario.
Primary areas with projected rainfall impacts include:
- Drew Park
- Palmetto Beach
- University Square
- Parkland Estates
- Along the Hillsborough River
Many of the city’s sinks are no longer functional and so mechanical pumping is responsible for removing water during major stormwater events. Impacts are detailed in individual report sections. The reliance on pumps creates another dimension of vulnerability. Areas that are heavily reliant on pumps include:
- The Donut Pond area and system of ponds and pumps near Fowler Avenue and University Square neighborhood. The Donut Pond watershed is connected to Duck Pond at the redeveloping University Mall site. Water is collected in these basins and sent to the Hillsborough River.
- The Blue Sink area in Forest Hills.
- Robles Park
- Palma Ceia Pines and the hospital pump station near Horatio Street and Habana Avenue
- The area near the Alline Avenue pump station
Areas that are closed basins and do not have pumps include (see Figure 6):
- Tampa Overlook Neighborhood
- Low areas in Terrace Park and Temple Crest neighborhoods
- Various areas around East Tampa, Belmont Heights, Northview Hills, and Southeast Seminole Heights
- Drew Park and Plaza Terrace
- Golfview and into the Palma Ceia neighborhood
- Fair Oaks Manhattan Neighborhood, near West Bay View Avenue
Rainfall can cause disruptions for Tampa drivers. Many roads are susceptible to flooding during significant rainfall events. This issue is prevalent across the entire city, but is especially a problem for:
- Areas between Busch Boulevard and Fowler Avenue
- Drew Park
- East Tampa
- East Ybor
- Palmetto Beach
- Davis Islands
- The South Tampa peninsula south of Kennedy Boulevard
All references to units of measure are in feet.
When related to elevations above or below sea level, numerical values refer to the North American Vertical Datum of 1988, or NAVD88.
Storm Surge
Storm surge would cause widespread impacts in the City of Tampa, especially when considering water heights associated with the 100-year storm – reaching approximately 10 to 11 feet NAVD88. Vulnerabilities will increase in the future, as sea levels rise. Some of the City-owned infrastructure that would be affected includes:
- Davis Islands and Palmetto Beach fire stations
- Some city-owned community centers (Southwest Port Tampa, DeSoto Park, Joe Abrams Fitness and Wellness Center, and Julian B. Lane)
- Beaches, marinas, boat ramps, docks, and piers
- Extensive impacts to roadways and privately owned structures
- At City facilities along the Hillsborough River and bays

INTRODUCTION 13
TAMPA AND WATER
The City of Tampa has a special relationship with water. Not only does it have 127 miles of coastline, but its relatively flat topography and subtropical climate means that rainfall plays an important role in the Tampa landscape. Since the area’s earliest days, water has been a source of survival and growth. In her book River of the Golden Ibis, Gloria Jahoda tells stories of the Native Americans that traversed the river corridor, finding building materials and food. Early settlers who established Fort Brooke in 1824, near the mouth of the Hillsborough River, would mine shellfish at the mouth historic Spanishtown Creek near Hyde Park. Henry B. Plant constructed the Tampa Bay Hotel at the mouth of the Hillsborough River in 1891. This tourist destination was associated with a railroad line that connected Tampa to northern cities and drew new people to the region. A boat connection between Tampa and Cuba led cigar manufacturer Vicente Martinez Ybor to Tampa, where he established a company town, Ybor City, which was later annexed into the city. The city’s port has steadily expanded and become a major port of call. Port Tampa Bay is now a major economic engine with $17.2 billion in annual economic impact and provides more than 85,000 jobs. In addition to cargo shipping, it services cruise ships that arrive and depart regularly.
Proximity to water brings inherent vulnerability. A 1921 Hurricane caused destruction to Palmetto Beach and Ybor City, and flooding extended throughout the Bayshore area. The city experienced three significant events in 2024. Hurricane Debby struck Florida in the Big Bend area in August, near Apalachee Bay. As it moved up the coast it caused abnormally high stillwater elevations at the coastline – high enough to over-top sea walls in Tampa. Hurricane Helene, which made landfall 180 miles to the north, pushed 7 feet of coastal surge into Tampa Bay and caused severe damage in areas like Davis Islands and Palmetto Beach. Hurricane Milton delivered tropical storm winds and more than a 100-year rainfall event, causing major flooding throughout the city.
To assess Tampa’s vulnerabilities to flood – now and in the future - the City has completed this comprehensive study of potential impacts to coastal and infrastructural assets. It takes a forward-looking view toward the years 2040 and 2070 to project the impact of sea level rise, stormwater, and storm surge, each of which have unique implications for utility infrastructure and planning. This Vulnerability Assessment is guided by the standards established by the Florida Department of Environmental Protection (FDEP) and the Resilient Florida program, set forth by Florida Statute 390.083. Once vulnerabilities have been documented, FDEP and the Resilient Florida program can be used to financially support mitigation efforts. This study also makes the city eligible for Resilient Florida funding to implement projects that reduce risk to the Tampa community. Since 2021, approximately $1.7 billion has been dispersed by FDEP to support resilience initiatives. Federal and other state agencies have also initiated substantial funding programs for pre-disaster flood mitigation, from programs such as the Federal Emergency Management Agency’s (FEMA) Building Resilient Infrastructure and Communities (BRIC) grant, their Hazard Mitigation Grant Program (HMGP), and through disaster relief programs associated with the Stafford Act.
In short, amid intensifying rainfall, climate change, and the seasonal threat posed by hurricanes, this Vulnerability Assessment is a vital step in Tampa's path toward a more resilient future.
PROJECT CONTEXT
Since passing the “Peril of Flood Act” (Senate Bill 1094) in 2015, Florida has made great strides towards addressing the issue of sea level rise. Tampa was one of the first cities to comply with the bill’s requirements and completed a vulnerability assessment in 2017 while also updating its Comprehensive Plan Coastal Management element to meet Peril of Flood criteria.
These efforts were followed by Hillsborough County, in 2020, when it published a Community Vulnerability Study (CVS), produced by the University of South Florida. This was a comprehensive assessment, associated with the Local Mitigation Strategy, to address the potential physical and social impacts of sea level rise and future storm surge in the county. The CVS was aided by research conducted by the Tampa Bay Climate Science Advisory Committee and their Recommended Projection of Sea Level Rise in The Tampa Bay Region report (2015 and 2019). The CVS included an evaluation of assets within the City of Tampa and explored issues of equity and social vulnerability related to climate change.
The City of Tampa conducted a sea level rise study in 2020, The Tampa Sea Level Rise Vulnerability Analysis, which evaluated drainage system impacts from future higher high tides. That year, the city also worked with the University of South Florida to evaluate policy implications of sea level rise and identify recommendations for resilience planning. This culminated in a set of reports and multiple workshops related to policy and sea level rise, work completed in 2021 (Cook et al., 2021). Also, in 2021, the city issued Resilient Tampa, a guidebook that brought forth “a critical resilience lens” for the city. It was broad in scope, outlining approaches to heat, food, community mobility, stormwater, and sea level rise.
In 2023, the City of Tampa completed its first Climate Action and Equity Plan (CAEP), which pointed toward the need to consider future climate conditions in plans, projects, and policies and recommended creating community-based planning strategies to address sea level rise (objective SW2 and initiatives SW 1.2.1, GOV 3.1.2, and COM 1.2.4 in CAEP document) (Applied Sciences, 2023). The city then pursued a federal grant for, and is currently working through, an additional study to evaluate policy implications in the coastal high hazard area (the Coastal Area Action Plan). Each of these plans and studies has helped the city develop a knowledge base to initiate adaptation in policy and physical planning.
This vulnerability assessment continues the city’s trajectory of ensuring a safe and vibrant future for all Tampa residents. It specifically addresses flood vulnerability and identifies communities and critical infrastructures at risk to sea level rise, storm surge, and rainfall. It includes an in-depth analysis of the many different departments and their infrastructure in relation to potential flood scenarios, according to FDEP standards. This document can be used for future decision making and to determine long-term strategies to address infrastructure vulnerabilities and land use planning.
SEA LEVEL RISE
NOAA Int. High
Rising sea levels are the result of several interrelated factors that bring global environmental changes to Tampa’s coastline: melting polar ice caps, thermal expansion of sea water from rising temperatures, and changes in ocean currents. Assessing the impact of higher sea levels required estimating a current high-tide elevation and, given the inherent uncertainty of projections, selecting appropriate scenarios for future elevations.
Methodology
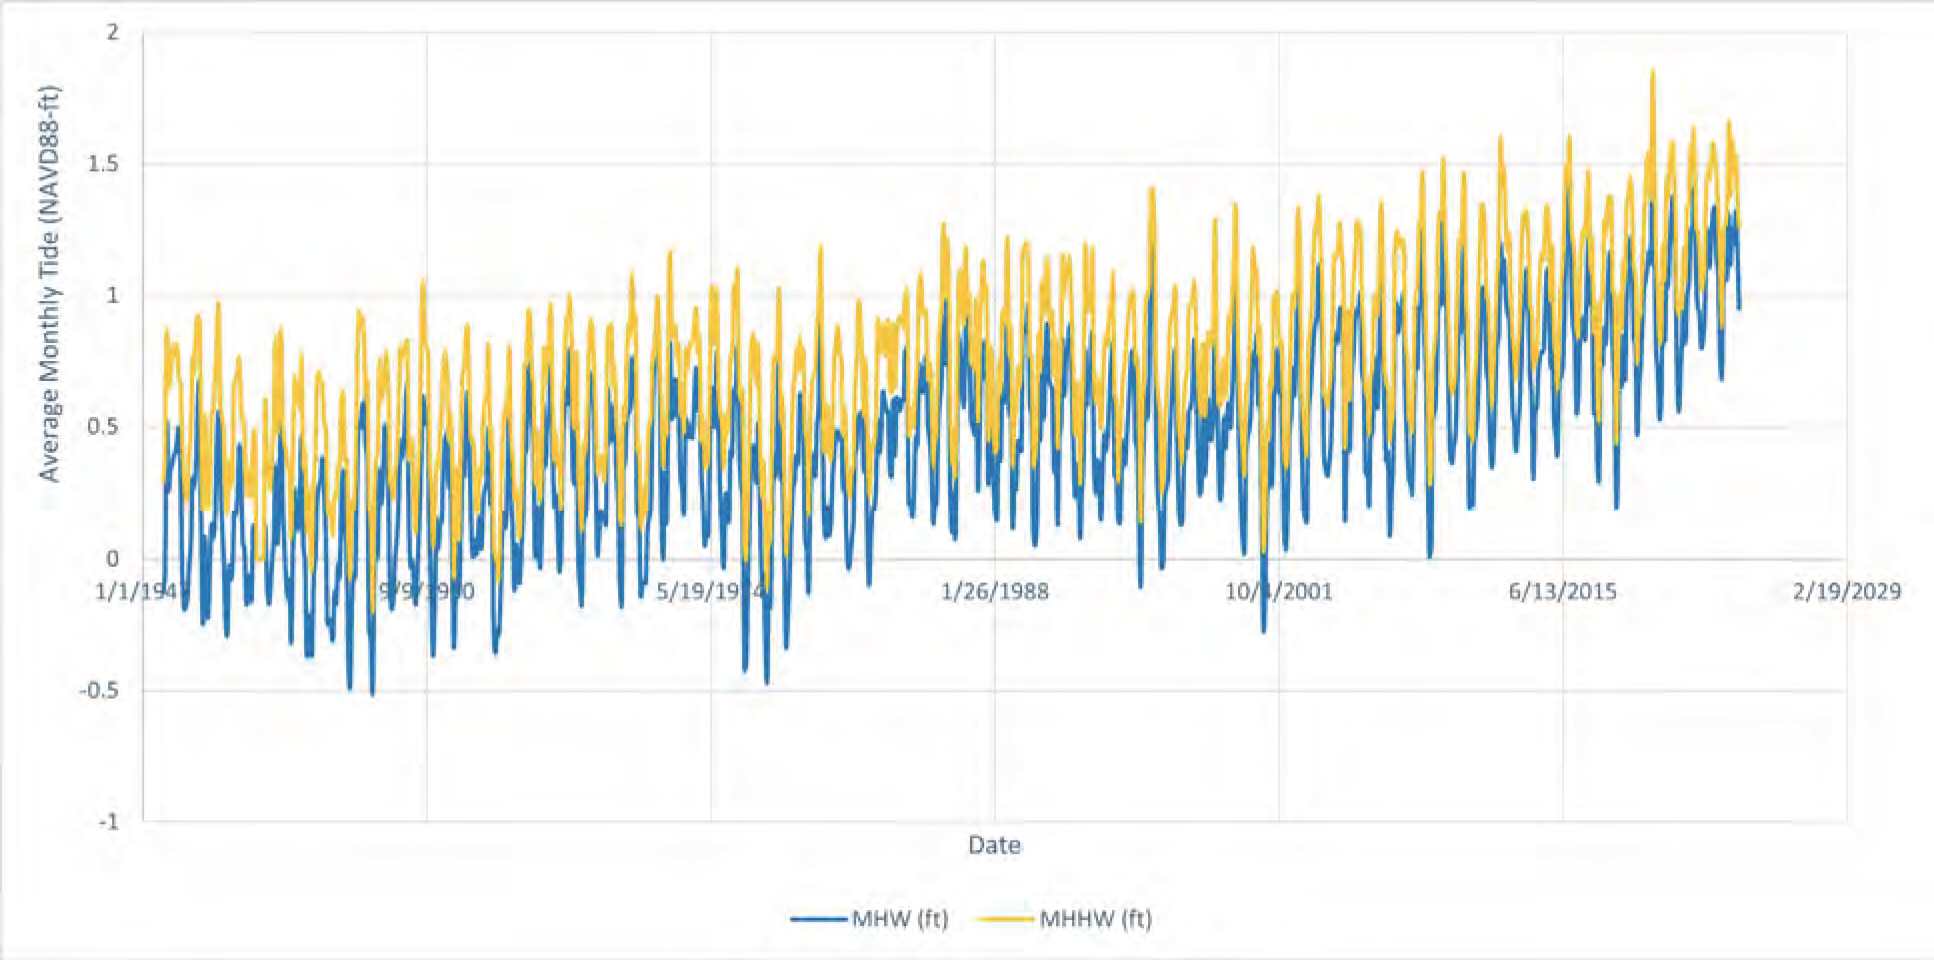
In 2022, the National Oceanic and Atmospheric Administration (NOAA) published Global and Regional Sea Level Rise Scenarios for the United States. It expects, with high level of certainty, 14 to 18 inches of sea level rise in the eastern Gulf by the year 2050 (NOAA, 2022). Tampa has already documented approximately 8 inches of sea level rise since 1946, when the St. Petersburg tide gauge was established, according to the Climate Science Advisory Panel (CSAP).
The projections for sea level rise vary drastically, from 1.9 to 8.5 feet during the 21st century, in part because of unknowns related to the stability of large ice sheets. Estimates for Tampa’s future sea levels are derived from regional NOAA estimates adjusted to local conditions. Due to the range of factors influencing sea-level rise, NOAA provides various scenarios for elevations classified from low to high. CSAP recommends using scenarios midrange estimates classified as “intermediate high” and “intermediate low.” This assessment uses the 2040 and 2070 intermediate high and low scenarios, in keeping with CSAP’s recommendation and statutory requirements in place when the assessment was initiated.
The CSAP suggests that sea levels could rise by nearly 40 inches by 2070 under the intermediate-high scenario, based on a year 2000 baseline. The intermediate-low scenario suggests a rise of 15 inches by 2070. Adhering to the intermediate-low trajectory would result in an approximate 12-inch (0.98 feet) increase between 2020 and 2070 , while the intermediate-high projection indicates a difference of 33 inches (2.76 feet) over the same period. What’s been made clear through the research is that sea level rise is in direct correlation with greenhouse gas (GHG) output, as is global temperature change (CSAP, 2019), and that a steady trend has been established.
This vulnerability assessment started with a 1-year stillwater scenario of 2 feet NAVD88 as a baseline for all sea level rise scenarios. The 1-year stillwater is the highest guaranteed tide in a year (with 99% certainty) and is a useful leading-edge indicator of coastal flooding. This mark is somewhat higher than the Mean Higher High-Water (MHHW) line, which is a daily high tide indicator. It is slightly lower than the “King Tide” (the average highest expected tide of the year). Since tides are cyclical, with similar conditions re-occurring monthly, it would be expected that the 1-year stillwater mark would be experienced multiple times per year. For example, at the Old Port Tampa tide gauge (#8726607), tide elevations of 2 feet and above were experienced 30 separate days in 2023.
Relative Sea Level Change Projections
Gauge 8726520, St. Petersburg, FL
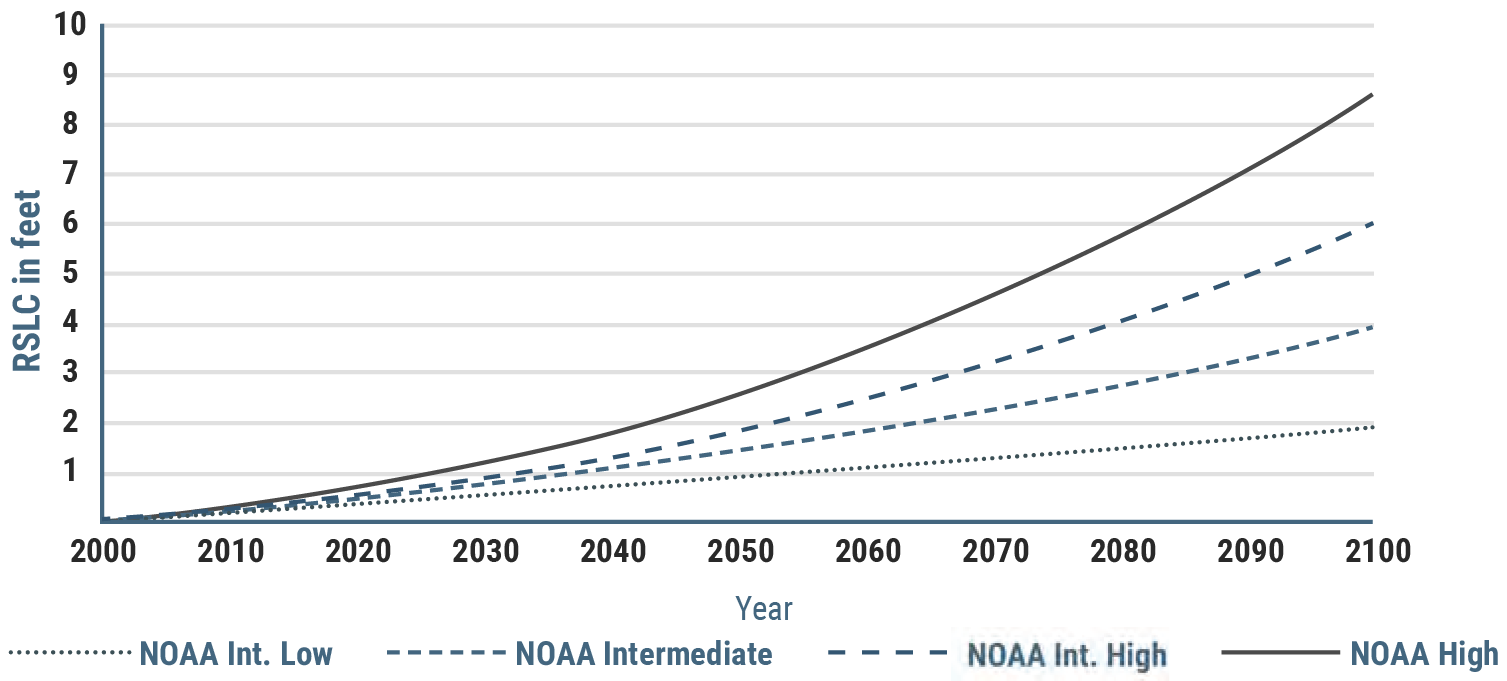
FIGURE 6: RELATIVE SEA LEVEL CHANGE SCENARIOS FOR ST. PETERSBURG, FLORIDA, USING REGIONALLY CORRECTED NOAA 2017 CURVES. (CSAP 2019). MODIFIED TO SHOW THE INT. HIGH SCENARIO.
The 1-year stillwater was derived from statistical analysis of the 30-year period from 1990 to 2020. During this time, yearly highs included 2.04 (1990), 1.95 (1994), 2.04 (1997), and 2.19 (2014) feet NAVD88. Although the lowest tide was 1.95 feet within the 30-year span, increases are expected going forward. Data from past epochs, tidal cycles used to calculate datums, support this assumption. According to the St. Petersburg tide gauge, the 1-year stillwater during an epoch from 1948-1963 (those years were used by NOAA to calculate other datum such as the mean high-water line) was 1.45 feet NAVD88. When using the years 2002-2020, the value is 2.19 feet. It must be understood that tides are a seasonal and cyclical phenomenon and that, although the general trend is going upward, there is an erratic and varied rate of change that is dependent on many factors. For these reasons, it was determined that 2.0 feet NAVD88 should be used as a simplified baseline 1-year stillwater for the year 2020.
| Year | NOAA2017 Low | NOAA2017 Int-Low | NOAA2017 Int. | NOAA2017 Int-High | NOAA2017 High |
|---|---|---|---|---|---|
| 2000 | 0 | 0 | 0 | 0 | 0 |
| 2010 | 0.13 | 0.16 | 0.23 | 0.29 | 0.36 |
| 2020 | 0.29 | 0.36 | 0.49 | 0.62 | 0.72 |
| 2030 | 0.46 | 0.55 | 0.78 | 1.01 | 1.24 |
| 2040 | 0.59 | 0.72 | 1.08 | 1.41 | 1.77 |
| 2050 | 0.78 | 0.95 | 1.44 | 1.97 | 2.56 |
| 2060 | 0.92 | 1.14 | 1.87 | 2.62 | 3.47 |
| 2070 | 1.08 | 1.34 | 2.33 | 3.38 | 4.56 |
| 2080 | 1.21 | 1.54 | 2.82 | 4.20 | 5.71 |
| 2090 | 1.31 | 1.70 | 3.38 | 5.15 | 7.05 |
| 2100 | 1.44 | 1.90 | 3.90 | 6.16 | 8.49 |
| Year | Int-Low | Int-High |
|---|---|---|
| Current | 0 | 0 |
| 2040 | 0.36 | 0.79 |
| 2070 | 0.98 | 2.76 |
NOTE: SEA LEVEL RISE PROJECTS HAVE BEEN ADJUSTED RELATIVE TO EXISTING (2020) CONDITIONS USING OBSERVED SEA LEVEL TRENDS FROM THE ST. PETERSBURG TIDE STATION.
SOURCE: CSAP SEA LEVEL RISE RECOMMENDATIONS, 2019.
Sea Level Rise Impacts
Elevated sea levels will challenge current stormwater infrastructure. Higher coastal waters will bring higher groundwater, and hydraulic (piped) stormwater delivery will be limited because of decreased volume in pipes and soil. The complexity of these factors makes flood forecasting difficult at this time. Although the future is not perfectly certain, the following maps and text describe the best available information.
The CSAP Report suggests that by 2040 there will be between 4.5 to 9.5 inches of sea level rise (from the year 2020). In Tampa, this equates to minimal impacts, which would be concentrated to specific areas along the coast – in Sunset Park roadways, in the Old Port Tampa area east of Picnic Island, Bayside Drive in Beach Park, low points along the Courtney Campbell Frontage Road, Maple and Oakwood Avenues in Palmetto Beach, and in coastal channels such as Lamb Canal. Inundation, in this scenario, is related only to streets and drainageways – it is most likely that no significant buildings, public or private, would be impacted by the 1-year stillwater event.
By 2070, in the intermediate high scenario, the areas mentioned above would have expanded impacts due to sea level rise, with the addition of Davis Islands, roadways near the base of the Gandy Bridge, the north end of Bayshore Boulevard, and isolated locations along the Hillsborough River.
The following maps were created to distinguish more clearly between flooding caused by water over-topping the coastal edge or water backflowing through hydraulic (piped) connections.
In the following drawings (beginning with Figure 14):
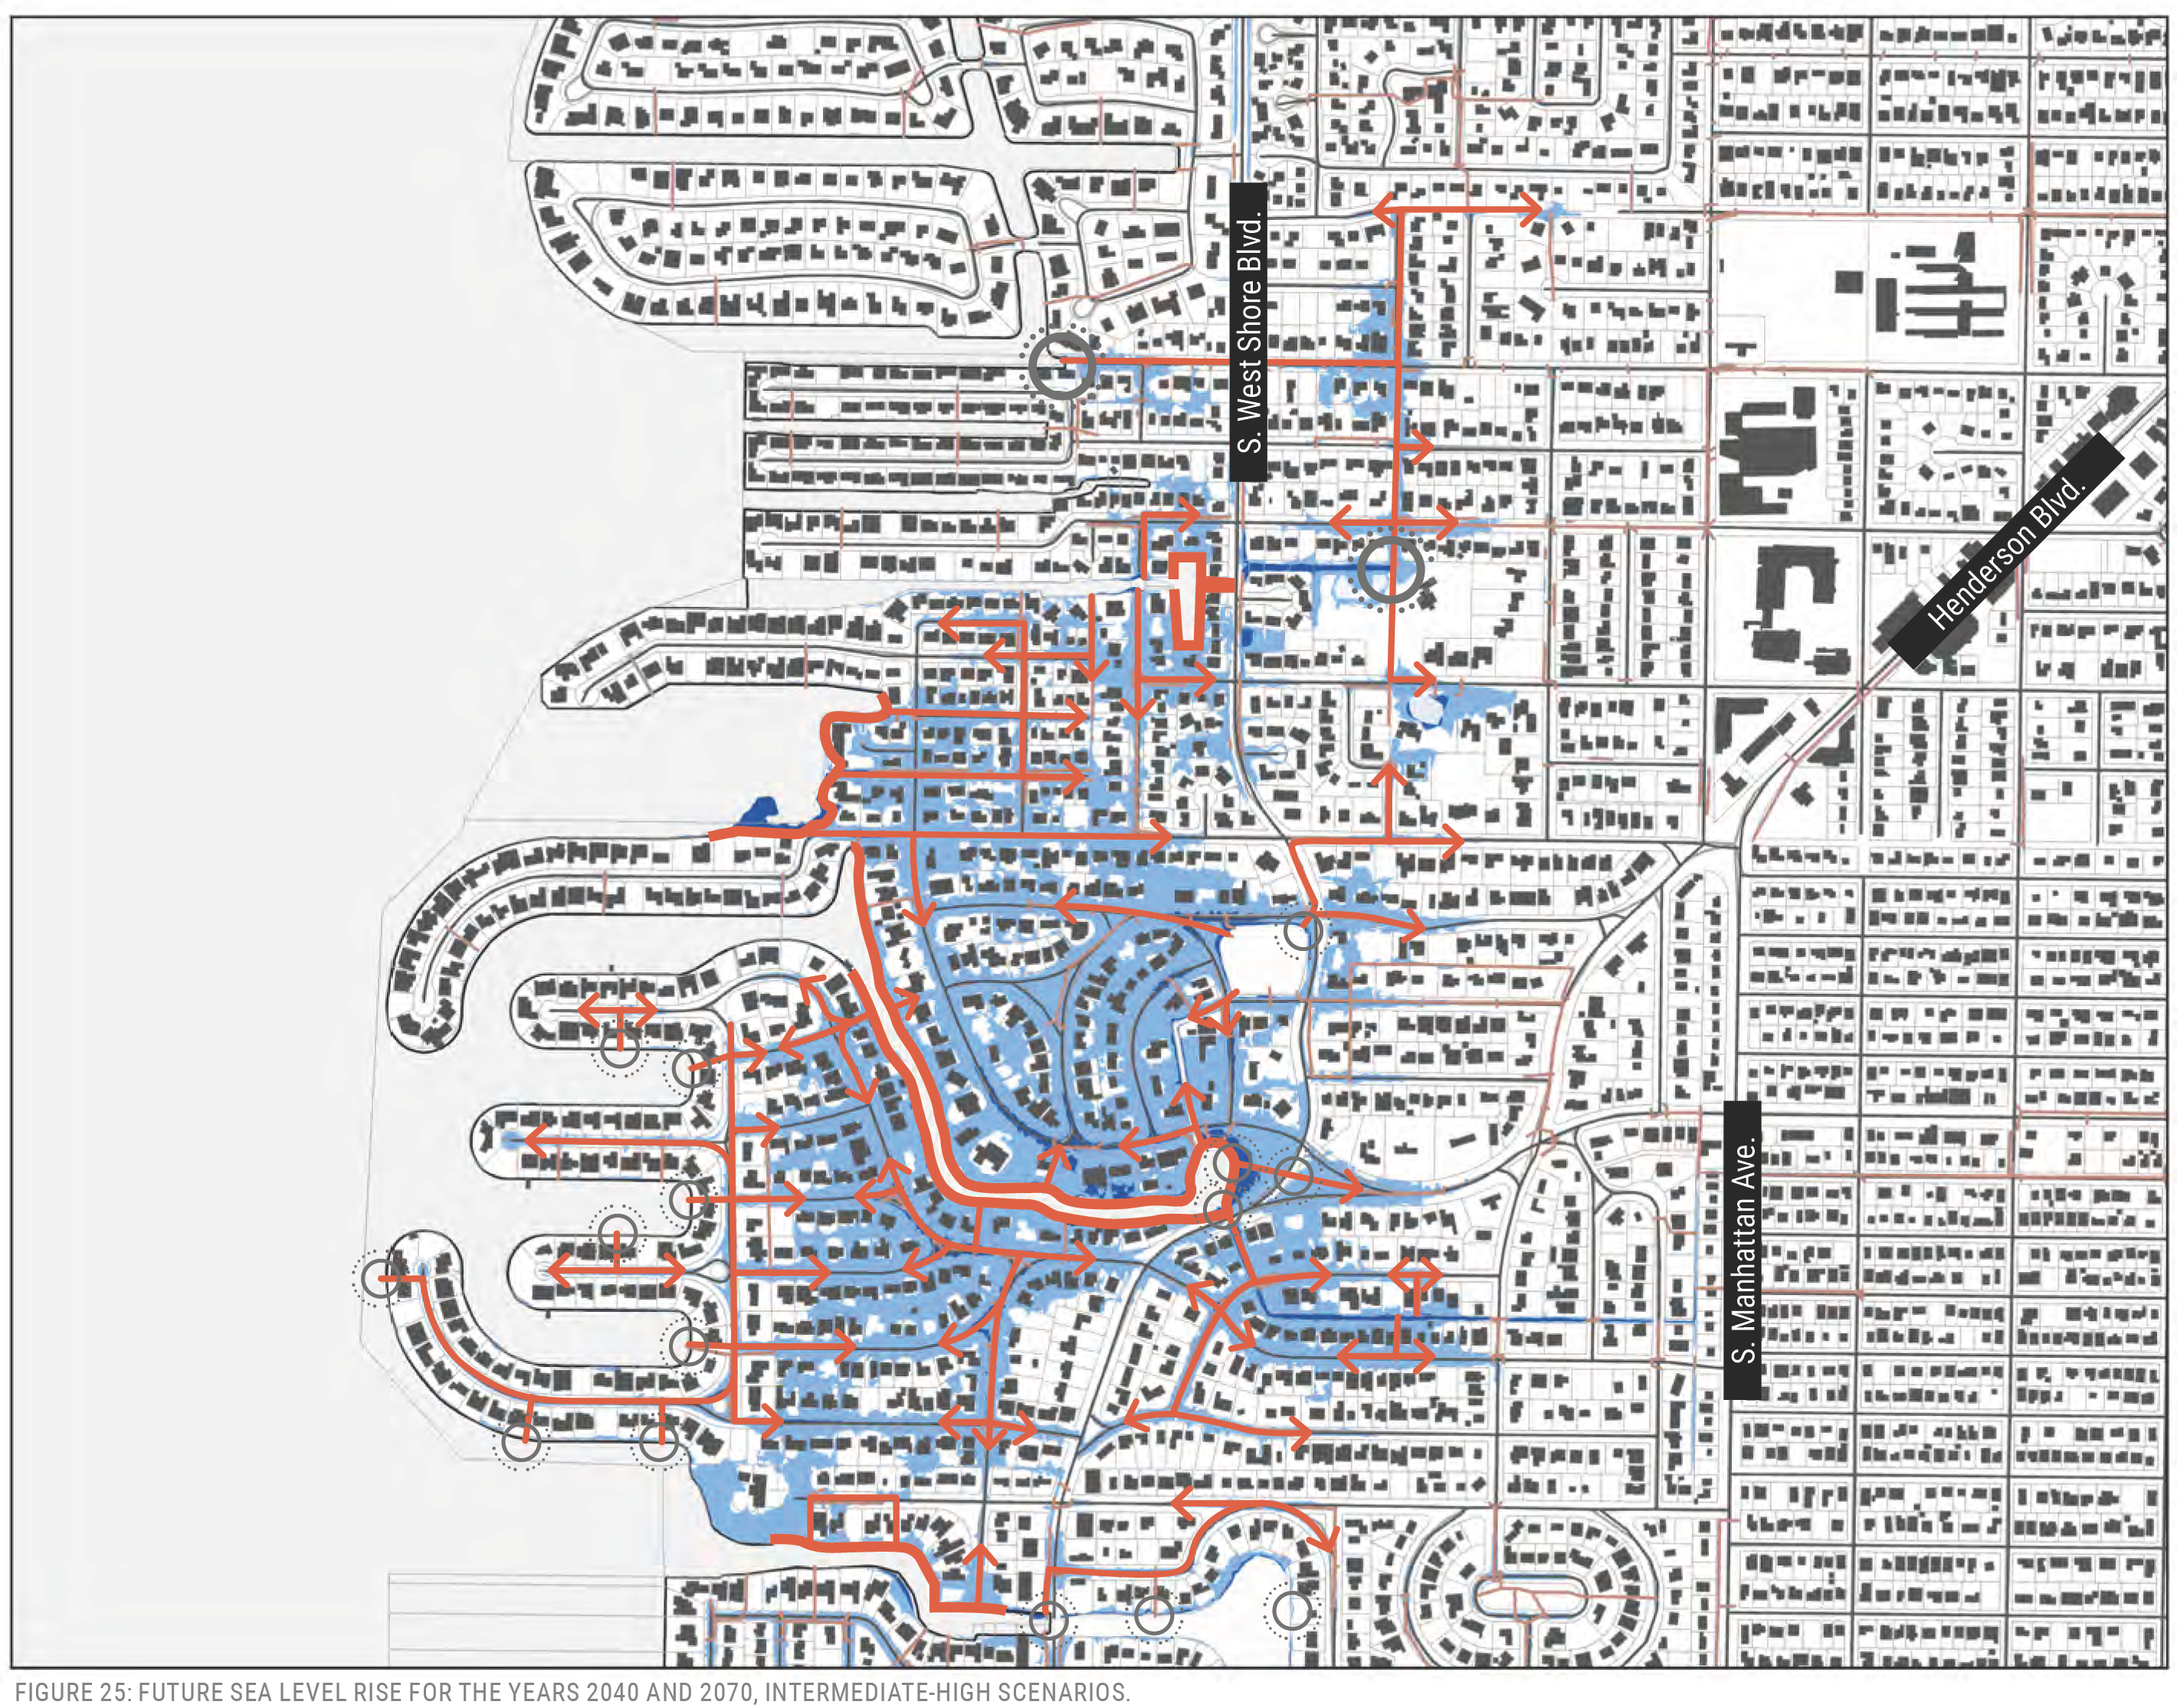
- A solid line at the coast indicates overtopping due to the water reaching the 2070 intermediate-high 1-year stillwater elevation.
- Outfalls noted with a circle represent locations where water is penetrating the coastal edge and causing inland flooding by backflowing through inland inlets and entering the street.
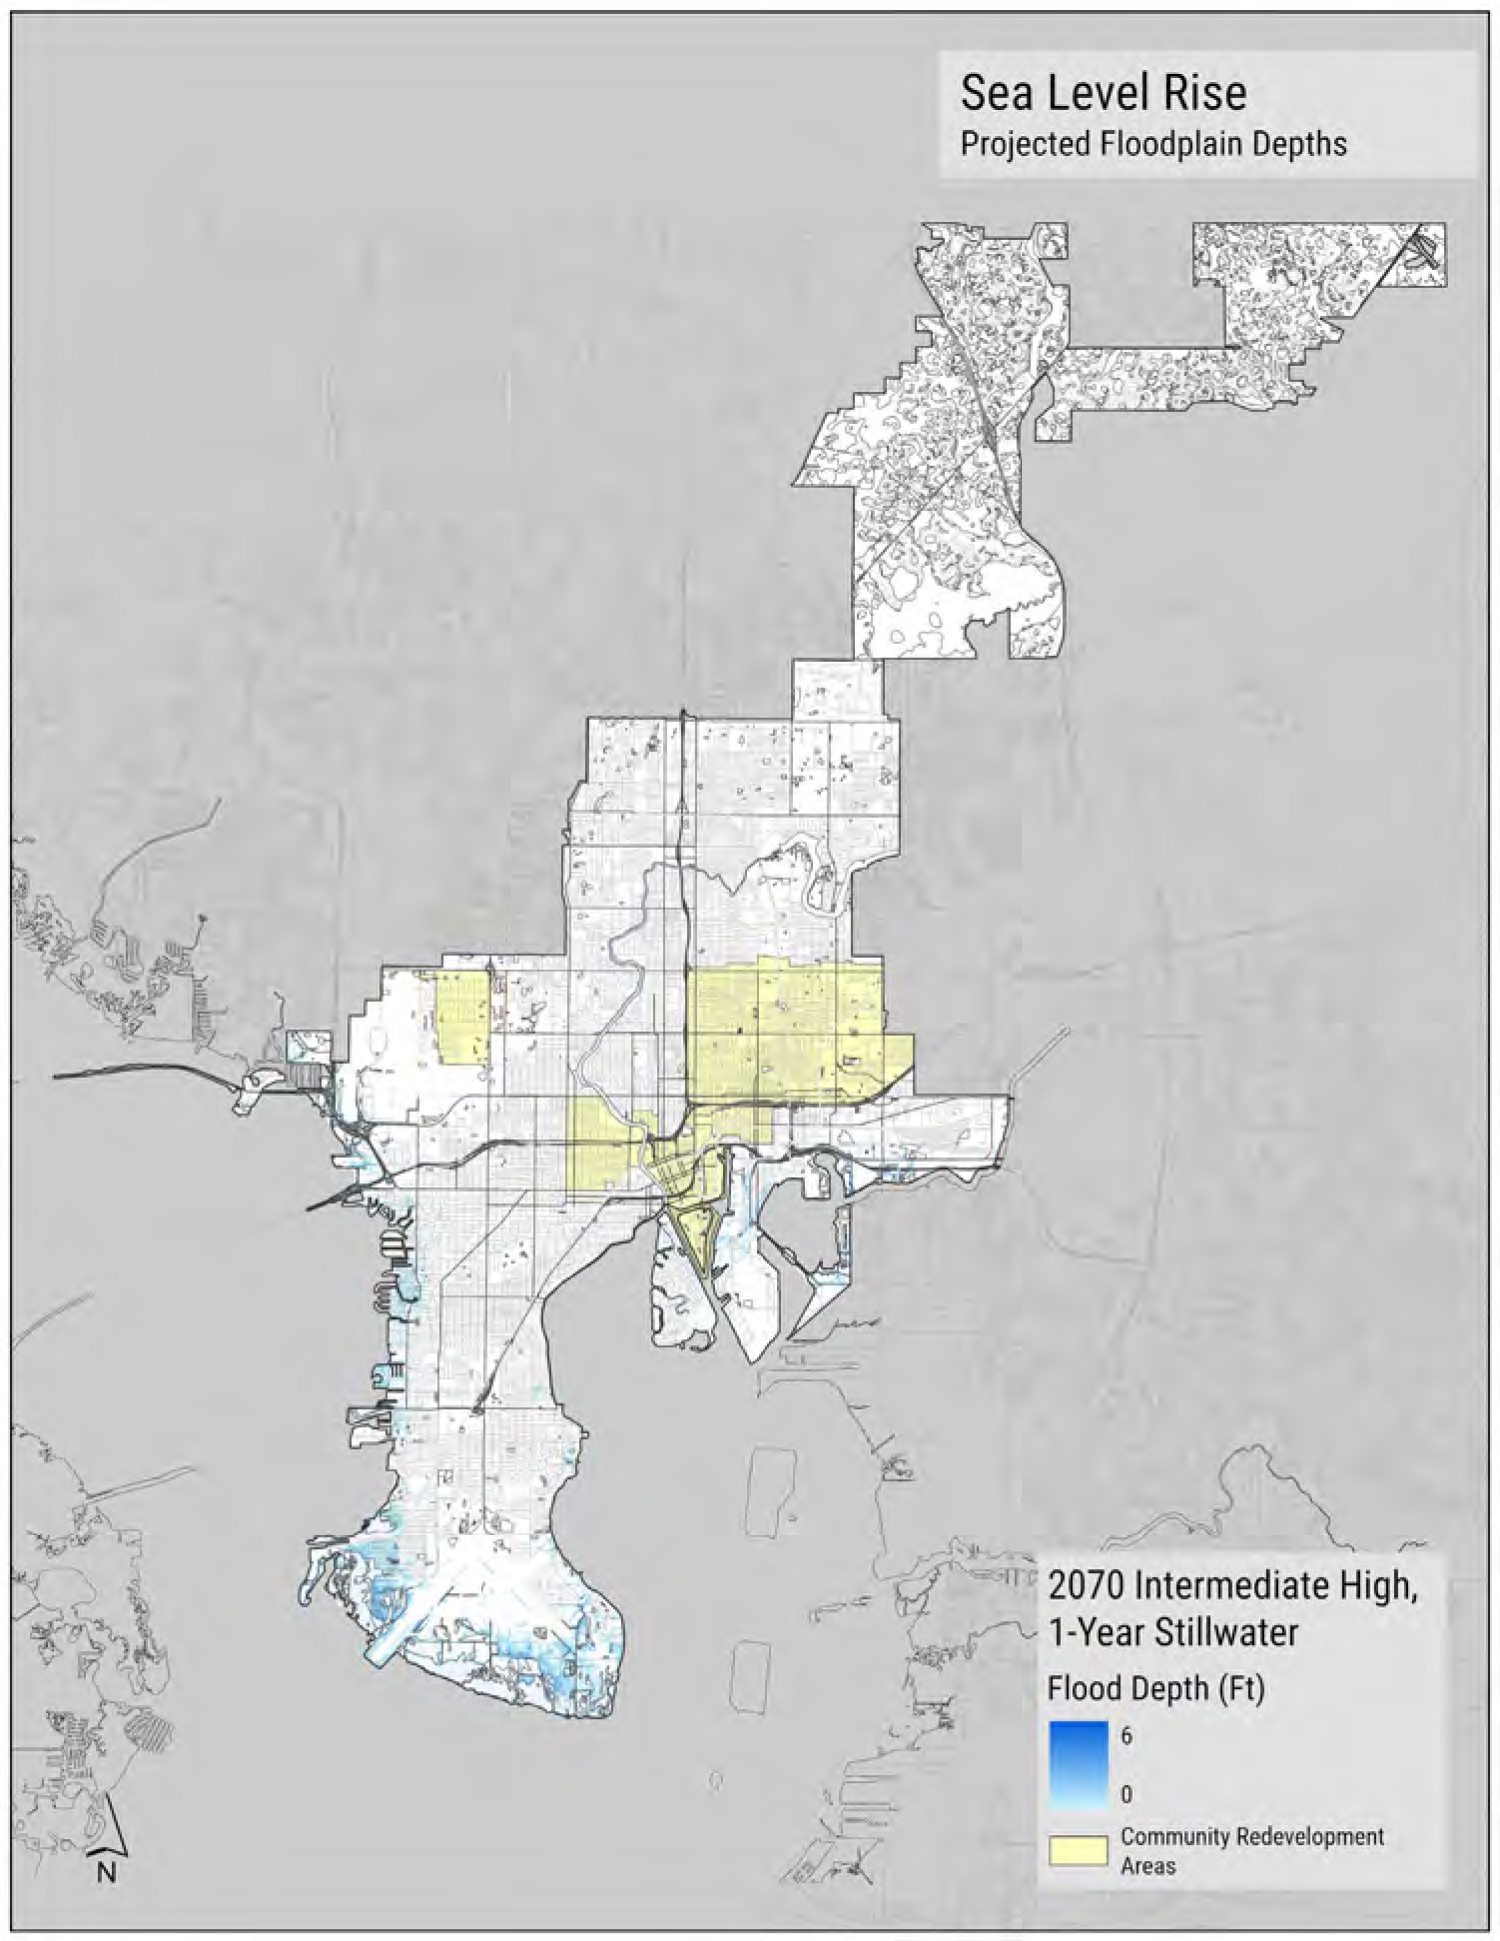
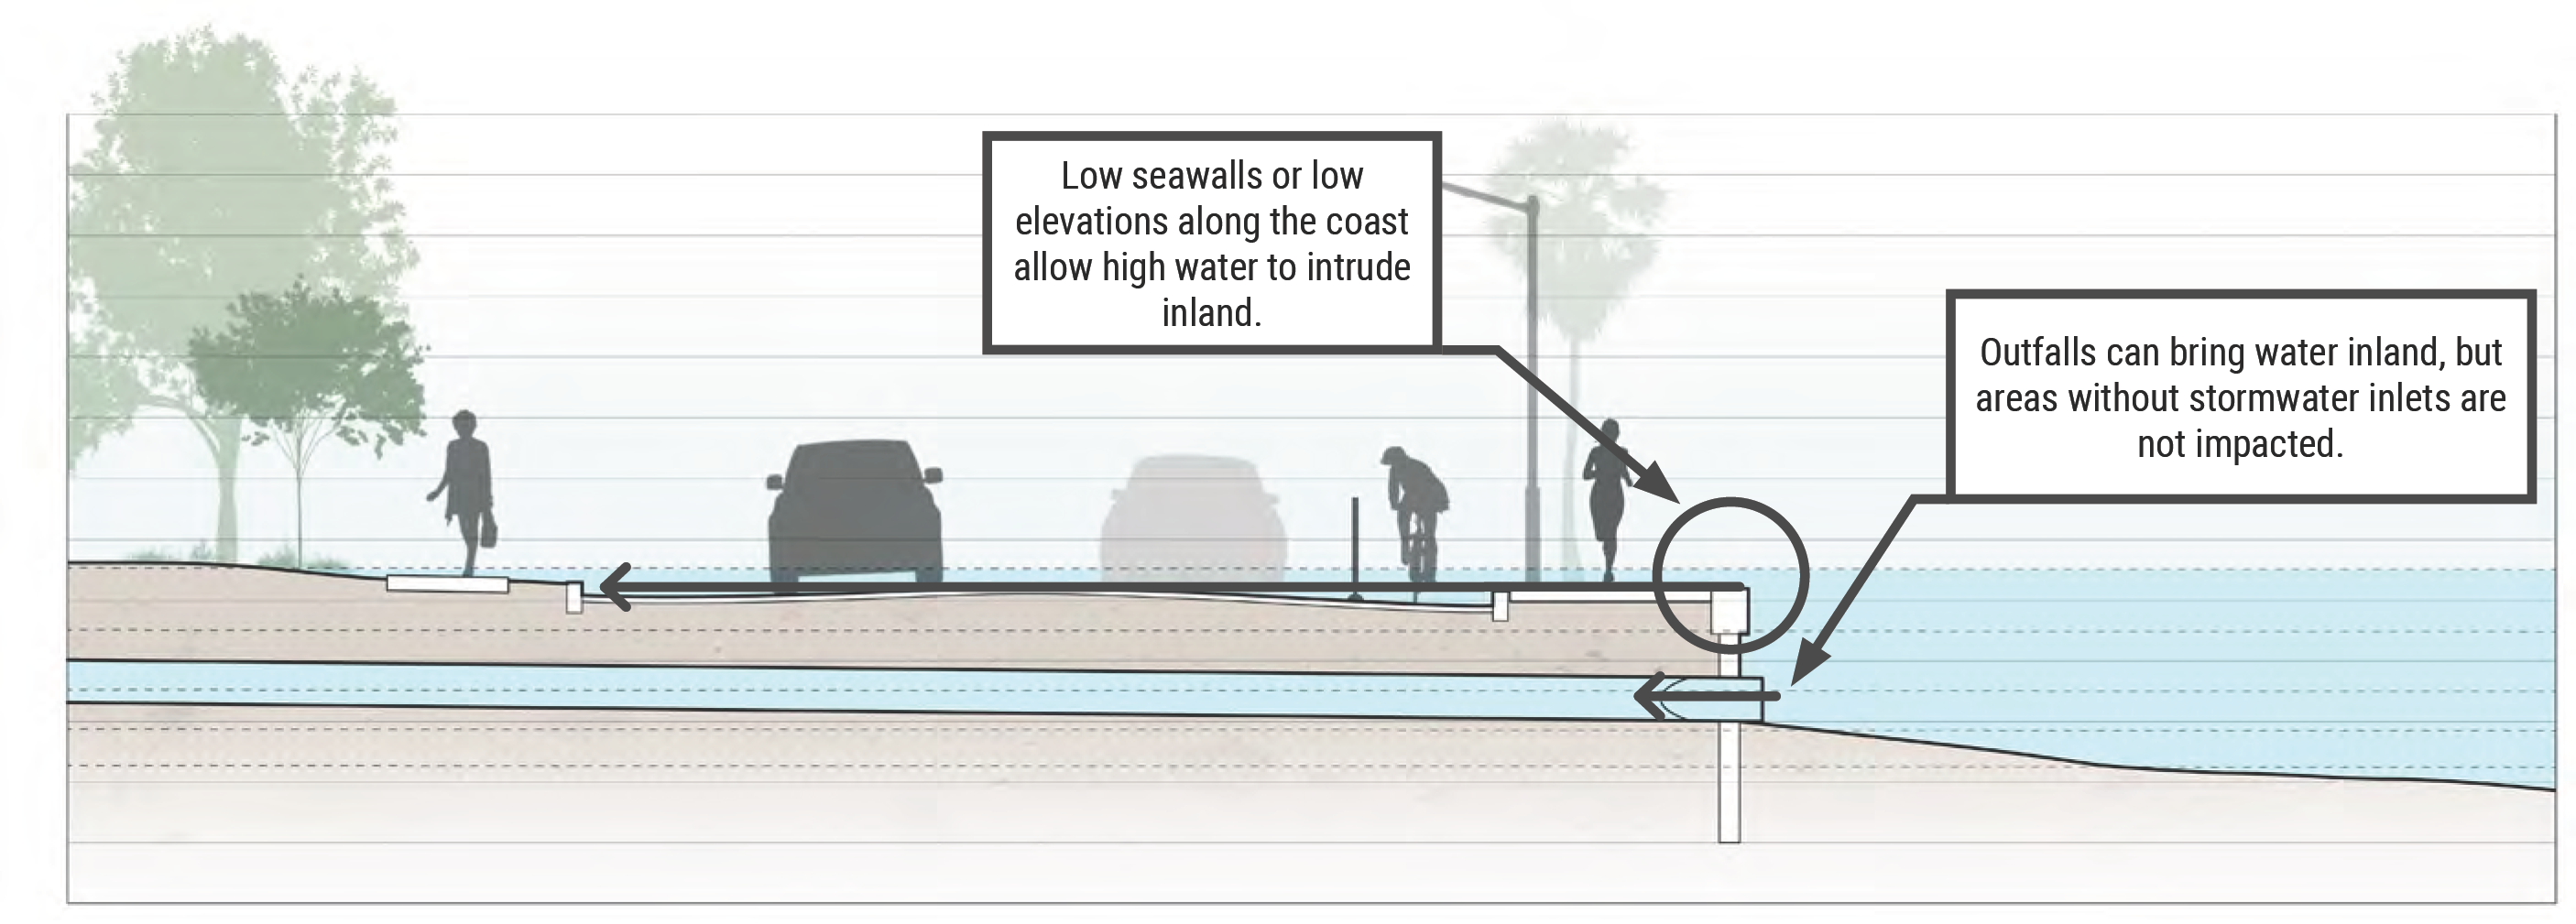
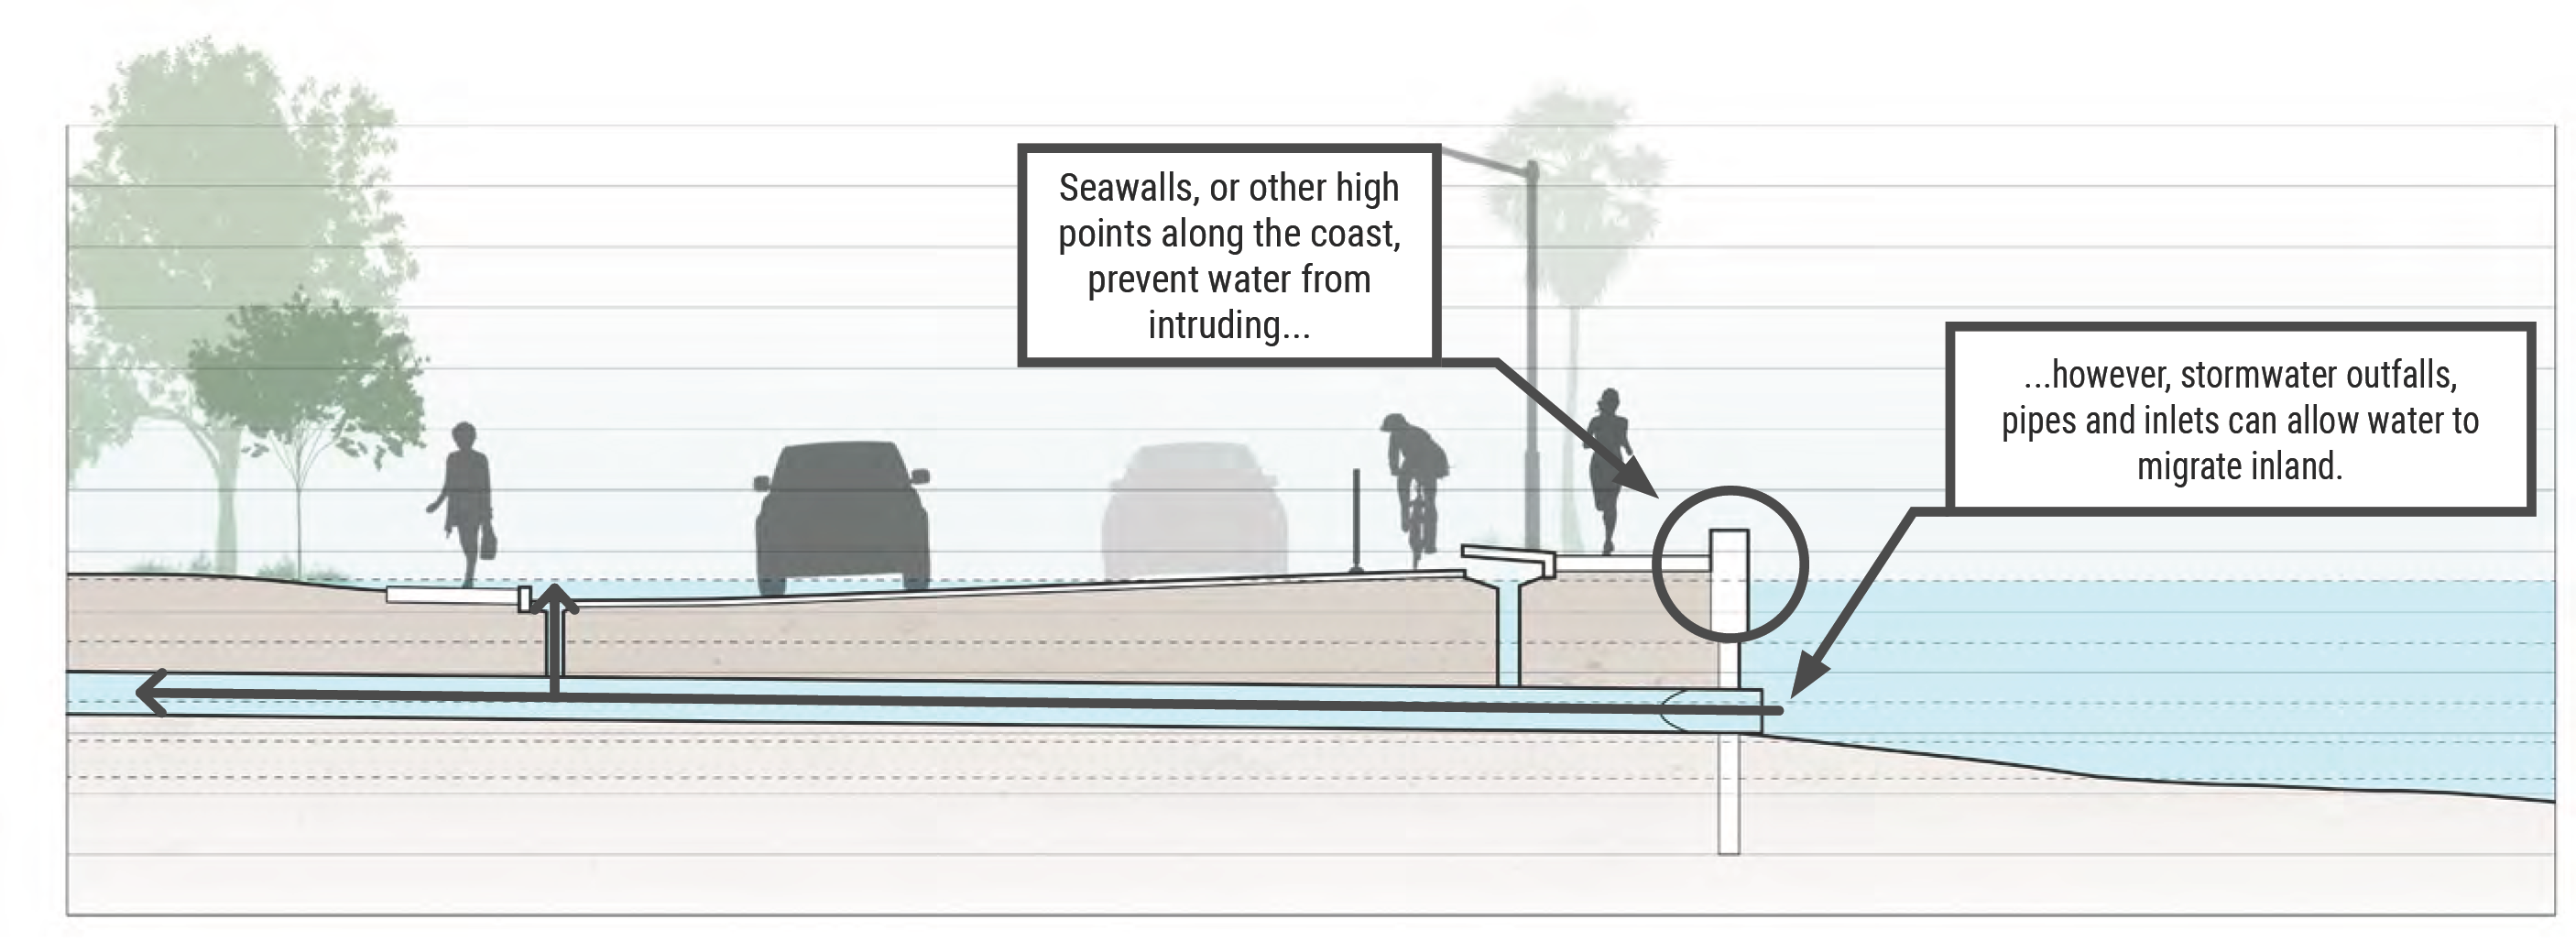
FIGURE 9: SEA LEVEL RISE AND COASTAL CONDITIONS.
McKay Bay / Palmetto Beach
McKay Bay and Palmetto Beach are extremely susceptible to inland flooding from high tides. The community’s geography is characterized by an inland bowl just west of the coastline. Inlets at low points are connected to outfalls, which provide an entry point for rising tides. Each is connected by unique runs of pipe and can be associated with one of 12 outfalls along the Bermuda Boulevard seawall. High tide flooding was caused recently Hurricane Idalia, which passed 100 miles west of the city in 2023. During this event tides reached 5.42 feet, overtopping the seawall and filling the storm system to create more than 2 feet of flooding on interior streets. A preliminary study has been completed by Applied Sciences and the City of Tampa to better understand flooding issues in this community and the potential for seawall replacement.
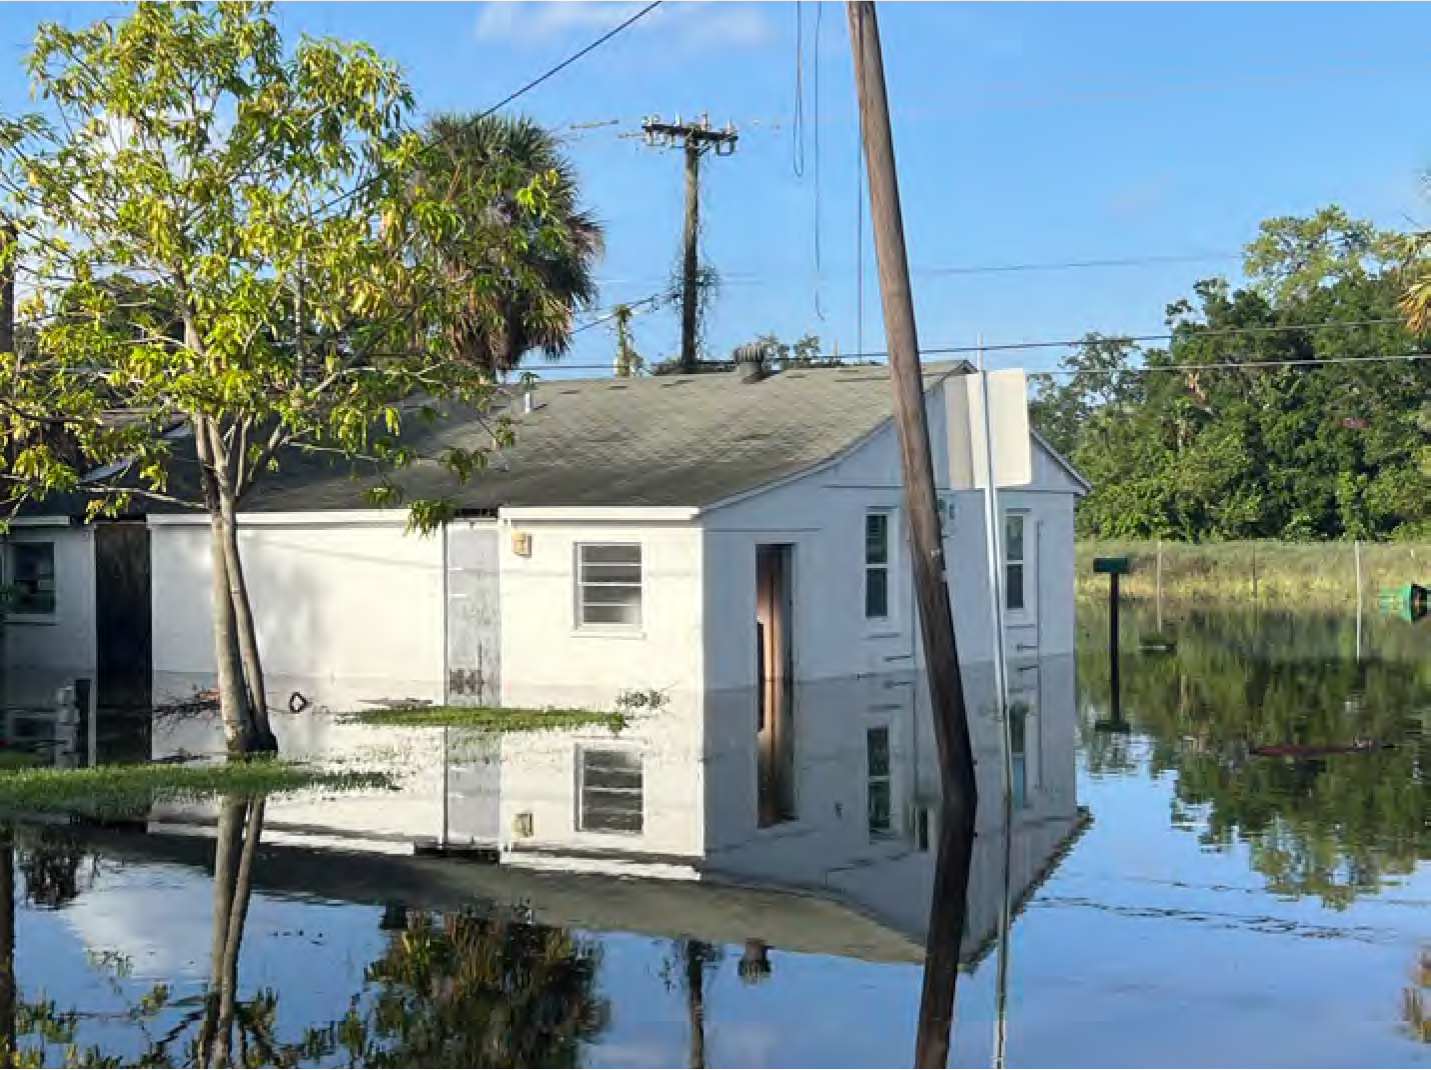
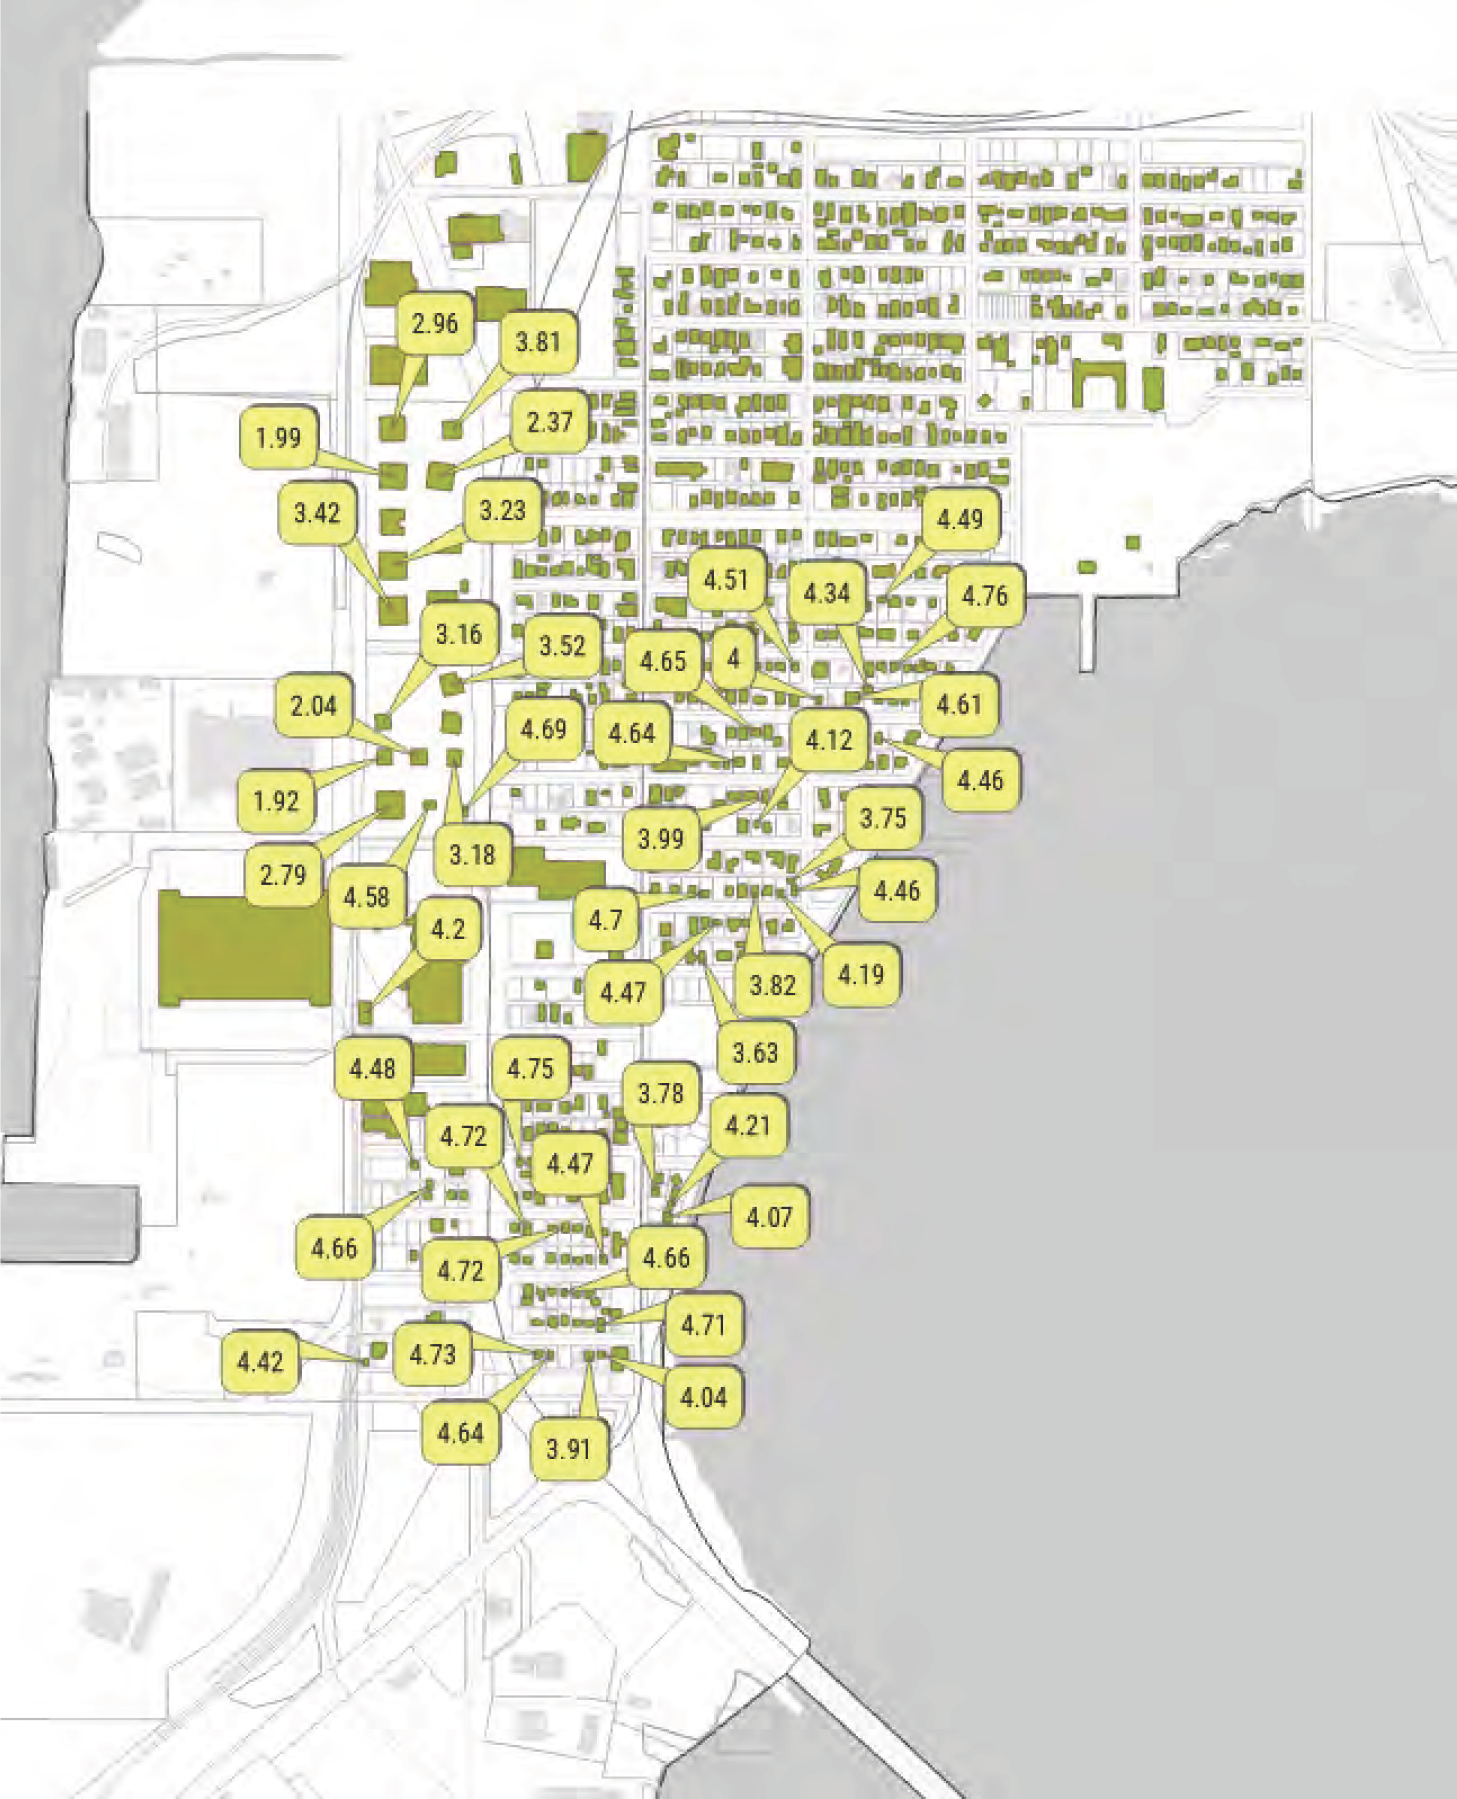
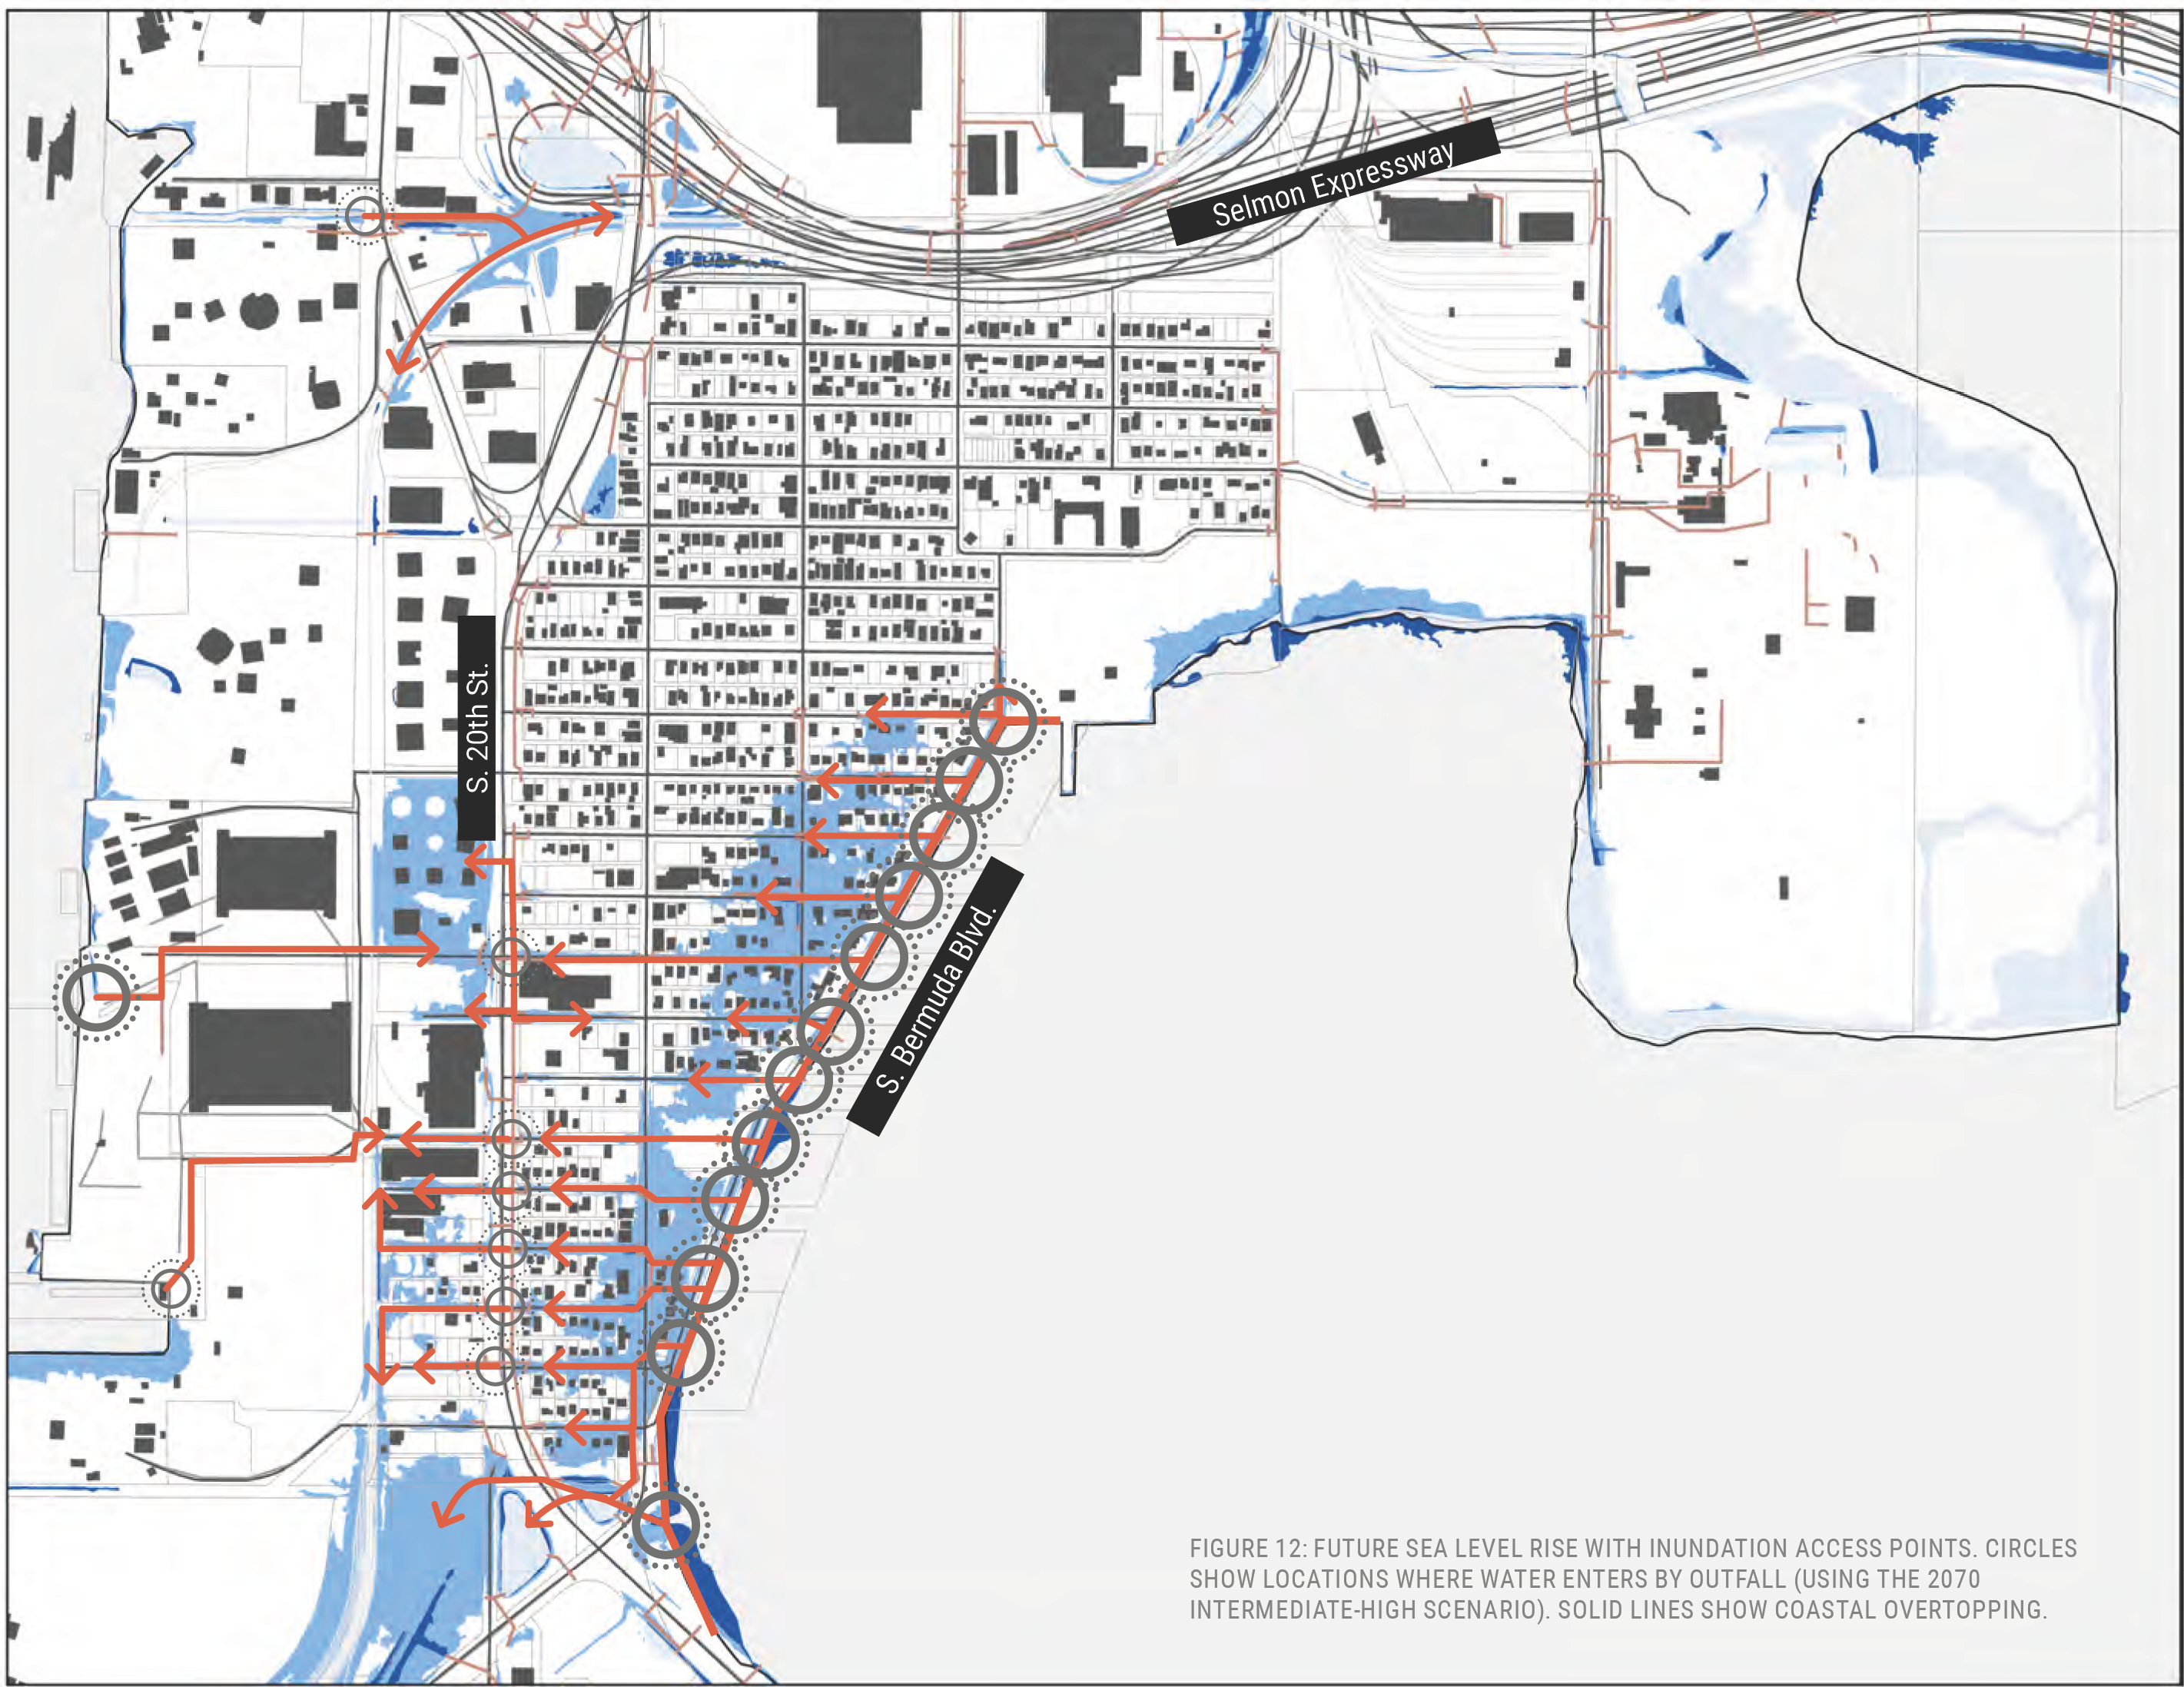
FIGURE 12: FUTURE SEA LEVEL RISE WITH INUNDATION ACCESS POINTS. CIRCLES SHOW LOCATIONS WHERE WATER ENTERS BY OUTFALL (USING THE 2070 INTERMEDIATE-HIGH SCENARIO). SOLID LINES SHOW COASTAL OVERTOPPING.
Upper Bayshore Boulevard and Davis Islands
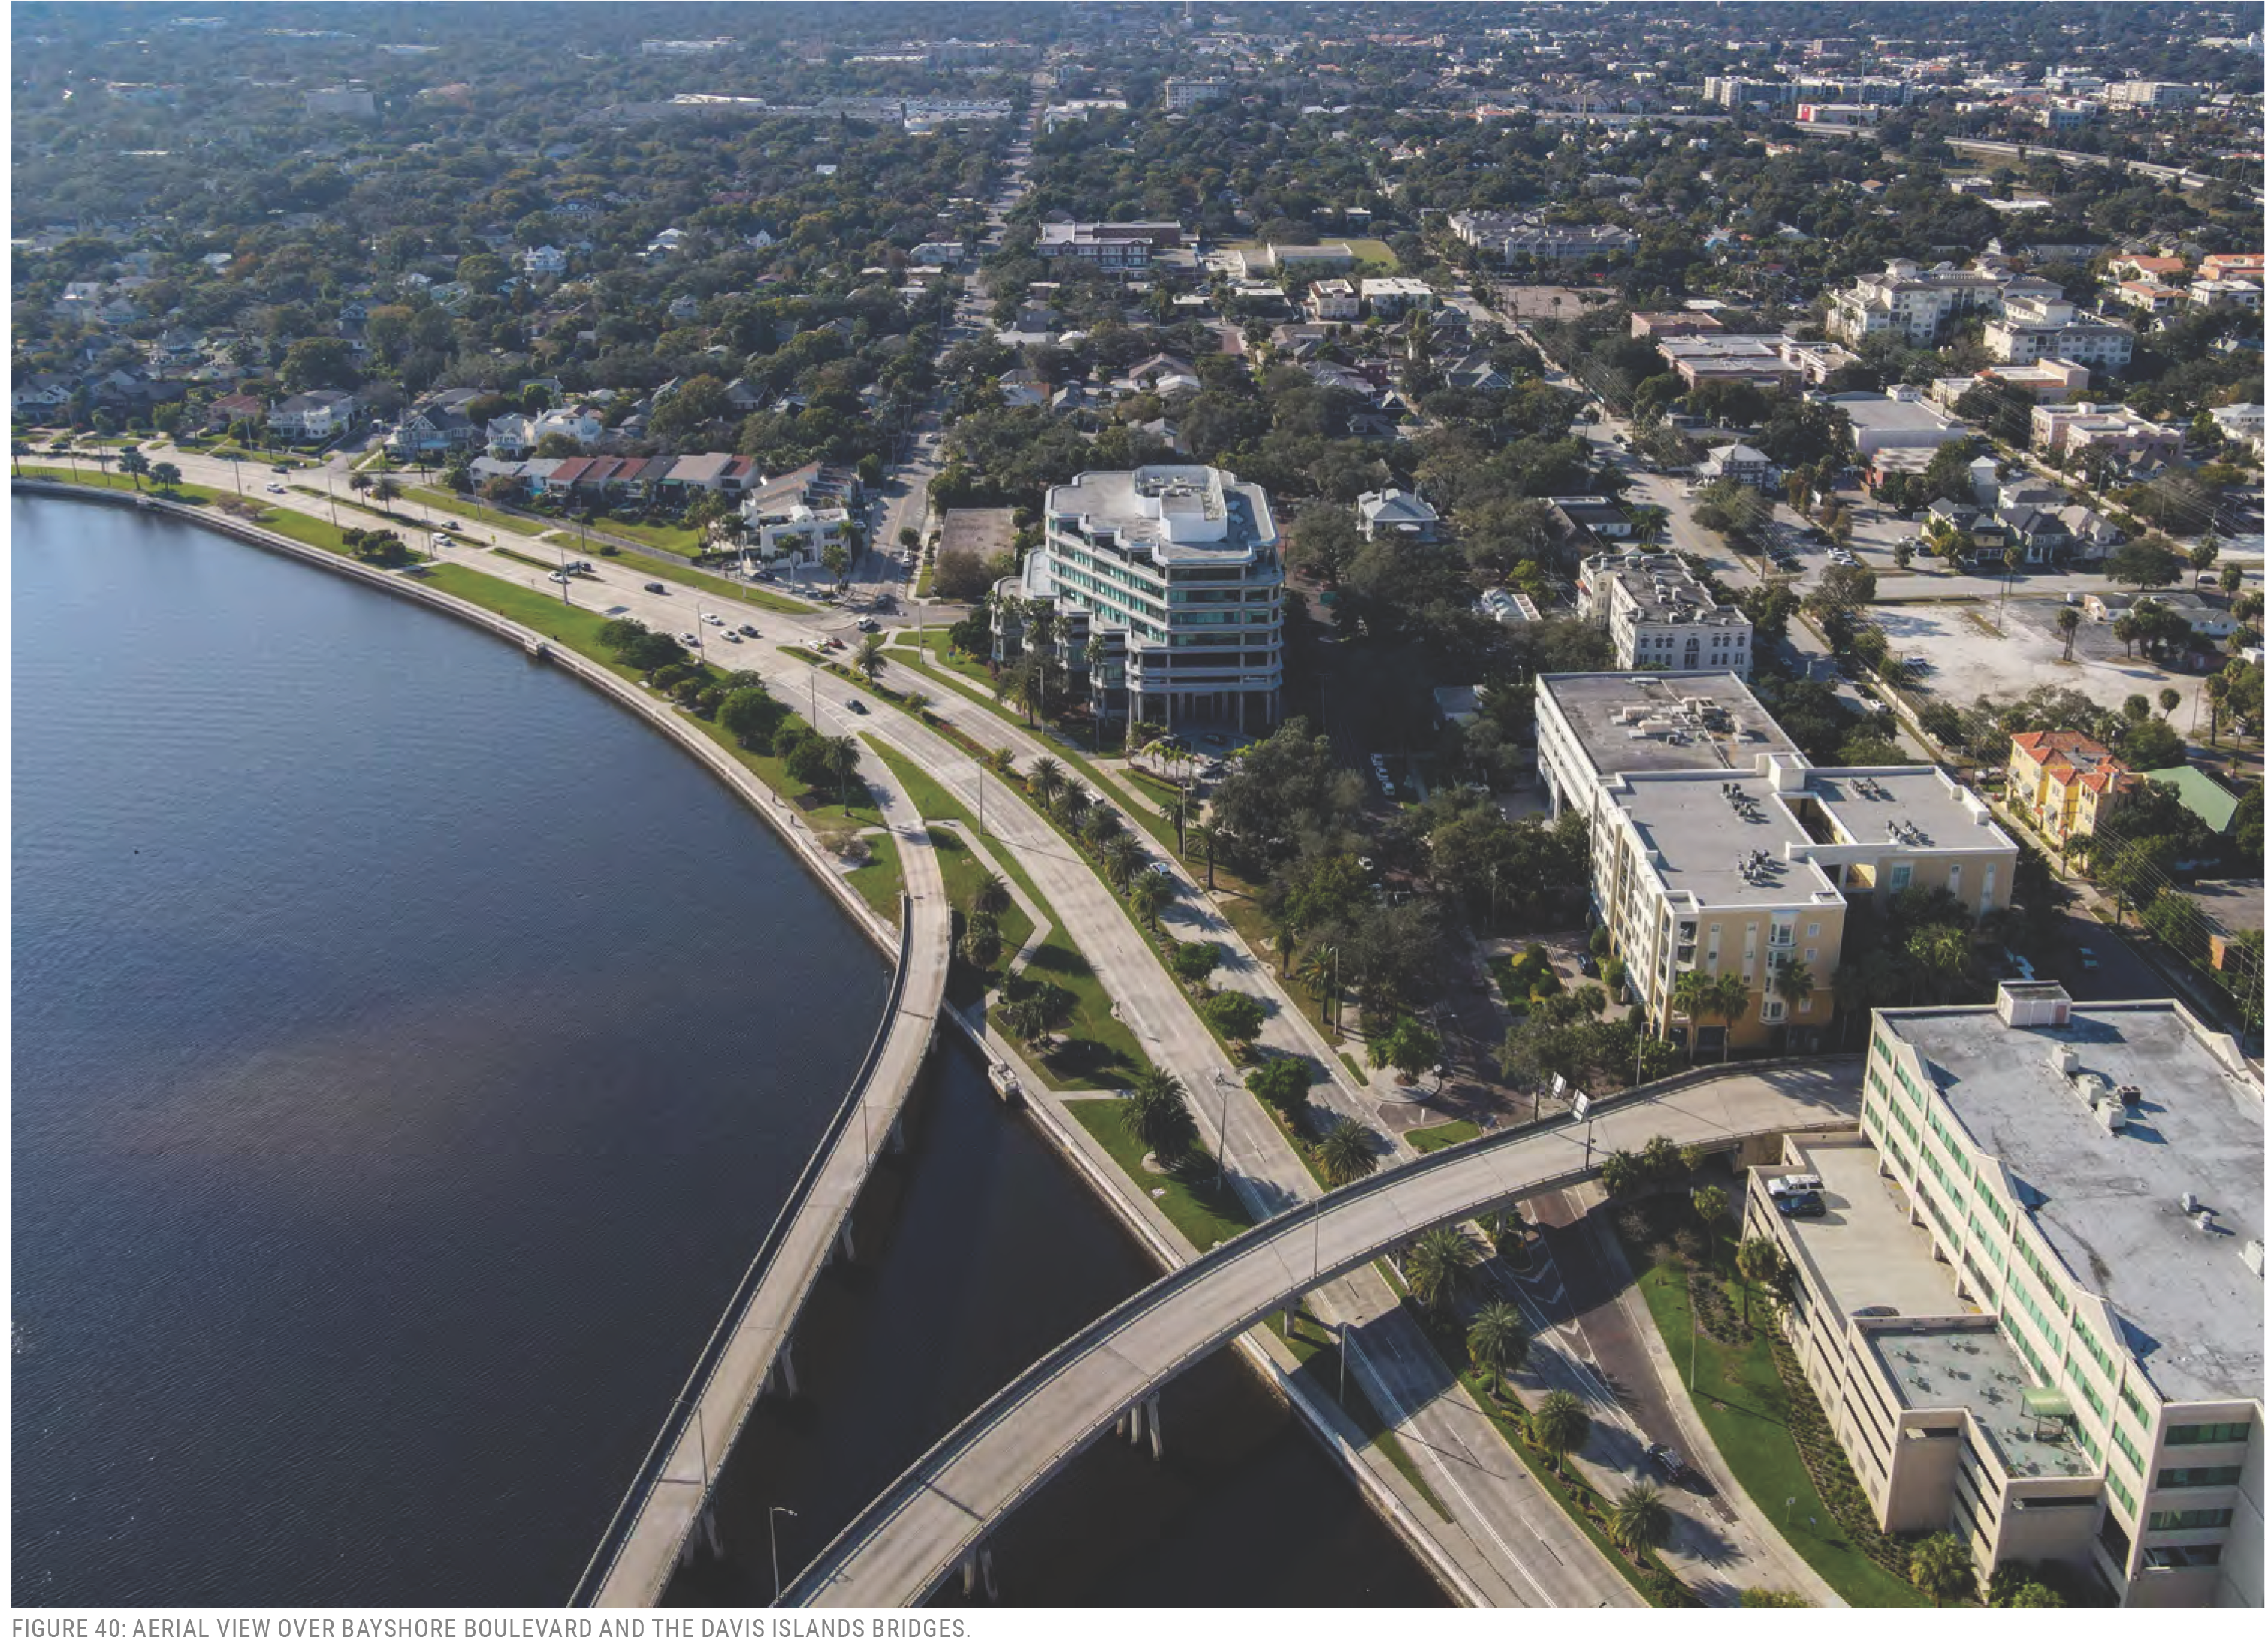
Bayshore Boulevard developed as a scenic automobile route connecting downtown to the South Tampa peninsula. It is lowest at the north end near the location of the historic Spanishtown Creek (between West Platt Street and South Rome Avenue), which is now piped below ground. The 2070 intermediate-high scenario shows the entirety of the roadway – in both directions –affected by the 1-year stillwater event. The seawall height is approximately 4.2 feet in this area. Multiple inlets along this stretch of Bayshore Boulevard are near elevation 2.5 feet. These low-lying inlets, near the Swann Avenue intersection for example, could see regular high tide flooding as soon as 2040 via piped connections between outfalls and roadway inlets.
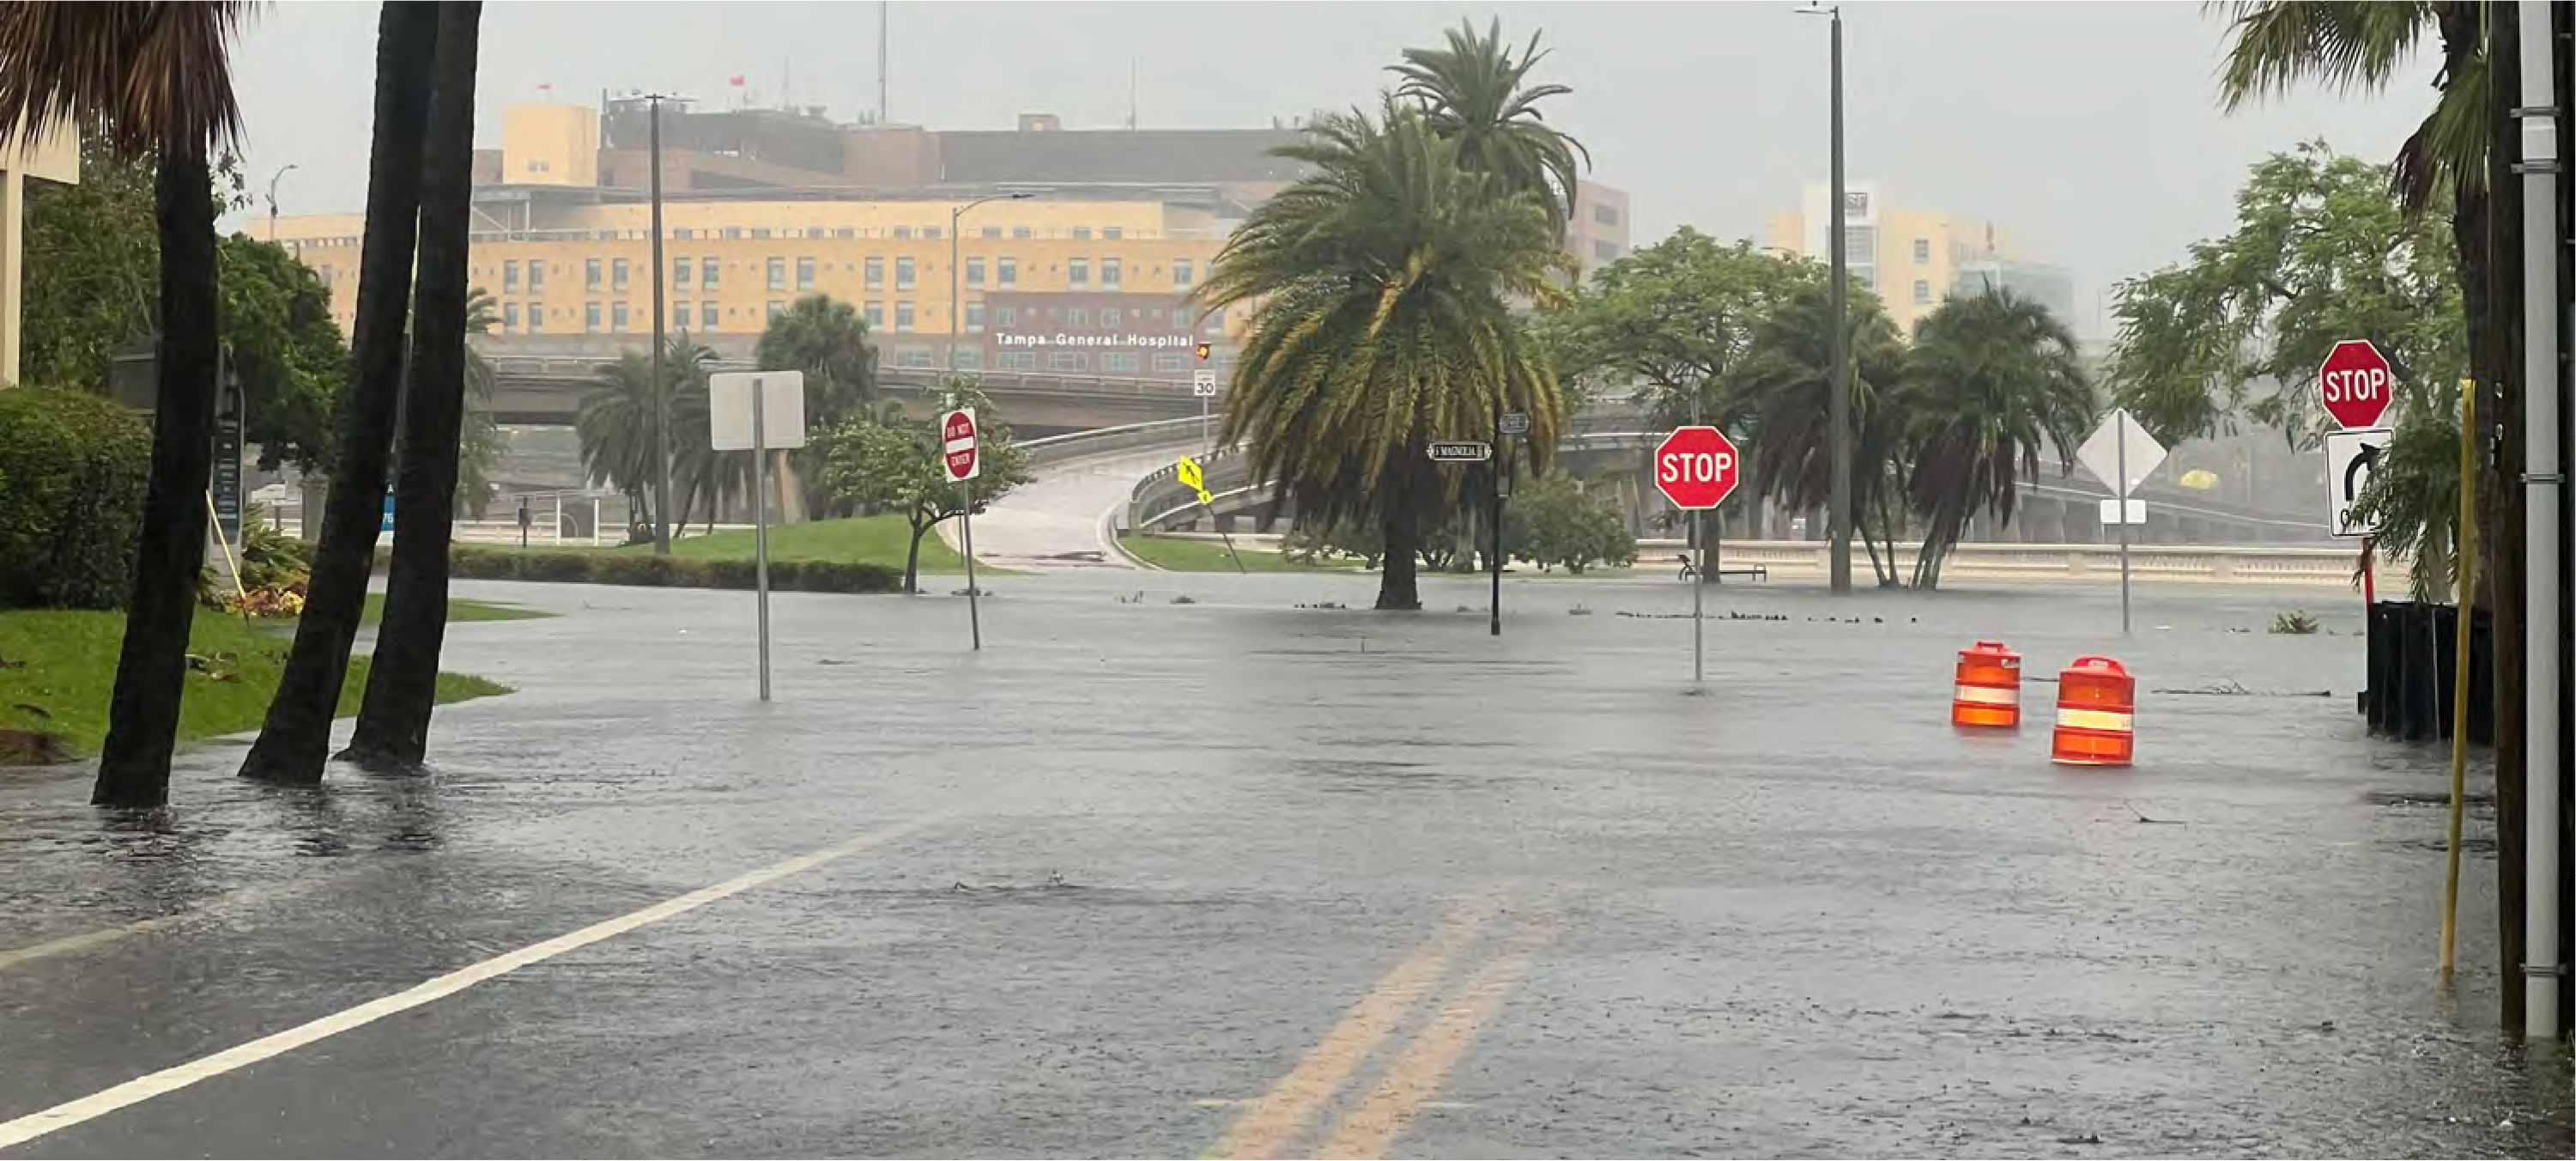
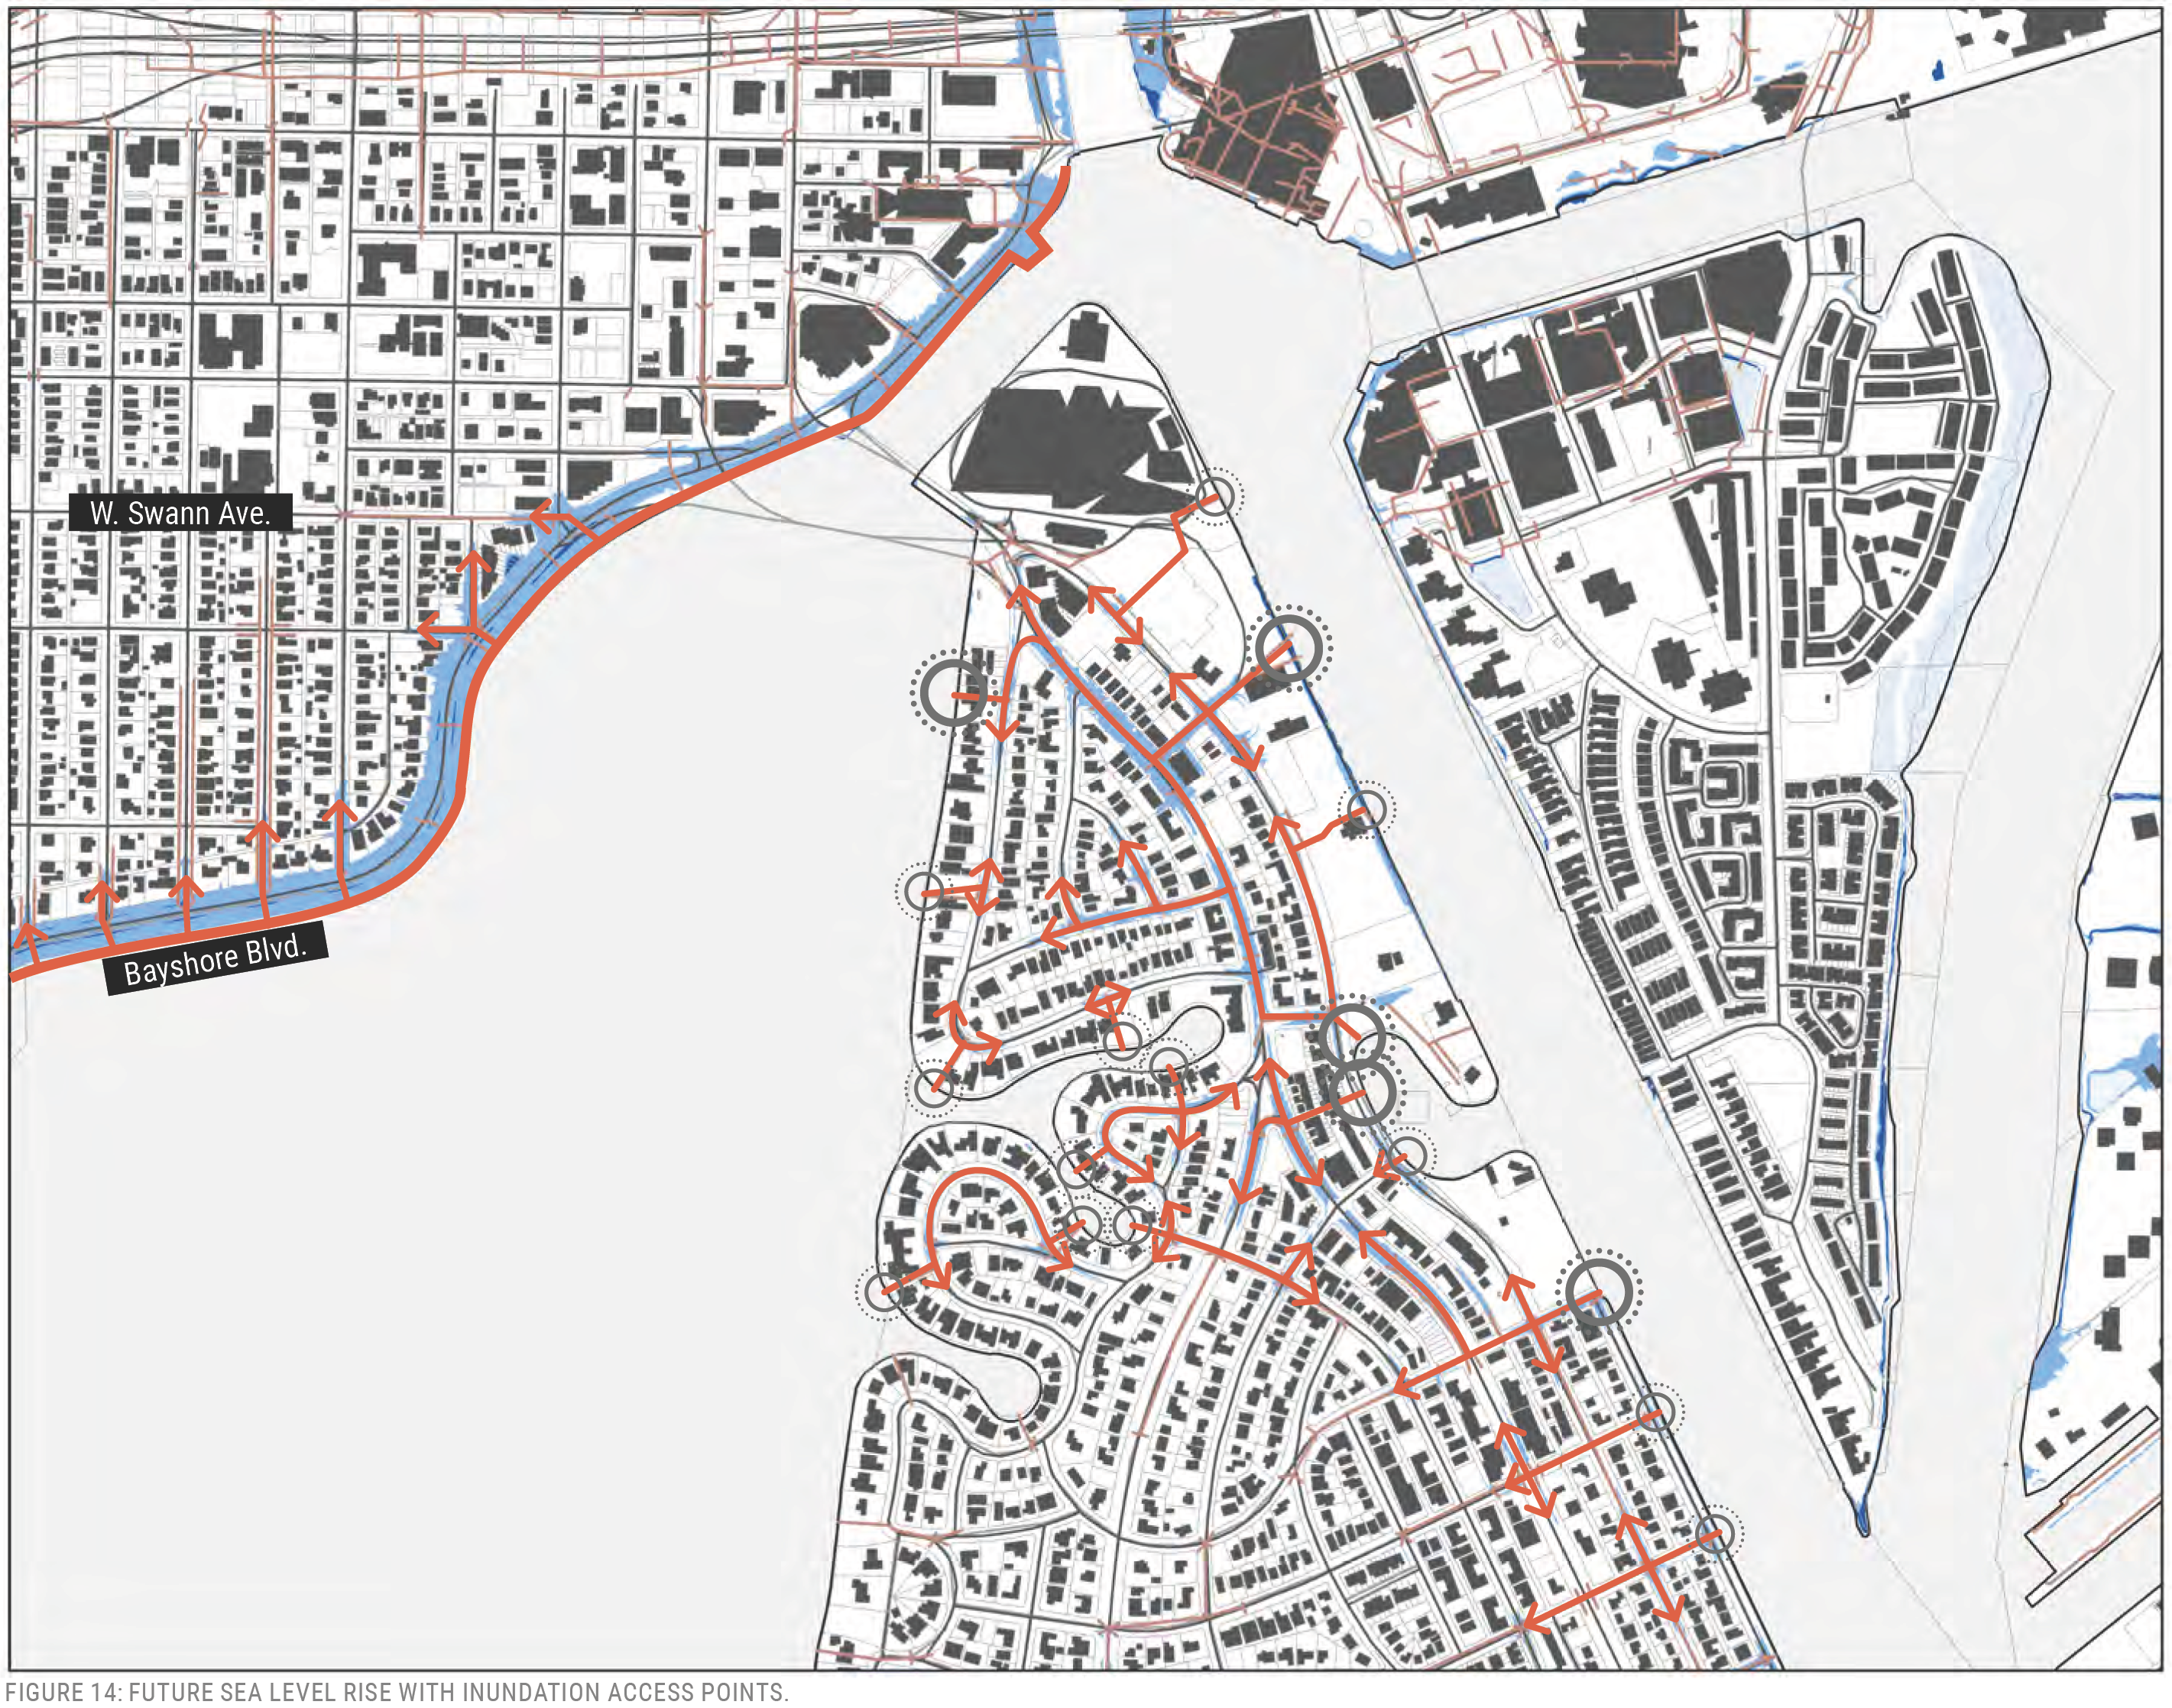
FIGURE 14: FUTURE SEA LEVEL RISE WITH INUNDATION ACCESS POINTS.
Davis Islands was constructed in the 1920’s when D.P. Davis placed fill on top of two small islands to create a new community development. The area’s perimeter is mostly bound by seawalls and the interior is built to grades consistently between elevation 5 and 7 feet NAVD88. Some of the interior roads may be susceptible to high tide flooding with the 2070 intermediate-high scenario. There are multiple outfalls that drain the island. These points of entry may allow water to extend to interior roadways through hydraulic connections, exiting the inlets to create flooding. The locations where this is of greater concern are shown with larger circle symbology in figures 16 and 23. The City of Tampa recently conducted a detailed evaluation of seawall heights and drainage outflows. This study revealed that, generally, most privately owned properties have a coastal boundary condition of 5 feet or higher. The seawall at Peter O. Knight Airport and along Channel Drive are lower than 5 feet, giving water potential access points. A consistent boundary condition, coupled with backflow prevention in the outfalls, can create perimeter protection from high tides. An elevation of 5 feet is the recommended sea wall elevation from the Tampa Bay Regional Planning Council’s Model Shoreline Ordinance (2022).
This community experienced significant flooding recently during Hurricane Helene, when waters rose to elevation 8 feet NAVD88, according to the nearby East Bay tide gauge (#8726674). This event overtopped seawalls and created extensive damage.
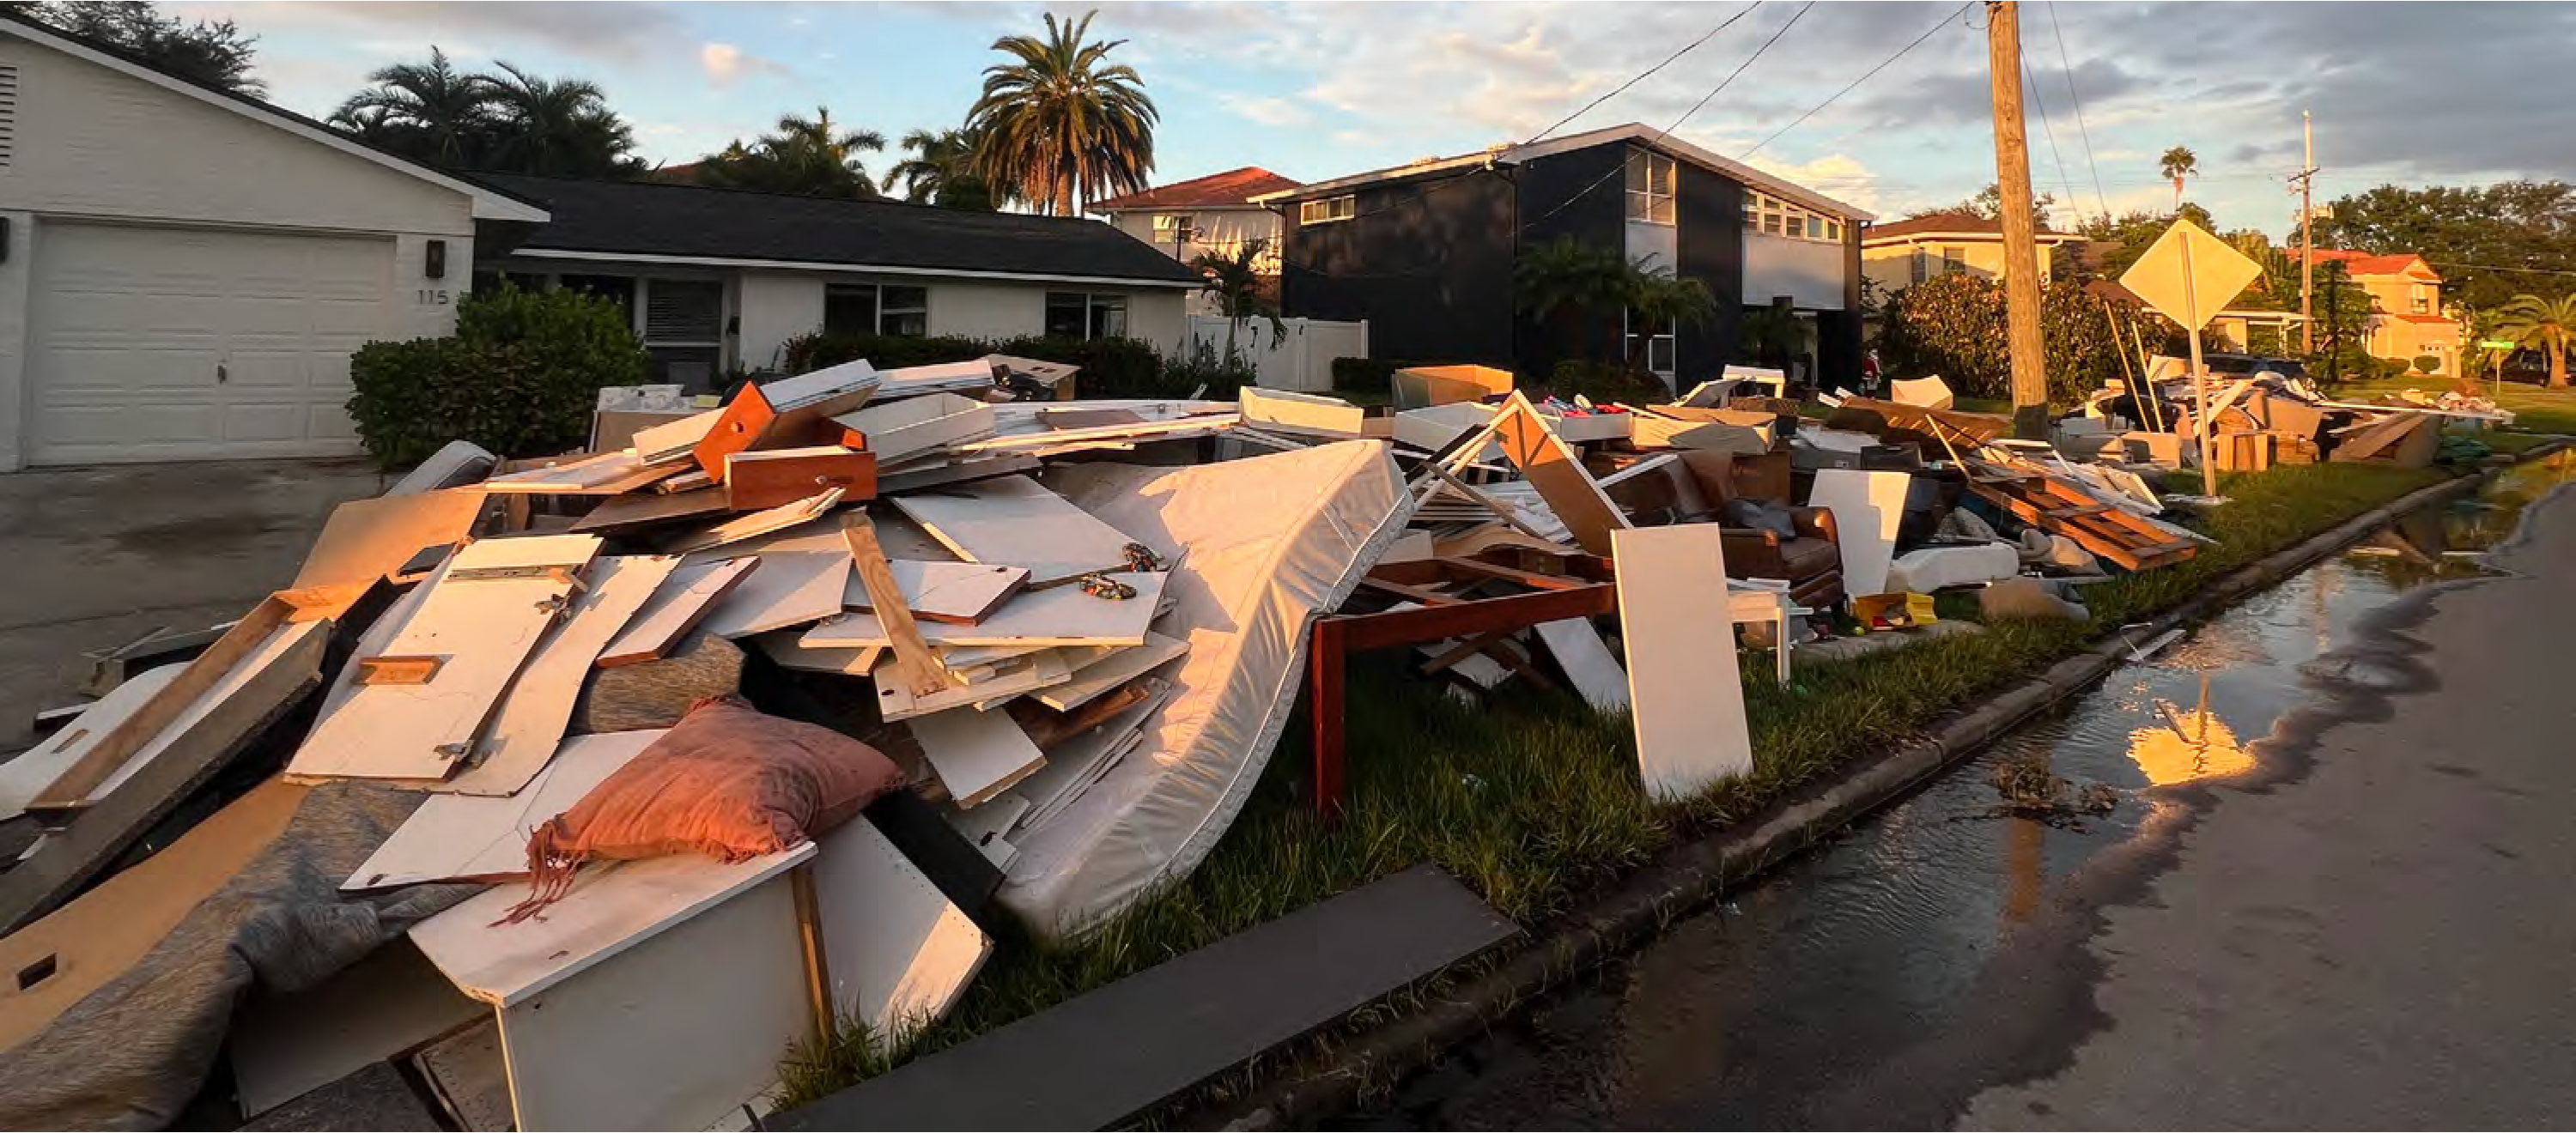
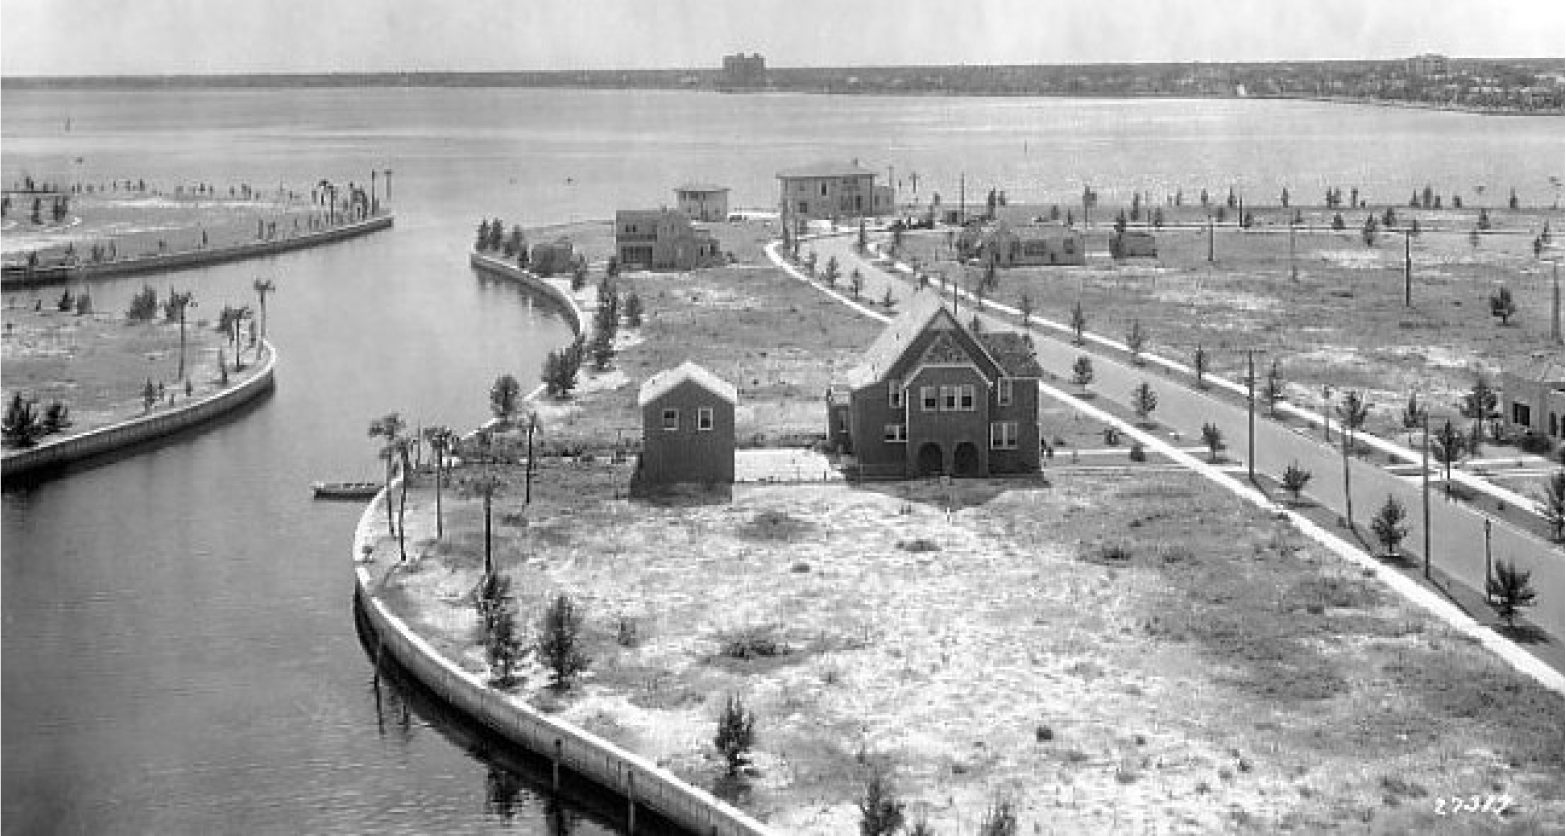
FIGURE 16: 1926 AERIAL OF DAVIS ISLANDS CONSTRUCTION.
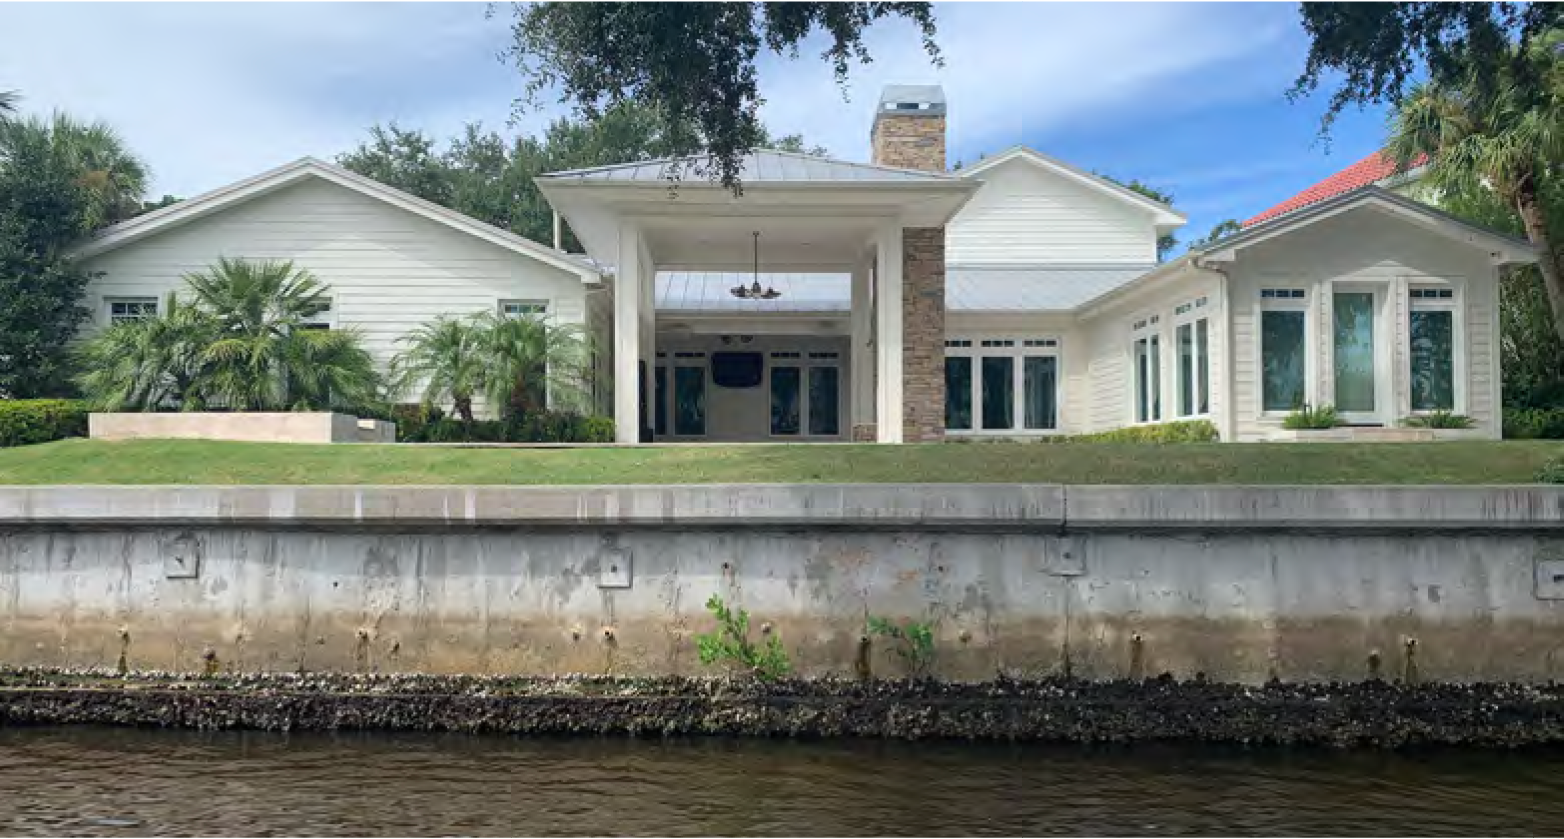
FIGURE 17: DAVIS ISLANDS HOME AND SEA WALL.
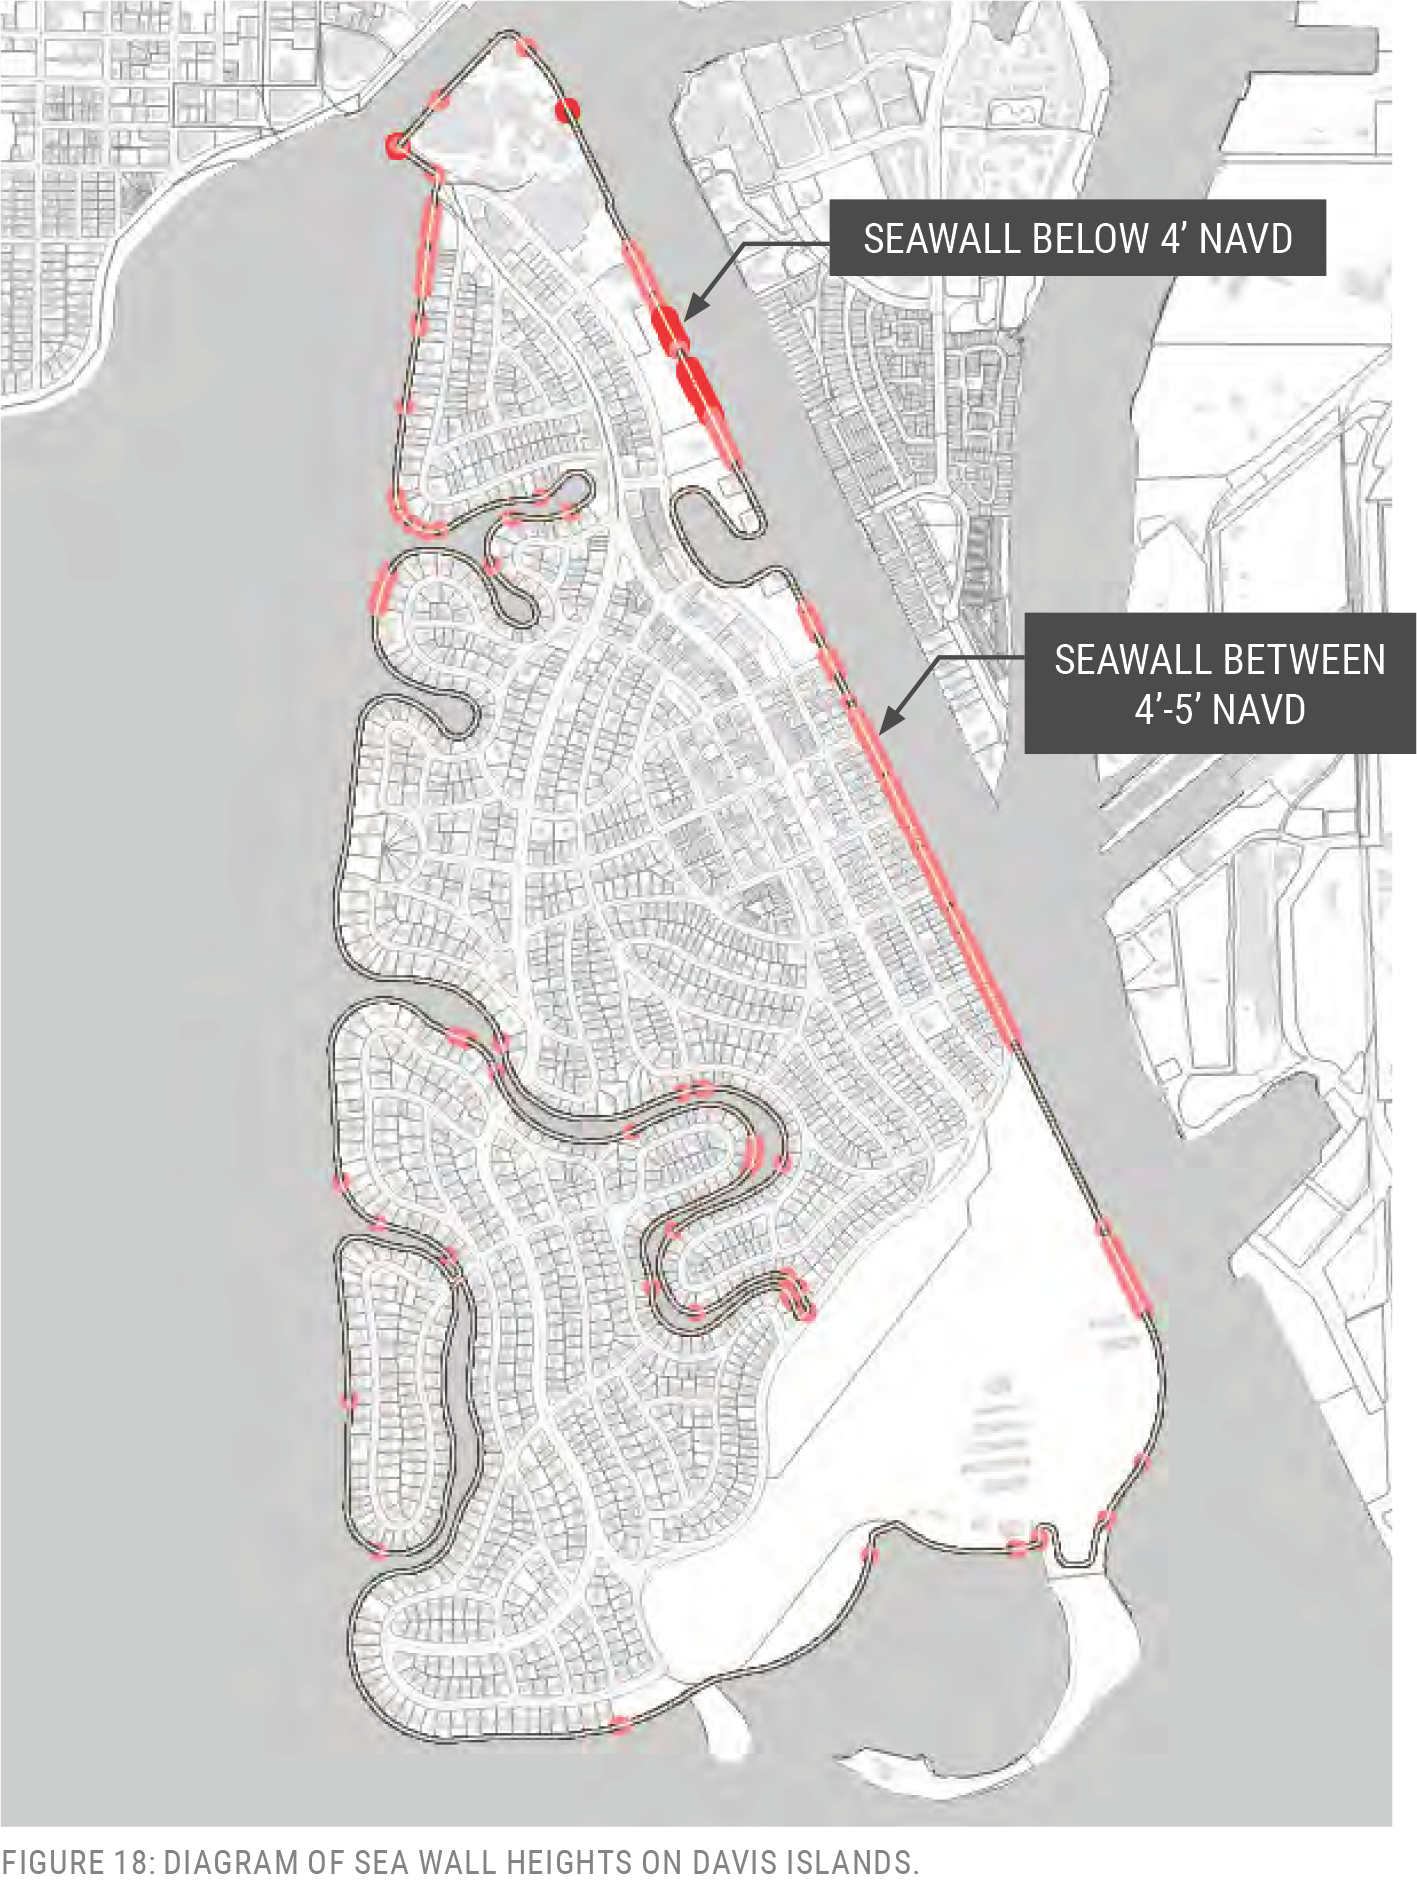
SEAWALL BELOW 4’ NAVD SEAWALL BETWEEN 4’-5’ NAVD FIGURE 18: DIAGRAM OF SEA WALL HEIGHTS ON DAVIS ISLANDS.
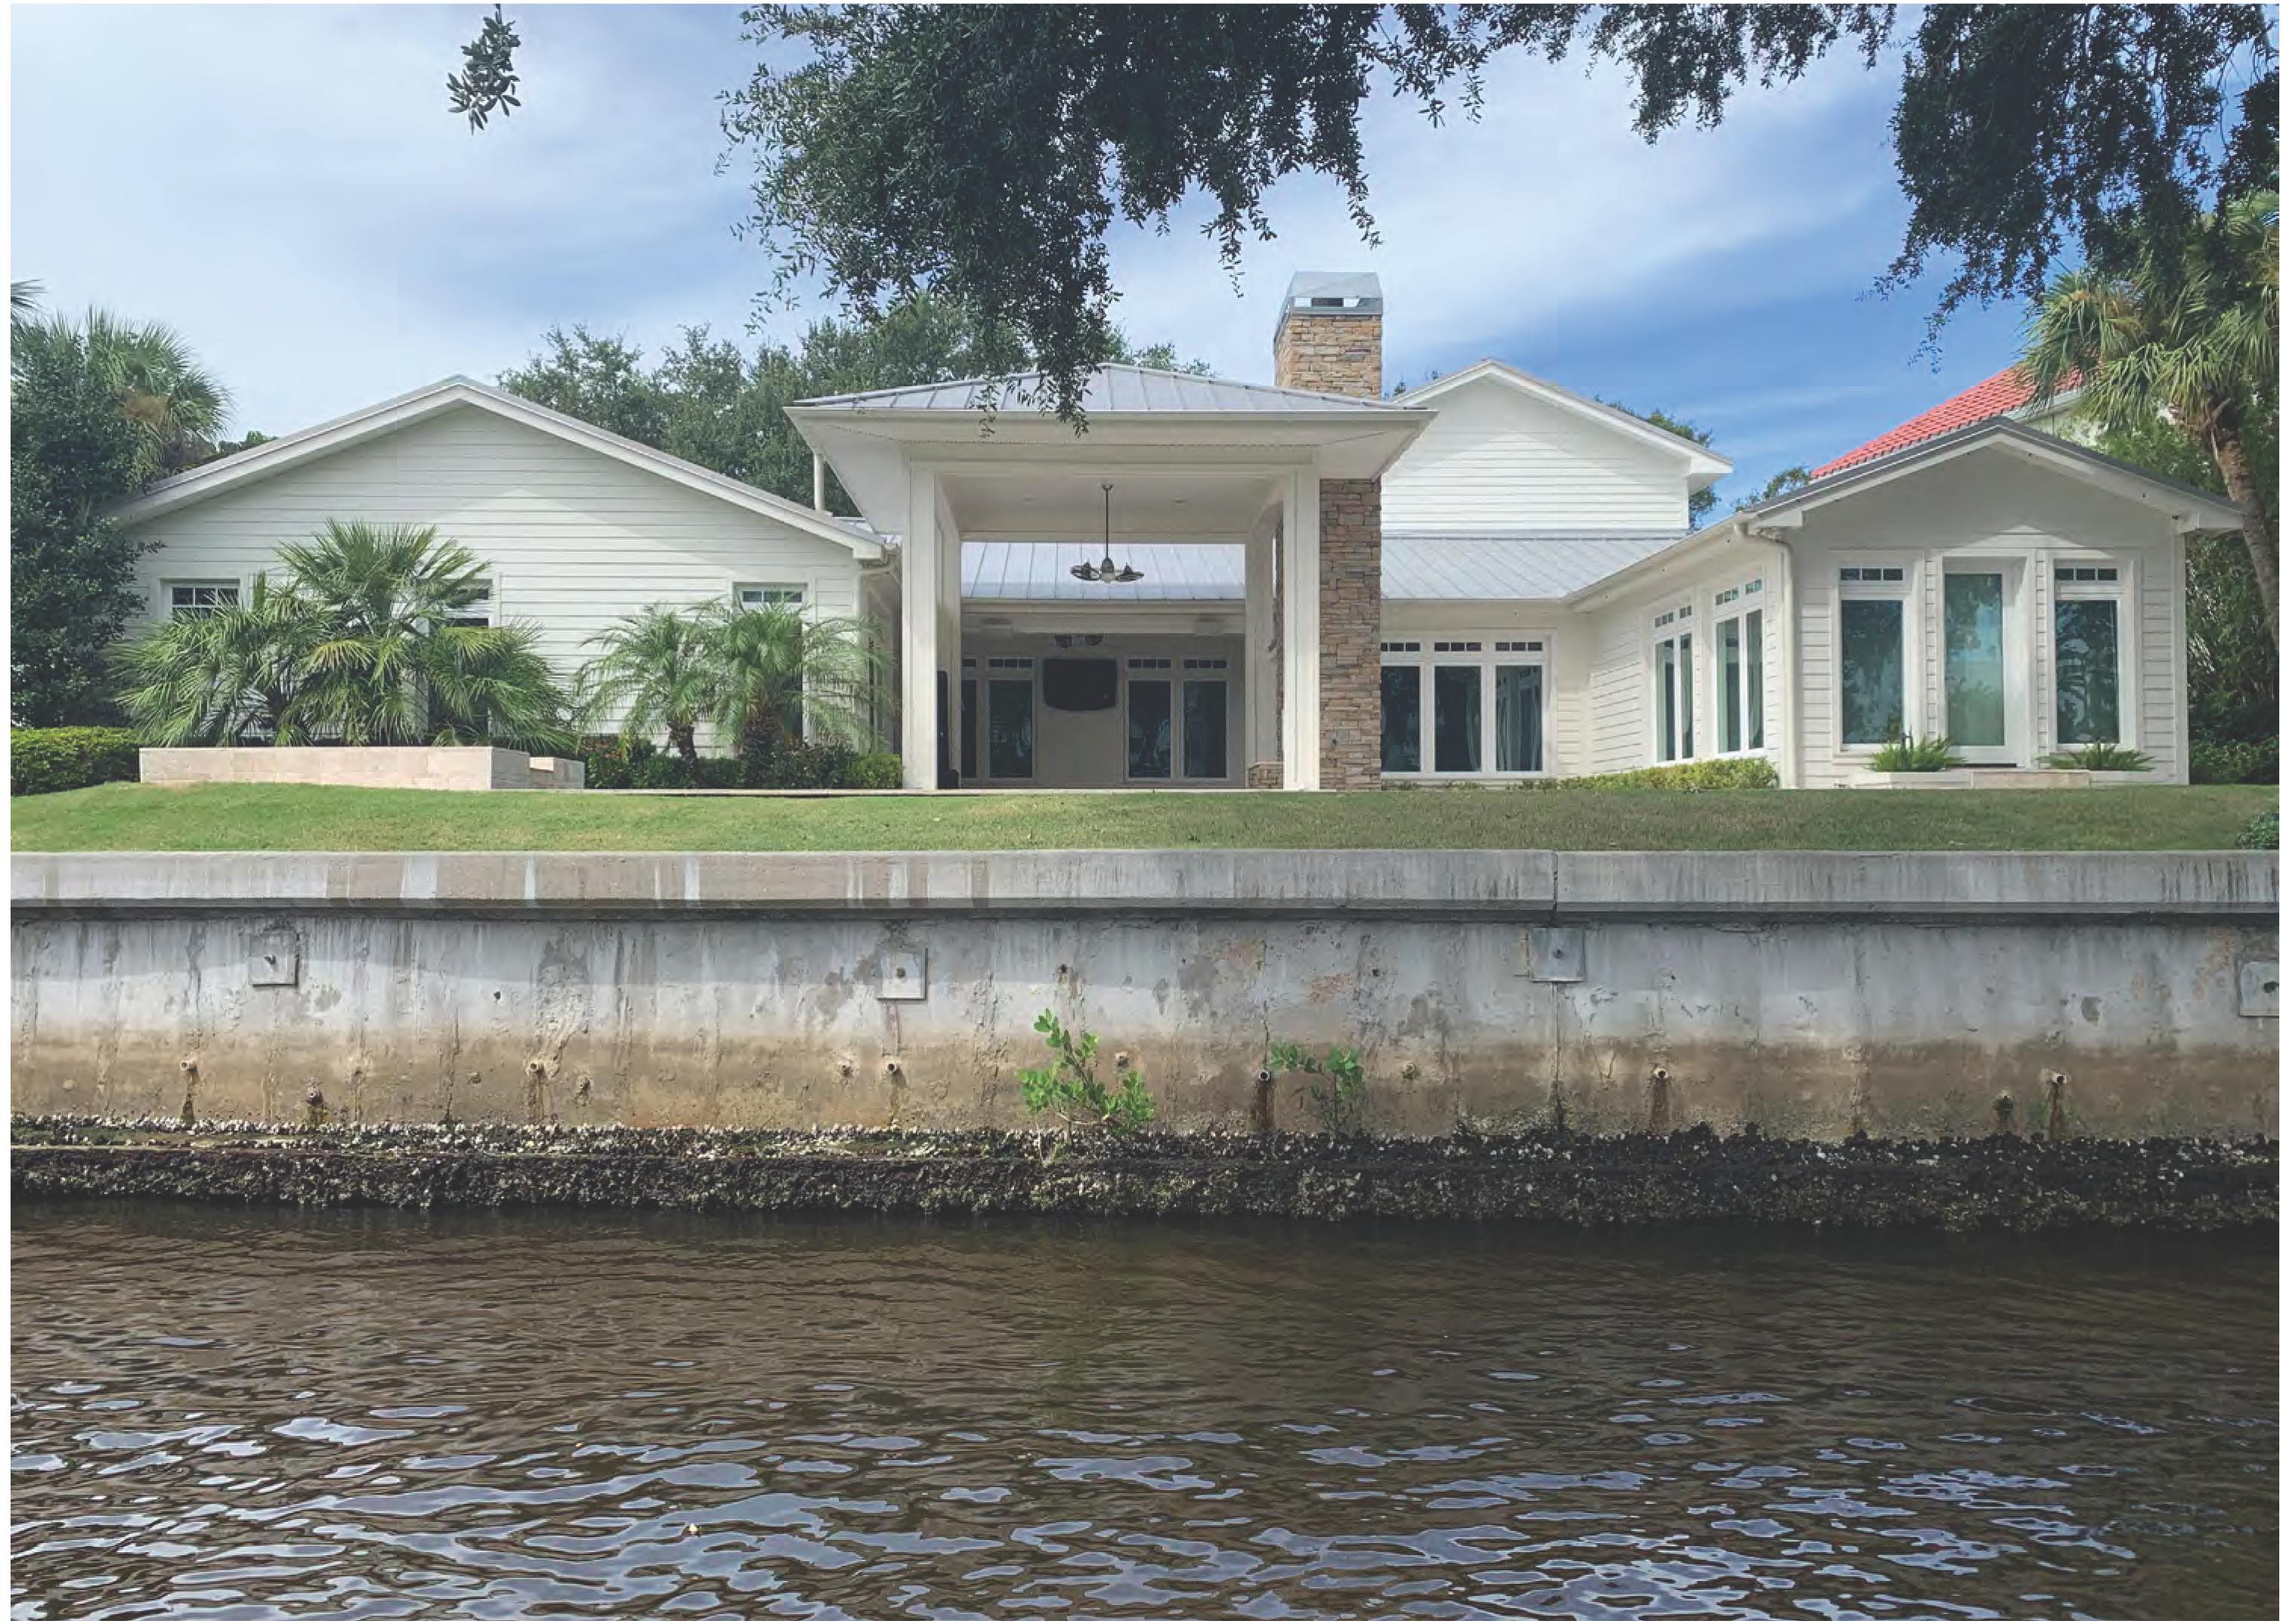
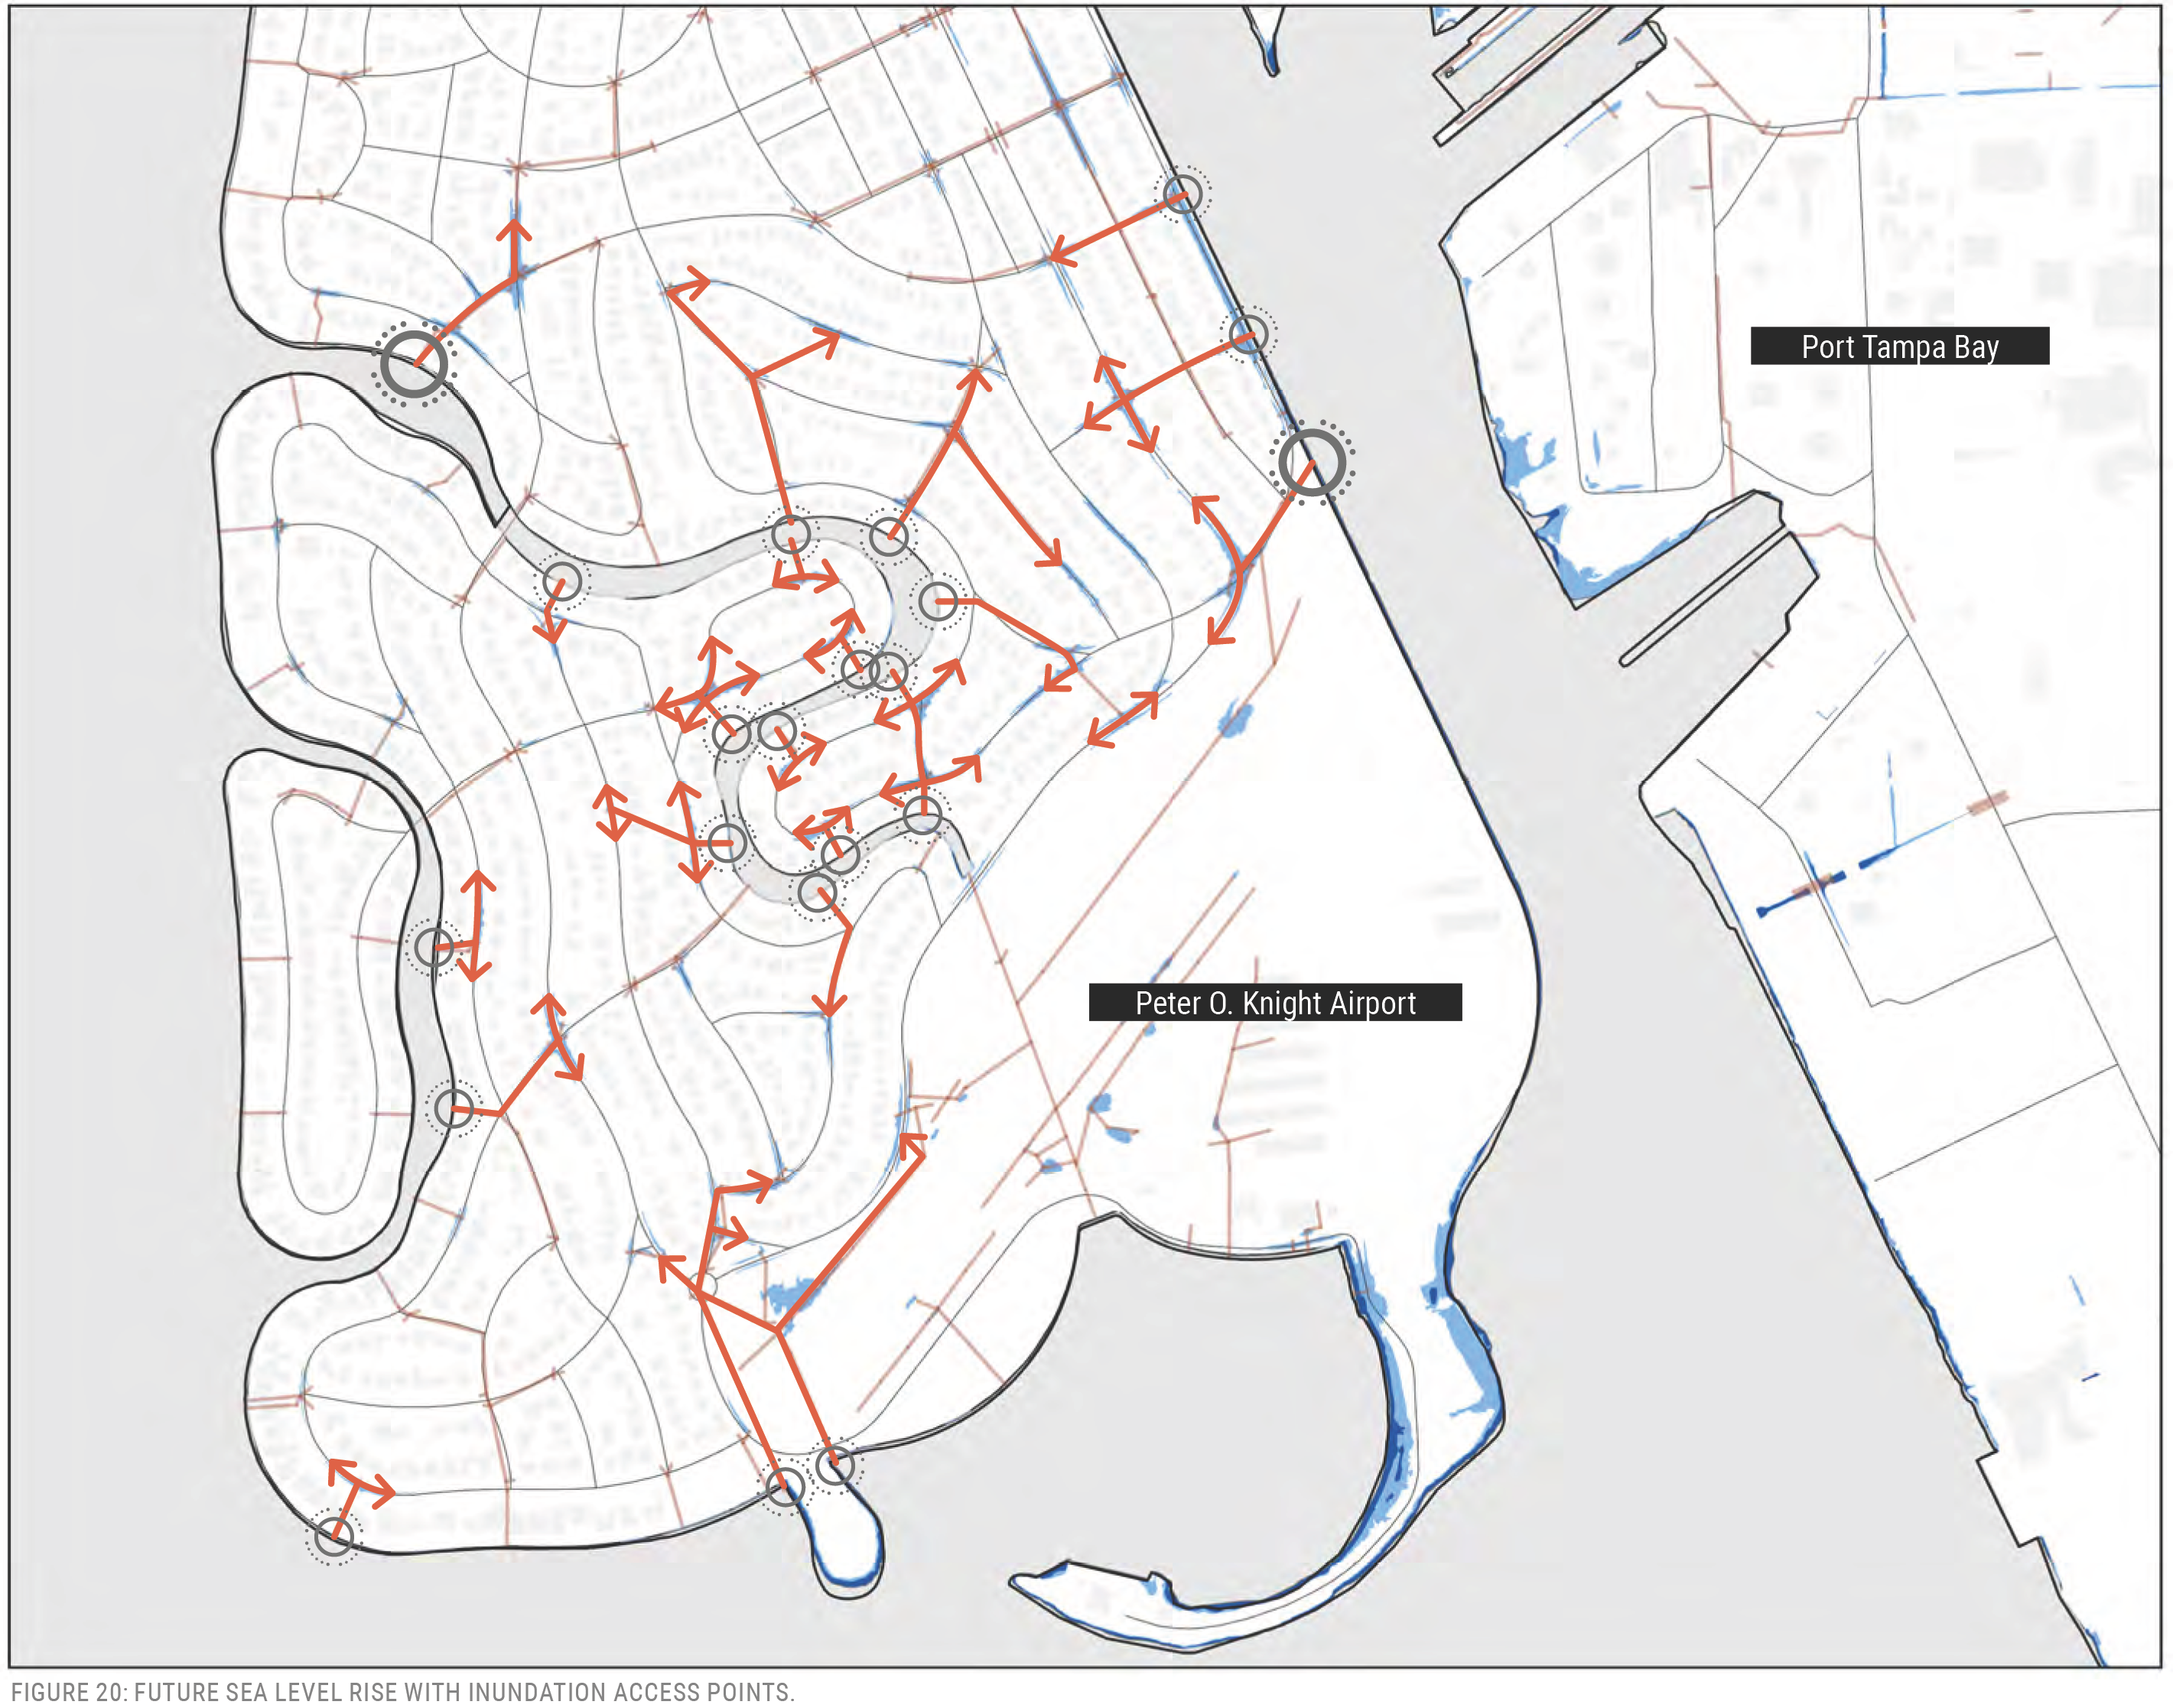
FIGURE 20: FUTURE SEA LEVEL RISE WITH INUNDATION ACCESS POINTS.
Bayshore Beautiful Neighborhood
The area including West Asbury Place, West Alline Avenue, and West Coachman Avenue has been previously identified as an area of concern for stormwater flooding. A pump station has been constructed to help alleviate rainfall flooding in the neighborhood. The nearby outfall may also cause problems in the future, providing a conduit for tidal flooding to back up into the neighborhood. Elevations between houses and in some roadways (mostly on Coachman) are as low as 2.3 feet NAVD88.
Further south, near West Conley Avenue, elevations are as low as 3-3.5 feet. By 2070 it is likely that this area would receive annual inundation from high tide events. The area includes a large marsh, and most houses are raised on piers.
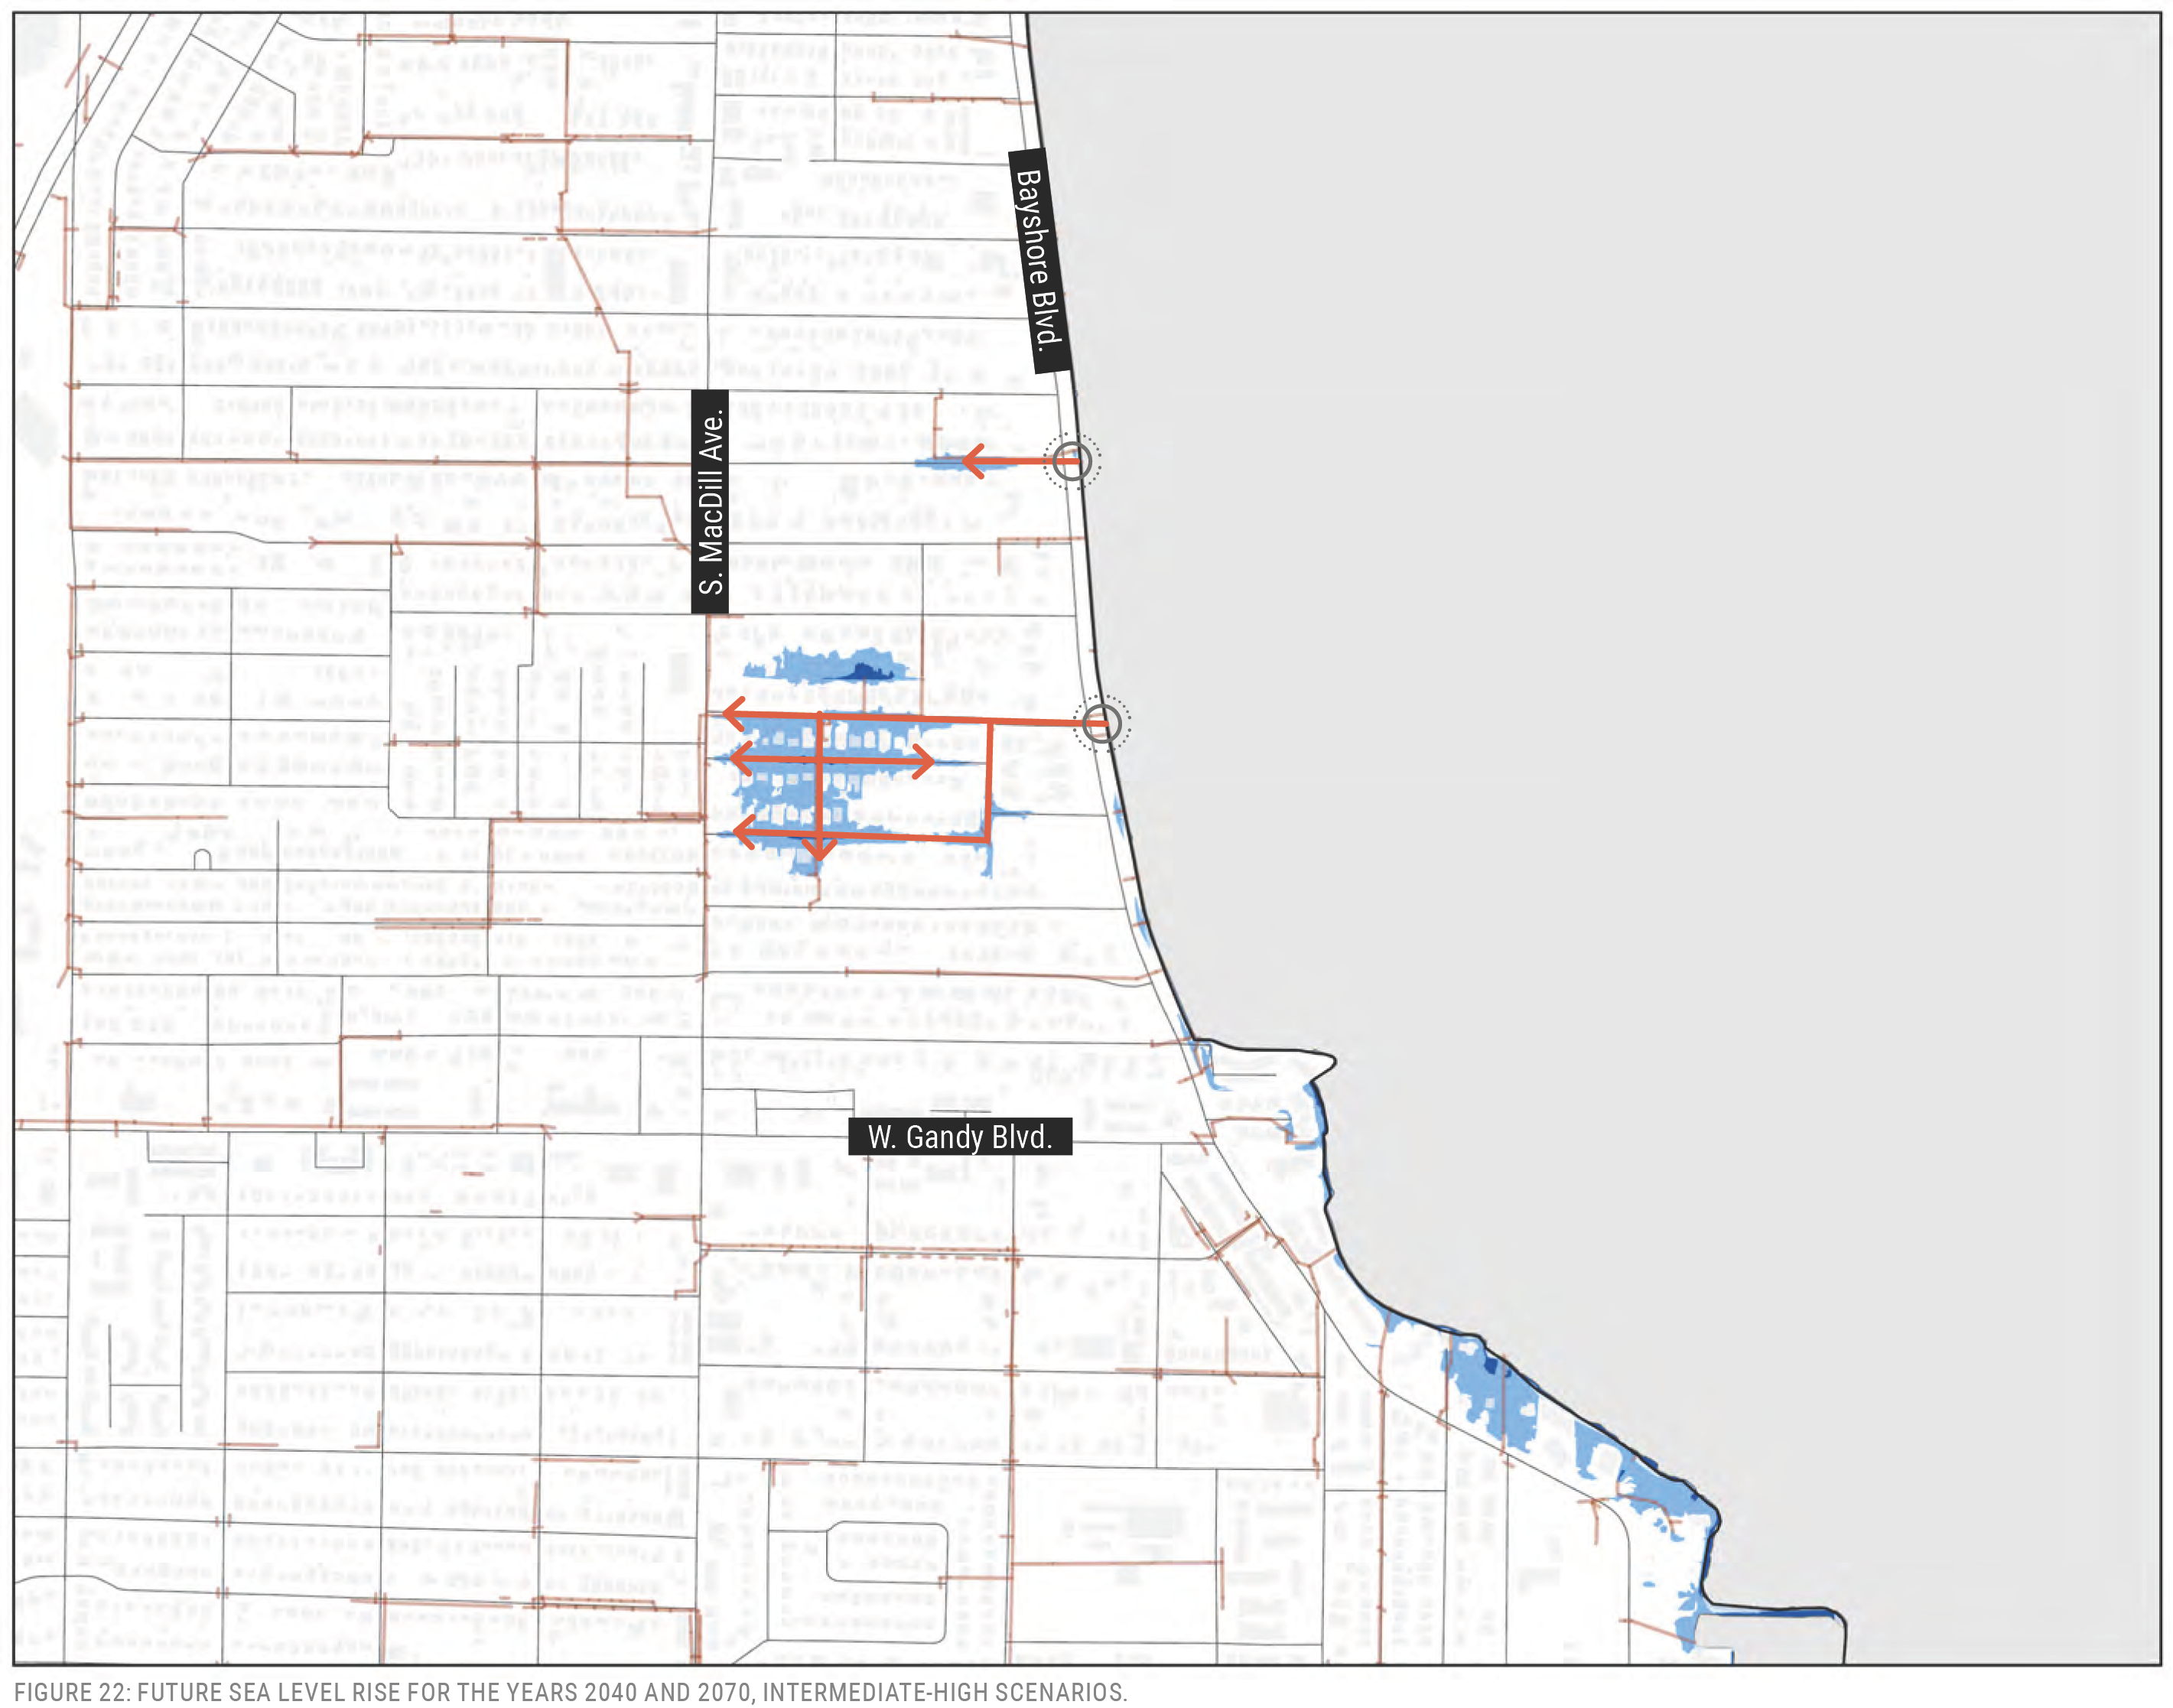
FIGURE 22: FUTURE SEA LEVEL RISE FOR THE YEARS 2040 AND 2070, INTERMEDIATE-HIGH SCENARIOS.
Port Tampa City and the Tappan Tract
In the Port Tampa City neighborhood, south of Commerce Street and west of South Kissimmee Street, land surface elevations range between 4 and 5 feet, with some of the lowest-lying areas closer to 3.5 feet. There are ditches within this neighborhood that are at sea level. This is a historic neighborhood that was built to support early port trade in Tampa with unique, historic houses. Port Tampa City was one of the earliest and wealthiest neighborhoods within city limits. New development, which included new roads and stormwater infrastructure, has recently filled in much of the vacant land within the community.
In the high tide scenarios, flooding would mostly be caused by overland flow – there are no sea walls that cause elevation change between the water and land. A similar condition exists north of the railroad line in the community, west of Westshore Boulevard near the Tappan Tract Park.
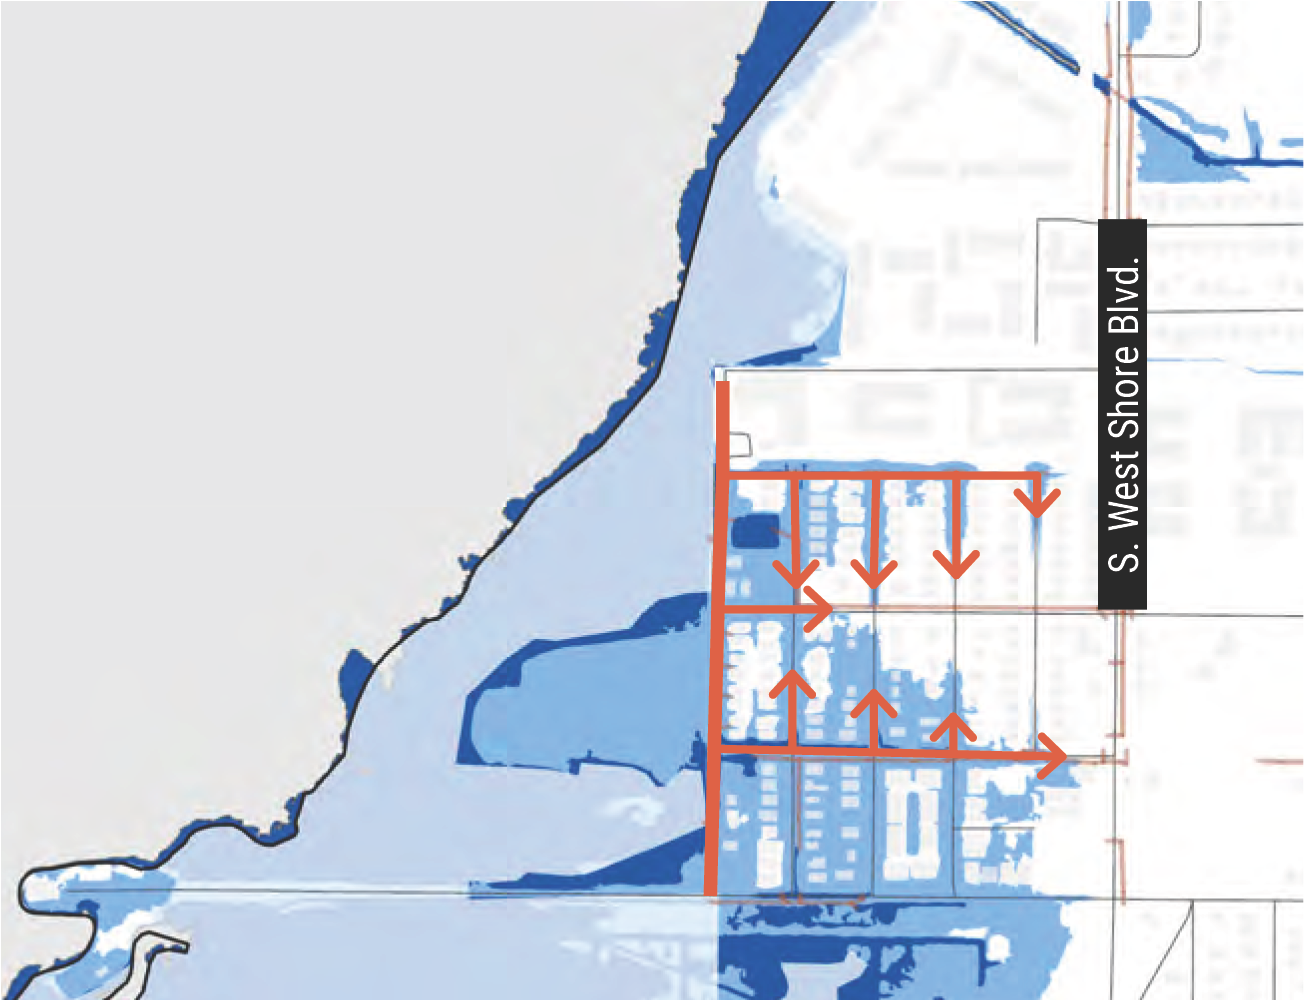
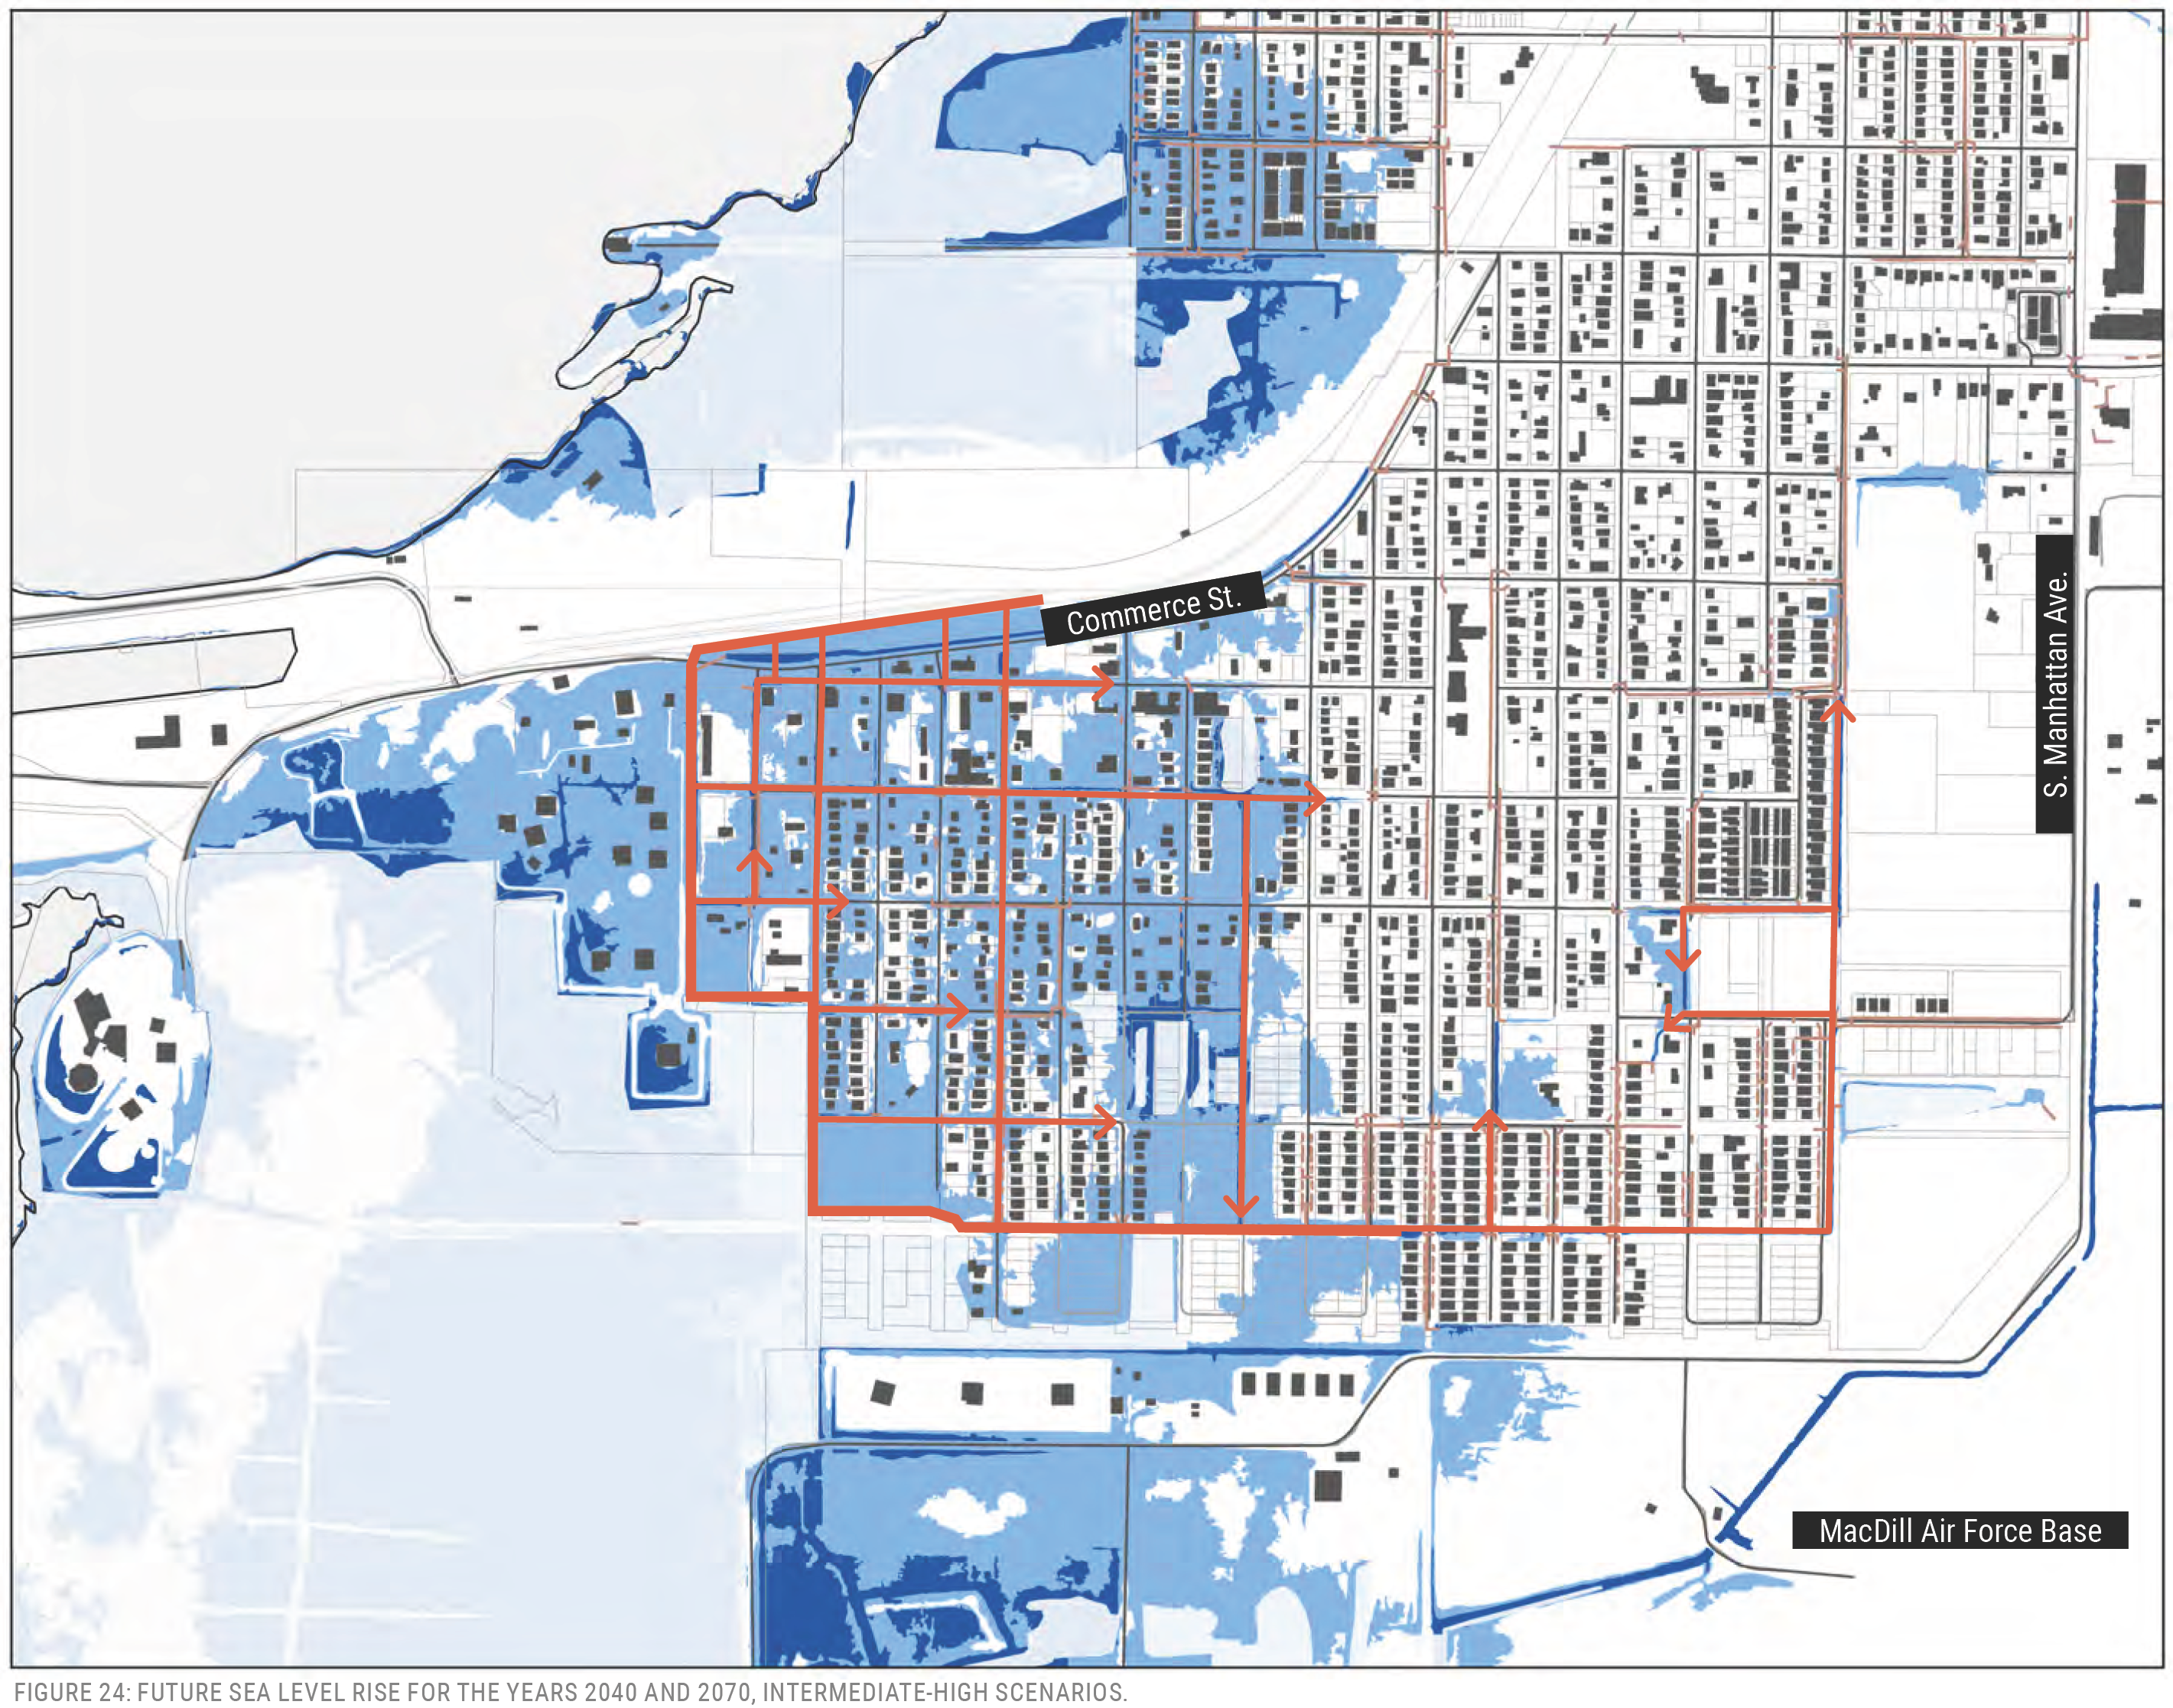
FIGURE 24: FUTURE SEA LEVEL RISE FOR THE YEARS 2040 AND 2070, INTERMEDIATE-HIGH SCENARIOS.
Sunset Park
The Sunset Park neighborhood is one of the lowest in the city. Many streets are at or near 2.6 feet, an elevation that would experience inundation with the 1-year stillwater event with the 2040 intermediate-high scenario. By 2070, with the intermediate-high scenario, near 100 homes could be impacted. Overtopping along the John Branch Channel appears to be a primary culprit of flooding, however there are also many outfalls connected to low-lying streets where water could emerge from inlets.
Beach Park
The landforms of Beach Park were carved into a mix of brush and oak forest along the coastal edge in the early 1920’s. Roadways were constructed between elevations 3.5 and 5.5 feet, enough to be above any concern for the 2040 1-year stillwater event, during “blue sky” high tide events. As is typical for many of the constructed landscapes in the area, there are low inland locations that could be affected by piped connections to the sea. In this neighborhood there are also coastal edge concerns, where seawalls could potentially be overtopped by future high tide conditions. This would have to be evaluated more closely. It appears that a consistent sea wall was built to protect some of the lower areas near Bayside and Shore Crest drives.
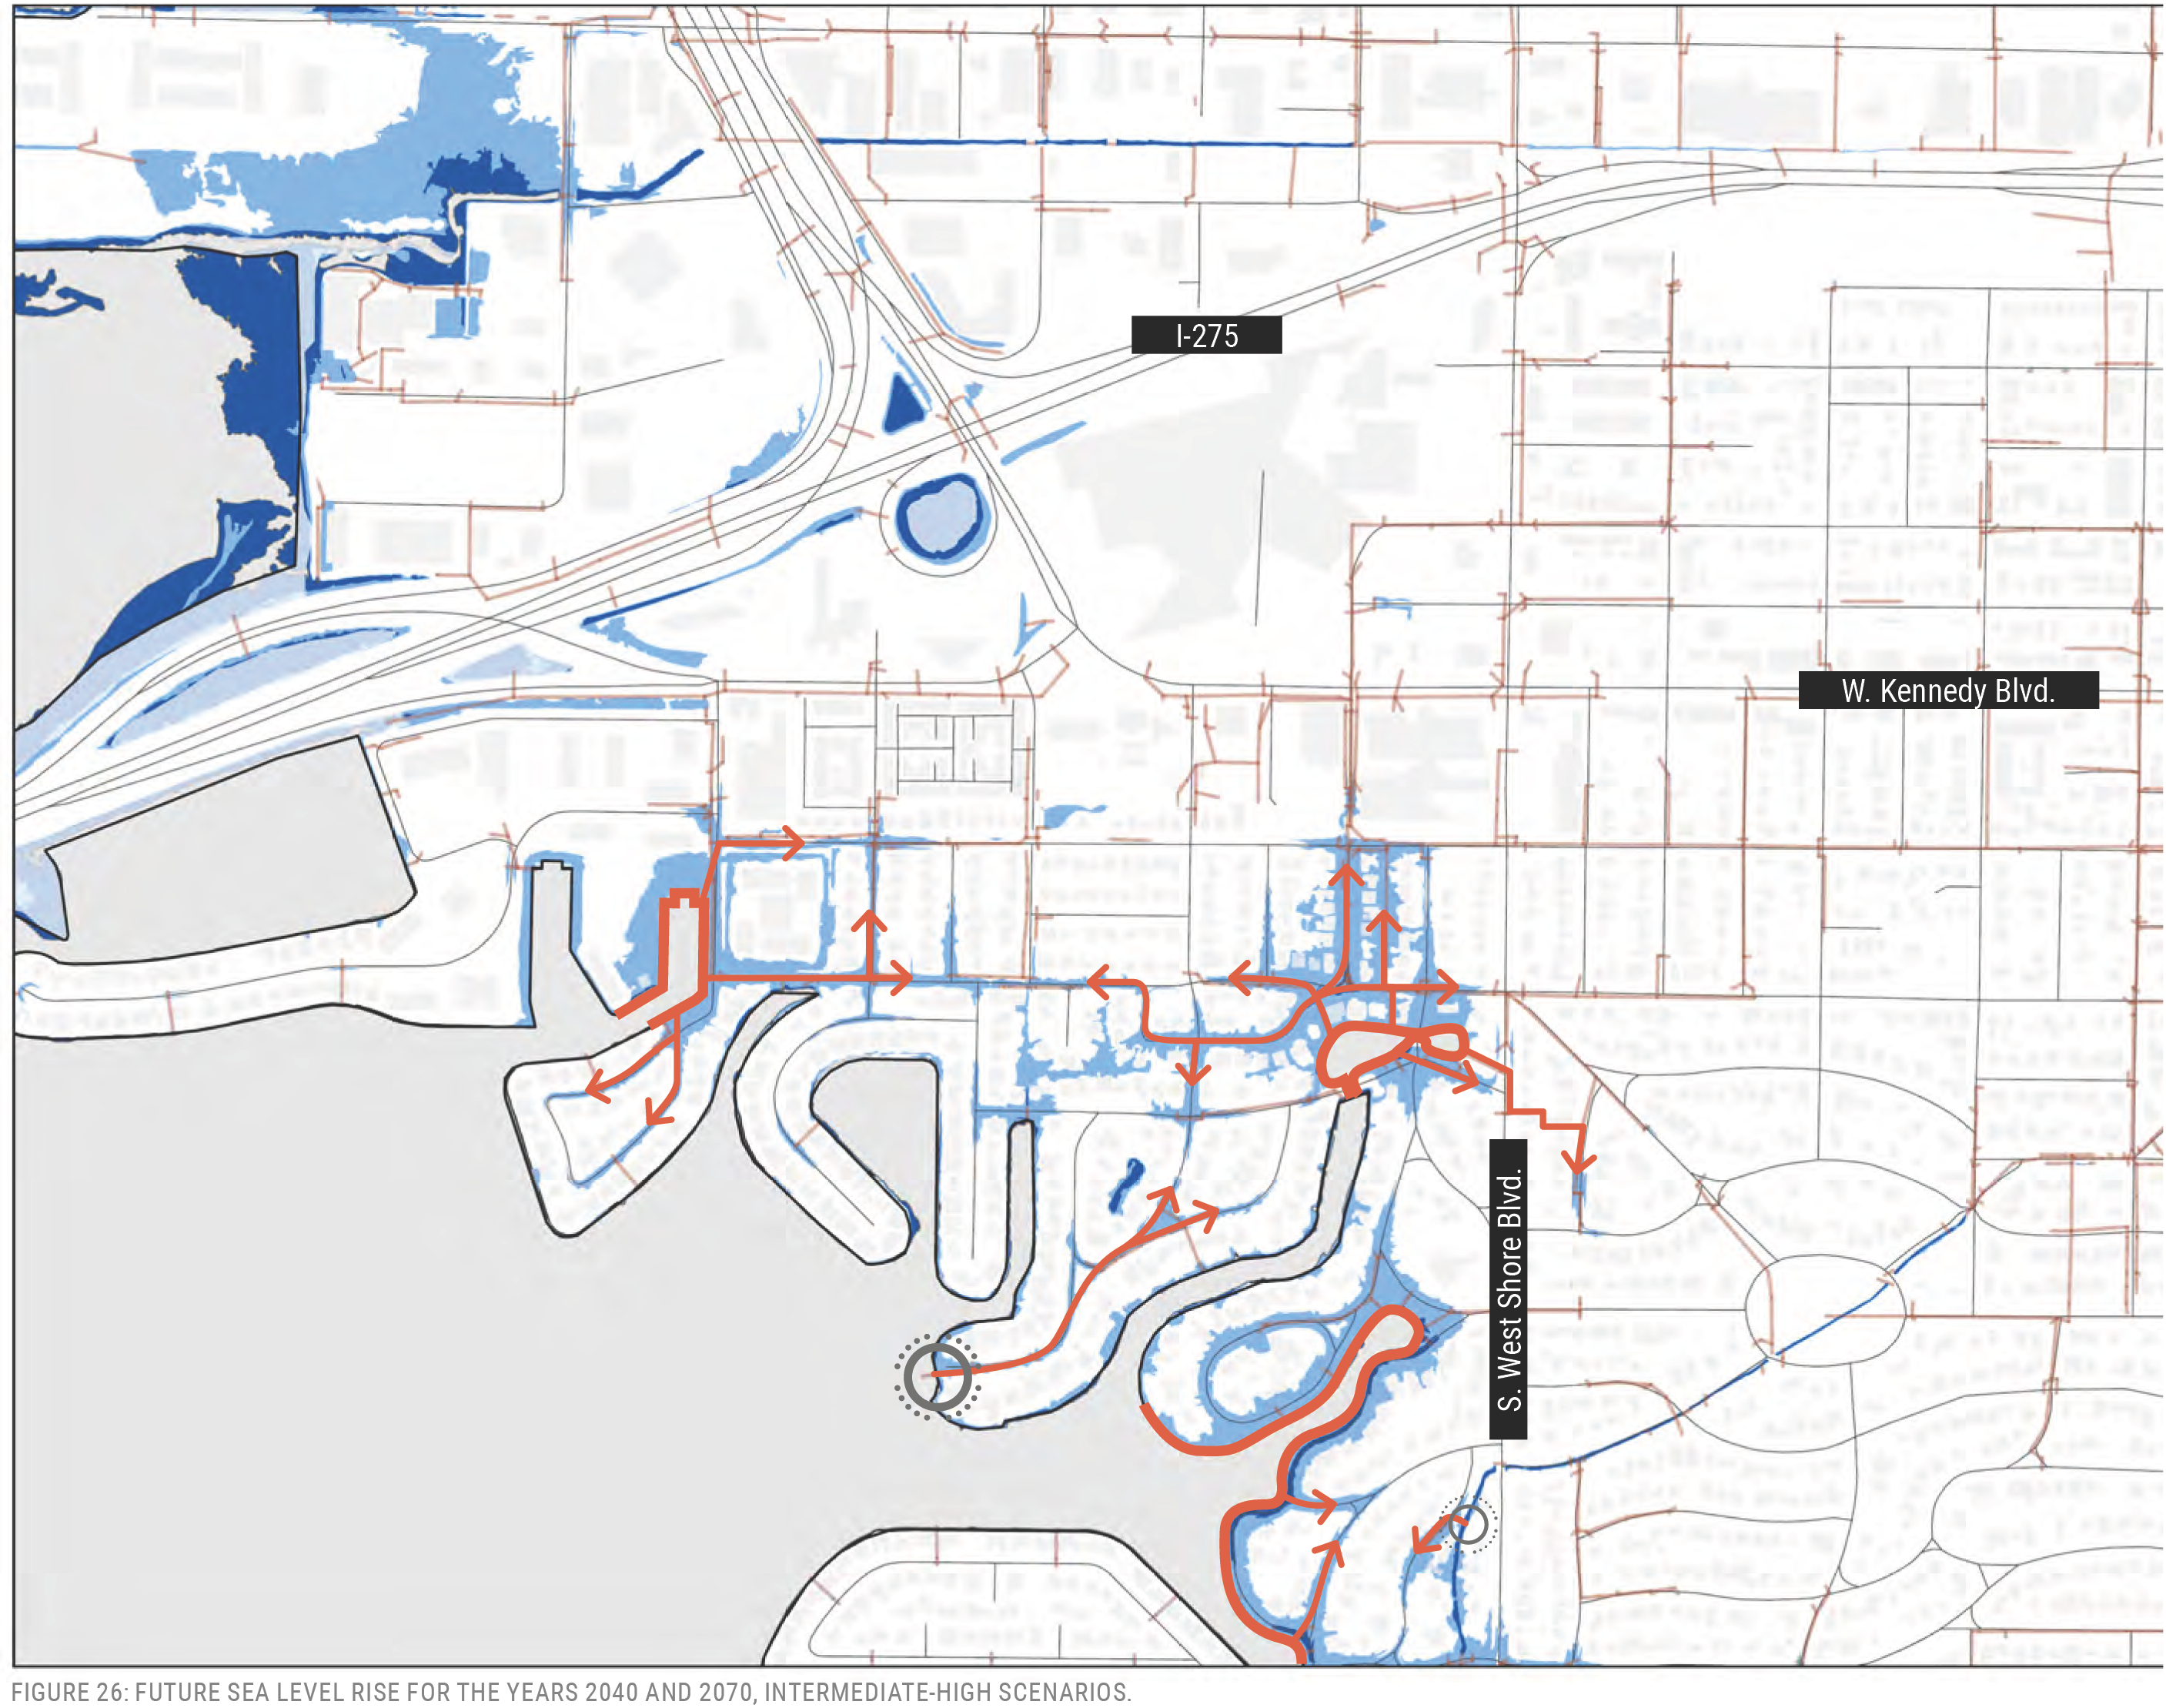
FIGURE 26: FUTURE SEA LEVEL RISE FOR THE YEARS 2040 AND 2070, INTERMEDIATE-HIGH SCENARIOS. I-275 W. Kennedy Blvd. S. West Shore Blvd.
Courtney Campbell and Rocky Point
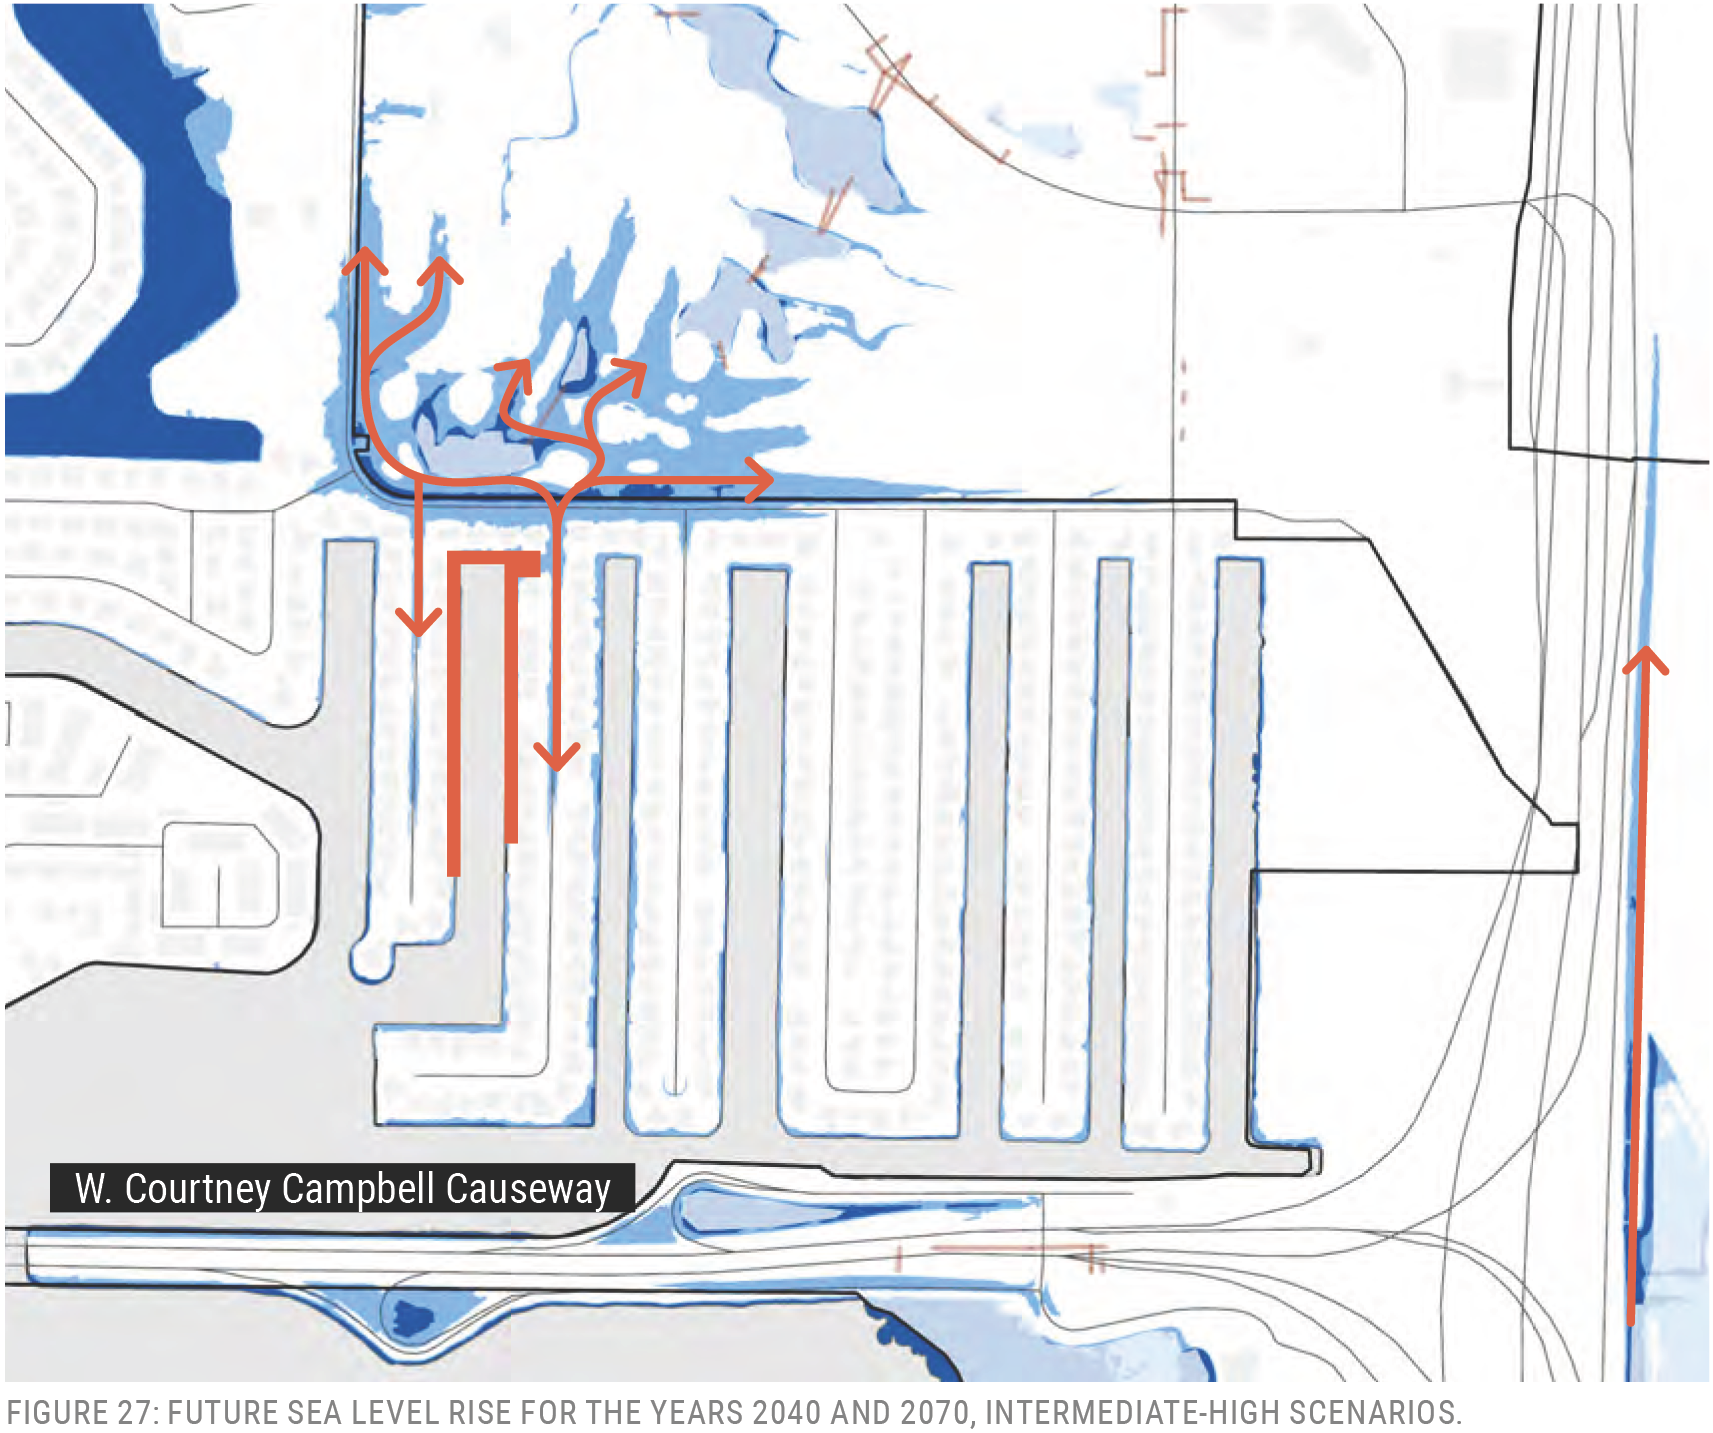
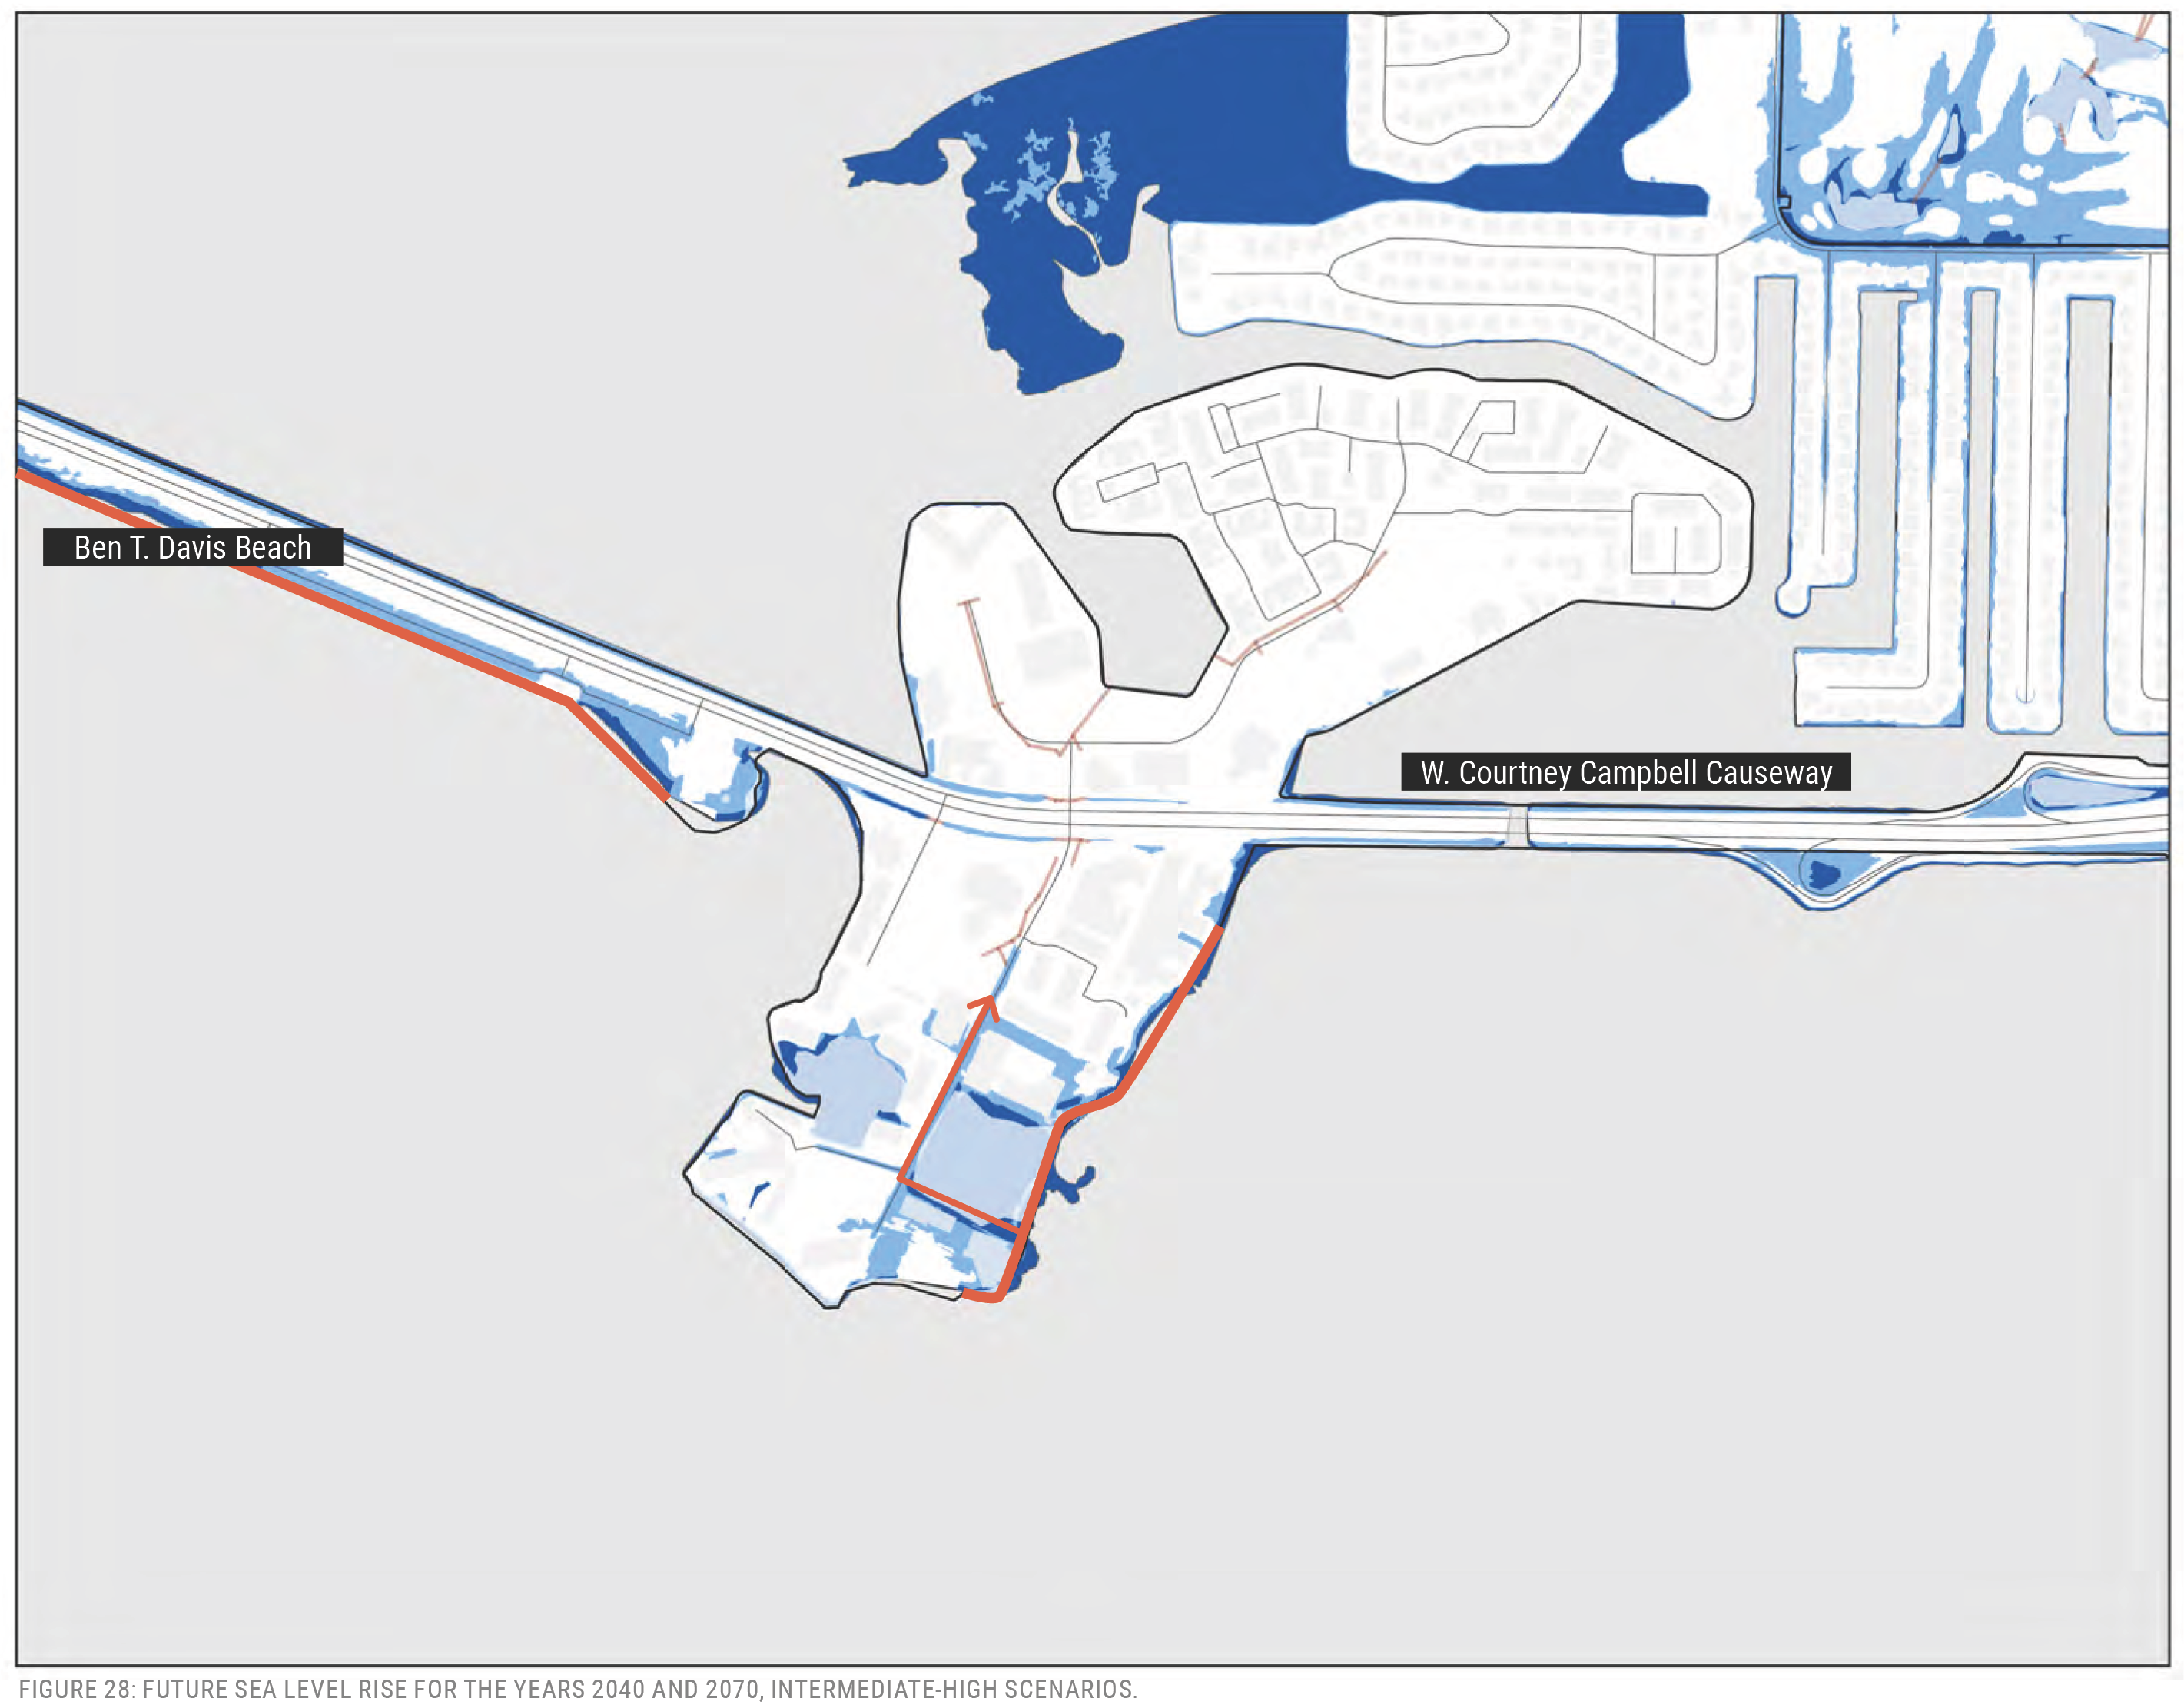
Courtney Campbell Causeway, on the Tampa side, has quickly eroded with a beach only sustained around Whiskey Joe’s Restaurant. The parking lot is now armored with a sea wall that is directly adjacent to water. The parking lot is approximately 3.5 feet elevation. This is high enough to be clear of 2040 sea level rise predictions but would be expected to be inundated by the 1-year stillwater scenario by the year 2070. Directly behind the parking lot, Courtney Campbell Causeway is an evacuation route that services the northern part of Pinellas County and Clearwater.
The Rocky Point Golf Course could also be vulnerable to future sea level rise. Its stormwater ponds are connected to each other and to outfalls at the coastline. The landscape around the ponds is at and above elevations 3.5 feet, susceptible to a 1-year stillwater event in the southwest corner of the site if sea levels do in fact rise by two feet or more.
RAINFALL
High volumes of rainfall are common in Florida, both annually and daily. Tampa typically receives about 50 inches of rain per year, according to the 30-year (1991-2020) normal generated by the National Weather Service. Nearly half of that rain arrives during the period between June and August; the rainy season typically peaks in August and there is a significant dry period from November to April. The 100-year (1%) storm is expected to bring 11.4 inches of rain. Using the South Florida Water Management District projections, a storm of the same frequency (the 100-year, or 1% storm) would deliver as much as 15.2 inches in 2070 (SFWMD, 2022).
| Recurrence | Current | 2040 IL | 2040 IH | 2070 IL | 2070 IH |
|---|---|---|---|---|---|
| 25-Year 24 Hour | 7.9 | 8.2 | 8.9 | 9.6 | 10.0 |
| 100-Year 24 Hour | 11.4 | 11.6 | 12.8 | 14.7 | 15.2 |
| 500-Year 24 Hour | 16.6 | 17.1 | 20.2 | 22.3 | 24.5 |
SOURCE: DEPTH -NOAA ATLAS 14 & SWFMD CHANGE FACTORS.
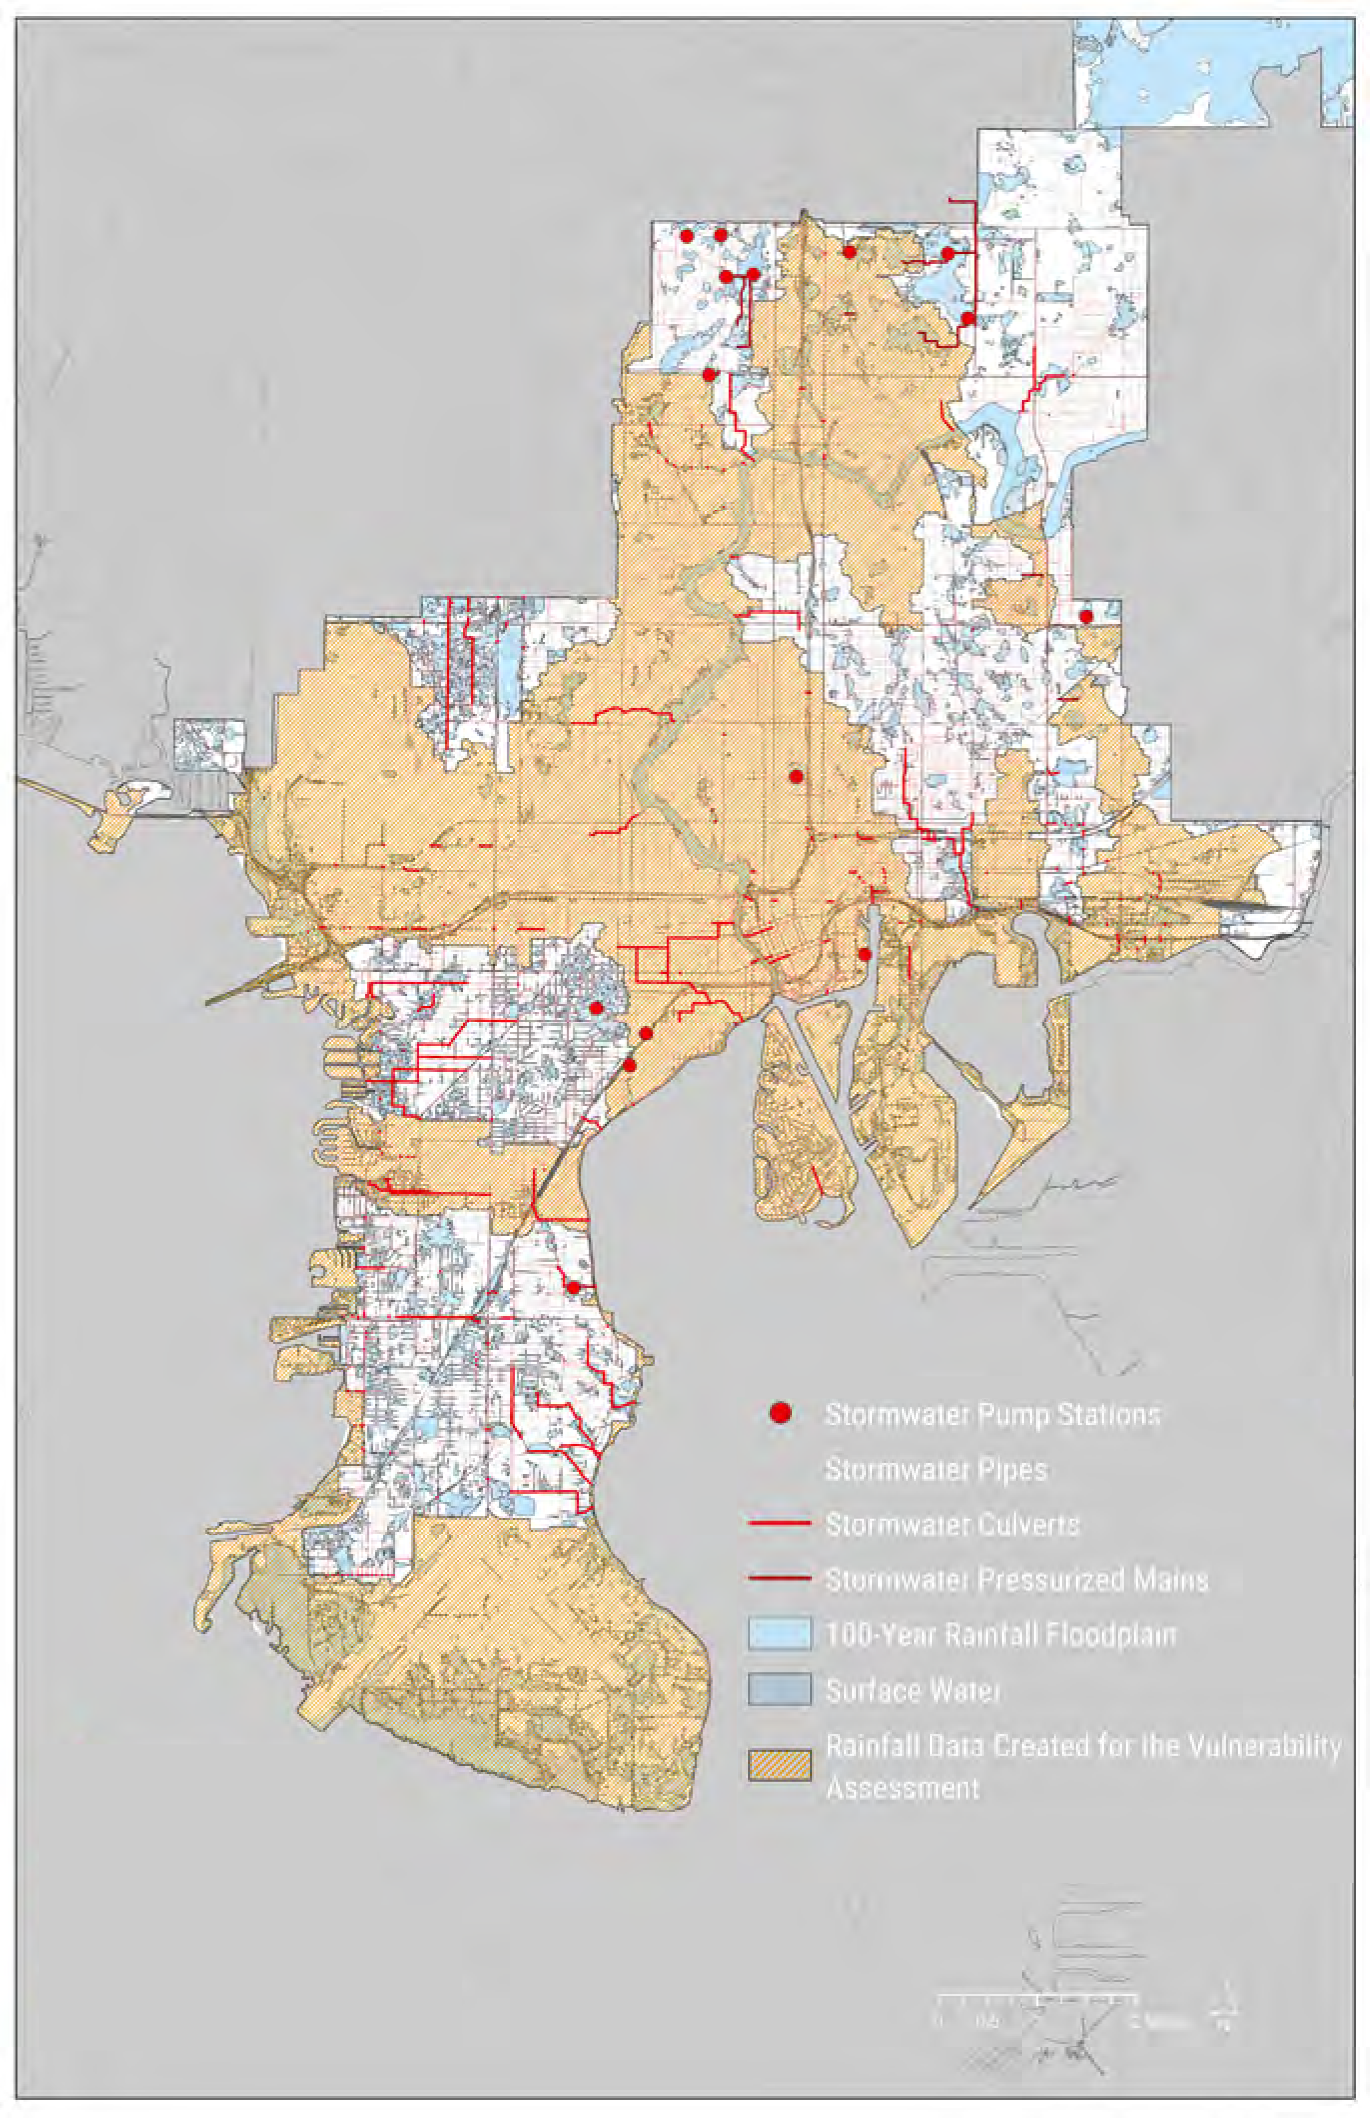
In a flat and heavily urbanized area such as Tampa, watersheds and extents of rainfall-induced flooding are greatly influenced by the stormwater system, which has been engineered over the last 100 years. This includes ditches, inlets, pipes, culverts, and outfalls. Some culverts measure more than 10 feet across. An account of drainage infrastructure should therefore be included to create an accurate depiction of flooding within the city. The City of Tampa Gap Analysis project collected data from previous watershed studies that have been conducted by the city, county and others. Using this data, the vulnerability assessment was able to use a limited number of watershed models from past studies to represent rainfall in some areas of the city (see Figure 35). To fill gaps, a model was created that used typical elements of a hydrologic and hydraulic assessment, such as topography, land use, and soil types to estimate potential flooding, but only a limited number of high-volume pipes and culverts were blended into the model to assume sub-surface drainage transfer between basins. Results were compared to previous high-definition stormwater master plan studies, which were determined comparable although not of the same precision. The floodplains that were created were used for a planning-level review of rainfall impacts, however it is understood that a more thorough, technical review will be needed to quantify exact levels of vulnerability.
It is important to note that some assets may not show as “impacted,” however the road around the asset may be impacted, causing lack of access. This is a common problem since roadways are inherently lower than the facilities that they service.
Rainfall Impacts
The biggest rainfall problems in Tampa are not associated with the river (fluvial flooding), as is common in other cities across the country. Instead, intense rainfall inundation combined with a flat topography can lead to isolated inland flooding where water is not able to escape. Increased imperviousness, as has been seen over the last 75 years in Tampa, can worsen the problem as flows are concentrated and delivered quicker to low-elevation locations. Primary problem areas for inland flooding described below.
University Square
This area appears to have the most widespread rainfall flooding and, among areas that flood, the most residential density. Efforts have been taken to relieve rainfall flooding in the adjacent Tampa Overlook neighborhood, which is a closed basin that has experienced flooding in the past.
Forest Hills
The Curiosity Creek drainage system had historically terminated at Blue Sink, where water disappeared into the aquifer and was transported underground toward the Hillsborough River. The subsurface geology has become clogged and the system now relies on pumps to move water out of the area.
East Tampa
The highest elevations in Tampa are in this area but there are multiple low spots in a generally flat topography. This causes basins to form where localized flooding is possible.
South Tampa Peninsula: Culbreath Bayou / Sunset Park / Palma Ceia Pines / Golfview / Bay View Avenue
There are multiple areas within the South Tampa peninsula that show the potential for flooding due to heavy rainfall. Some areas of concentrated vulnerability include the Culbreath Bayou and Sunset Park neighborhoods, which are historic communities that were constructed in the early 20th century. The west side of the peninsula is lower than the east and it is possible that some of the historic residential construction projects created basins that entrap water. Flooding is also possible in Palma Ceia Pines, Golfview, near Bay View Avenue and Parkland Estates. For Parkland Estates, a plan is in place to alleviate flooding through the installation of a large box culvert but planning and implementation are currently on hold.
Palmetto Beach and The Port Tampa Bay Entrance
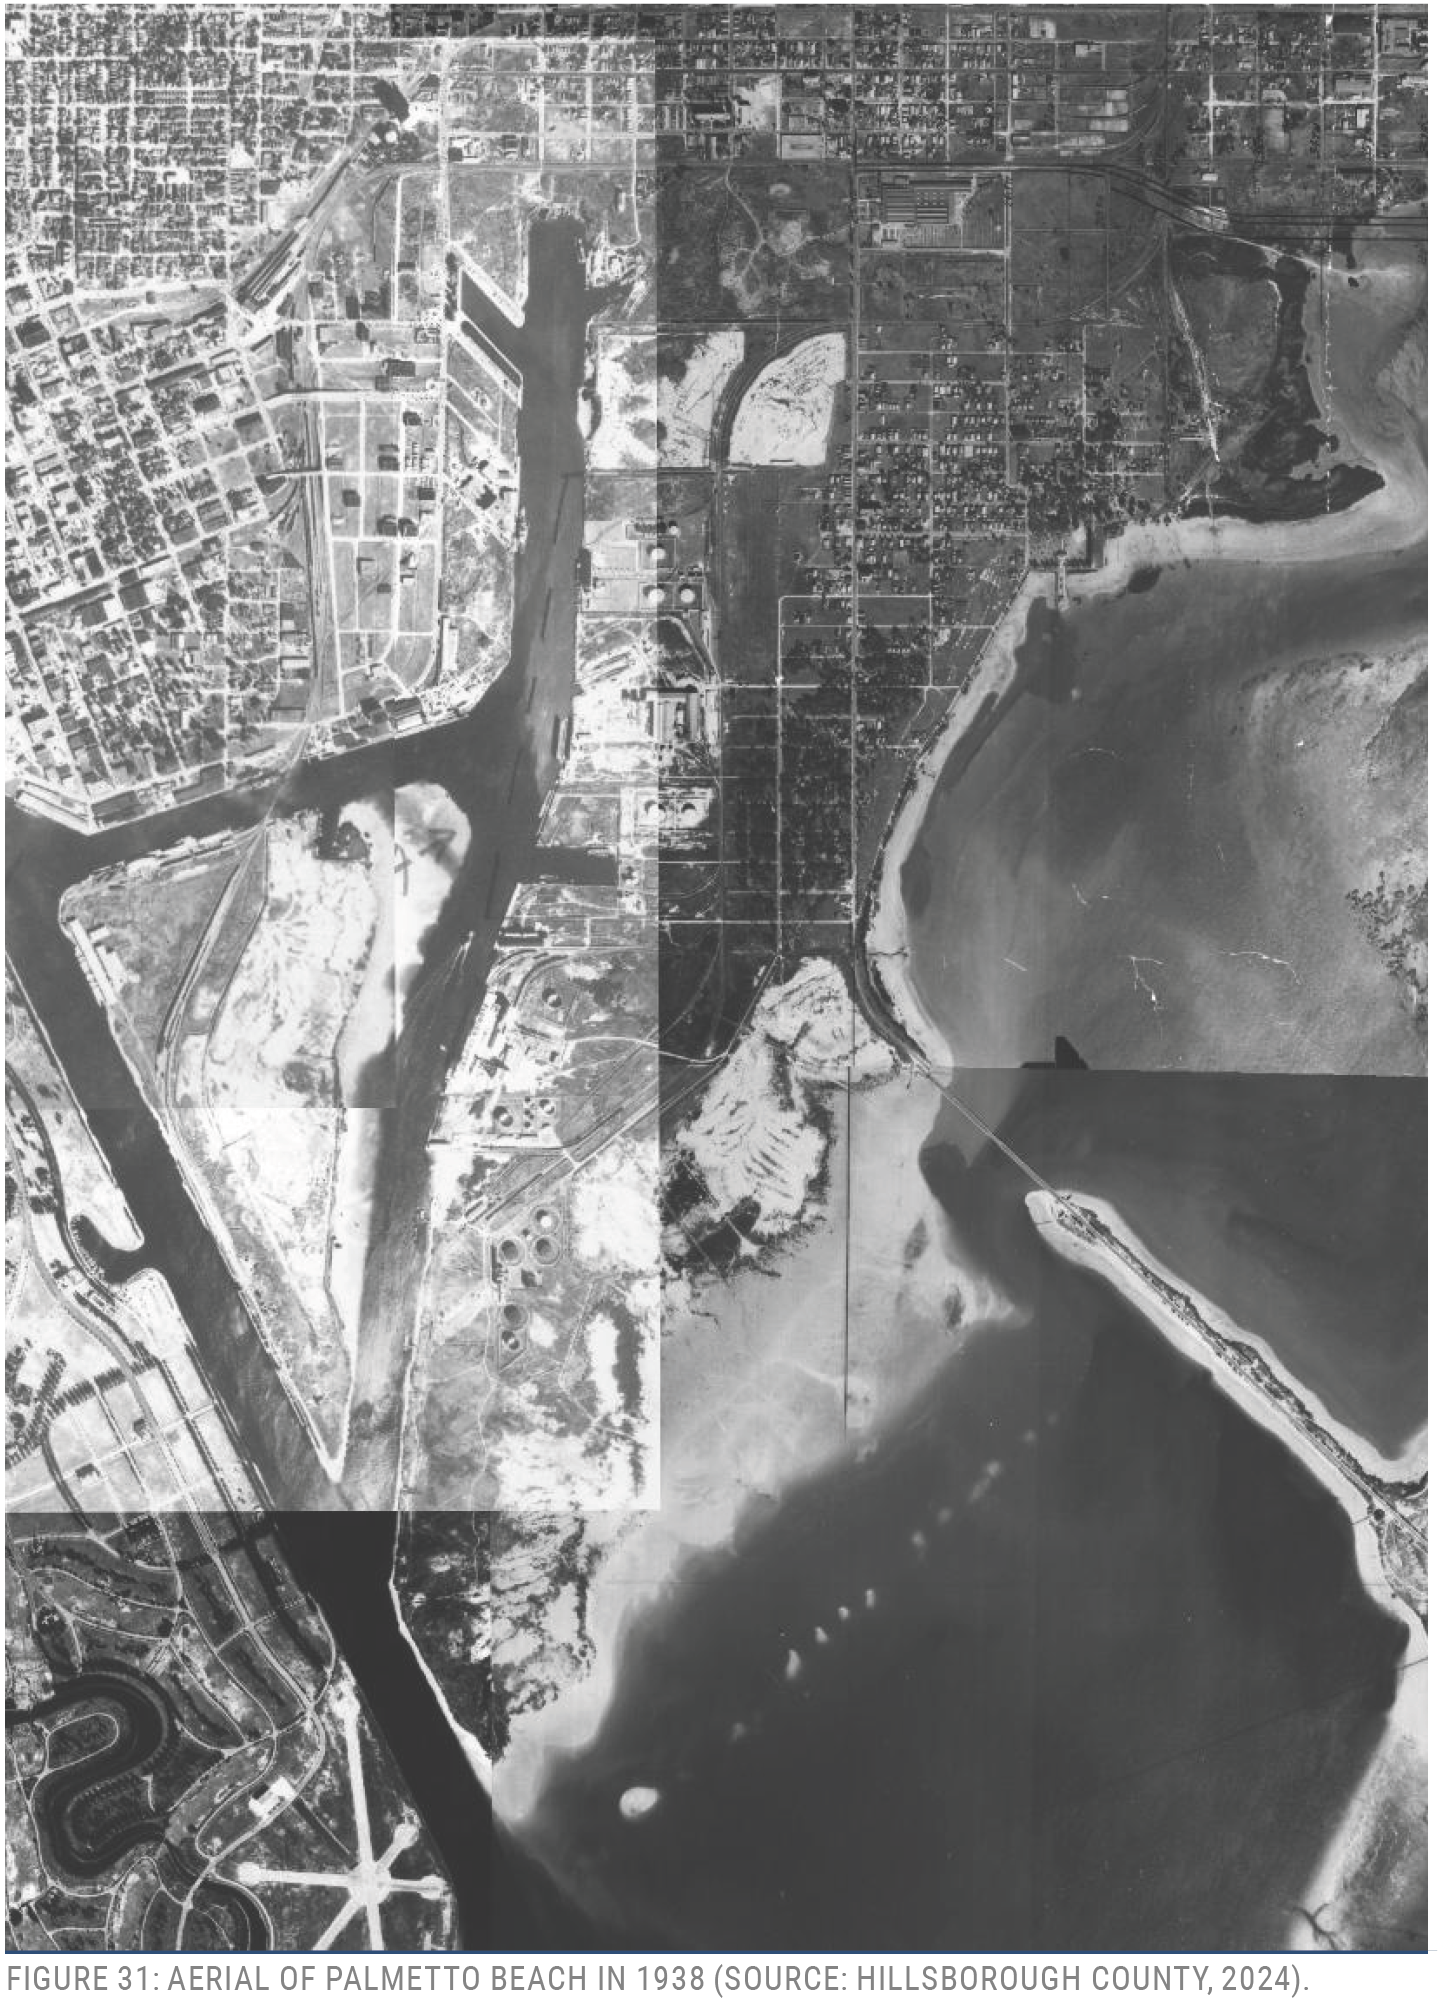
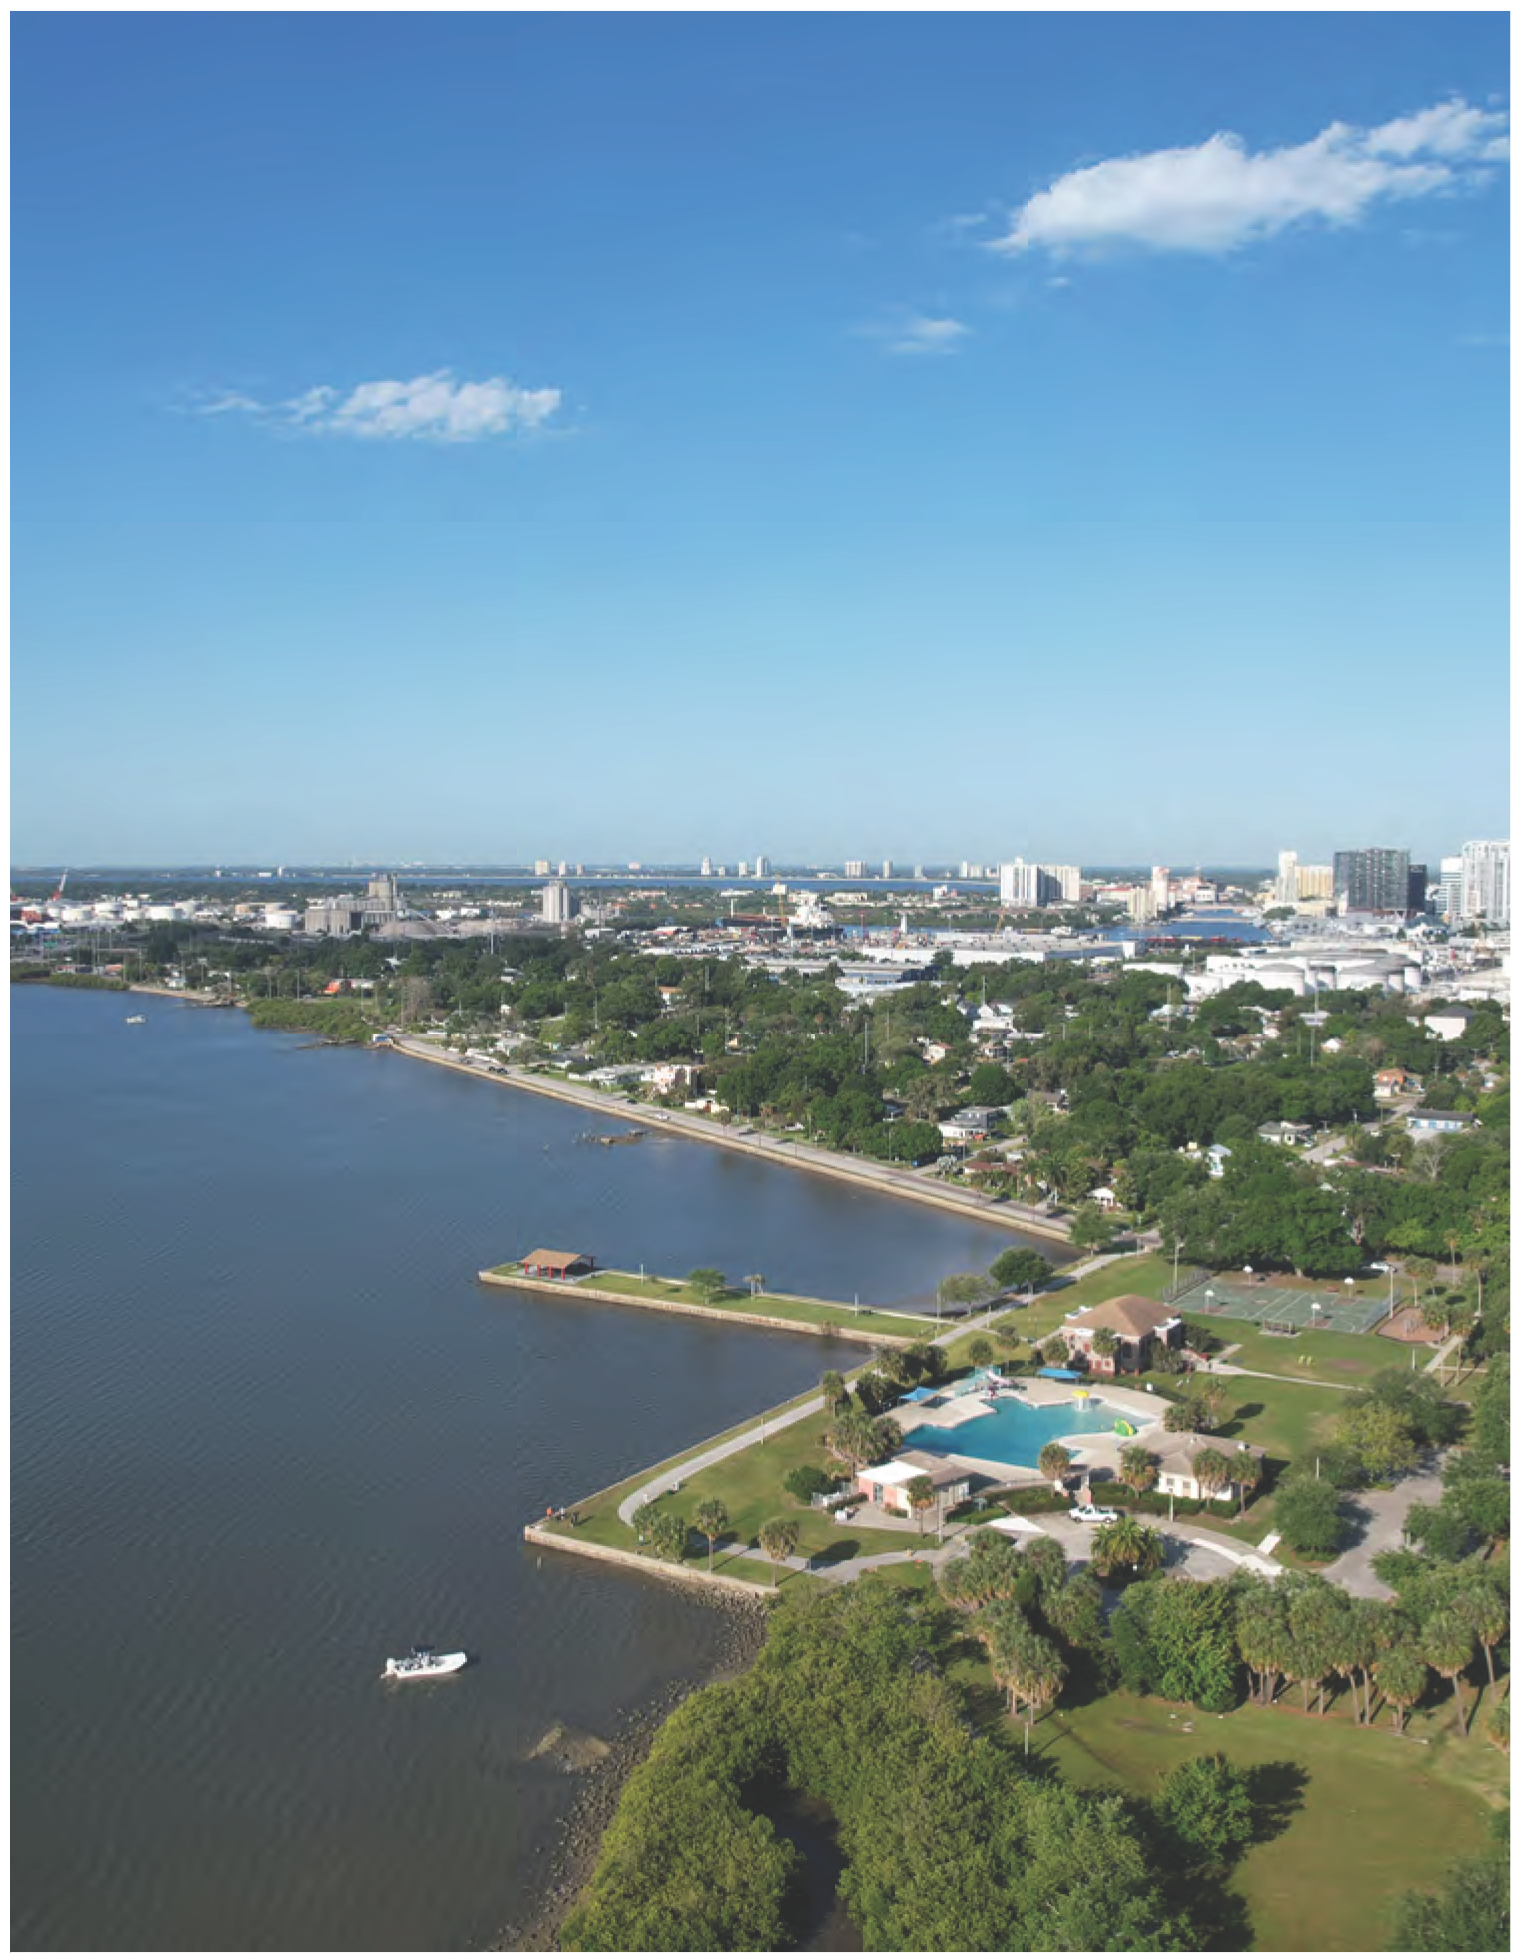
Palmetto Beach is a historic working waterfront community that began with a buffer zone between residential development and coastal waters. Since that time, buildings have filled most of the open spaces and the community experiences flooding problems from rainfall as well as high tide surge (see figures 33 and 34). This neighborhood is also the gateway to Port Tampa Bay’s Hooker’s Point property. At the Port’s entrance and along 22nd Street to the north, rainfall models suggest potential risk to flooding including blockage of roadway traffic.
Tampa Palms
The Tampa Palms neighborhood is associated with a large wetland system. The development that has built within it, especially along MacClaurin Drive, could be vulnerable to heavy rainfall.
Watershed Master Planning
The City of Tampa has recently initiated a project to fill the gaps of its watershed modeling. The project will be help to create more accurate representation of flooding while incorporating all hydraulic and hydrologic flows and infrastructure.
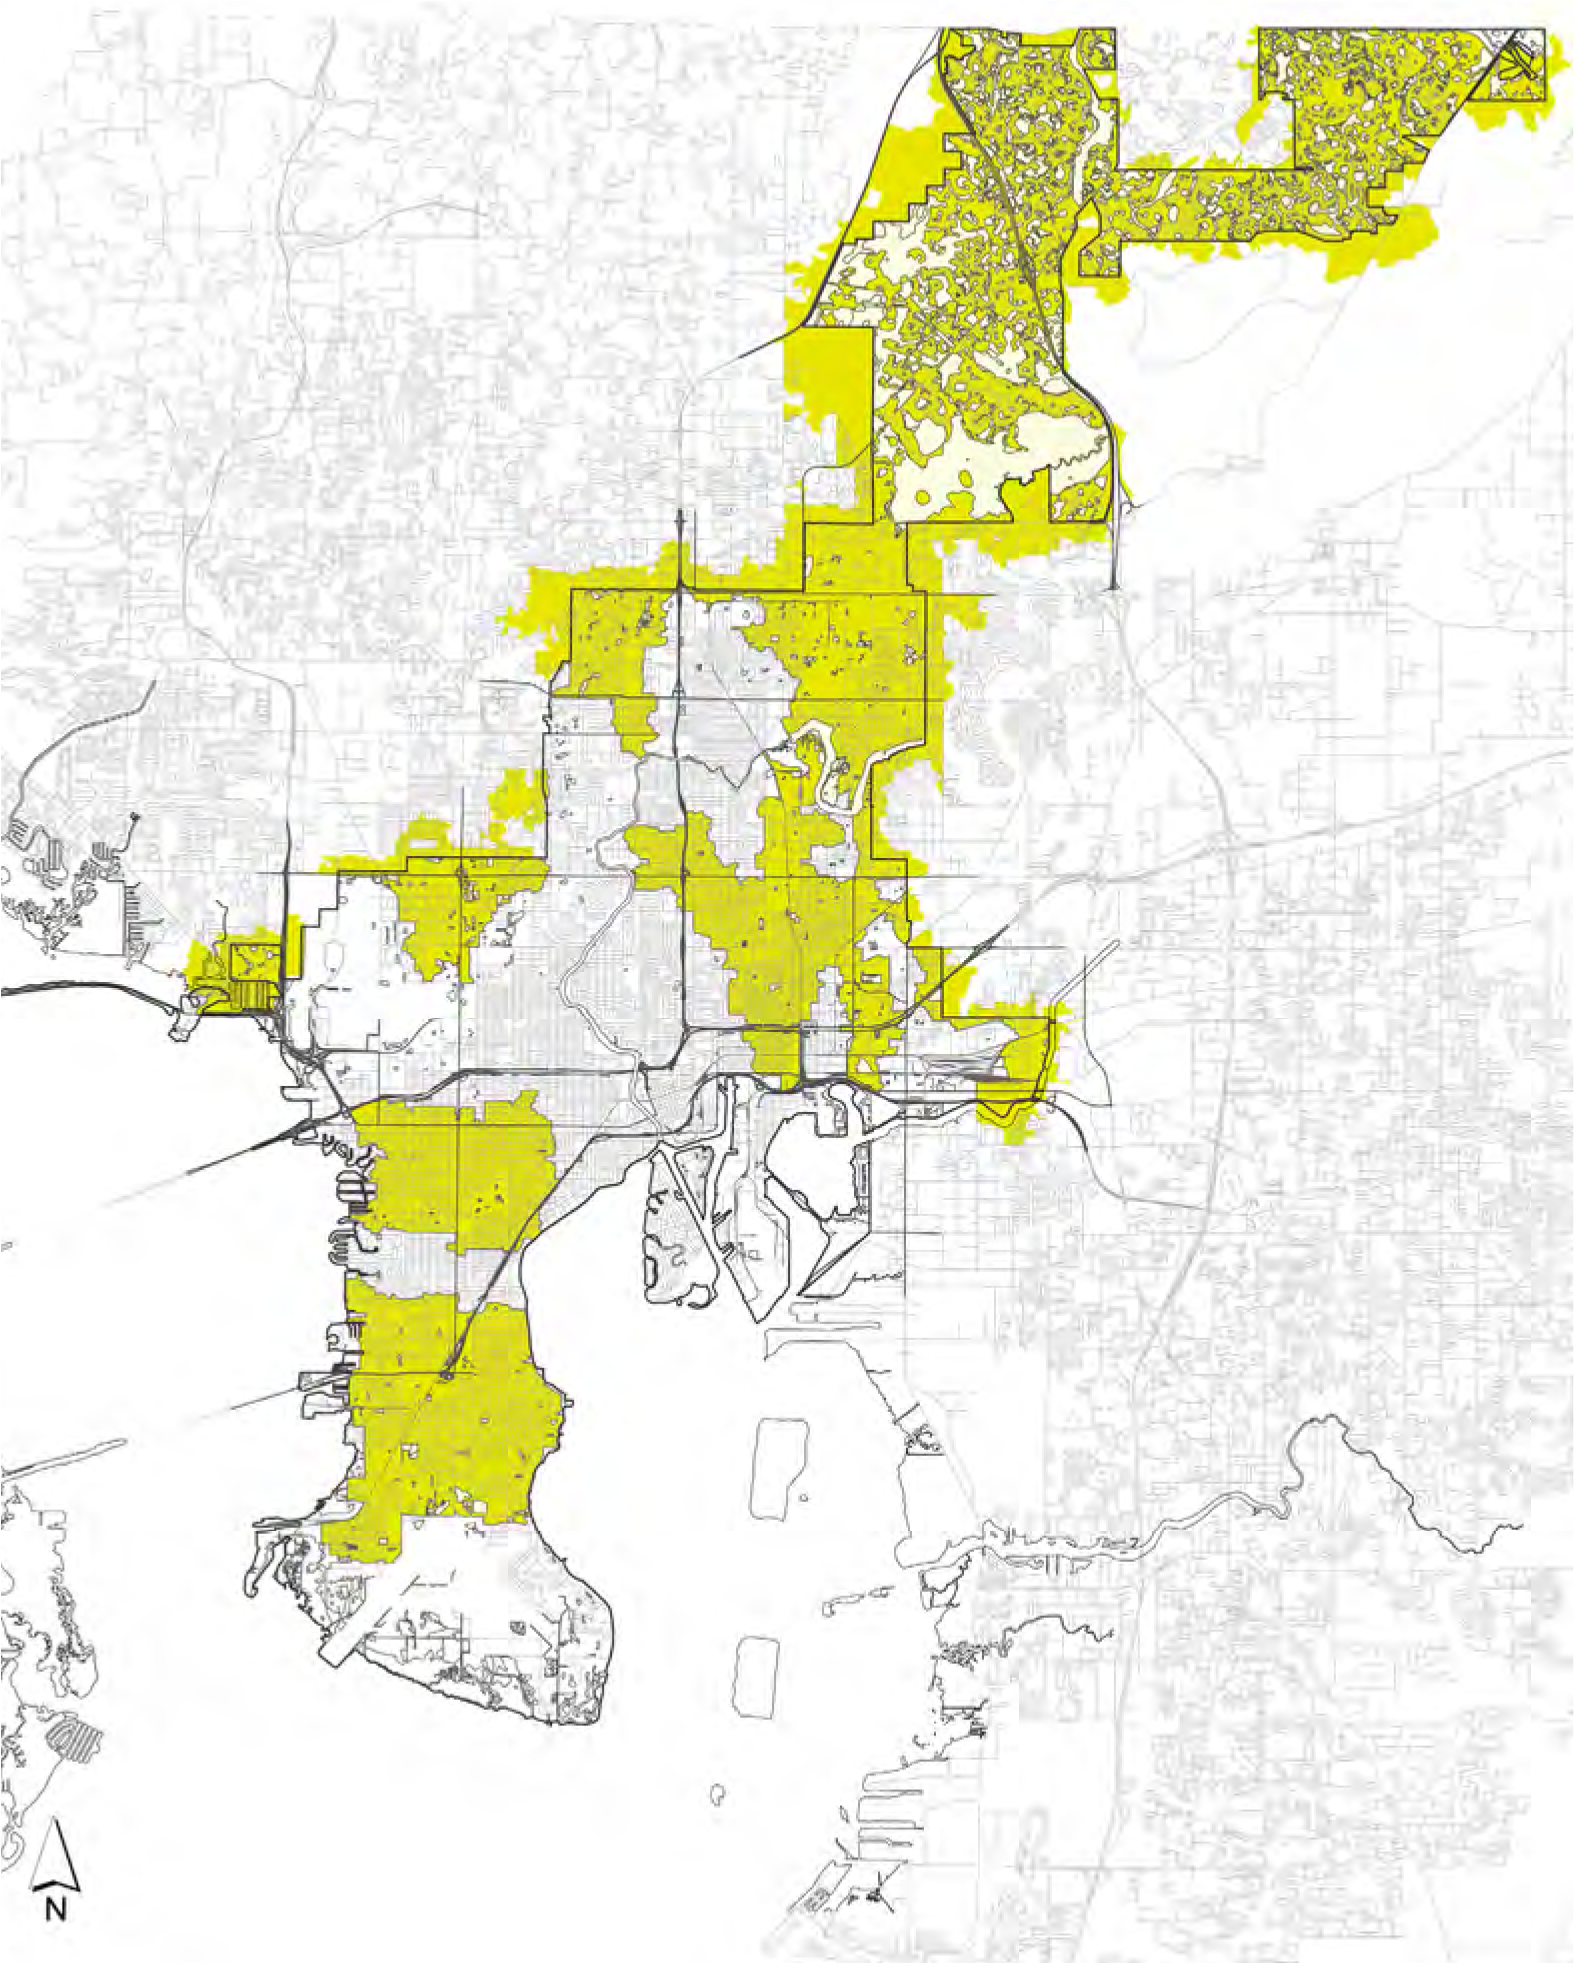
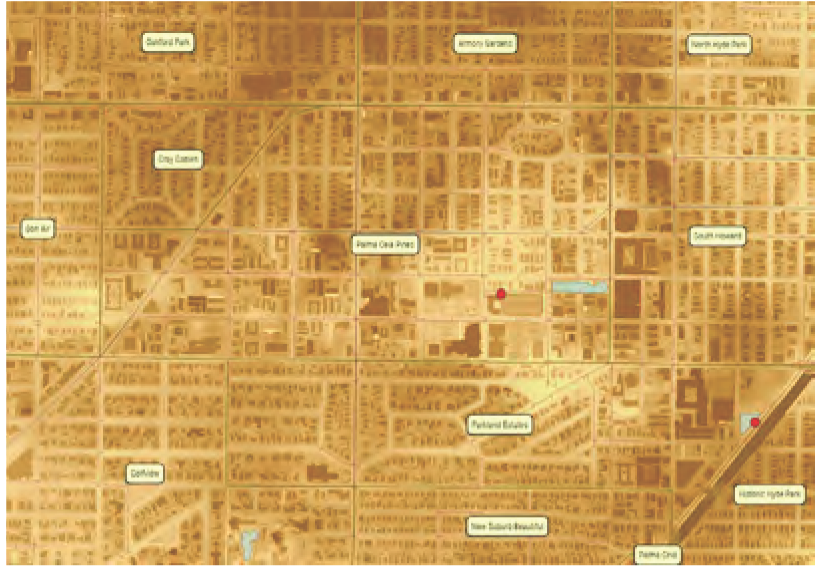
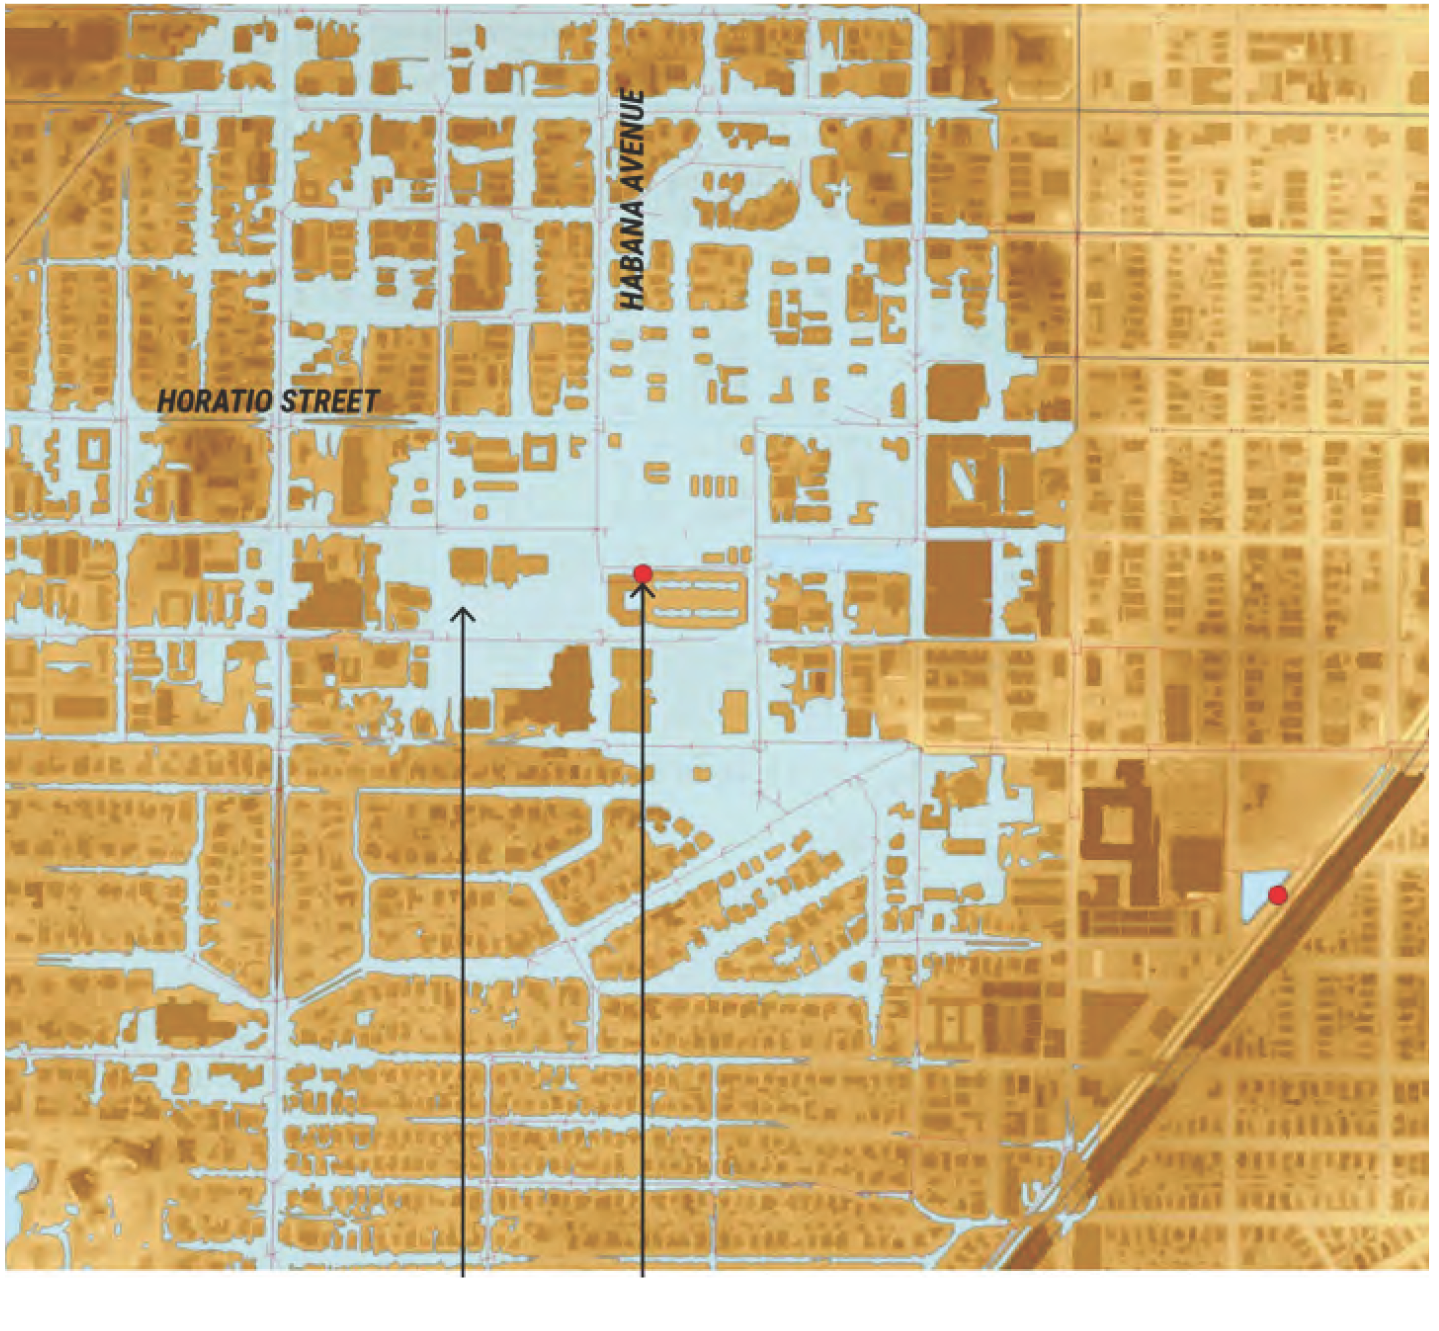
FIGURE 34: ALTHOUGH INLAND, THE PALMA CEIA PINES NEIGHBORHOOD INCLUDES A BOWL-SHAPED TOPOGRAPHY THAT IS SUSCEPTIBLE TO FLOODING -THE LIGHTER BROWN TONE IS LOWER. FIGURE 35: THE 100-YEAR RAINFALL MODEL IS SHOWN ABOVE.
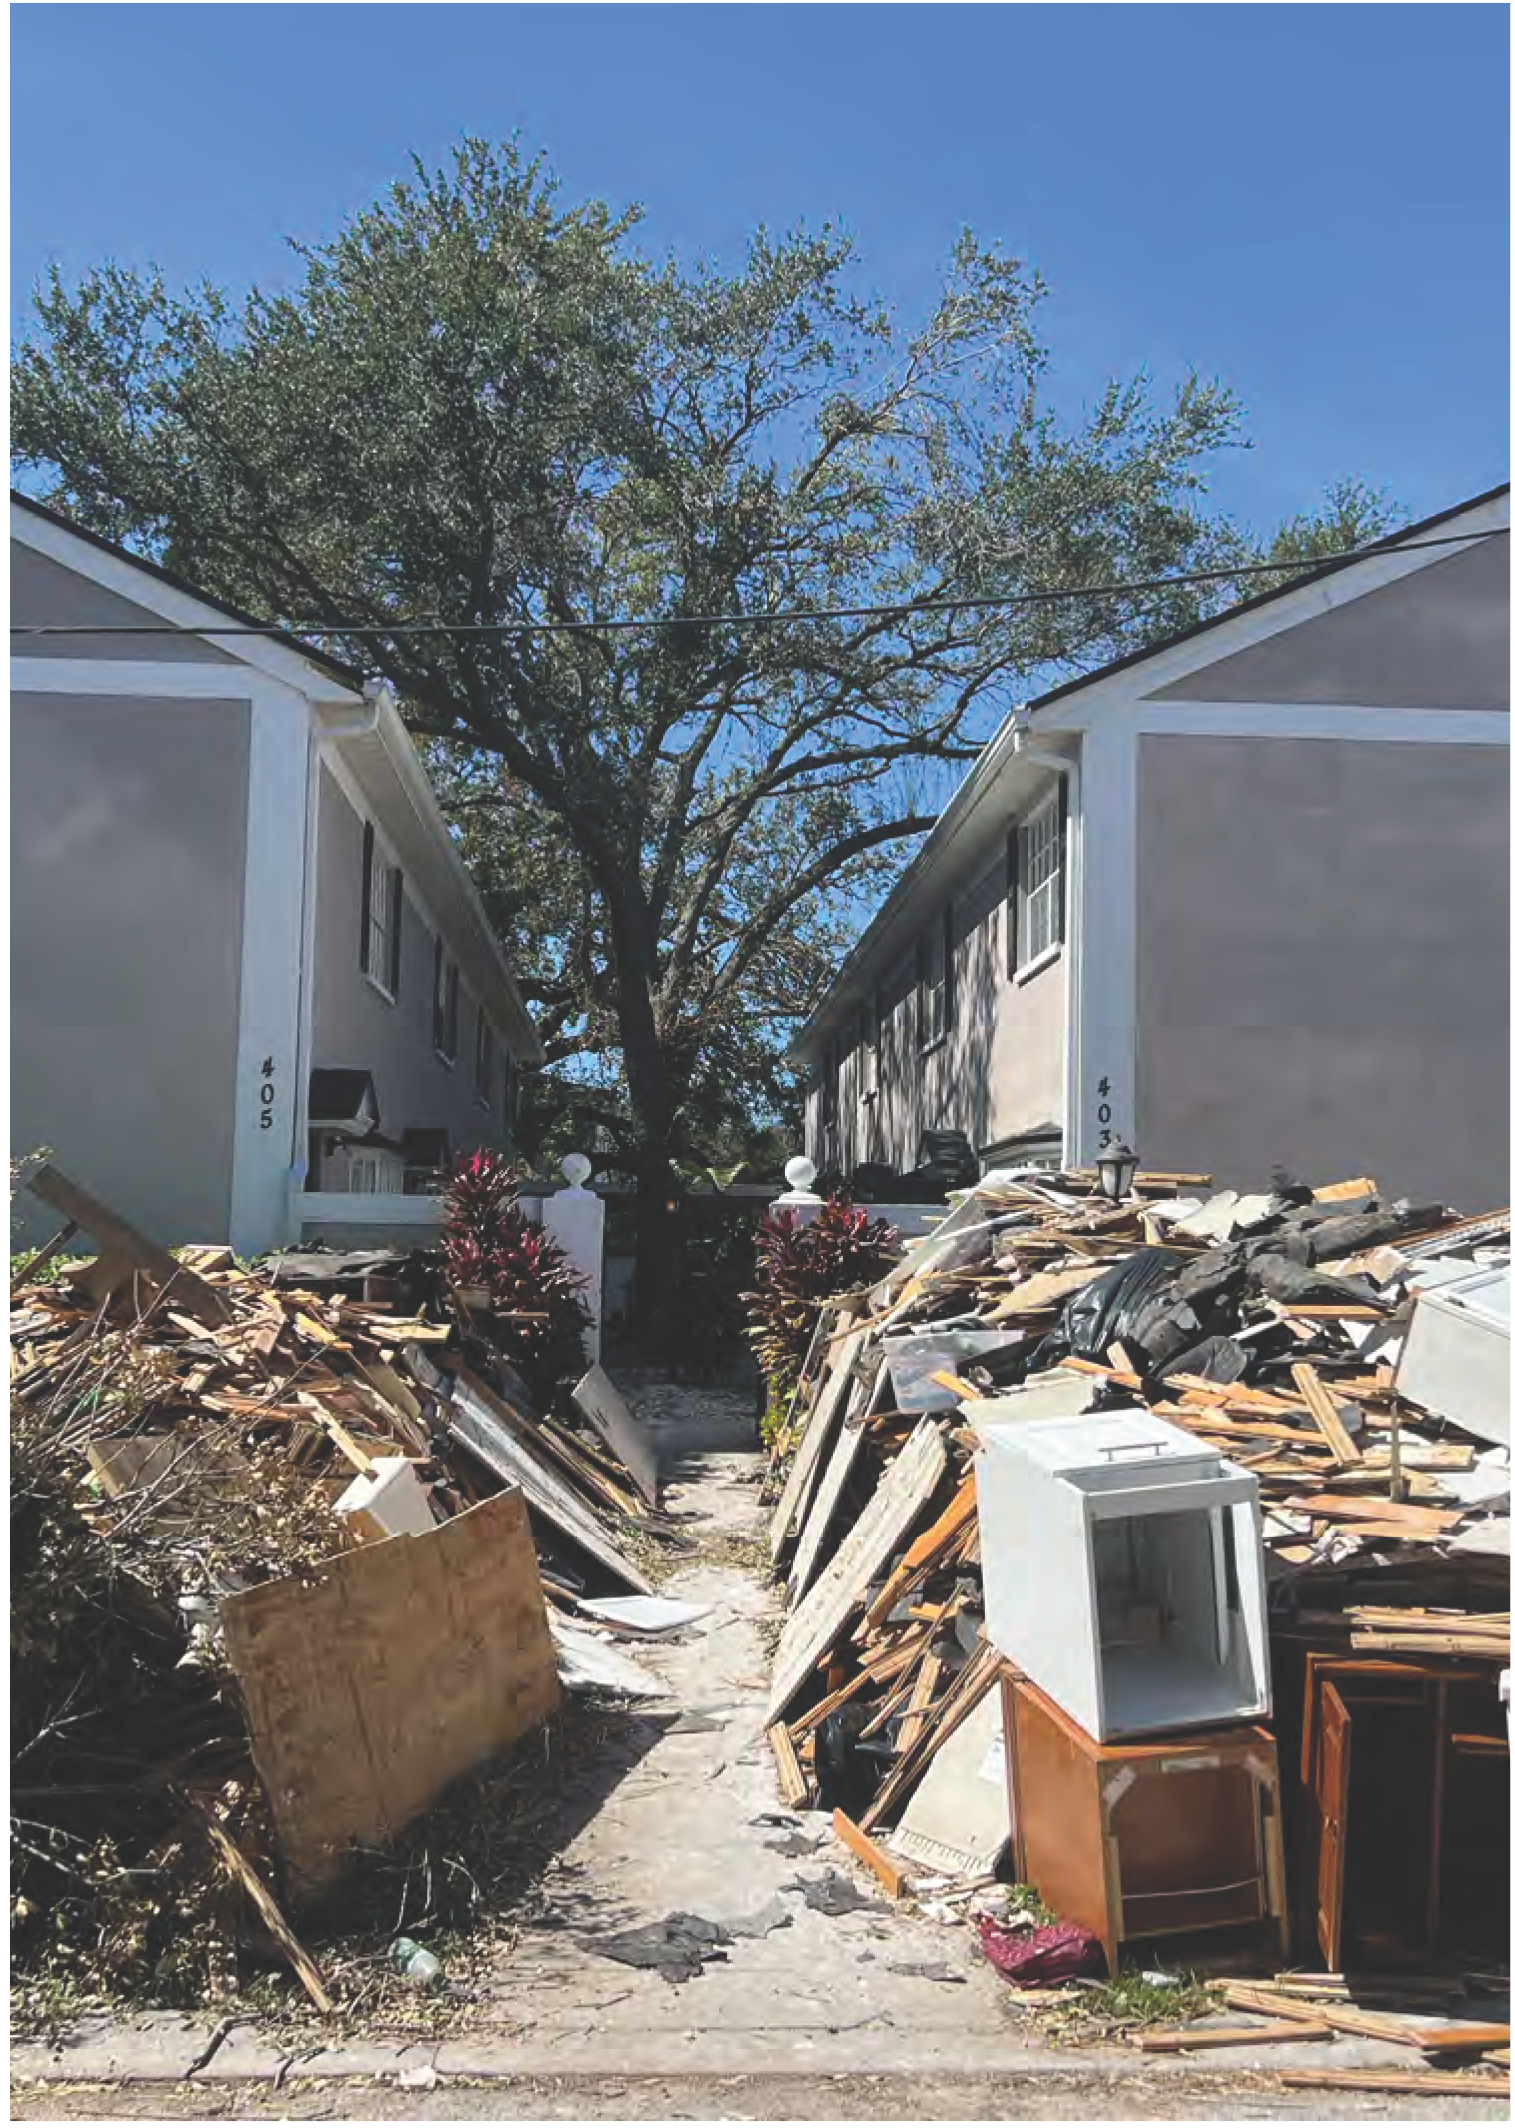
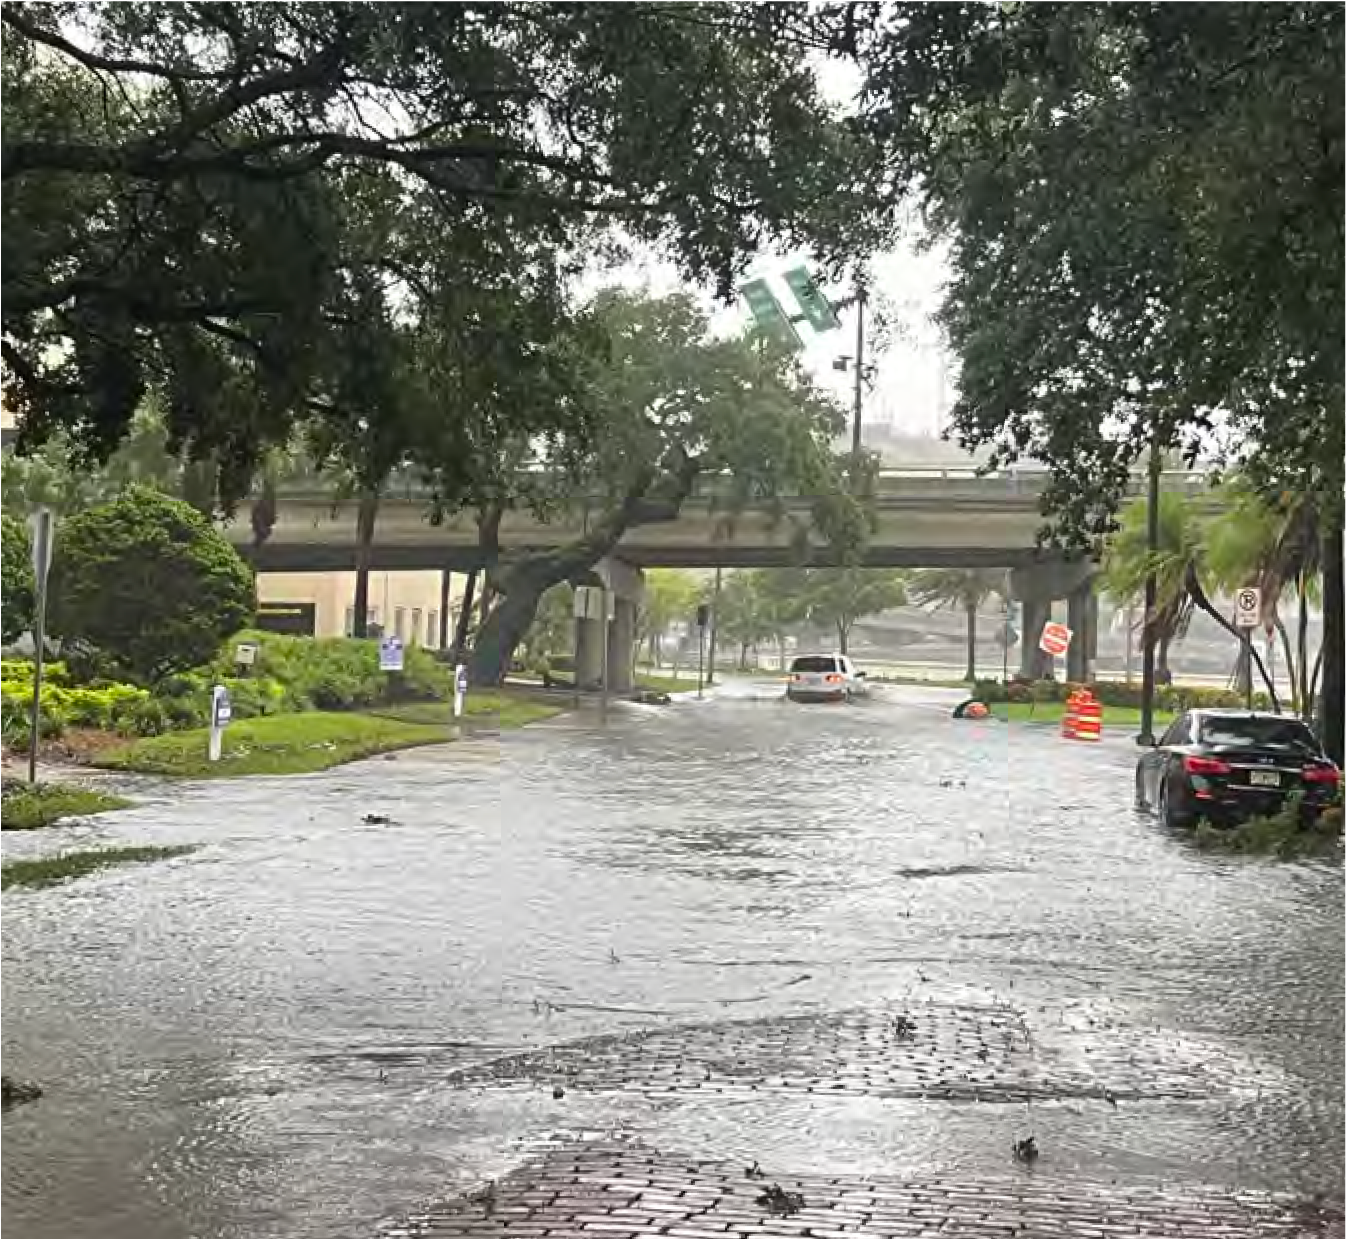
FIGURE 36: 405 ARROWANA AVENUE, IN THE PALMA CEIA PINES NEIGHBORHOOD, AFTER HURRICANE MILTON (2024) CAUSED SIGNIFICANT FLOODING.
STORM SURGE
Coastal water levels can drastically increase with the approach of a hurricane, as a result of wind setup, low pressure, and long-wave action. This produces a much different high-water mark than seasonal tides, as were studied in the sea level rise, or seasonal high tide, section of this study. The 1% storm (or a storm with a 100-year recurrence interval) could bring around 10-12 feet of additional water to the Tampa coastline, the .2% (or 500year) storm could bring 15 feet. These scenarios are calculated by the Federal Emergency Management Agency (FEMA) and are used to delineate flood insurance zones on their Flood Insurance Rate Maps (FIRMs). Whereas these levels are calculated based on historical information, this study uses NOAA scenarios for future water levels to understand the expected future 1% and .2% storm surge levels, and to evaluate the city’s critical infrastructure in relation to these floodplains.
Storm Surge Impacts
Generally, storm surge will have the greatest impact along the west side of the Tampa peninsula and at other areas of former wetland or coastline that were altered for development purposes, such as Davis Islands, Harbour Island, and Port Tampa Bay’s Hooker’s Point campus. Before 2024, the last major surge to hit the city was in 1921, before development occurred in these areas. At that time, the City’s earliest development, such as downtown, in Hyde Park, West Tampa, and Tampa Heights, were not affected. Since then, the city has expanded. During recently recorded surge elevations, including those that occurred during Tropical Storm Eta (2020, at 4.47 feet NAVD88 at the East Bay tide gauge), Hurricane Idalia (2023, at 5.42 feet), Hurricane Debby (2024, at 3.82 feet), and Hurricane Helene (2024, at 8.05 feet), damage was limited to coastal areas, especially those that were more recently developed on low lying land . Areas impacted by the 100-year storm surge, as modeled by this study, would include:
- Areas immediately along the Hillsborough River
- Davis Islands and Harbour Island
- Palmetto Beach
- Channelside
- Ballast Point
- MacDill Air Force Base
- Westshore
- Along Bayshore Boulevard; for storm surge the primary trouble spot is in is Hyde Park Preservation
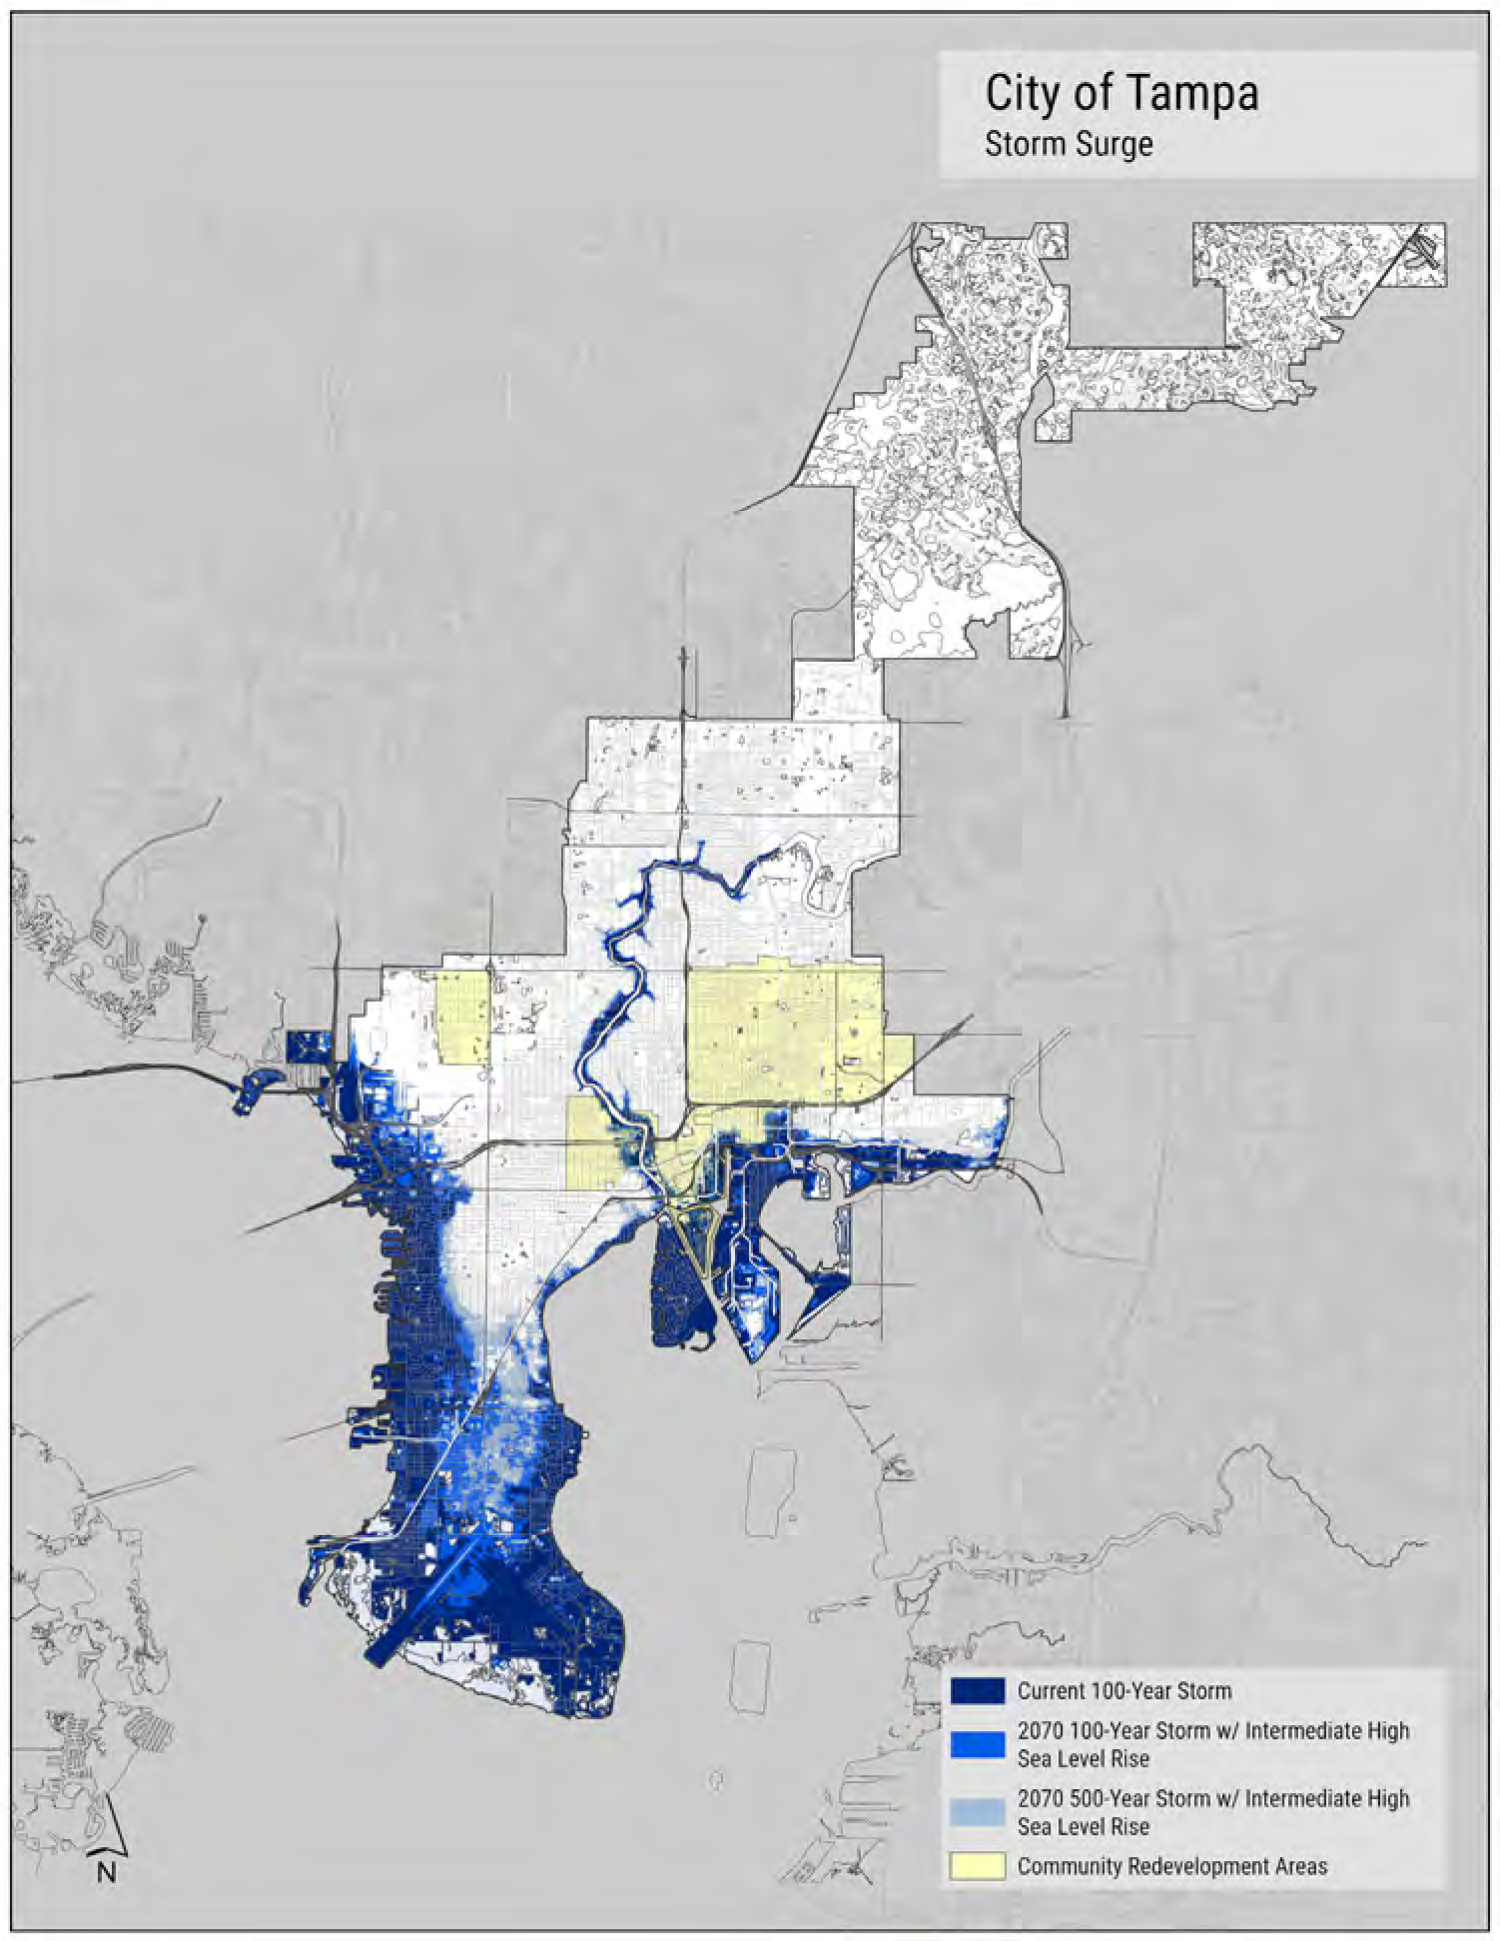
FIGURE 37: CURRENT AND FUTURE 100-YEAR (1%) STORM SURGE SCENARIOS. FUTURE CONDITIONS REFERENCE THE INTERMEDIATE-HIGH SEA LEVEL RISE SCENARIO FOR THE YEAR 2070.
- Area just south of the Tampa International Airport, and along the airport’s western edge
- Rocky Point island along Courtney Campbell Causeway
Other Relevant Flood Source Data
The city maintains other sources of flood information that should be considered along with the assessment results as supporting information.
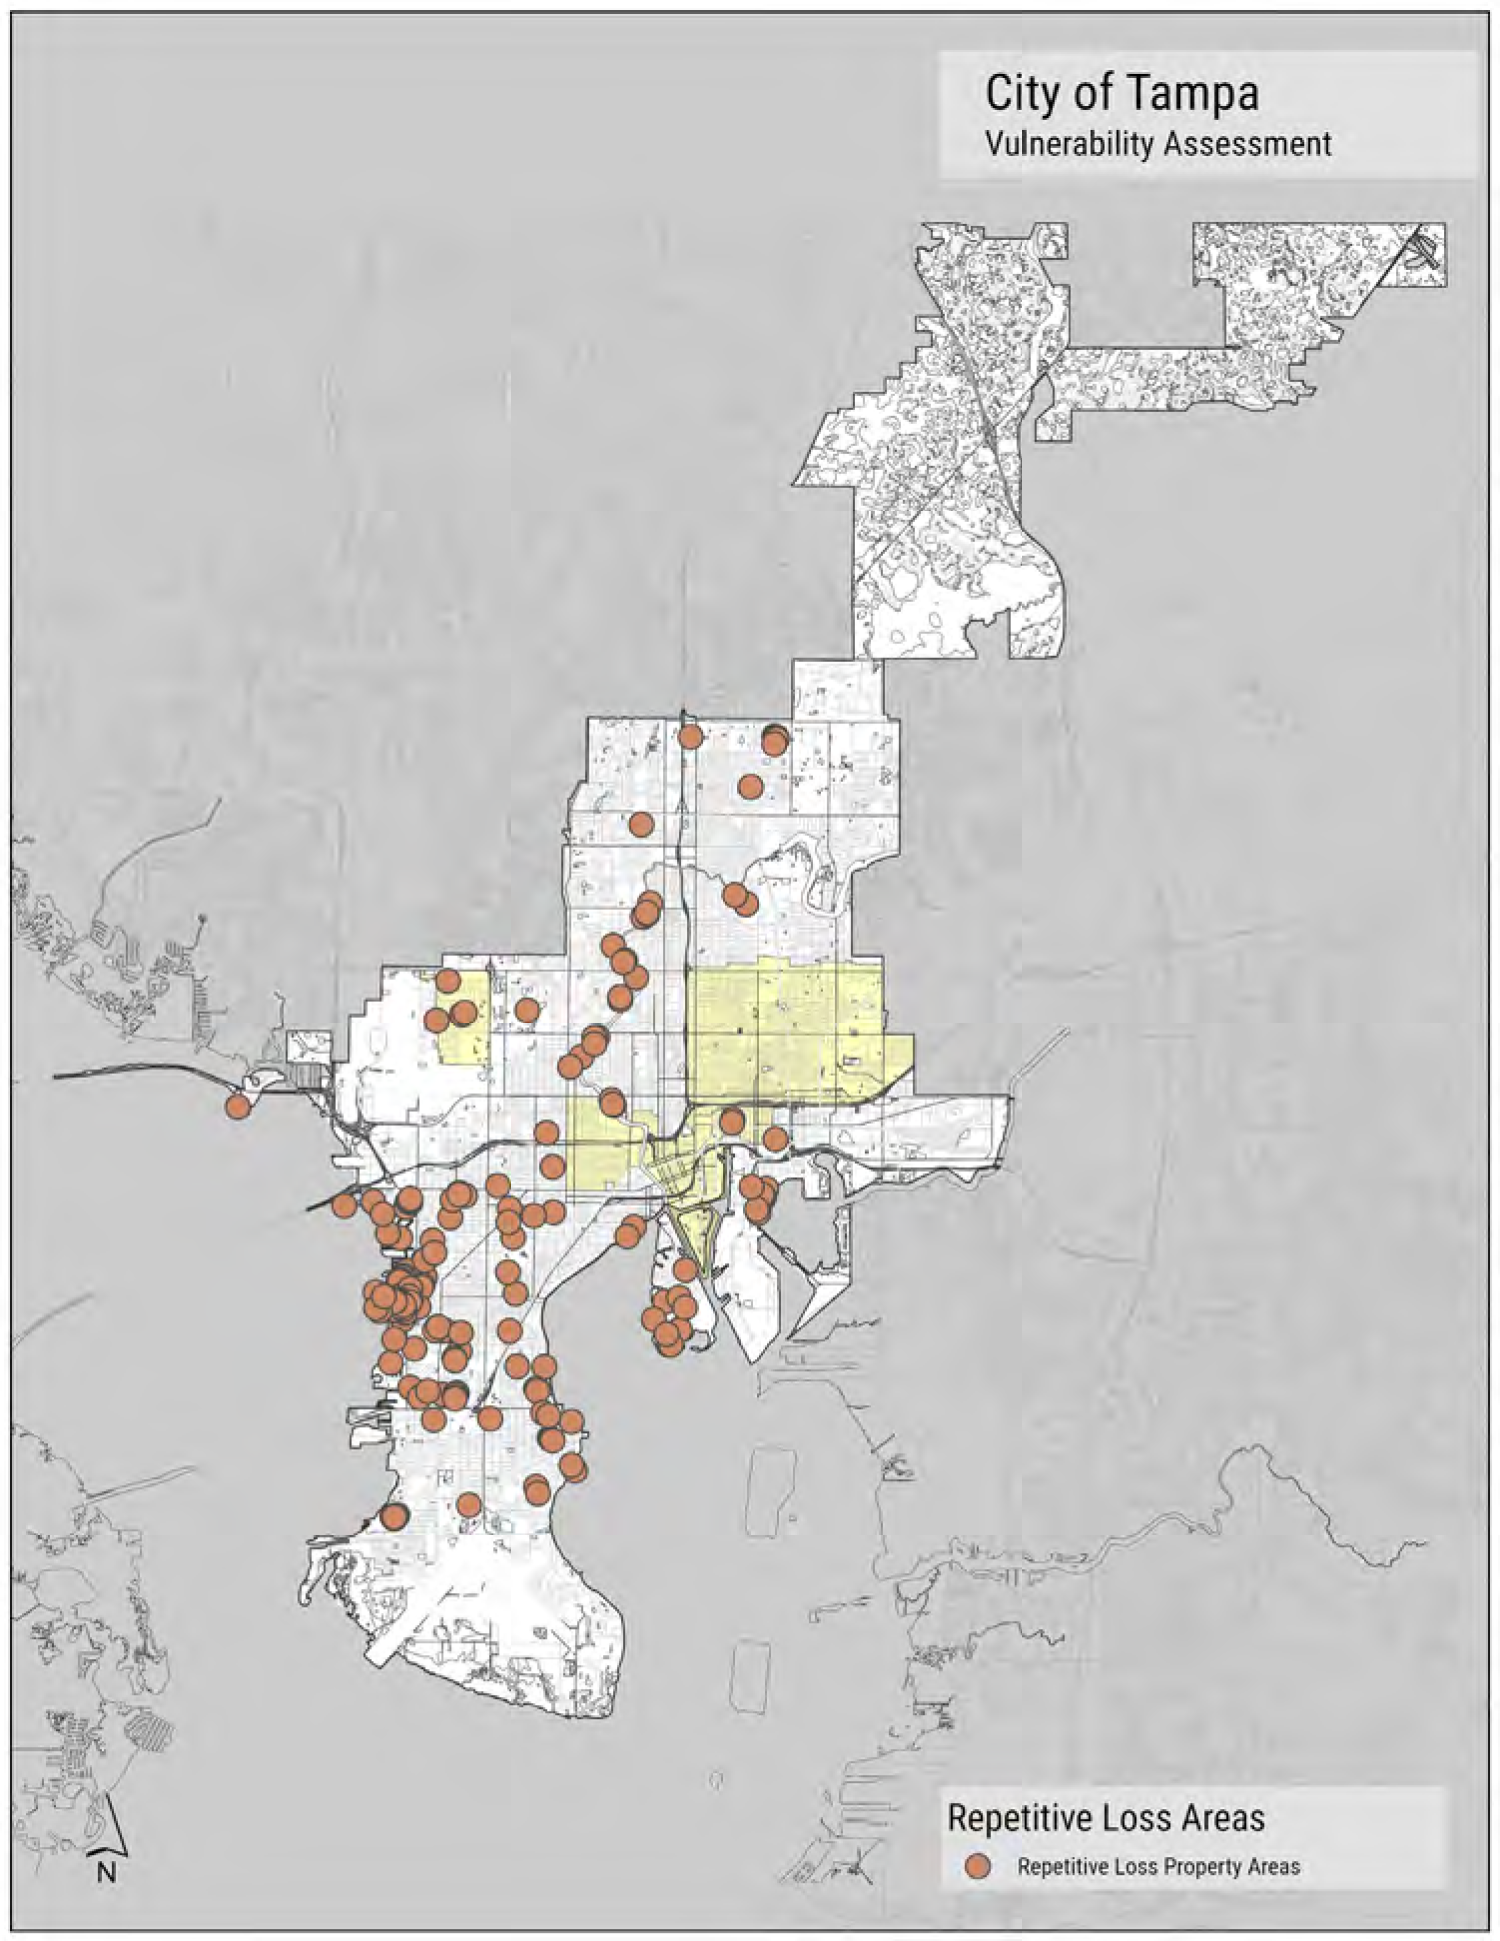
Repetitive Loss Properties
Repetitive loss properties are those that have submitted either four or more separate claim payments of more than $5,000 each (including building and contents payments); or two or more separate claim payments (building payments only) where the total of the payments exceeds the current value of the property. A mapping of such properties highlights vulnerable areas within the city where repeated flooding has occurred.
Flood Complaints and The Stormwater Advisory List
During storms, citizens and emergency management personnel can report the condition of roadways, to be archived by the city’s database. These reports also provide a convenient representation of flooding that occurs within the city. Recent storms have provided multiple instances of flooding, with mappings to show where problems are occurring within the city. The stormwater advisory list is a proactive tool that is unique to Tampa. The city created it to mitigate future flood problems and to impose additional constraints on new development in flood-prone areas.
Project Data
Vulnerability Assessments combine interdisciplinary skill sets which rely heavily on Geographic Information System (GIS) data processing and an understanding of engineered systems, such as stormwater, wastewater, and potable water. For this study, a digital inventory of city assets was created within GIS databases. This inventory was collected from readily available sources, such as Tampa’s “geohub” and data requests to city staff, and was reviewed, re-categorized, and re-processed for accuracy and compliance with FDEP standards. The process is meant to limit errors and omissions (E&O), but may have occurred due to inaccuracies of the data provided. Any perceived E&O should be reported to city staff and can be incorporated into future edits of this report.
ASSESSING VULNERABILITIES
ASSET DATA
A comprehensive catalog of City assets was collected and associated with digital elevation data. Table 6 provides a list of the features included. Since most assets were not associated with vertical elevation information, their assigned height was equal to the adjacent ground value. In some cases, this is not the actual point of vulnerability.
For example, a wastewater pump may or may not be vulnerable at the ground height – the pump may be sensitive to flooding only when the water rises a few feet above the ground to where it reaches electrical components. This variability is not accounted for by this study; therefore, the findings of the assessment should be used to focus future efforts on physical evaluations that are more precise.
The map set provides a visual representation of exposed assets for the 2070 intermediate-high scenario. In most cases depths are provided for areas most significantly affected. A tabular data set was also provided to the City of Tampa and the FDEP that includes the depth of flooding for all assets in every scenario.
Sensitivity and consequence scores were given based on best judgment and review with the City. Some scores were not applicable for the prioritization algorithm and so were not provided.
The list of assets analyzed by this study includes:
- Asset Class Type
- Social Vulnerability
- Transportation and Evacuation Routes
- Critical Infrastructure
- Natural, Cultural, and Historic Resource
- Critical Community and Emergency Facilities
TABLE 4: ASSET FEATURES INCLUDED IN THE ASSESSMENT, AND THEIR CORRESPONDING MAPS.
| Map Name | Asset Type | Sensitivity Score | Consequence Score |
|---|---|---|---|
| Stormwater Structures | SW Treatment Facility (ponds) | N/A | N/A |
| Sediment Traps | N/A | N/A | |
| Pump Stations | 2 | 3 | |
| Stormwater Inlets | Stormwater Inlets | 1 | 1 |
| Stormwater Outfalls | Stormwater Outfalls | N/A | N/A |
| Stormwater Pipes | N/A | N/A | |
| Transportation - Local | Major Roadways | 1 | 3 |
| Minor Roadways | 1 | 2 | |
| Evacuation Routes | 2 | 3 | |
| Bridges | N/A | N/A | |
| Rail Facilities | 1 | 2 | |
| Railroad Bridges | 1 | 2 | |
| Transportation - Transit | Bus Stops | 2 | 2 |
| Bus Terminals | 2 | 2 | |
| Streetcar Stops | 2 | 2 | |
| Transportation - Industrial | Airport Parcels | N/A | N/A |
| Port Parcels | N/A | N/A | |
| Structures | Buildings | 2 | 2 |
| Parcels | N/A | N/A | |
| Government Facilities | City Owned Properties | 2 | 2 |
| State Government Facilities | 2 | 2 | |
| Correctional Facilities | 2 | 3 | |
| Military Installations | N/A | N/A | |
| City Owned Parking Garages | 1 | 2 | |
| City Owned Parking Lots | 1 | 1 | |
| City Owned Community Centers | 2 | 2 | |
| Educational Facilities | Schools | 2 | 2 |
| Colleges and Universities | 2 | 2 | |
| First Responders | Emergency Response Centers | 2 | 4 |
| Category | Facility/Asset | Quantity (Current) | Quantity (Future) |
|---|---|---|---|
| Fire Stations | Fire Stations | 2 | 4 |
| Law Enforcement Facilities | Law Enforcement Facilities | 2 | 3 |
| Fire & Police Training Center | Fire & Police Training Center | 2 | 2 |
| Fire & Police Supply Building | Fire & Police Supply Building | 2 | 3 |
| Fire Supply Buildings | Fire Supply Buildings | 2 | 3 |
| Coop Locations | Coop Locations | 2 | 4 |
| Fire & Police Dispatch | Fire & Police Dispatch | 2 | 3 |
| Fire Rescue Boats | Fire Rescue Boats | 1 | 2 |
| Tampa Police Dept. Boats | Tampa Police Dept. Boats | 1 | 2 |
| Emergency Logistics | |||
| Disaster Recovery Centers | Disaster Recovery Centers | 2 | 3 |
| Disaster Debris Management | Disaster Debris Management | 2 | 3 |
| Emergency Operations Center | Emergency Operations Center | 2 | 4 |
| Logistical Staging Areas | Logistical Staging Areas | 2 | 3 |
| Communication Towers | Communication Towers | 2 | 3 |
| Coastal Public Amenities | |||
| Piers | Piers | N/A | N/A |
| Beaches | Beaches | N/A | N/A |
| Docks & Boat Ramps | Docks & Boat Ramps | N/A | N/A |
| Marinas | Marinas | N/A | N/A |
| Cultural Sites | |||
| Historical & Cultural Assets | Historical & Cultural Assets | 2 | 2 |
| Cemeteries | Cemeteries | 1 | 2 |
| Parks and Open Space | |||
| Conservation Lands | Conservation Lands | 1 | 1 |
| Public Open Spaces | Public Open Spaces | 1 | 1 |
| Water | |||
| Water Pumps | Water Pumps | 2 | 3 |
| Water Facilities | Water Facilities | 2 | 3 |
| Reclaimed Water Pumps | Reclaimed Water Pumps | 2 | 2 |
| Clearwell Storage Tanks | Clearwell Storage Tanks | 1 | 3 |
| Elevated Storage Tanks | Elevated Storage Tanks | 1 | 4 |
| Wastewater | |||
| Pump Stations | Pump Stations | 2 | 3 |
| Small Pump Stations | Small Pump Stations | 2 | 2 |
| Wastewater Pressurized Main | Wastewater Pressurized Main | N/A | N/A |
| HFC AWWTP | HFC AWWTP | 2 | 4 |
| Septic Tanks | Septic Tanks | 2 | 2 |
| Solid Waste | |||
| Private Waste Facilities | Private Waste Facilities | 2 | 3 |
| Category | Facility/Asset | Quantity (Current) | Quantity (Future) |
|---|---|---|---|
| Public Waste Facilities | Public Waste Facilities | 2 | 3 |
| Medical Care | Hospitals | 2 | 4 |
| Emergency Medical Services | Emergency Medical Services | 2 | 3 |
| Industrial Sites | Industrial Sites | N/A | N/A |
| Commercial Sites | Commercial Sites | N/A | N/A |
| Vulnerable Housing Types | Retirement Homes | N/A | N/A |
| Affordable Public Housing | Affordable Public Housing | N/A | N/A |
| Assisted Living Facilities | Assisted Living Facilities | N/A | N/A |
| Mobile Homes | Mobile Homes | N/A | N/A |
| Tampa Housing Authority | Tampa Housing Authority | N/A | N/A |
| Repetitive Loss Area | Repetitive Loss Properties | N/A | N/A |
| Environmental | Surface Waters | N/A | N/A |
| Wetlands | Wetlands | N/A | N/A |
| Mangroves | Mangroves | N/A | N/A |
| Marshes | Marshes | N/A | N/A |
| Oysters | Oysters | N/A | N/A |
| Sea Grass | Sea Grass | N/A | N/A |
| Category | High Consequence | Moderate Consequence | Low Consequence | Negligible Consequence |
|---|---|---|---|---|
| 4 | • Elevated Water Storage Tank • Emergency Operations and Response Center • Coop Locations • Fire Station • Wastewater Treatment Plan • Hospitals |
• N/A | ||
| 3 | • Major Roadways • Clearwell Storage |
• Stormwater Pump Stations • Evacuation Routes • Law Enforcement Facilities • Fire Dispatch, Training, and Supply Facilities • Disaster Recovery Centers • Debris Management Sites • Logistical Staging Sites • Communication Towers • Water Pumps • Water Facilities • Wastewater Pump Stations • Solid Waste Facilities Emergency Medical Services |
• N/A | |
| 2 | • Minor Roadways • Rail Facilities and Bridges • Fire and Police Boats • Cemeteries |
• Bus Stops and Terminals • Private Buildings • Public Facilities • Schools (incl. Higher Ed) • Historical and Cultural Assets • Reclaimed Water Pumps • Septic Tanks |
• N/A | |
| 1 | Negligible Consequence | • Stormwater Inlets • Parking Lots • Public Open Space and Conservation Lands |
• N/A | |
| Sensitivity Subcategories | ||||
| Low Sensitivity | Moderate Sensitivity | High Sensitivity | ||
| 1 | 2 | 3 | ||
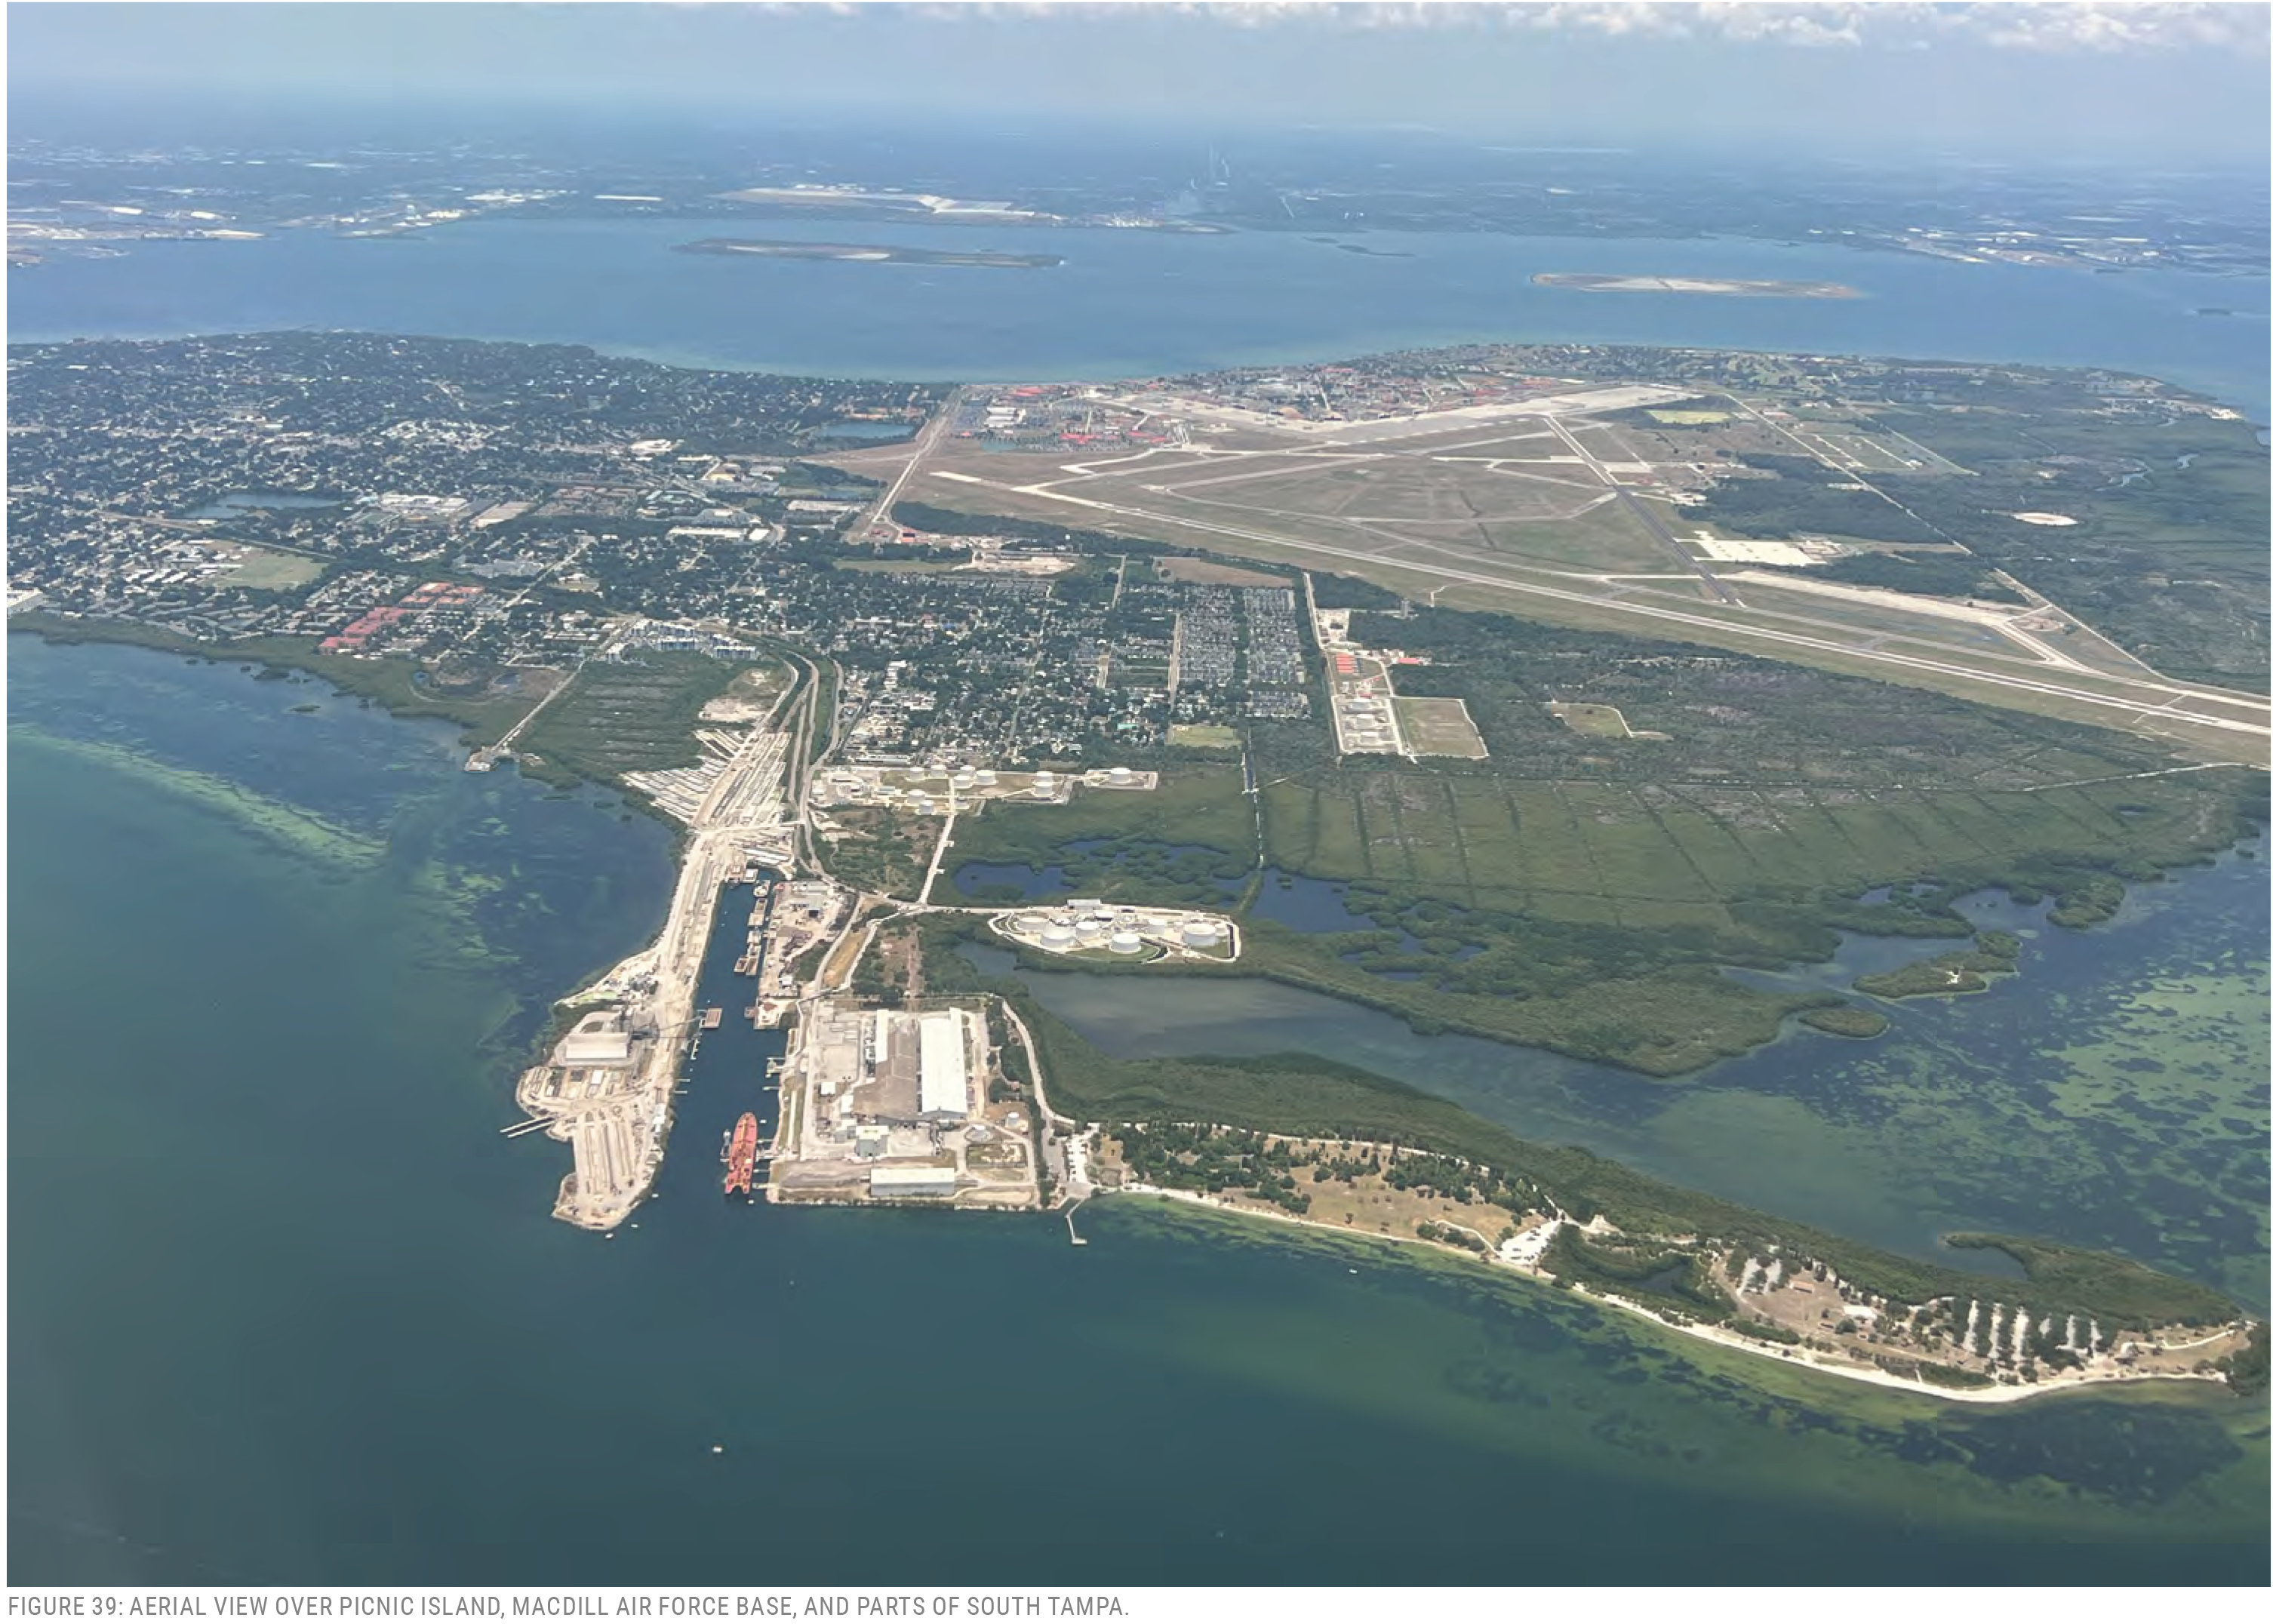
FIGURE 39: AERIAL VIEW OVER PICNIC ISLAND, MAC DILL AIR FORCE BASE, AND PARTS OF SOUTH TAMPA.
NUMBER OF IMPACTED ASSETS BY SCENARIO
The following charts were created with the best available data, provided by the City of Tampa and online sources. Quantities are approximate. Additional scenarios were provided to the city in tabular format, which was too large to show here.

*Transportation -Local
*LENGTH OF IMPACTED ASSET IN FEET
| Asset Type | Rainfall 100-Y Current | SLR Int-High 100-Y 2070 | SLR Int-High 100-Y 2040 | SLR Int-Low 1-Y 2040 | SLR Int-Low 1-Y 2070 | SLR Int-High 1-Y 2070 | Total Current |
|---|---|---|---|---|---|---|---|
| Minor Roads | 5,394 | 14,174 | 22,005 | 234,245 | 1,515,594 | 1,950,058 | 1,389,294 |
| Major Roads | 152 | 223 | 660 | 14,000 | 235,096 | 298,299 | 116,542 |
| Evacuation Routes | 0 | 0 | 0 | 19 | 109,444 | 137,373 | 31,596 |
| Railroads | 23 | 25 | 25 | 7,499 | 199,129 | 247,130 | 55,268 |
7,597,096 1,584,511 685,074 715,761
Transportation - Transit
| Asset Type | Rainfall 100-Y Current | SLR Int-High 100-Y 2070 | SLR Int-High 100-Y 2040 | SLR Int-Low 1-Y 2040 | SLR Int-Low 1-Y 2070 | SLR Int-High 1-Y 2070 | Total Current |
|---|---|---|---|---|---|---|---|
| Bus Stops | 0 | 1 | 1 | 5 | 119 | 198 | 190 |
| Bus Terminals | 0 | 0 | 0 | 0 | 0 | 1 | 0 |
| Streetcar Stops | 0 | 0 | 0 | 0 | 6 | 6 | 2 |
Government Facilities
| Asset Type | 2040 1-Yr SLR Int-Low | 2040 1-Yr SLR Int-High | 2070 1-Yr SLR Int-Low | 2070 1-Yr SLR Int-High | Current Coastal 100-Yr | 2070 Coastal 100-Yr IH | Current 100-Yr Rainfall | Total |
|---|---|---|---|---|---|---|---|---|
| City Owned Properties | 0 | 0 | 0 | 0 | 8 | 14 | 2 | 174 |
| State Gov’t Facilities | 0 | 0 | 0 | 0 | 10 | 11 | 9 | 369 |
| Correctional Facilities | 0 | 0 | 0 | 0 | 0 | 0 | 0 | 6 |
| Parking Garages | 0 | 0 | 0 | 0 | 0 | 0 | 0 | 10 |
| Parking Lots | 0 | 0 | 0 | 0 | 1 | 2 | 0 | 17 |
| Community Centers | 0 | 0 | 0 | 0 | 3 | 4 | 0 | 22 |
Educational Facilities
| Asset Type | 2040 1-Yr SLR Int-Low | 2040 1-Yr SLR Int-High | 2070 1-Yr SLR Int-Low | 2070 1-Yr SLR Int-High | Current Coastal 100-Yr | 2070 Coastal 100-Yr IH | Current 100-Yr Rainfall | Total |
|---|---|---|---|---|---|---|---|---|
| Schools | 0 | 0 | 0 | 0 | 3 | 8 | 1 | 77 |
| Colleges & Universities | 0 | 0 | 0 | 0 | 1 | 1 | 0 | 10 |
First Responders
| Asset Type | 2040 1-Yr SLR Int-Low | 2040 1-Yr SLR Int-High | 2070 1-Yr SLR Int-Low | 2070 1-Yr SLR Int-High | Current Coastal 100-Yr | 2070 Coastal 100-Yr IH | Current 100-Yr Rainfall | Total |
|---|---|---|---|---|---|---|---|---|
| Emergency Response Centers | 0 | 0 | 0 | 0 | 0 | 0 | 0 | 3 |
| Fire Stations | 0 | 0 | 0 | 0 | 1 | 3 | 0 | 27 |
| Law Enforcement Facilities | 0 | 0 | 0 | 0 | 0 | 0 | 0 | 5 |
| Fire & Police Training Center | 0 | 0 | 0 | 0 | 0 | 1 | 0 | 1 |
| Fire & Police Supply Building | 0 | 0 | 0 | 0 | 0 | 0 | 0 | 1 |
| Fire Supply Buildings | 0 | 0 | 0 | 0 | 0 | 0 | 0 | 2 |
| Coop Locations | 0 | 0 | 0 | 0 | 0 | 0 | 0 | 2 |
| Fire & Police Dispatch | 0 | 0 | 0 | 0 | 0 | 0 | 0 | 3 |
| Fire Rescue Boats | 0 | 0 | 0 | 0 | 1 | 2 | 0 | 2 |
| TPD Boats | 0 | 0 | 0 | 0 | 0 | 0 | 0 | 2 |
| Total | 5 |
Emergency Logistics
| Asset Type | 2040 1-Y r SLR Int-Low | 2040 1-Y r SLR Int-High | 2070 1-Y r SLR Int-Low | 2070 1-Y r SLR Int-High | Current Coastal 100-Y r | 2070 Coastal 100-Y r IH | Current 100-Y r Rainfall | Total |
|---|---|---|---|---|---|---|---|---|
| Risk Shelter Inventory | 0 | 0 | 0 | 0 | 0 | 0 | 0 | 7 |
| Disaster Recovery Center | 0 | 0 | 0 | 0 | 0 | 0 | 0 | 3 |
| Disaster Debris Management | 0 | 0 | 0 | 0 | 1 | 4 | 1 | 7 |
| Emergency Operations Center | 0 | 0 | 0 | 0 | 0 | 0 | 0 | 1 |
| Logistical Staging Areas | 0 | 0 | 0 | 0 | 0 | 0 | 0 | 2 |
| Communication Towers | 0 | 0 | 0 | 0 | 0 | 0 | 0 | 8 |
Cultural Sites
| Historic and Cultural Assets | 2040 1-Y r SLR Int-Low | 2040 1-Y r SLR Int-High | 2070 1-Y r SLR Int-Low | 2070 1-Y r SLR Int-High | Current Coastal 100-Y r | 2070 Coastal 100-Y r IH | Current 100-Y r Rainfall | Total |
|---|---|---|---|---|---|---|---|---|
| Historic and Cultural Assets | 0 | 0 | 0 | 18 | 19 | 0 | 0 | 93 |
| Cemeteries | 0 | 0 | 0 | 0 | 0 | 0 | 0 | 6 |
Water
| Asset Type | 2040 1-Y r SLR Int-Low | 2040 1-Y r SLR Int-High | 2070 1-Y r SLR Int-Low | 2070 1-Y r SLR Int-High | Current Coastal 100-Y r | 2070 Coastal 100-Y r IH | Current 100-Y r Rainfall | Total |
|---|---|---|---|---|---|---|---|---|
| Water Pumps | 0 | 0 | 0 | 0 | 0 | 0 | 1 | 4 |
| Water Facilities | 0 | 0 | 0 | 0 | 2 | 2 | 1 | 6 |
| Reclaimed Water Pumps | 0 | 0 | 0 | 0 | 4 | 4 | 0 | 4 |
| Clearwell Storage Tanks | 0 | 0 | 0 | 0 | 0 | 0 | 0 | 2 |
| Elevated Storage Tanks | 0 | 0 | 0 | 0 | 0 | 0 | 1 | 2 |
| Asset Type | 2040 1-Yr SLR Int-Low | 2040 1-Yr SLR Int-High | 2070 1-Yr SLR Int-Low | 2070 1-Yr SLR Int-High | Current Coastal 100-Yr | 2070 Coastal 100-Yr IH | Current 100-Yr Rainfall | Total |
|---|---|---|---|---|---|---|---|---|
| Small Pump Stations | 1 | 2 | 3 | 12 | 251 | 321 | 116 | 856 |
| Large Pump Stations | 0 | 0 | 0 | 4 | 64 | 72 | 45 | 167 |
| HFC AWWTP | 0 | 0 | 0 | 0 | 0 | 0 | 0 | 1 |
| Septic Tanks | ||||||||
| Septic Tanks | 0 | 0 | 0 | 2 | 21 | 28 | 23 | 257 |
| Solid Waste | ||||||||
| Private Waste Facilities | 0 | 0 | 0 | 0 | 3 | 5 | 1 | 26 |
| Public Waste Facilities | 0 | 0 | 0 | 0 | 5 | 6 | 0 | 8 |
| Hospitals | 0 | 0 | 0 | 0 | 0 | 1 | 0 | 11 |
| Emergency Medical Services | 0 | 0 | 0 | 0 | 3 | 3 | 1 | 22 |
| Industrial Sites | 0 | 0 | 0 | 46 | 245 | 375 | 164 | 1440 |
STORMWATER SYSTEMS
INTRODUCTION
The stormwater system is responsible for delivering water from upland areas to the sea. Water travels on the surface (hydrologic flow) to tributaries or major water bodies, or underground through pipes and culverts (hydraulic flow). Water also percolates into the soil, which is a major factor especially in Florida. The water then migrates laterally through soil to major water bodies or settles into an aquifer. Florida is also unique in that it has a very flat terrain. This means that there are intermittent low spots between uplands and lowlands, called basins. In heavy downpours, water can fill in a basin if there is insufficient flow out of it. When water is held in by the ridges of a basin, it can only be removed through percolation, by man-made inlets and pipes, or often there will be a “sink,” which is an opening in the ground that collects and moves water subsurface to an aquifer.
Stormwater system vulnerability maps are separated for visual clarity; inlets, outfalls (and pipes), and structures (pump stations and sediment traps) are on separate maps. Pipe, culvert and swale information was used to determine the hydraulic connection between water at the coast and inland areas.
STORMWATER INLETS
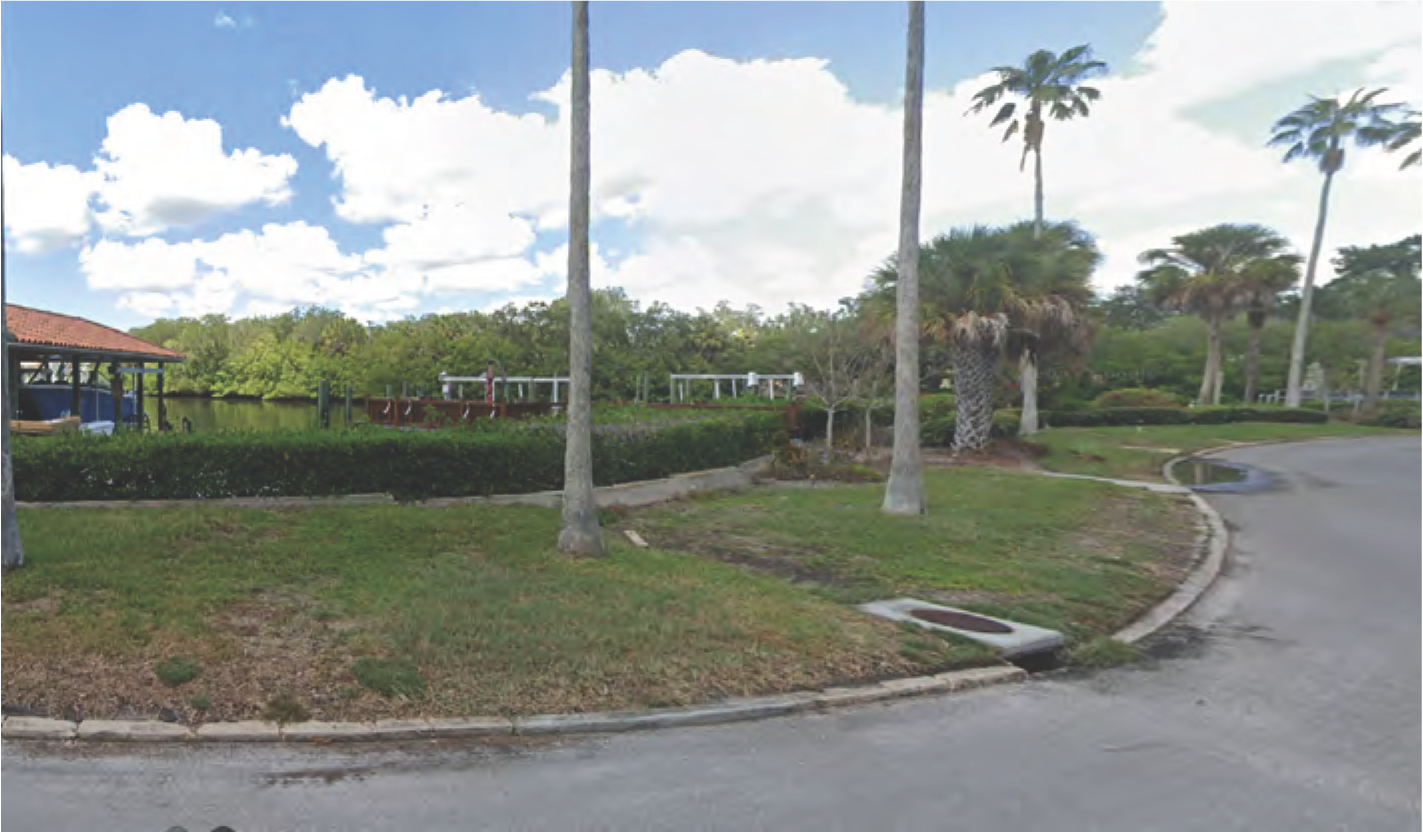
Stormwater inlets are usually at the low point of a watershed. They are responsible for collecting water and transporting it through pipes to outfall locations.
An inlet is only functional when it is able to capture water and move it to a lower elevation. In the case of high tide flooding, if an inlet is within the floodplain, there is no lower ground to move it to. The inlet essentially becomes a part of the terrain, a clogged point of entry. Flooding is exacerbated when this occurs. As water rises around an inlet, head pressure develops, which moves water through the system with gravitational force. This is a technical aspect of inlet functionality that should be reviewed for each flooding location and scenario.
FINDINGS
Sea Level Rise
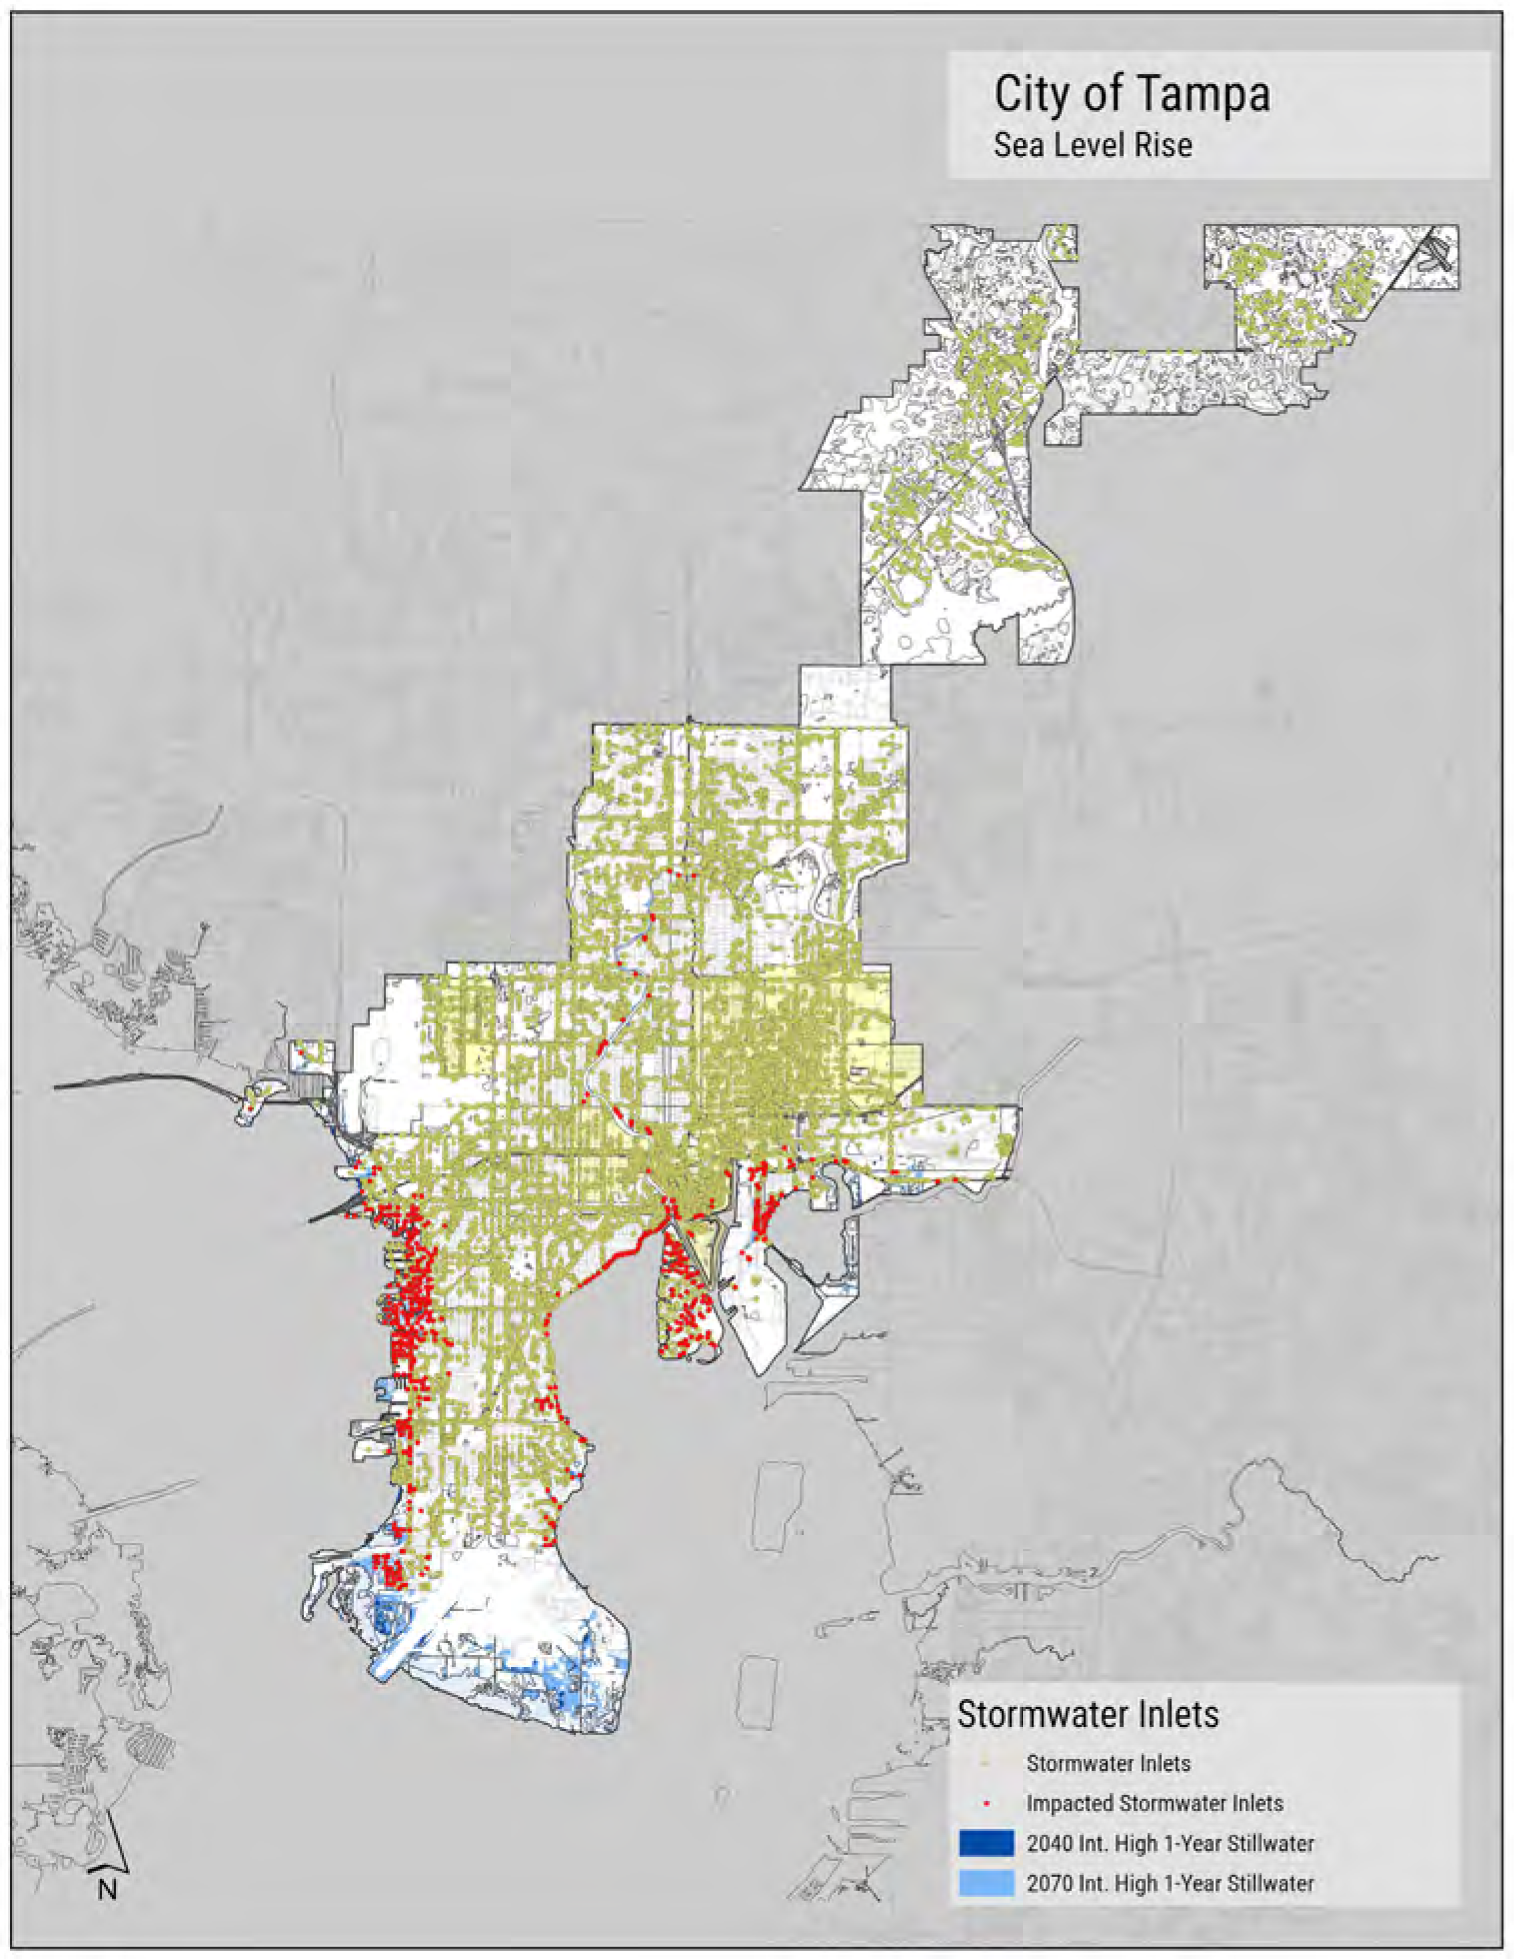
The inlets impacted by the 2070 intermediate high sea level rise scenario, which is shown on the map in Figure 45, are mostly representative of low-lying locations where the topography is susceptible to elevated high tides. These locations are especially vulnerable because of their hydraulic connection to the coast. TI Inlets connect to an outfall where high tides can intrude. Some of the inland locations where inlets are vulnerable act as an indicator for potential backflow prevention. This would not work in all cases since some areas would be impacted by overland flow.
A GIS analysis shows that by 2040, with the intermediate-high scenario, 92 inlets would experience yearly inundation due to the 1-year stillwater event. These are located in various parts of the city, but are concentrated in:
- Sunset Park
- Port Tampa City
- Bayside Drive in Beach Park
- Palmetto Beach, and
- The north end of Bayshore Boulevard
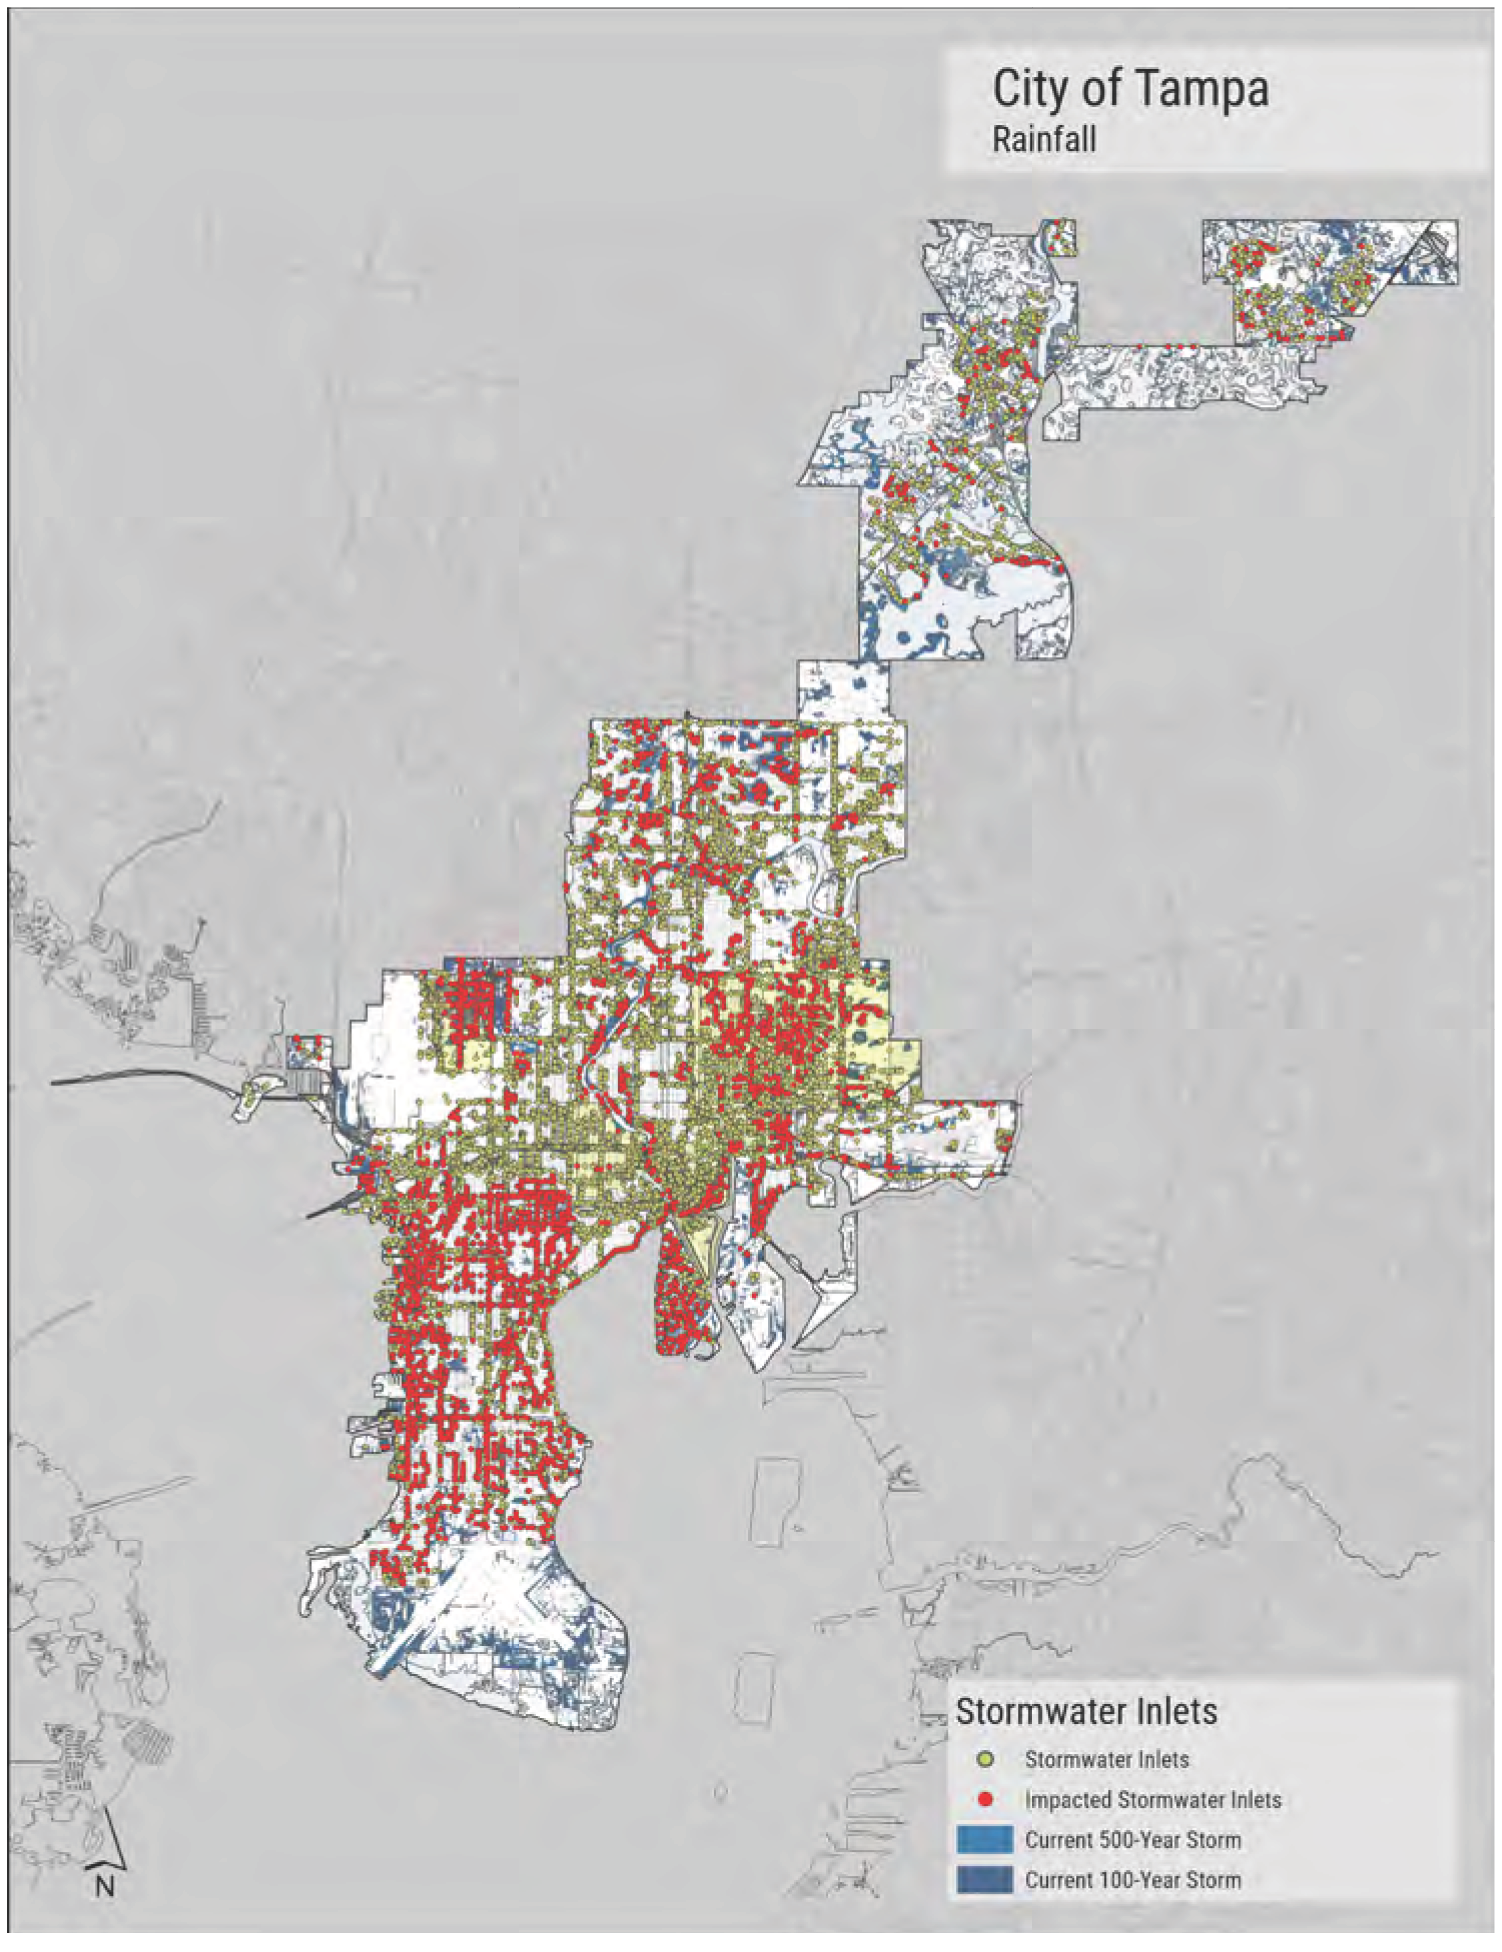
City of Tampa Rainfall � -2 Y � 1 Ir � Stormwater Inlets � Stormwater Inlets • Impacted Stormwater Inlets ■ Current 500-Year Storm ■ Current 100-Year Storm
FIGURE 44: STORM WATER INLETS WITH THE CURRENT 100-YEAR RAINFALL SCENARIO. THE IMPACTED INLETS ARE HIGHLIGHTED.
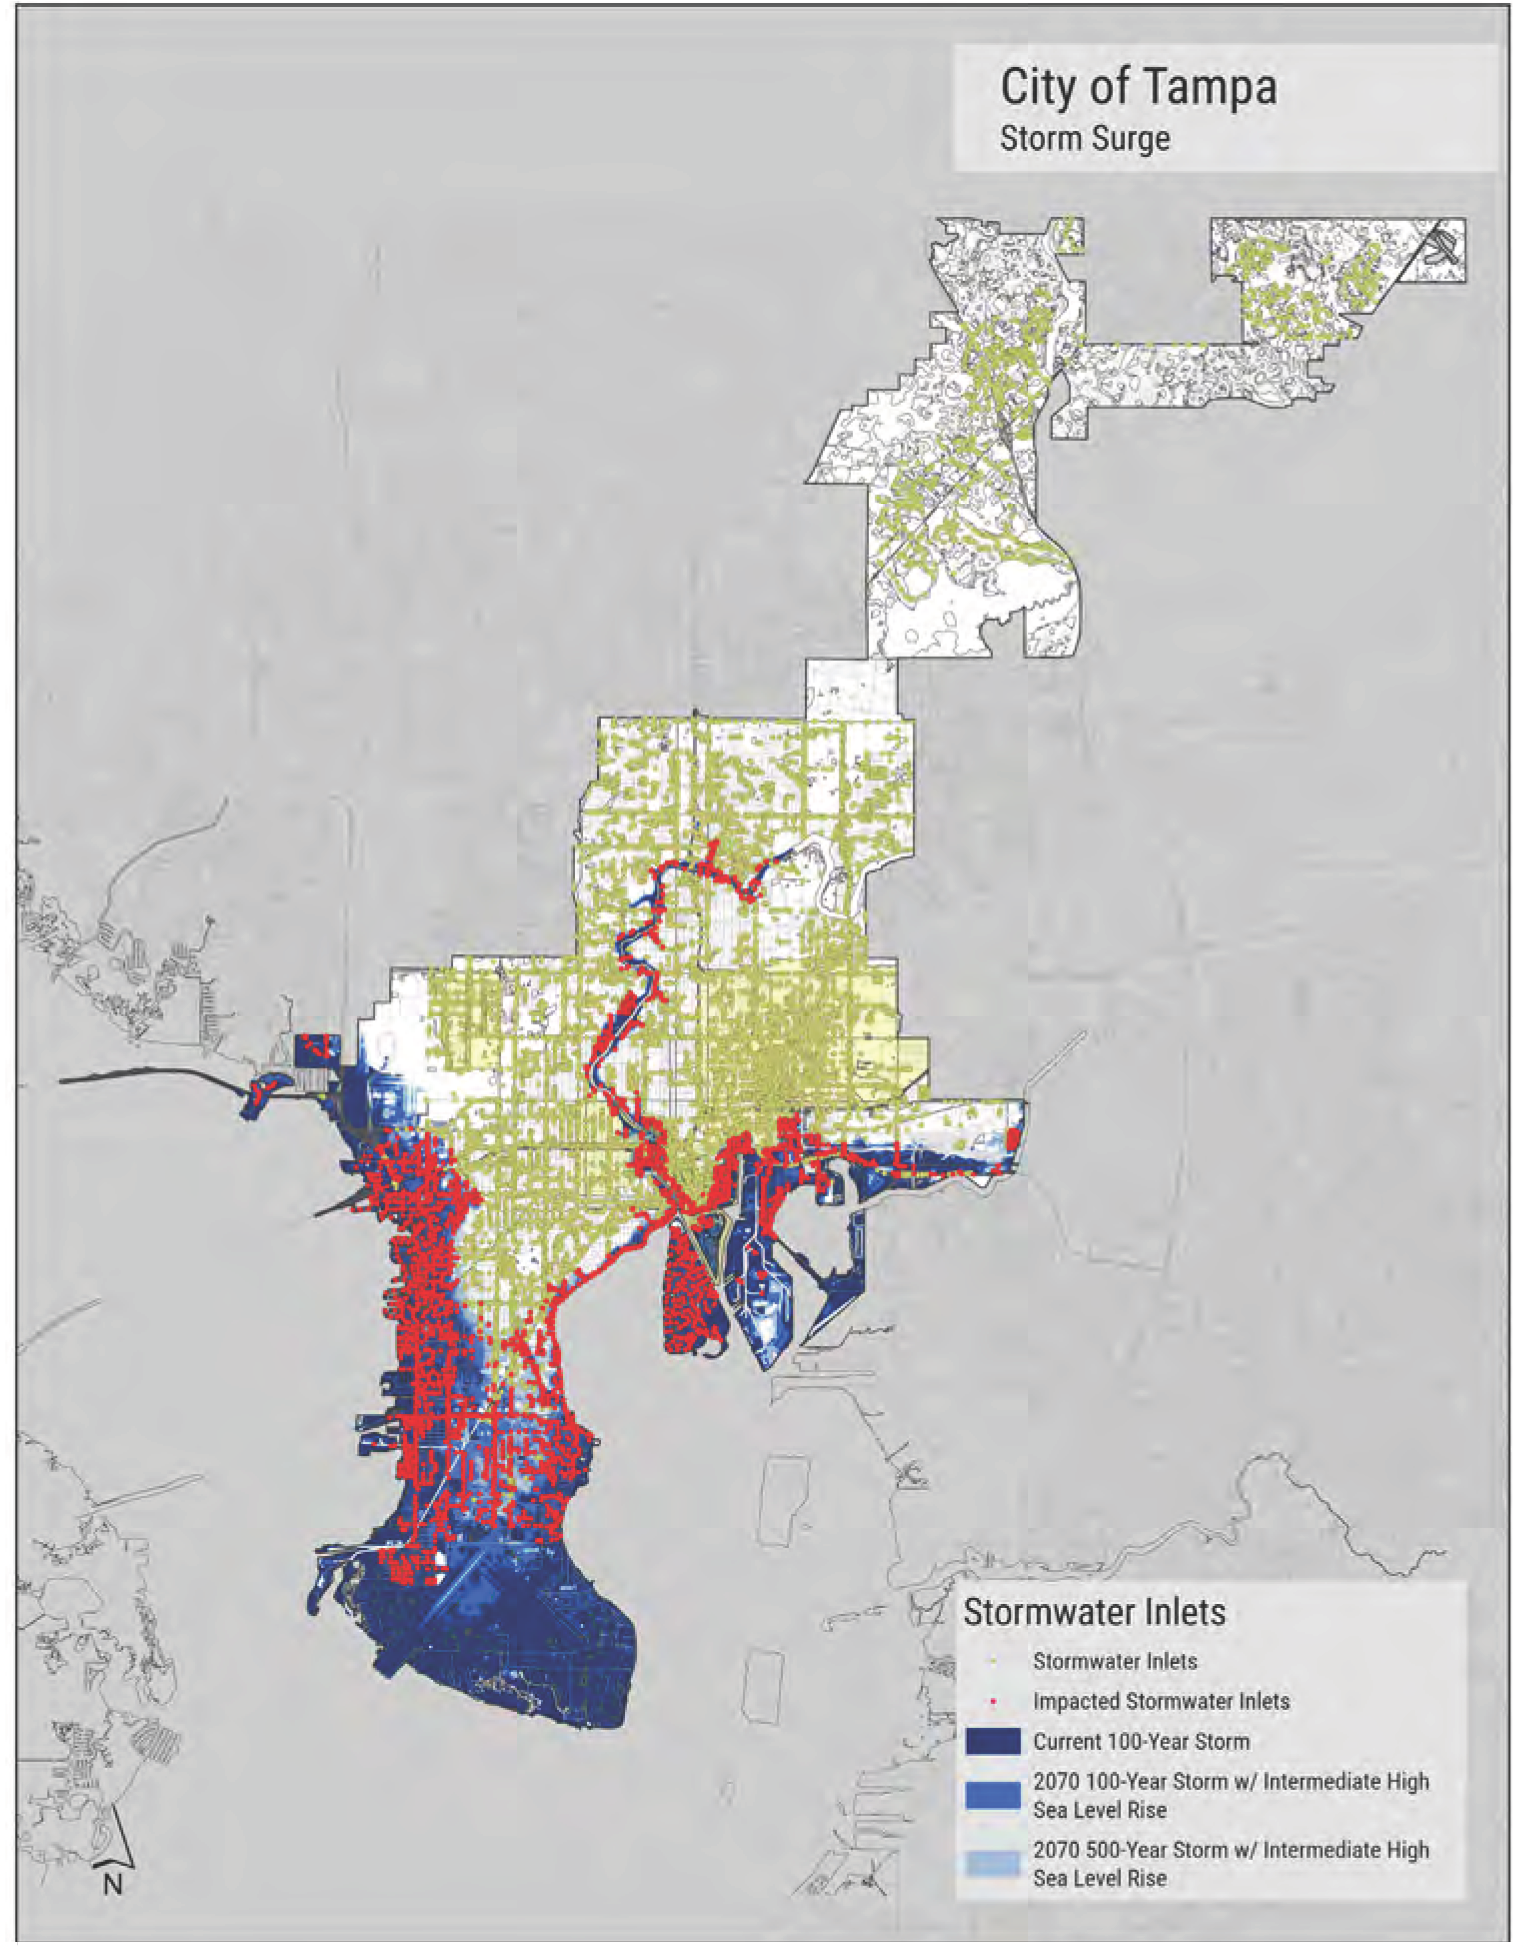
� City of Tampa Storm Surge I! � -z � -52Stormwater Inlets �� Stormwater Inlets ''b, • Impacted Stormwate, Inlets �� ■ Current 100-Year Storm � °7° 100-Year Storm w/ Intermediate High Sea Level Rise 2070 500-Year Storm w/ Intermediate High Sea Level Rise
FIGURE 45: STORMWATER INLETS AND STORM SURGE. THE IMPACTED INLETS WITH THE 2070 INTERMEDIATE-HIGH STORM SURGE SCENARIO ARE HIGHLIGHTED.
By 2070, with the same scenario, the problem is much more widespread. An estimated 1,129 inlets would be impacted by a 1-year stillwater event. At that time horizon, Davis Islands would be added to the list.
Rainfall
Results of the 100-year stormwater analysis match inlet impacts to areas of flooding. This information will be examined much more thoroughly with the upcoming comprehensive watershed master plan project. This study reveals that there are widespread rainfall flooding vulnerabilities concentrated in East Tampa, East Ybor City, Palmetto Beach, Davis Islands, along Bayshore Boulevard, in the entire Tampa Peninsula, and in Drew Park.
Storm Surge
Storm surge scenarios do not necessarily correlate with the coverage of identified impacted inlets. The mapping simply reveals the extent of the surge scenario floodplain, where water would be above ground level and associated with inlets. These results do not correlate with potential adaptation project areas – adapting stormwater inlets would not necessarily relieve surge flooding since the water is above the entire stormwater system in those areas.
STORMWATER STRUCTURES
Structures within the stormwater system refer to water quality sediment traps and also pump stations. These are unique system components that were isolated for this study. A sediment trap is used to baffle waters as they flow downward through a stormwater pipe system, collecting trash and other nutrient-associated particulates. A sediment trap can lose complete functionality when regularly inundated. The maintenance of these systems is important and dependent on event inflow and settling within the chamber. Nutrient absorbing media and waste materials are more difficult to collect when
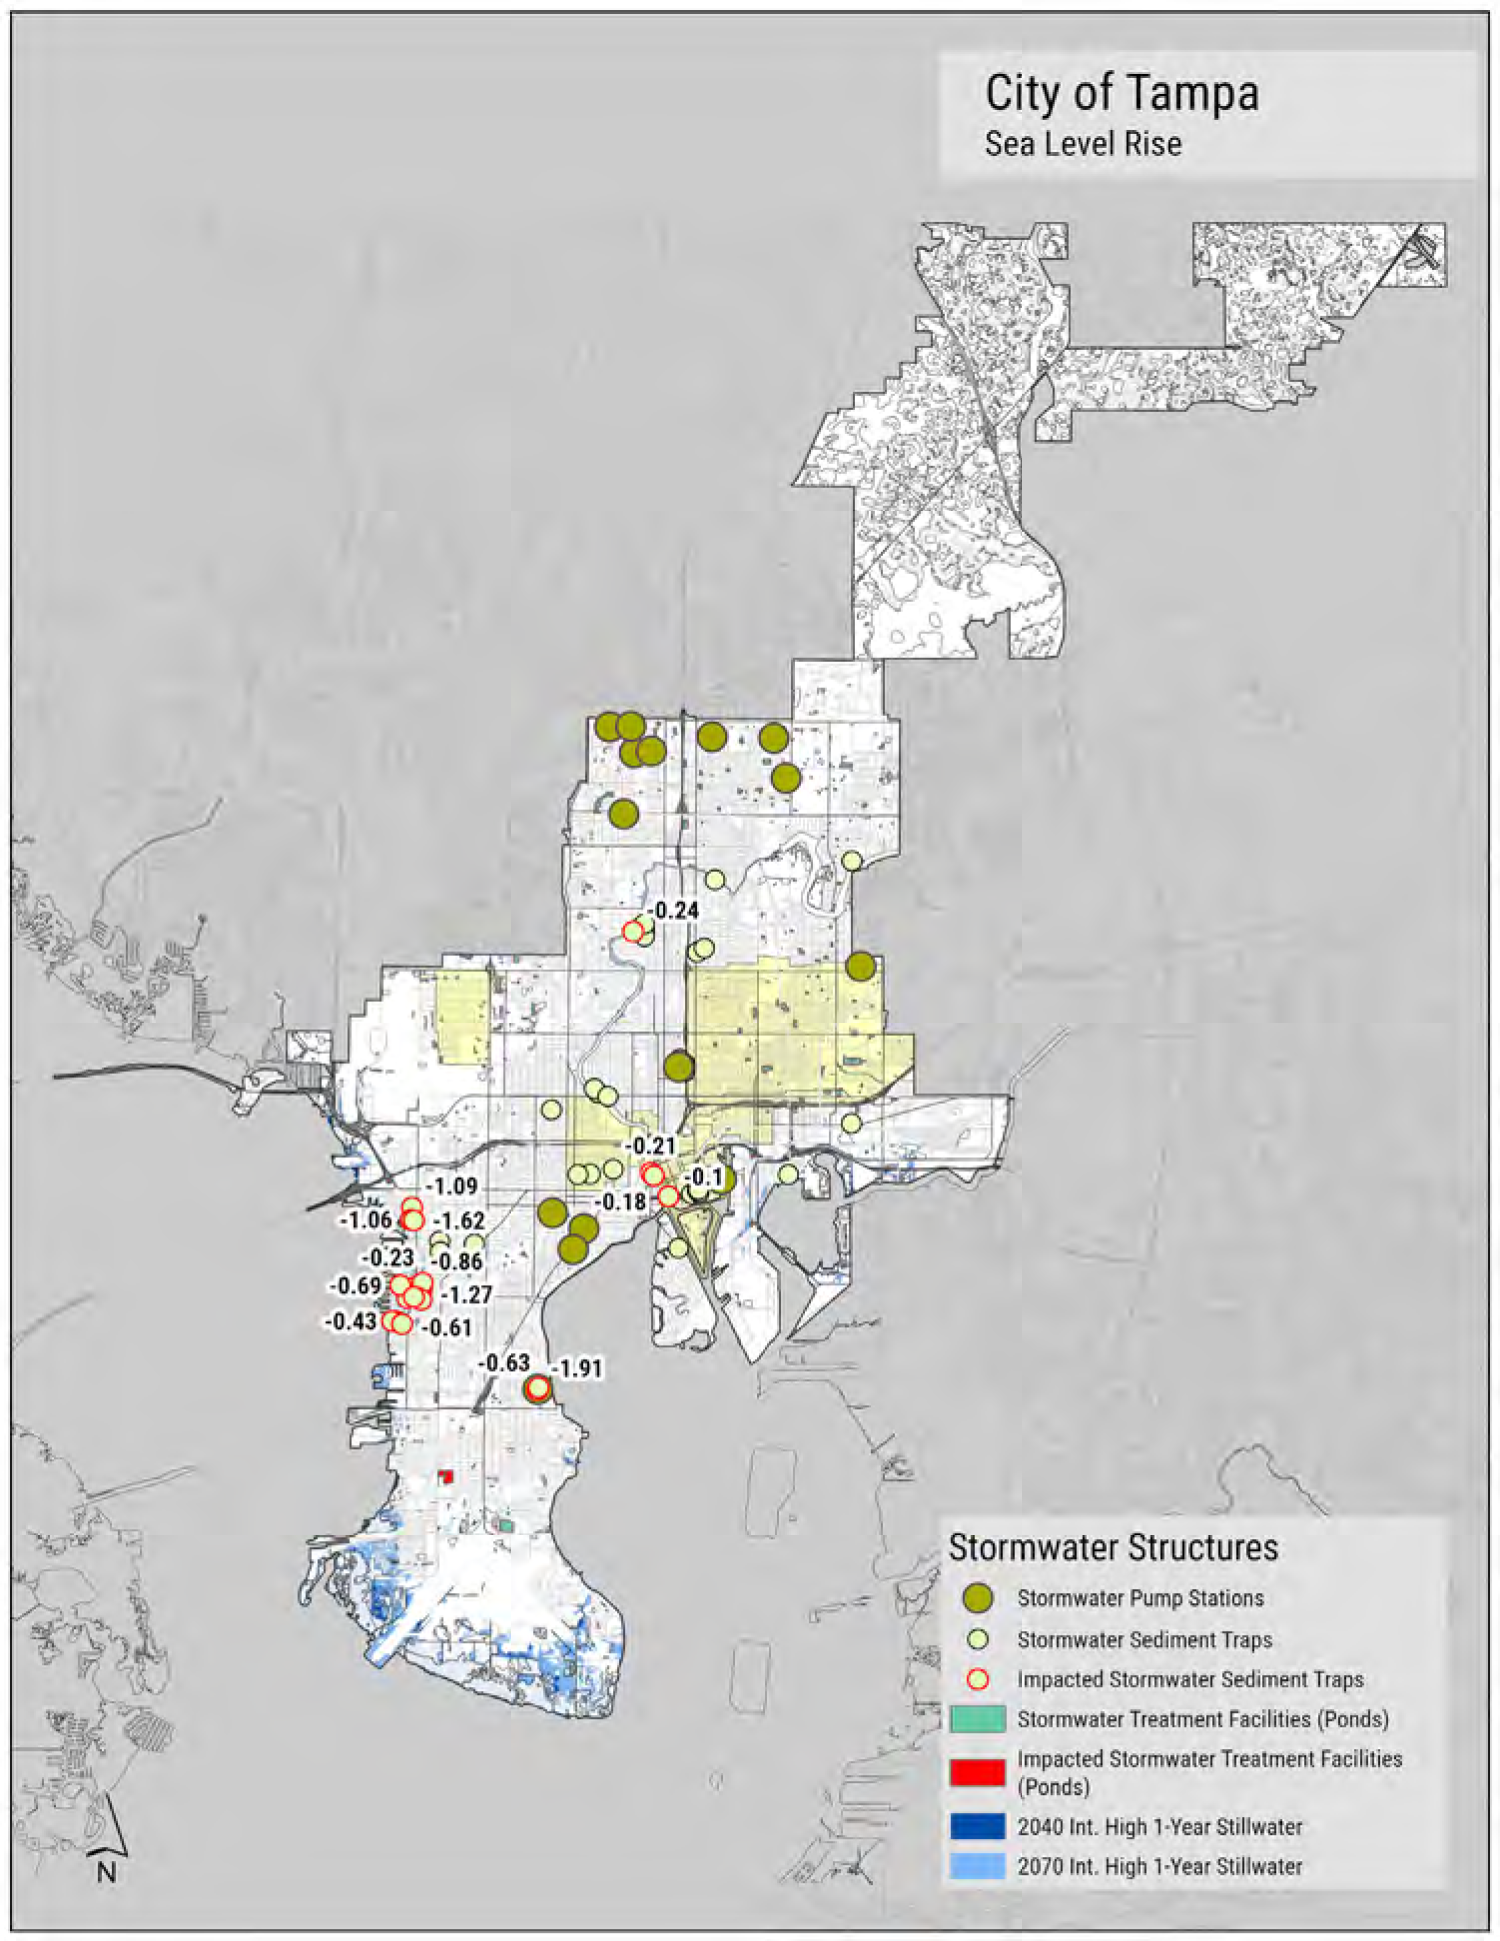
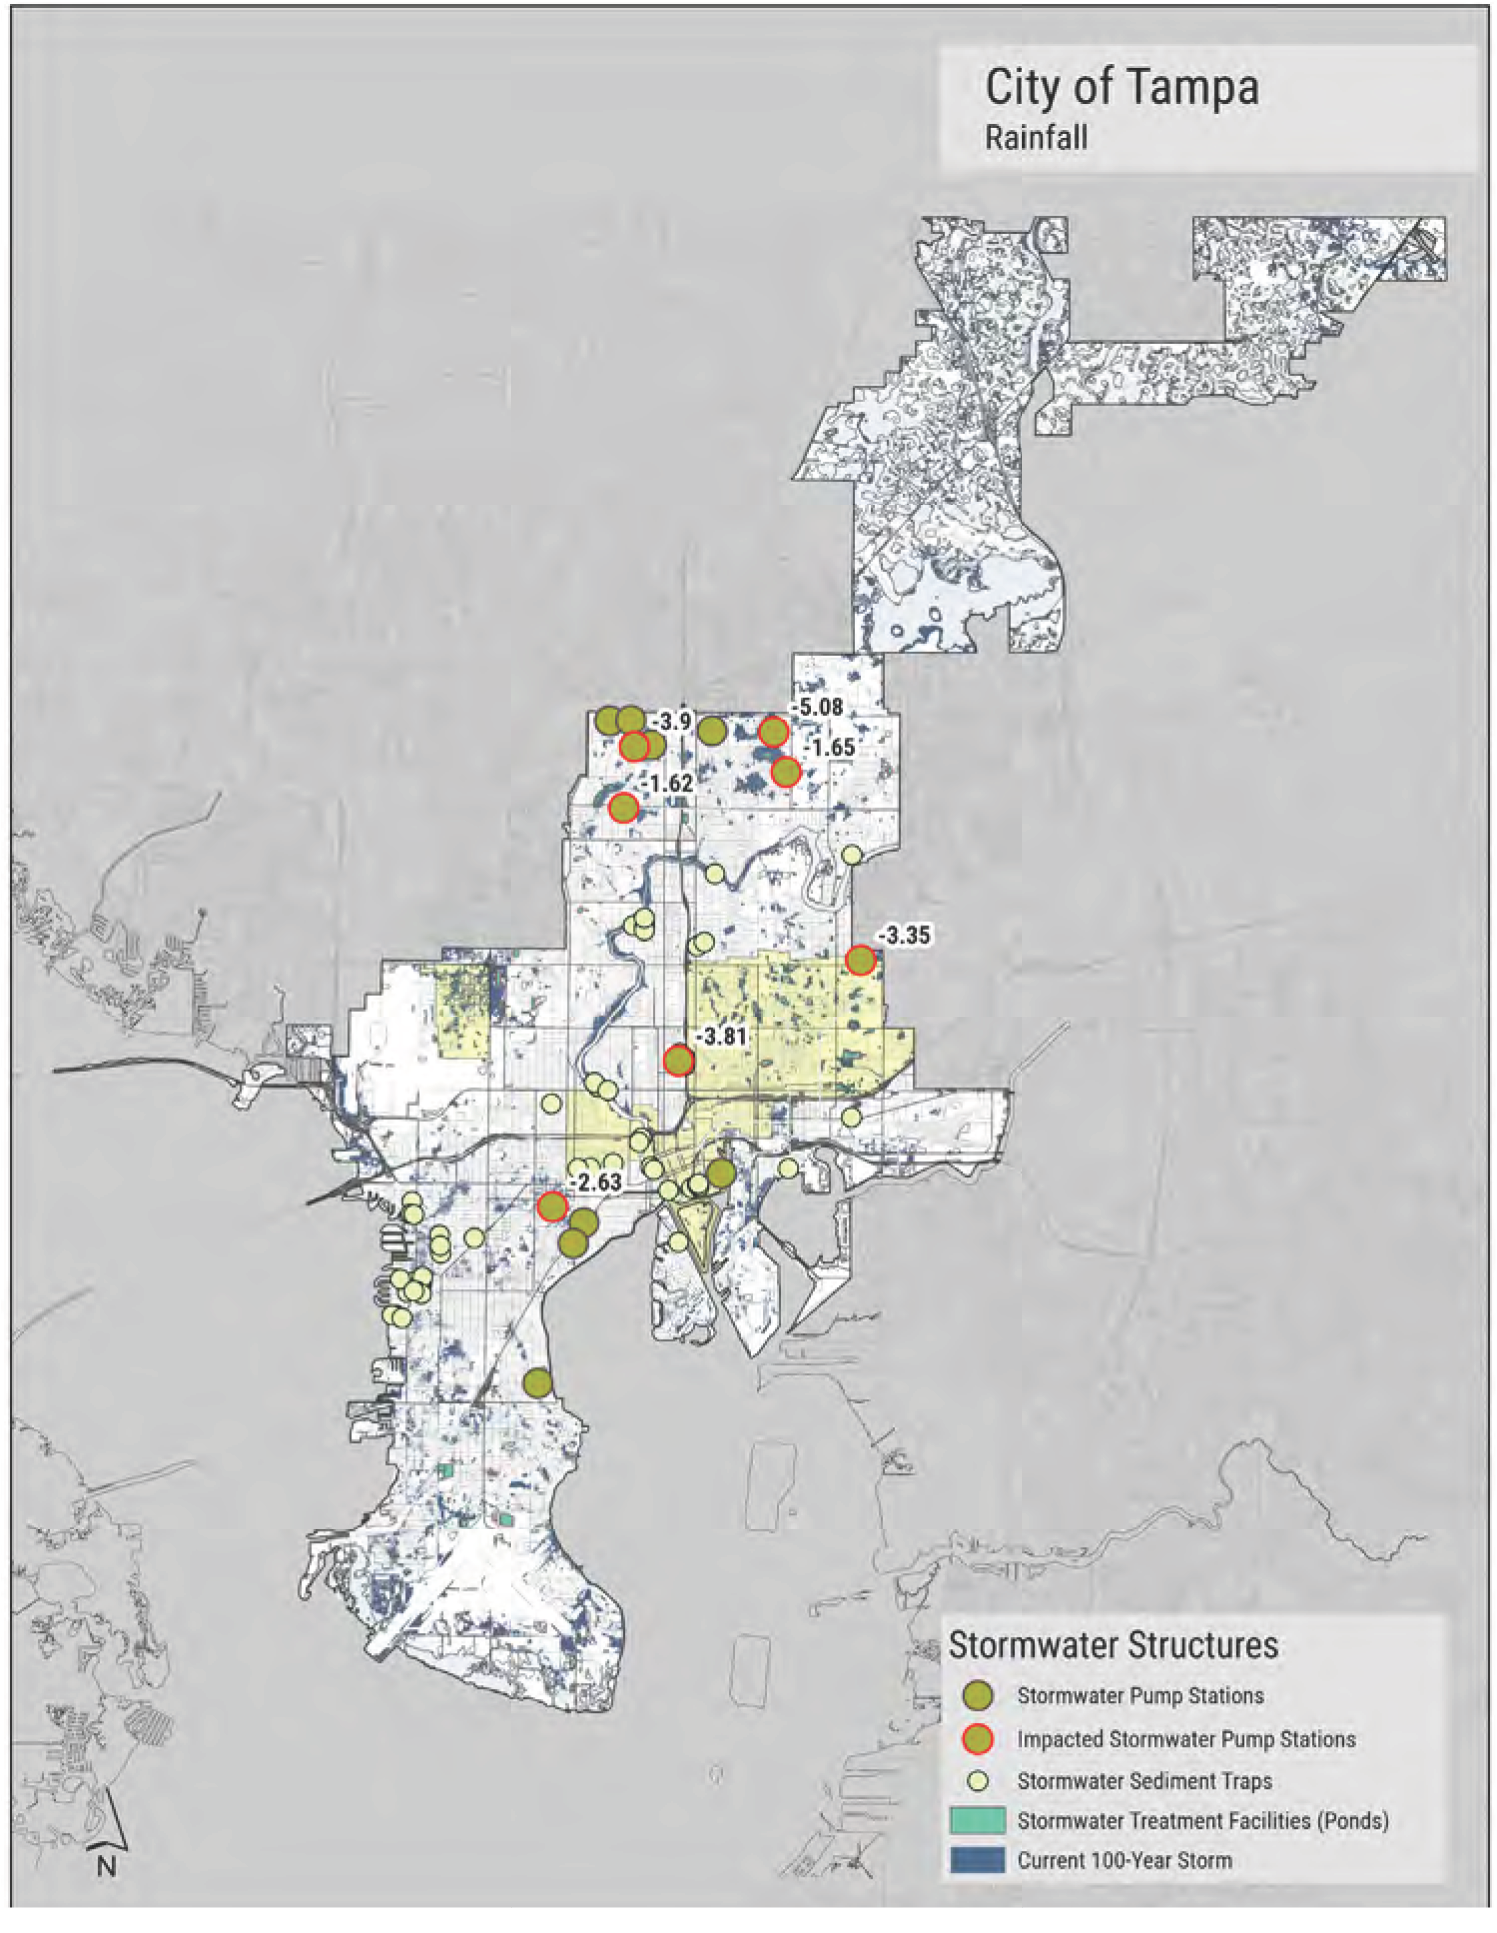
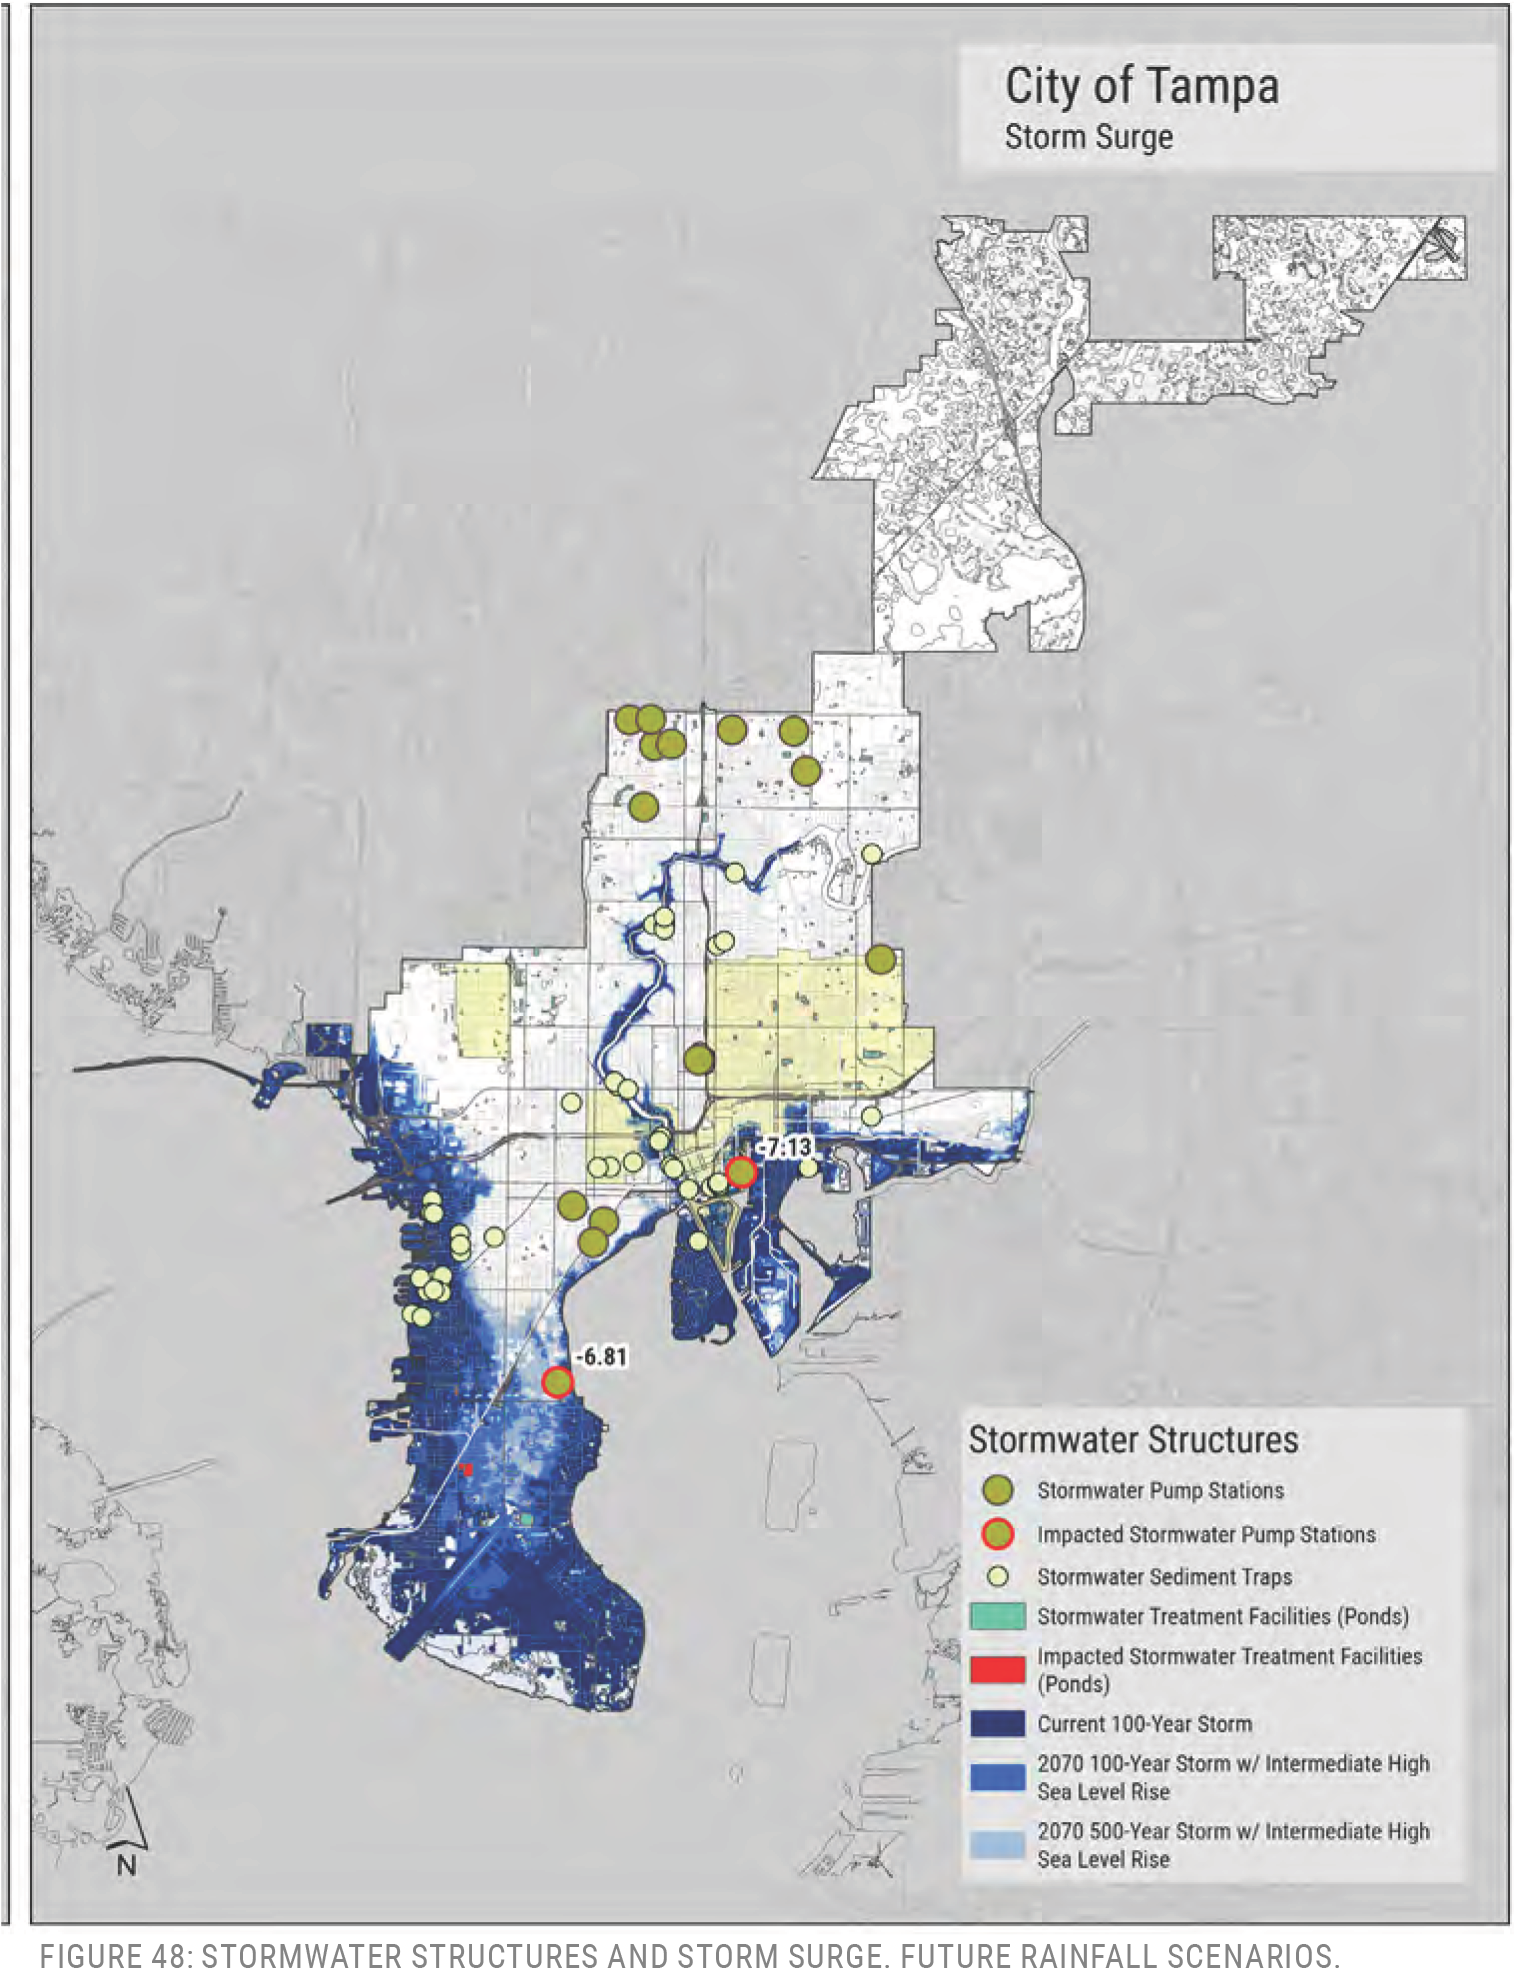
there is insufficient draw-down in the system. For this reason, sediment traps were only evaluated against sea level rise scenarios. They are designed to be temporarily inundated through rainfall and storm surge, but constant inundation by sea waters would limit their functionality.
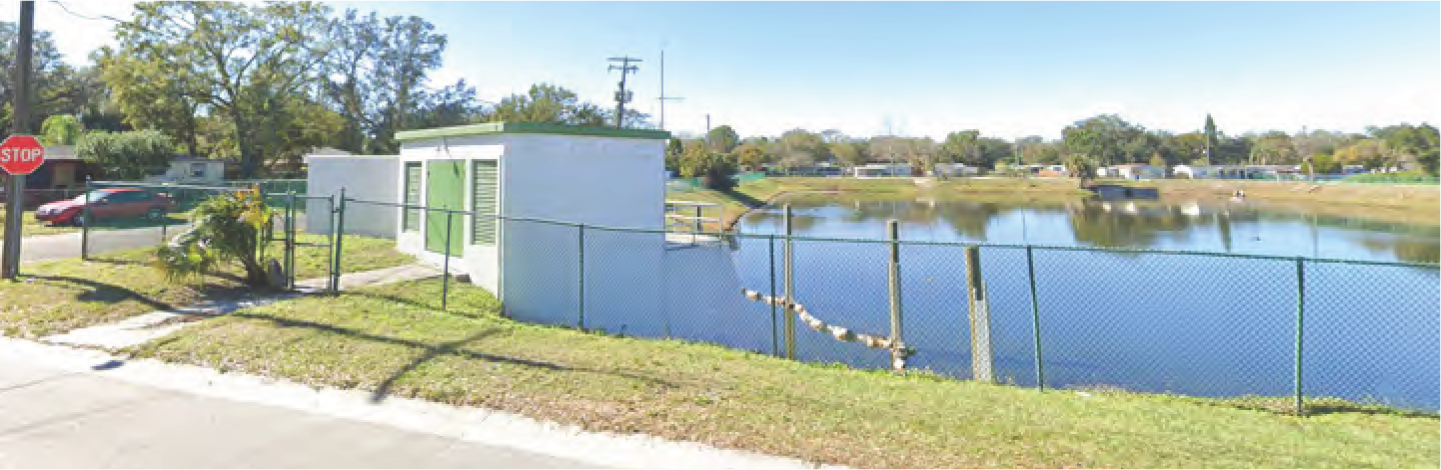
Pumps are located in low points where flooding may be common. They use mechanical energy to collect water and deliver it to an area outside of the watershed basin.
FINDINGS
Sea Level Rise
No stormwater pumps are impacted by sea level rise alone, within the study's time horizon. Most of the sediment traps are located in coastal areas and many of them are in locations that will see higher stillwater elevations and potential inundation at the ground surface level by 2070 with the intermediate-high projection. The majority of these are clustered in the west side of the Tampa peninsula, near Belmar Shores, Sunset Park, and Culbreath Isles.
Rainfall
As was seen recently during Hurricane Milton (2024), a few of the stormwater pumps and their associated equipment are vulnerable to heavy rainfall. Modeling of the 100-year rainfall event shows that stormwater pumps may be impacted at:
- Forest Hills (El Portal and Eastridge Pump Stations)
- Donut Pond
- Poinsettia Pond
- 45th and Hillsborough
- Robles Park
- AMI Hospital
Sediment traps were not evaluated since they are underground and the analysis is focused on surface water flooding. Sediment traps are also more closely tied with more frequent flood recurrence intervals, as opposed to the 100-year scenario.
Storm Surge
Higher water elevations at the coast could potentially impact pump stations:
- Alline
- York Street
STORMWATER OUTFALLS
Outfalls are the exit point of a stormwater system. In this study, outfalls were reviewed against sea level rise scenarios and rainfall flooding. Outfalls can also provide an entry point for higher-than-usual water levels and can sometimes function in reverse; the water backs up through the system, from low to high, and can exit out of connected inlets. Some outfalls have backflow preventers, which keep this from happening. Water can only flow in one direction. Outfalls are also vulnerable to sea level rise as increased saltwater intrusion can cause growth such as oysters and barnacles on the structure or can cause debris to move into the system.
FINDINGS
Sea Level Rise
In 2020 the City of Tampa completed a Sea Level Rise Vulnerability Analysis and Resiliency Strategy Report with a focus on stormwater outfalls. That study divided outfalls by basin and provided technical hydraulic and hydrologic analysis to determine the most vulnerable outfalls in the city. Additional work was conducted in 2024 to review the Davis Islands outfalls and their conditions. These reports provide a strong foundation for identifying vulnerabilities and making improvements to outfalls in the city in response to sea level rise.
TRANSPORTATION
INTRODUCTION
Much of Tampa’s transportation is comprised of gridded streets, the outcome of early to mid-20th century development. The city initially grew around streetcar-connected neighborhoods, but this system is now gone. Today, the Interstate 275 corridor bisects the city into east and west. To the west, the Courtney Campbell Causeway, Howard Frankland Bridge, and Gandy Bridge provide evacuation routes and needed connections to Pinellas County across the bay. To the east, the Interstate 4 corridor and multiple arterials, such as Fowler and Fletcher avenues, connect Tampa to inland cities and counties.
Transportation assets are important for moving people and providing access, but they also support cargo service at Port Tampa Bay and Tampa International Airport. These ports of entry bring goods and services to the city and are important assets in post-storm scenarios. In addition to the sustained function of components within them, they rely on road and rail connections to points beyond. This is also true for MacDill Air Force Base. Air Force Base personnel are distributed throughout the City of Tampa (and beyond) and they rely on the transportation network for access. The Port, Airport, and Air Force Base have all completed individual vulnerability assessments, which should be coordinated with the findings from this study.
Maps divide transportation assets into three subcategories: Local, Transit, and Industrial. Local transportation assets consist of six different types: major streets, minor streets, evacuation routes, rail facilities, railroad bridges, and bridges. Transit assets consist of bus stops, bus stations, and streetcar stations. Industrial transportation assets consist of airport and port parcels.
LOCAL TRANSPORTATION
Local transportation assets are sensitive to flooding when water levels are high enough to impede traffic. This is commonly known as “level of service,” which is different for each road type. Municipalities have unique standards for level of service. For rail service, the tracks lose functionality once covered with water. Continuous inundation through high tide flooding could cause damage to the roadway surface and increased groundwater can cause washout and erosion of subsurface base material for roadways and rail. Consistent rainfall
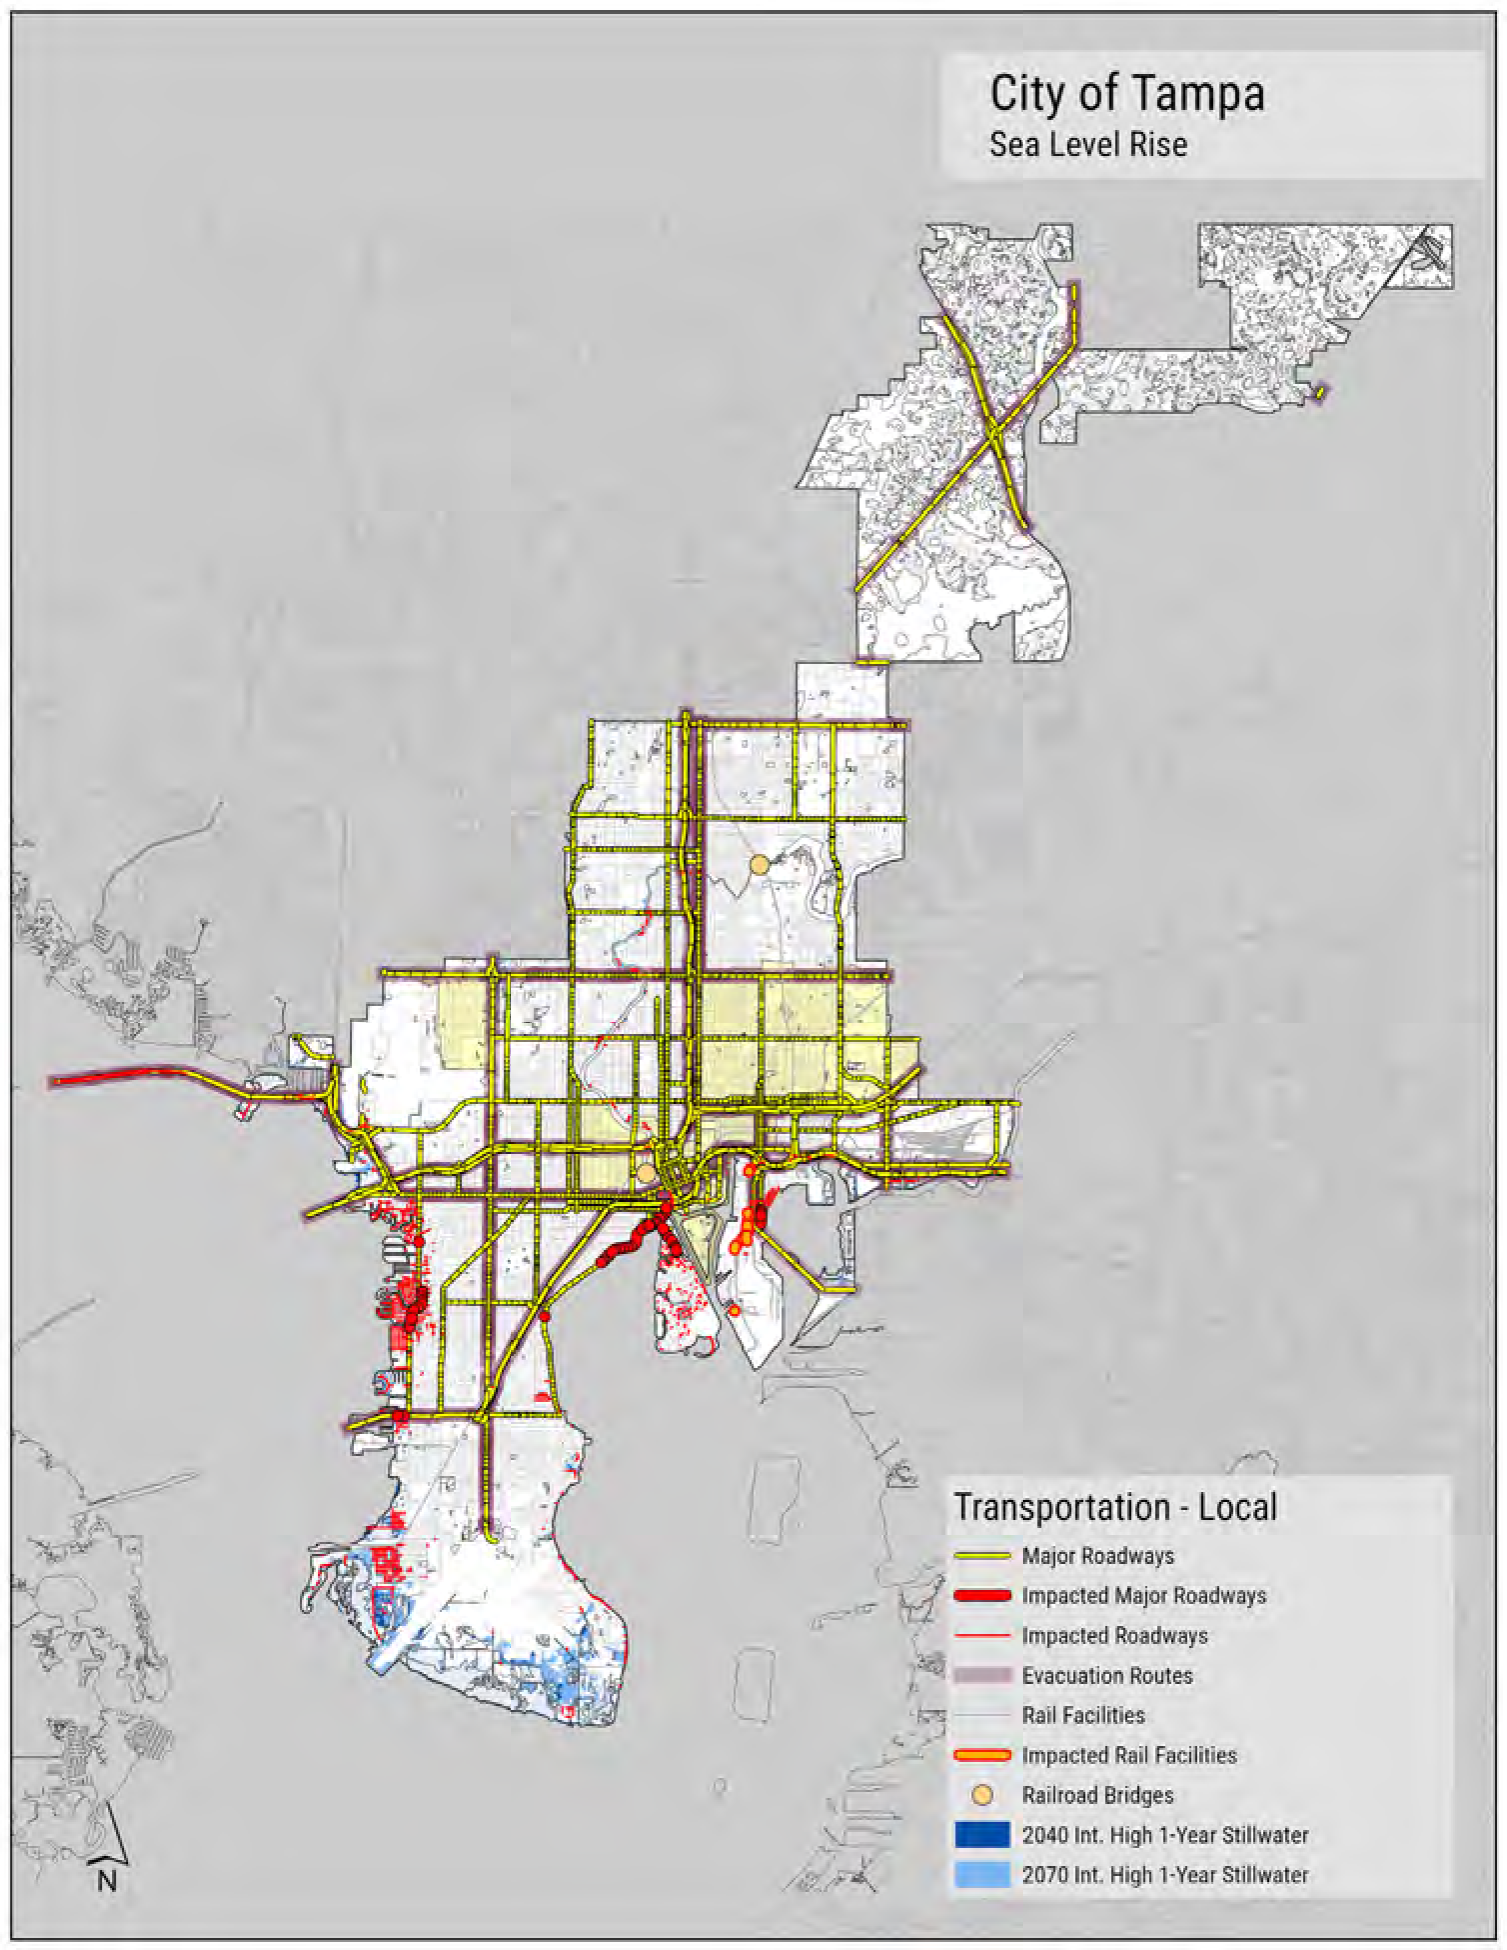
flooding can cause similar damage, especially if submerged for extended periods of time. During an intense storm surge event, wave energy can cause deterioration if not destruction to a roadway, rail line, bridge or other transportation components. Evacuation routes are of special importance. They are the designated “safe route” during hazardous events, including hurricanes. High volumes of traffic are expected to utilize these corridors to mobilize toward safety.
FINDINGS FOR SEA LEVEL RISE
Major Roads / Evacuation Routes
By 2040, in the intermediate-high sea level rise scenario (with 1-year stillwater event), impacts occur at:
- The north-bound on-ramp from Bayshore Boulevard to the Davis Islands bridge
- Approximately 220 total feet of roadway segments
By 2070, with the intermediate-low scenario:
- Approximately 660 feet of roadway segments are impacted
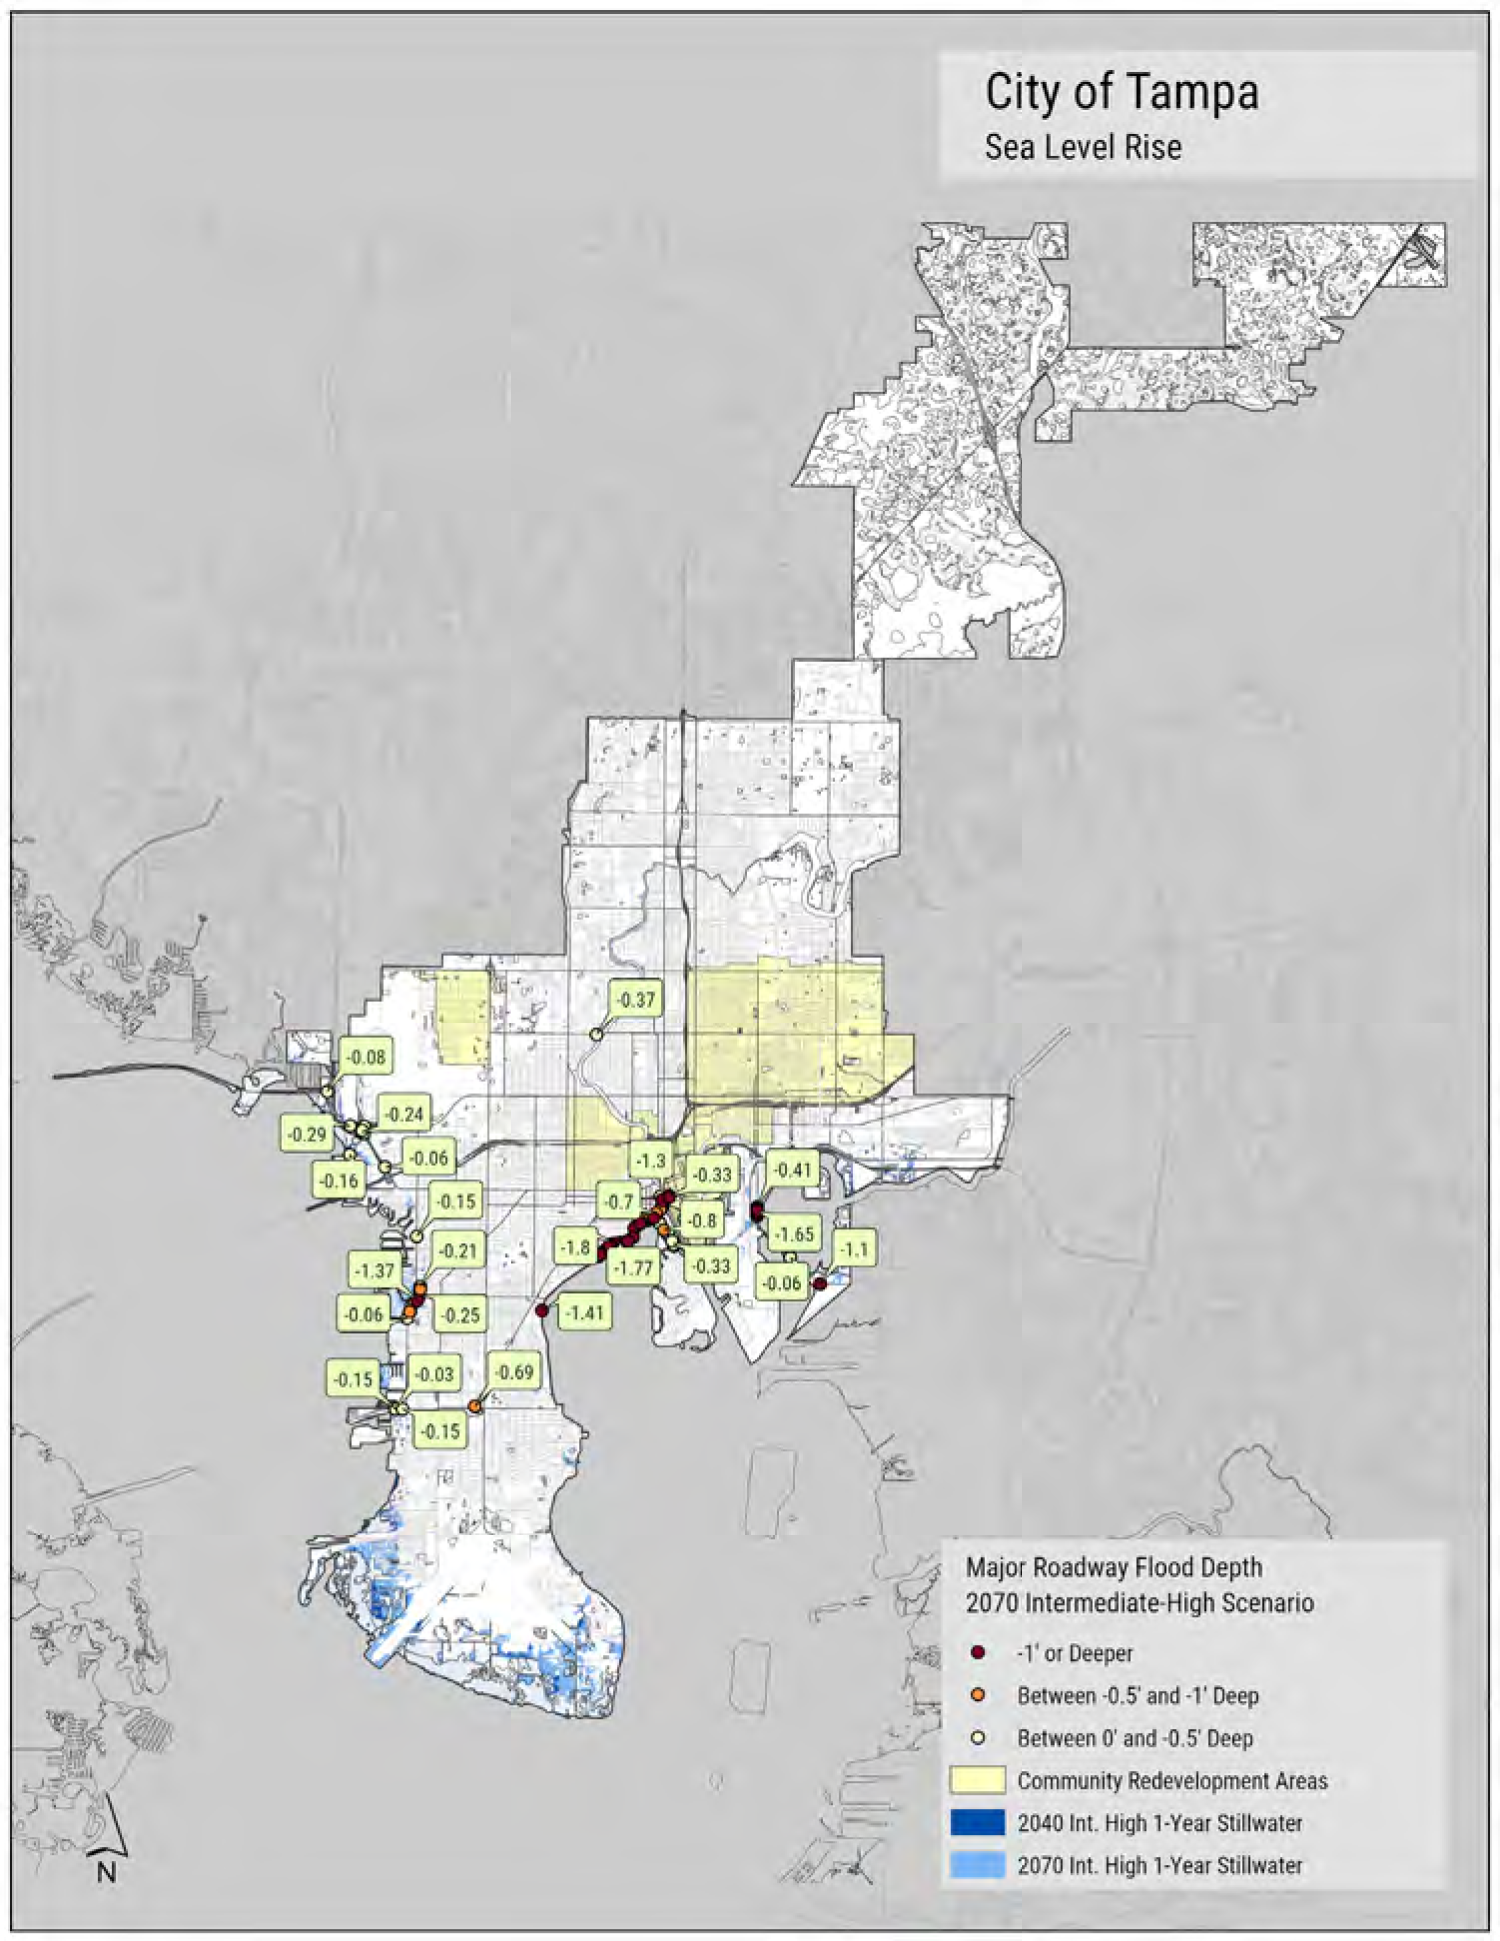
By 2070, with the intermediate-high scenario, the list includes:
- Westshore Boulevard between San Jose Street and Vasconia Street, with another segment at Bay Way Drive
- Bayshore Boulevard between Brorein Street and Rome Avenue
- The north end of Davis Islands Boulevard, north of Barbados Avenue
- South 22nd Street in Palmetto Beach, from Hemlock Street to Saxon Street
- Approximately 14,000 linear feet of major roadway segments
No evacuation routes would be impacted by the year 2070 intermediate-high scenario.
Minor Roads
Some areas would already be impacted if a 1-year stillwater event were to occur. This is true for approximately 3,400 linear feet of roadway within the city.
By 2040, with the intermediate-low sea level rise scenario:
- An additional 2,000 linear feet of minor roads would be affected, much of it within the Sunset Beach neighborhood (totaling approximately 5,400).
By 2040, with the intermediate-high scenario, areas of concern include:
- The Courtney Campbell Causeway frontage roads near Ben T. Davis Beach
- Bayside Drive in Beach Park
- Sunset Park
- Port Tampa City
- Maple and Oakwood avenues in Palmetto Beach
- A total of approximately 14,175 linear feet of minor roads
By 2070, with the intermediate-high scenario, minor roads are impacted in similar areas as described above, but to a greater extent. Additional areas include:
- Davis Islands
This scenario includes a total of 234,245 linear feet (in various parts of the city), or approximately 44 miles, of minor roadways.
Rail
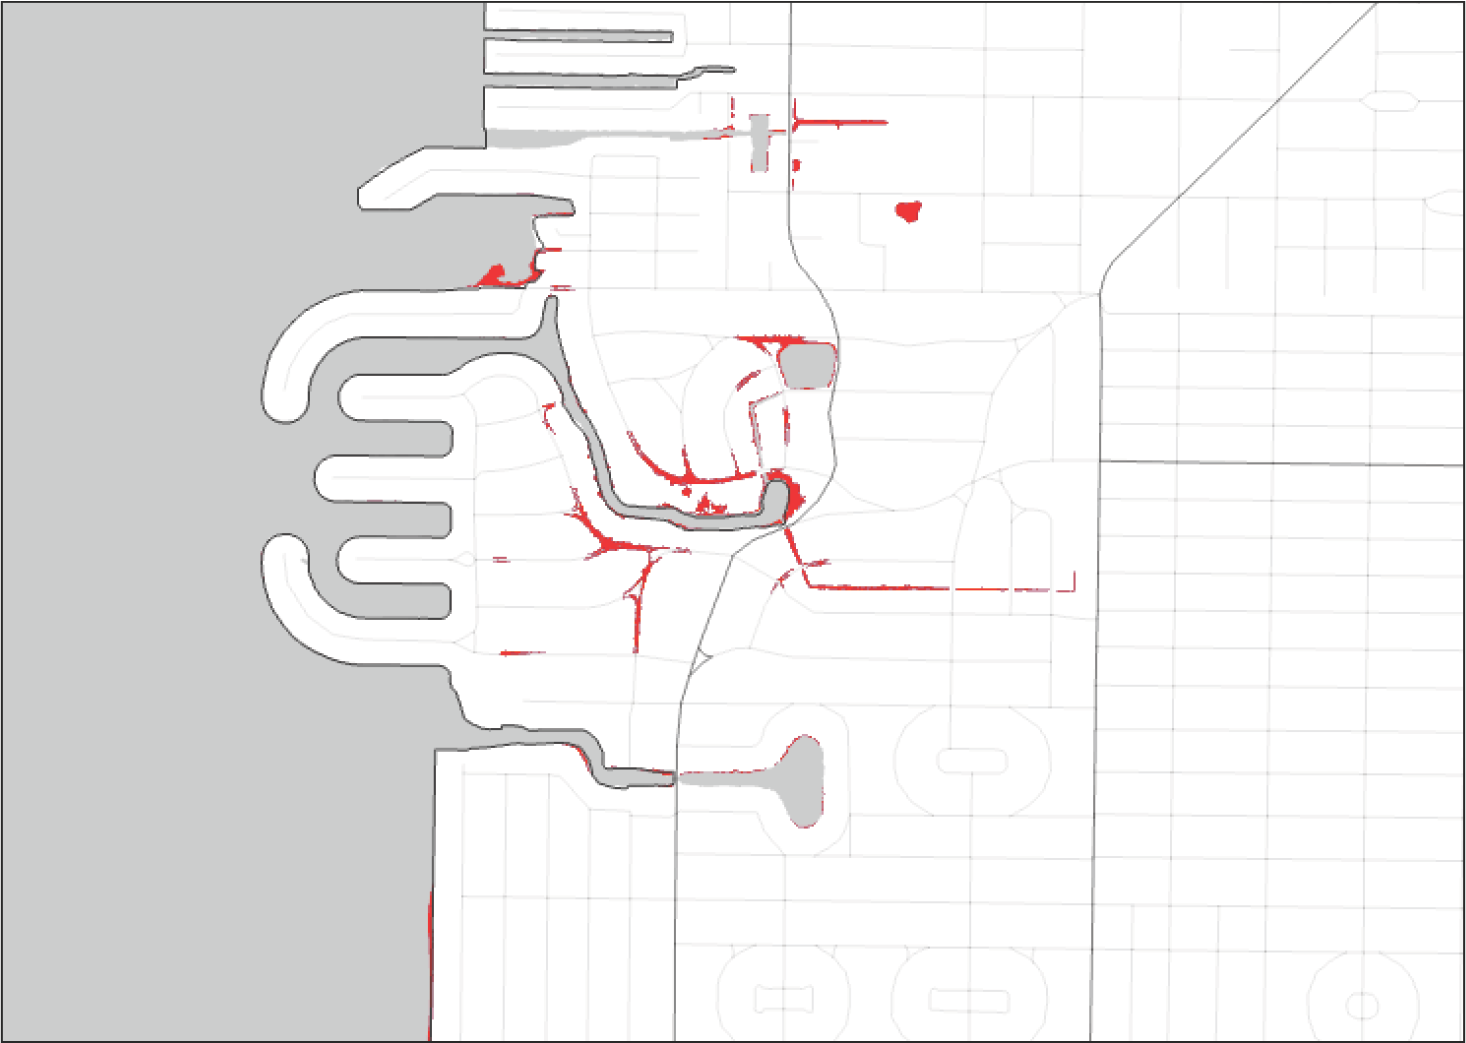
With the 2070 intermediate-high 1-year stillwater scenario, rail lines would be below the floodplain at:
- The entry to Port Tampa Bay’s Hooker’s Point campus and within the campus
FINDINGS FOR RAINFALL
Major Roads
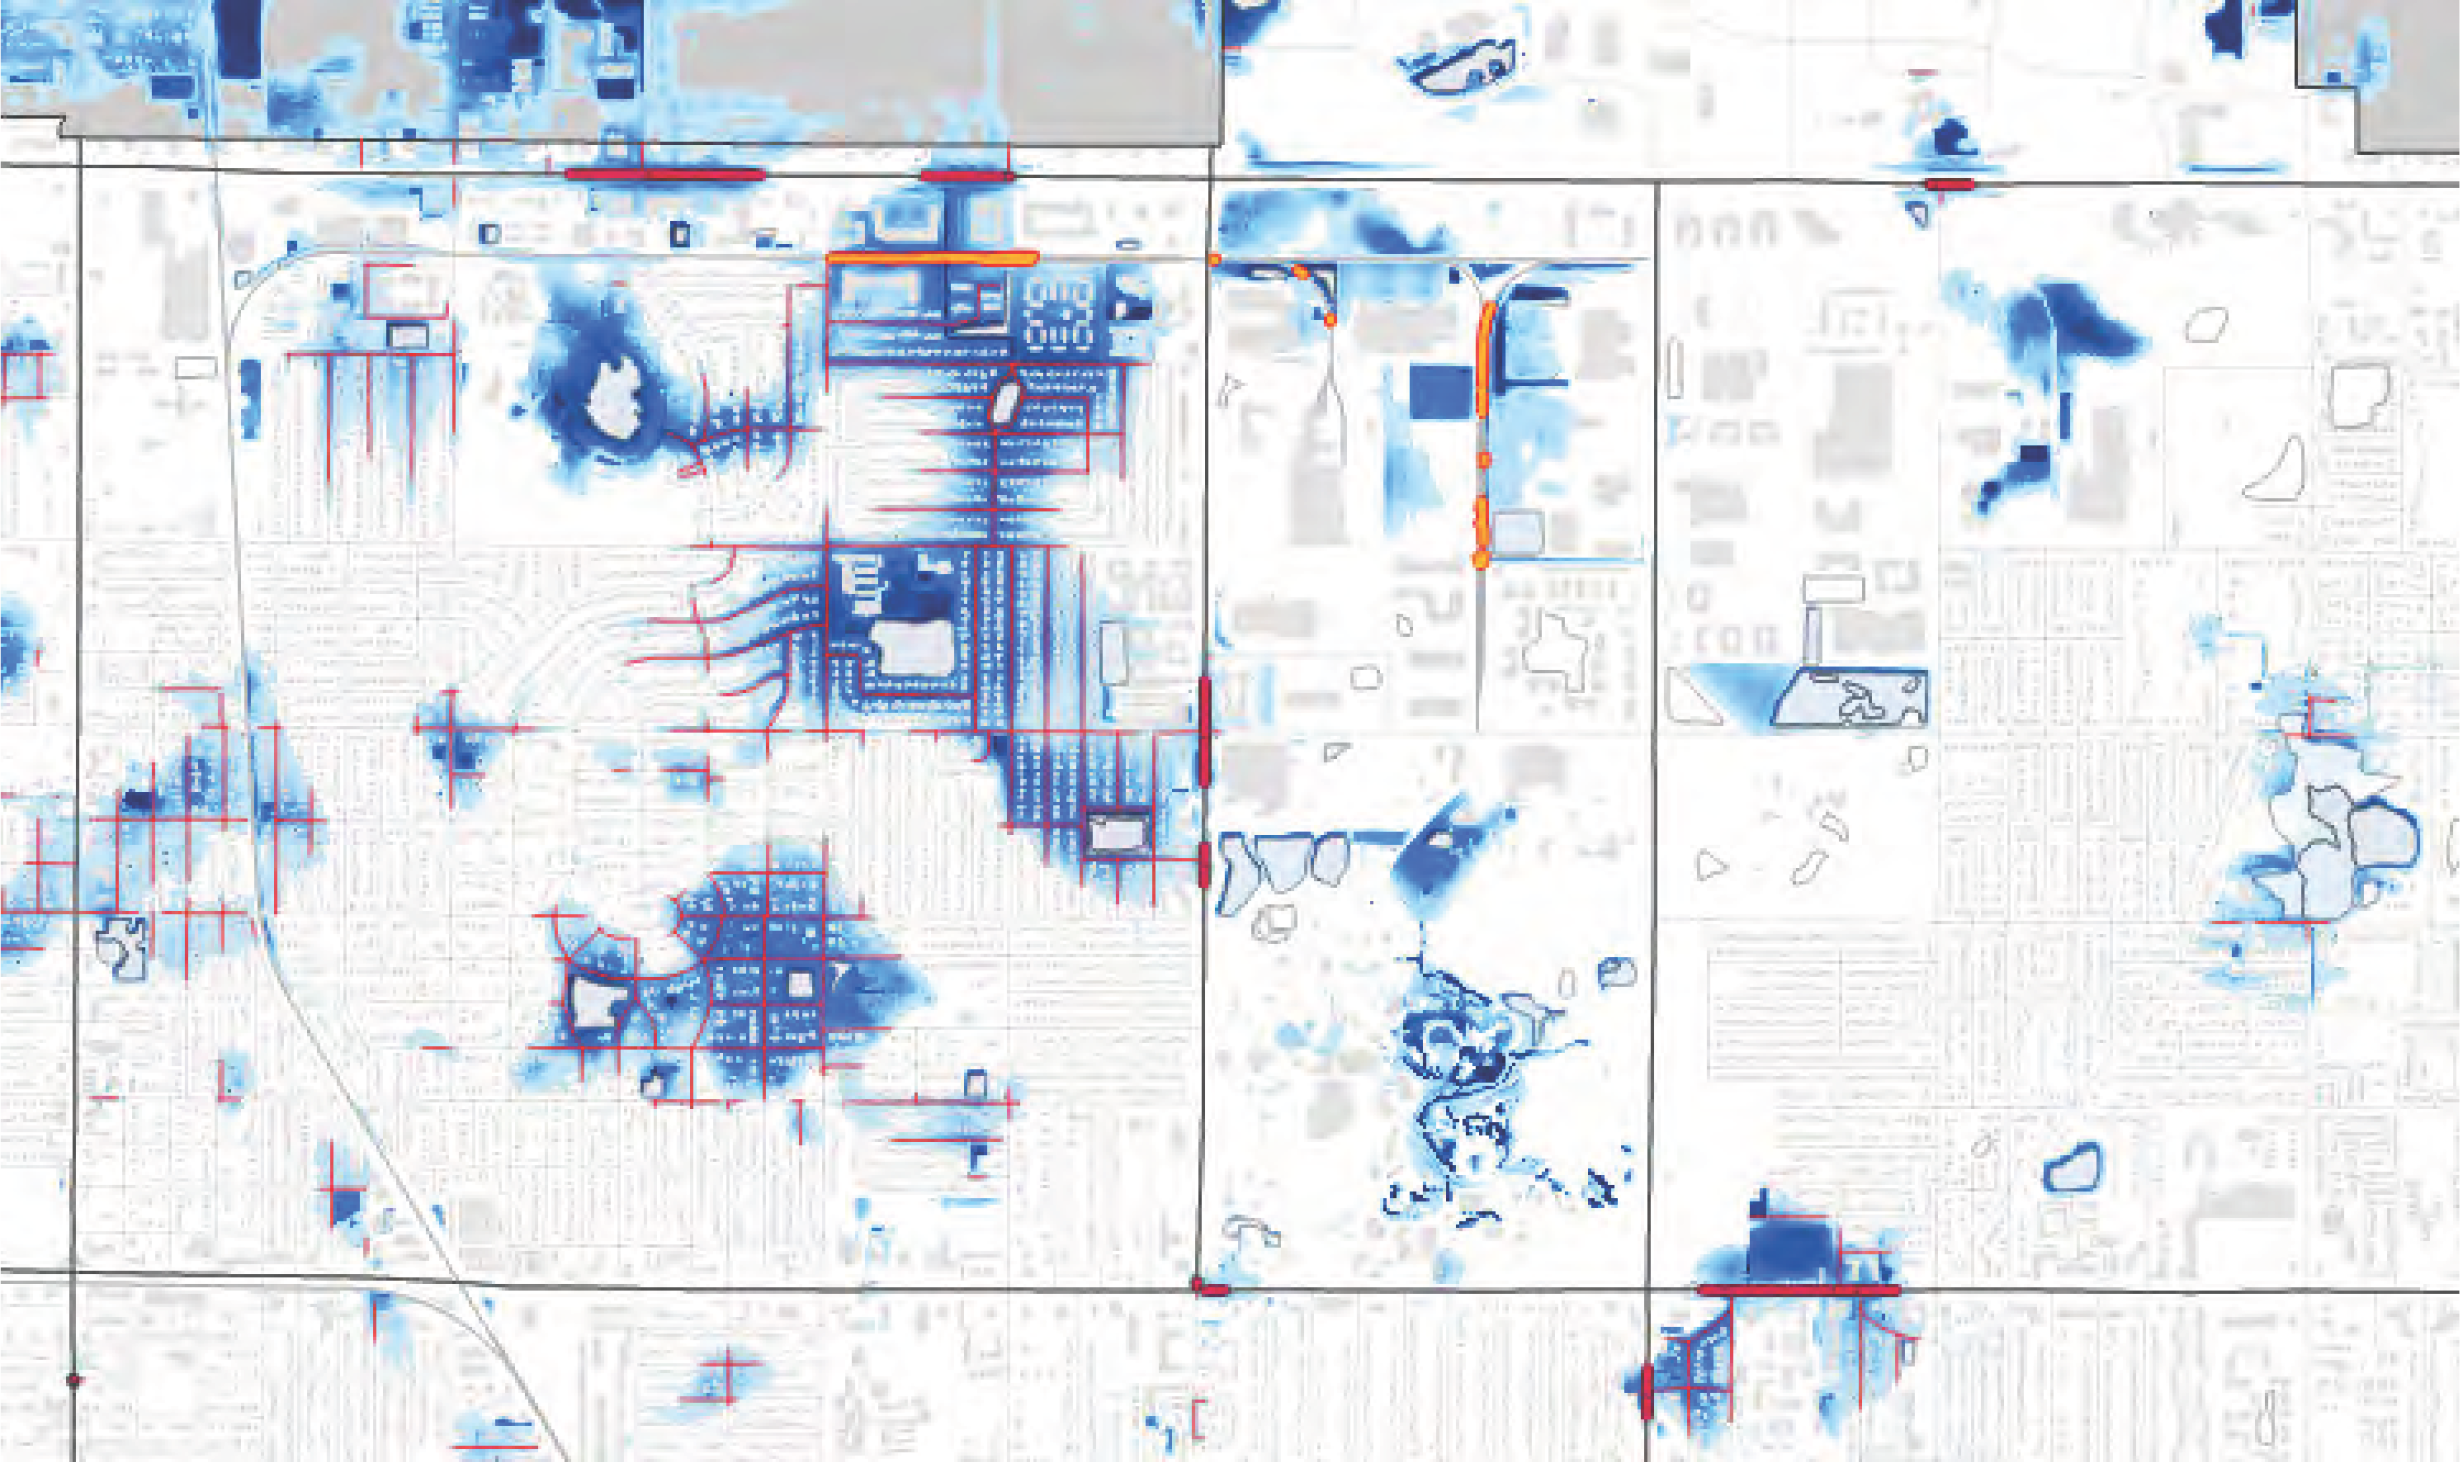
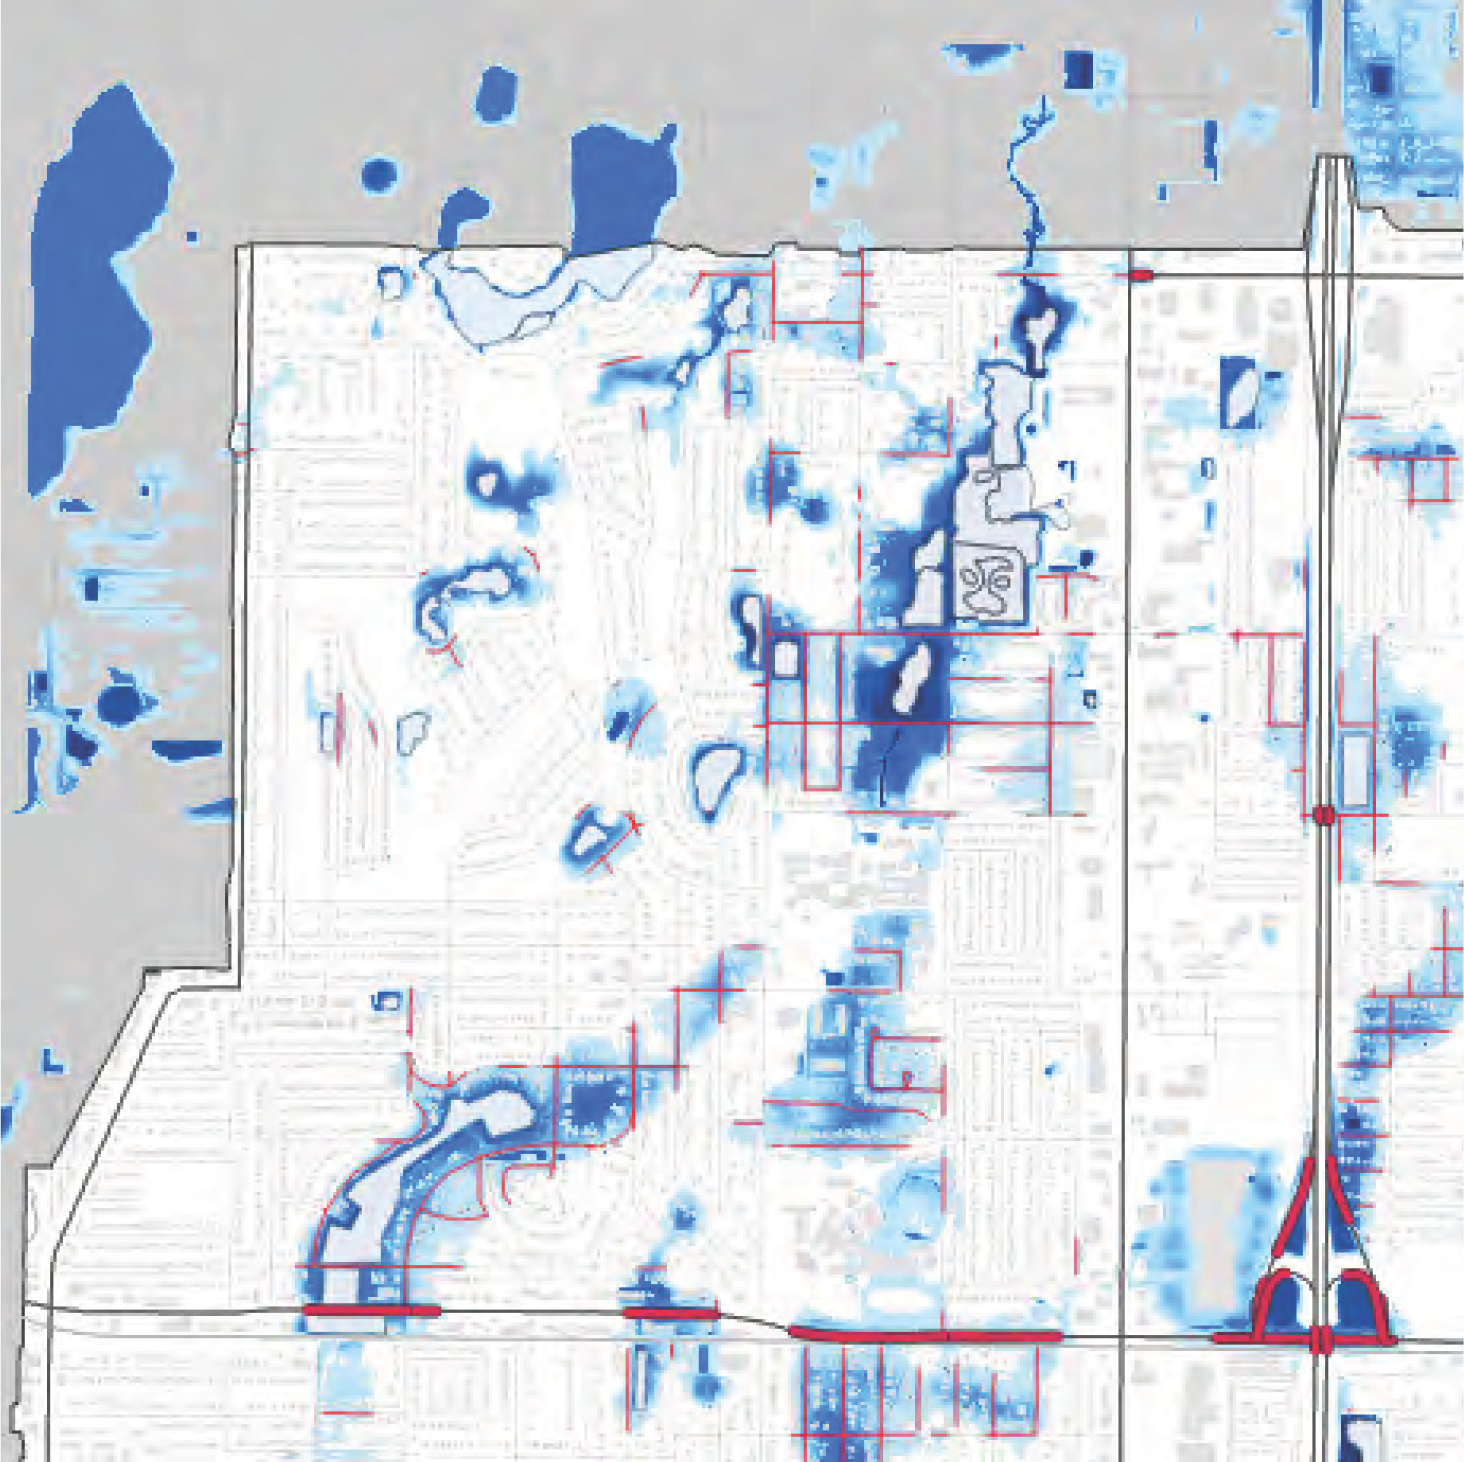
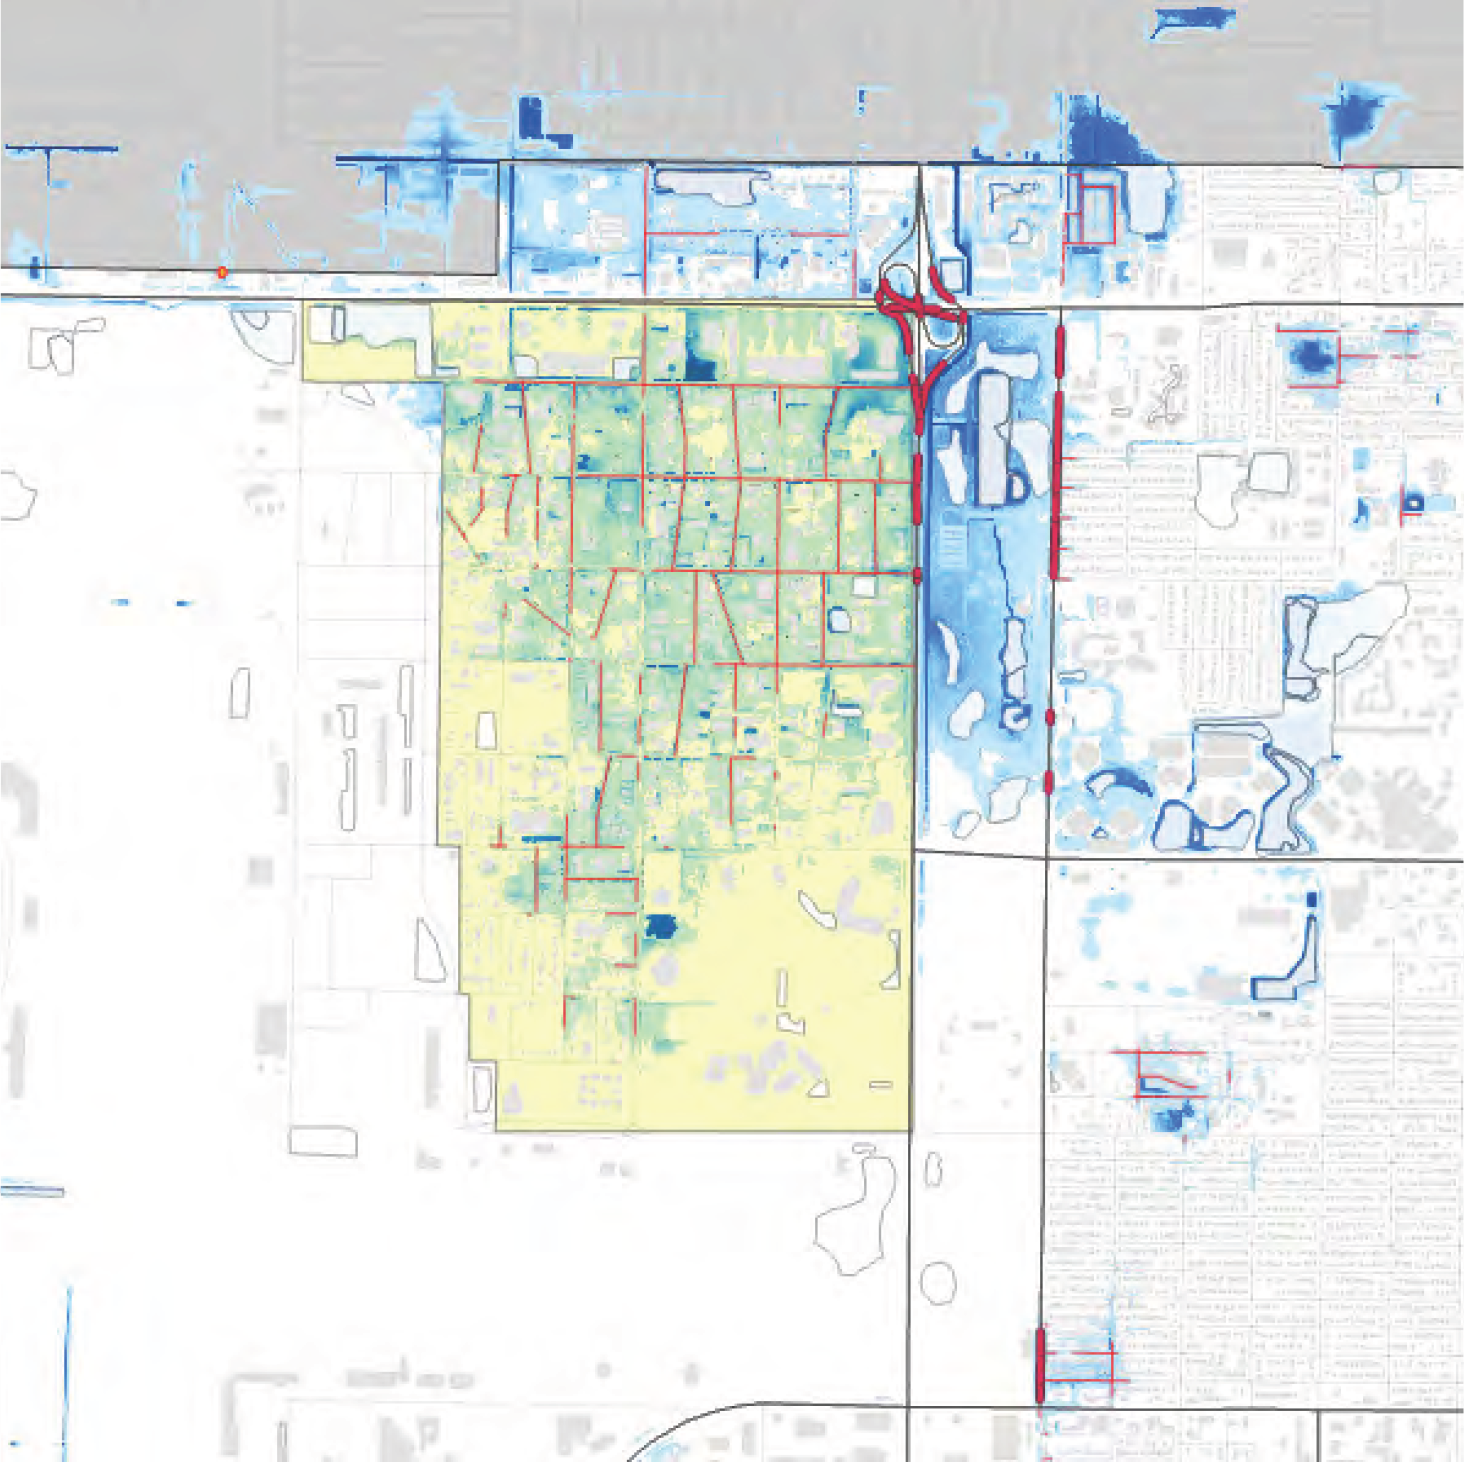
Areas of concentrated impacts would include:
- Fowler Avenue from 15th Street to Club Drive
- Busch Boulevard, especially west of I-275 in multiple stretches, and east of I-275 between 40th and 46th streets.
- Florida and Nebraska avenues near the Hillsborough River
- Sligh Avenue, just east of the Hillsborough River
- Dale Mabry, south of Hillsborough along Al Lopez Park to Osborne Avenue
- 7th Avenue, between 26th and the Selmon Connector
- Adamo Drive, in many different areas
- 22nd Street, in Palmetto Beach
- The entry area of Davis Islands Boulevard
- The north end of Bayshore Boulevard
- Dale Mabry, from Kennedy to Bay to Bay Boulevard
- Kennedy, from Armenia to Henderson, with isolated locations further west
- Henderson Boulevard, in many different segments
- MacDill Avenue, from West Gray Street to San Isidro Street
- South Manhattan Avenue, from West Leona Street to West Wallcraft Avenue
- South West Shore Boulevard, in many different segments
- Bay to Bay Boulevard, from South Church Street (near Dale Mabry) and segments to the east
- Azeele Street, from Dale Mabry to South Howard Avenue
- Gandy Boulevard, west of Dale Mabry
Minor Roads
Approximately 1.4 million feet, or 263 miles, of minor roadways are within the 100-year floodplain scenario created for this study.
Rail
The rail system could potentially be impacted by the 100-year rainfall storm:
- At Port Tampa Bay’s Hooker’s Point facility
- In East Ybor
- From Osborne up to the Hillsborough River Bridge.
- A segment passing through University Square may be affected by rainfall, which is connected to major commercial and industrial areas like Pepsi and Yuengling.
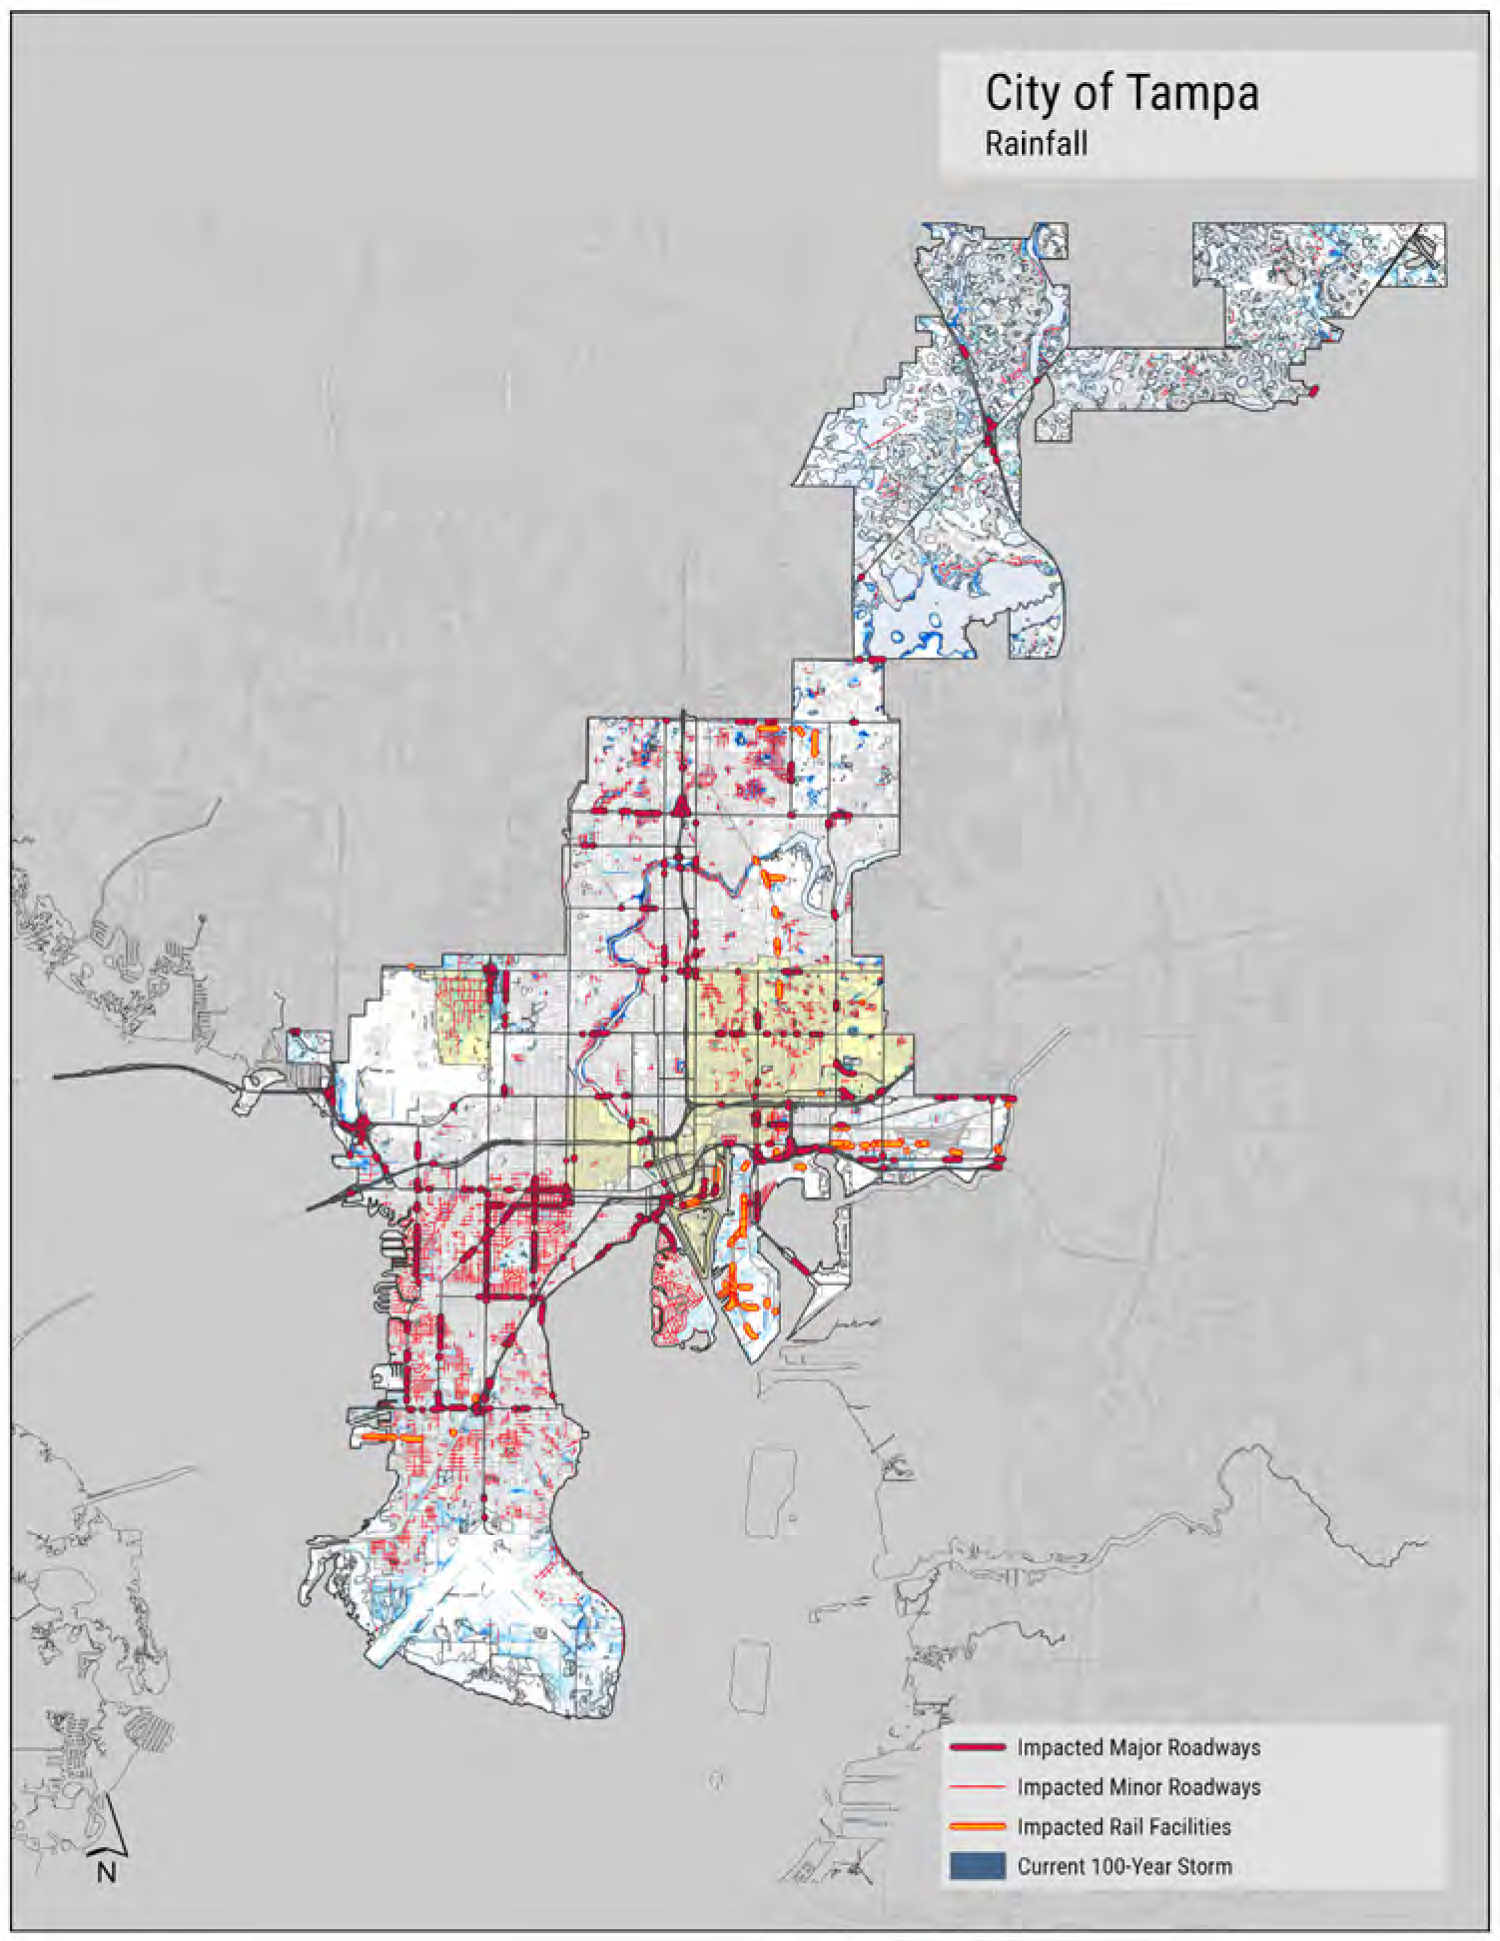
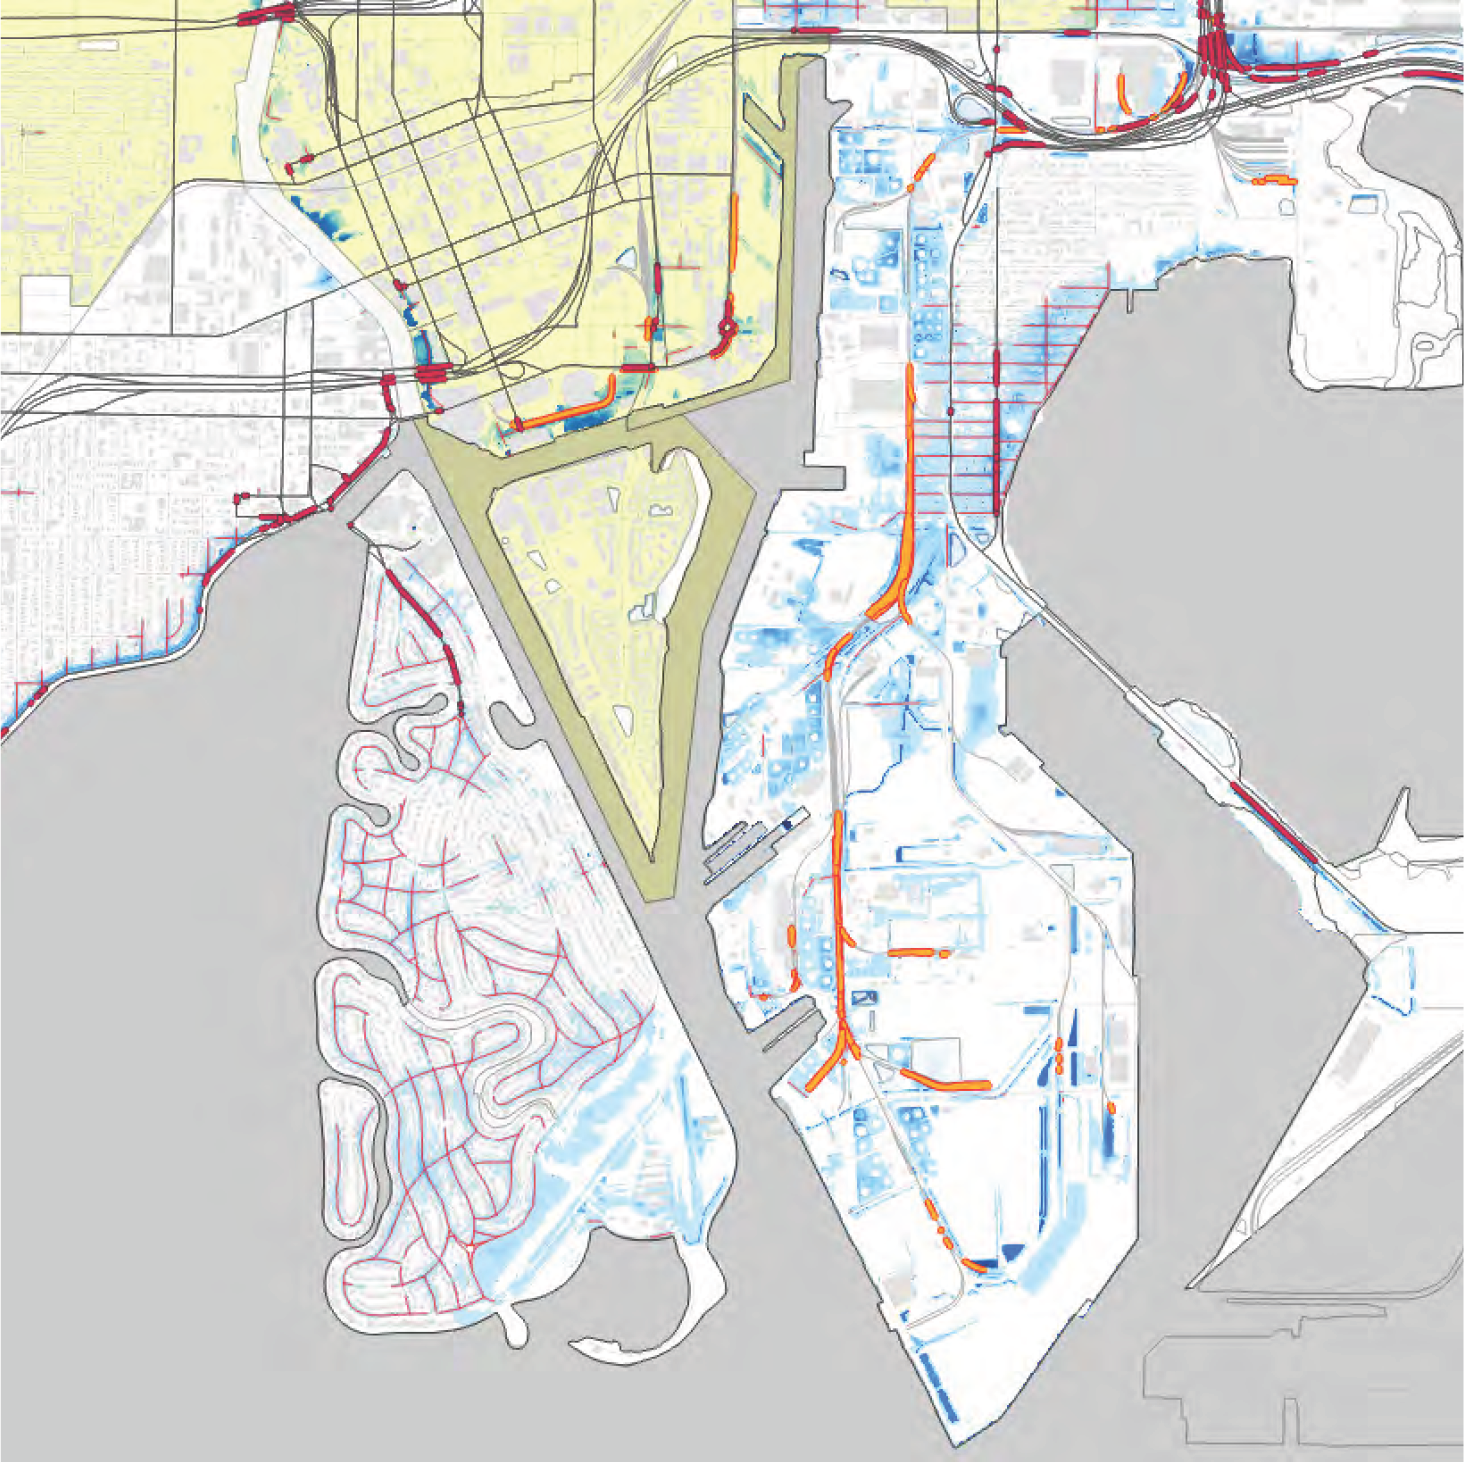
FIGURE 54: IMPACTED LOCAL TRANSPORTATION DUE TO THE 100-YEAR RAINFALL SCENARIO ALONG BAYSHORE BOULEVARD, AT DAVIS ISLANDS, AND IN THE PALMETTO BEACH AND PORT TAMPA BAY PENINSULA.
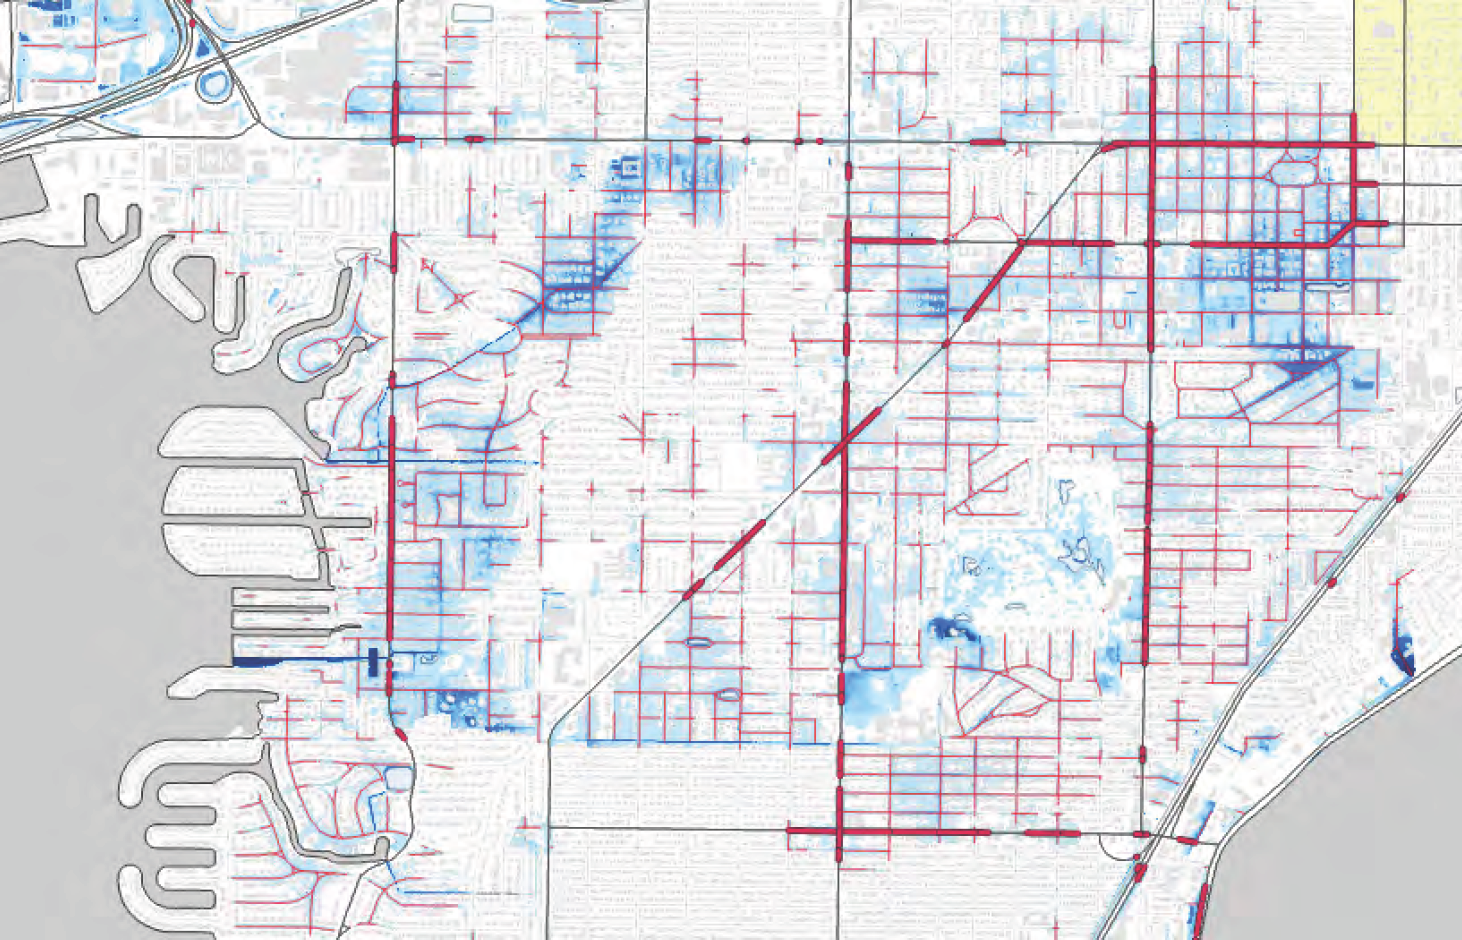
FIGURE 55: IMPACTED LOCAL TRANSPORTATION DUE TO THE 100-YEAR RAINFALL SCENARIO IN SOUTH TAMPA.
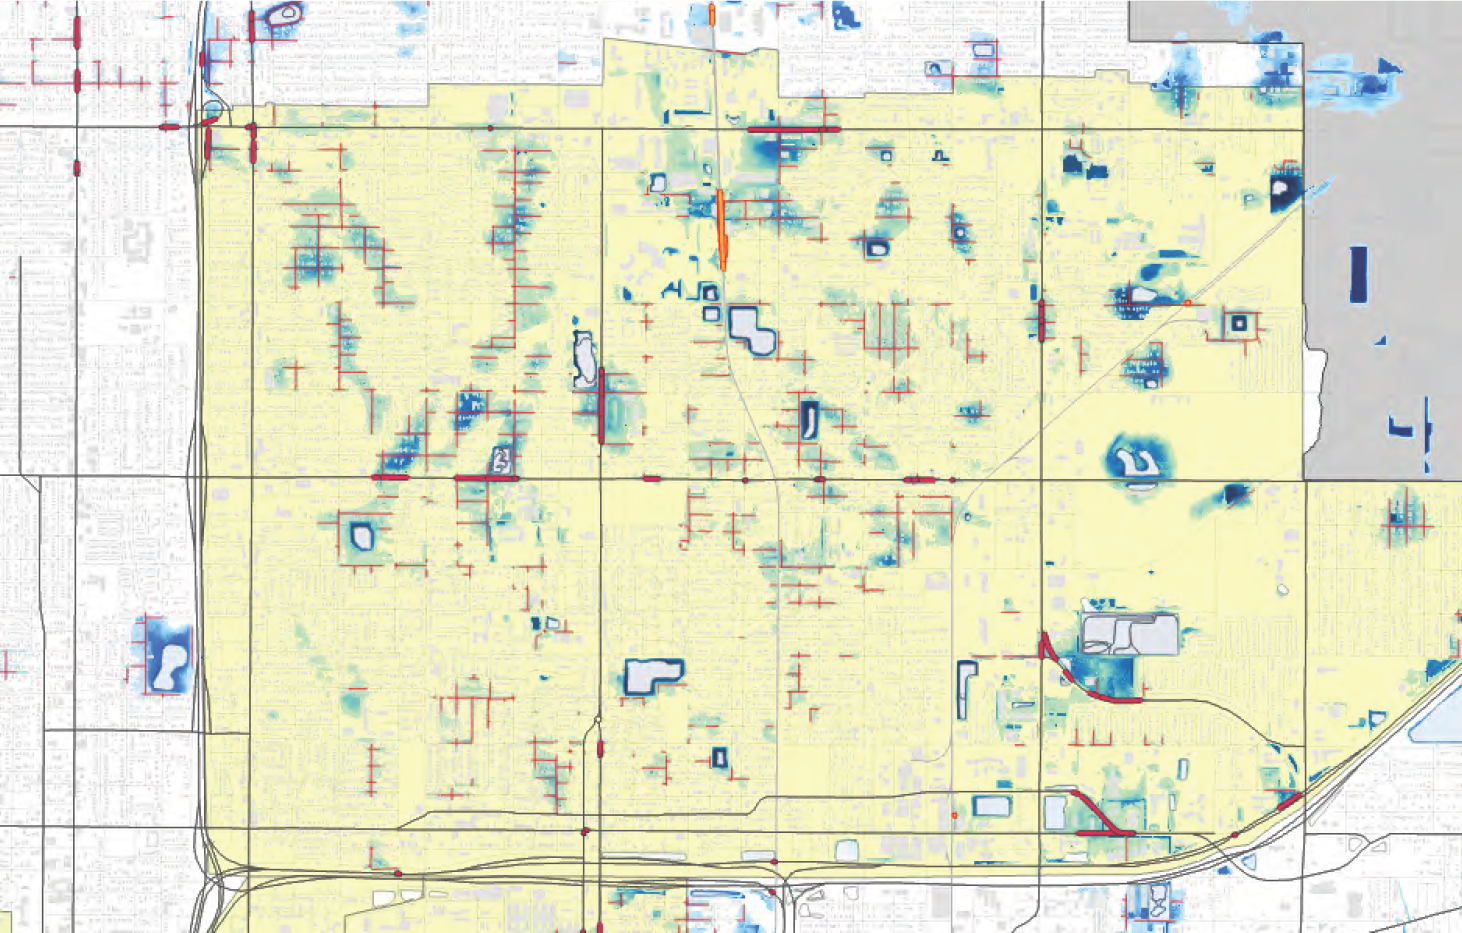
FIGURE 56: IMPACTED LOCAL TRANSPORTATION DUE TO THE 100-YEAR RAINFALL SCENARIO IN EAST TAMPA.
FINDINGS FOR STORM SURGE
Major Roads
- Gandy Boulevard at ground level, although the viaduct project has created evacuation route access above street level
- Dale Mabry south of Gandy
- Bayshore Boulevard
- South West Shore Boulevard
- Manhattan Avenue
- Kennedy, west of Dale Mabry, including the 275 and Highway 60 interchange
- The Courtney Campbell Causeway
- The Howard Frankland Bridge
- The Gandy Causeway
- Independence Parkway
- North Boulevard between Ross Avenue and Cass Street
- Channelside and Meridian drives
- 20th and 22nd streets in Palmetto Beach
- Adamo Drive
- Causeway Boulevard
Minor Roads
- Most all of the minor and major roadways south of Gandy would be impacted by the 100-year coastal surge by 2070, about double the area of the current extents.
- Davis Islands and Harbour Island are fully impacted by the coastal surge scenario
- Port Tampa Bay and Palmetto Beach
- Parts of Historic Ybor City
Rail
- Many of CSX’s coastal rail lines in Tampa would be impacted by a 100-year storm surge event with current coastal stillwater elevations. When considering the 2070 intermediate-high scenario the system is only slightly more vulnerable. Areas of risk include:
- Old Port of Tampa area
- Hooker’s Point and access from Port Tampa Bay to the East Ybor City rail yard
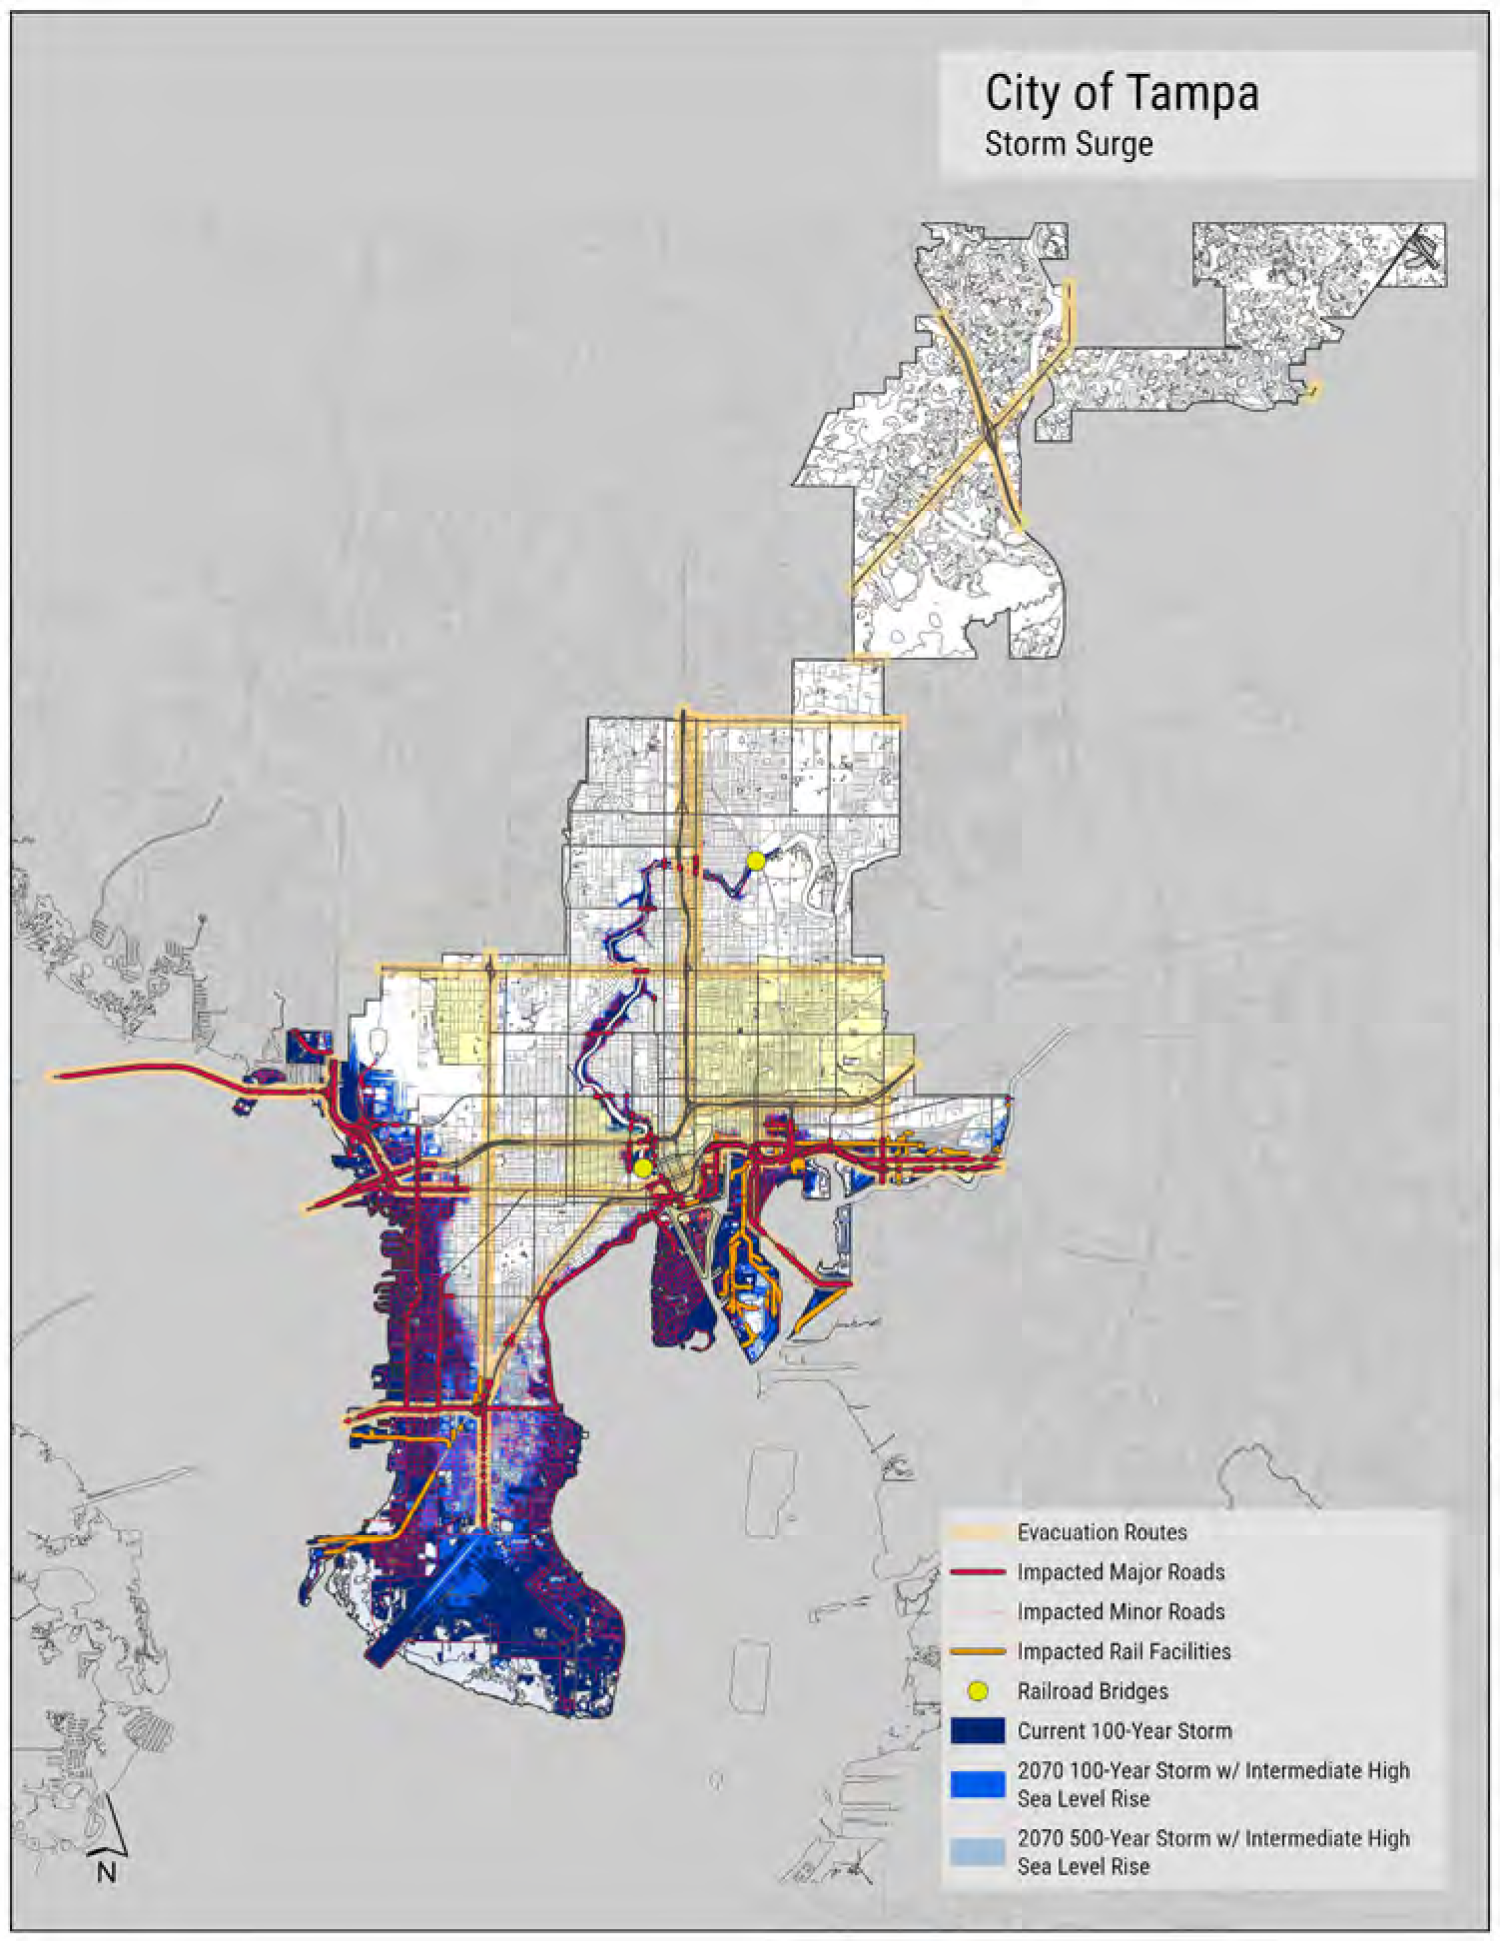
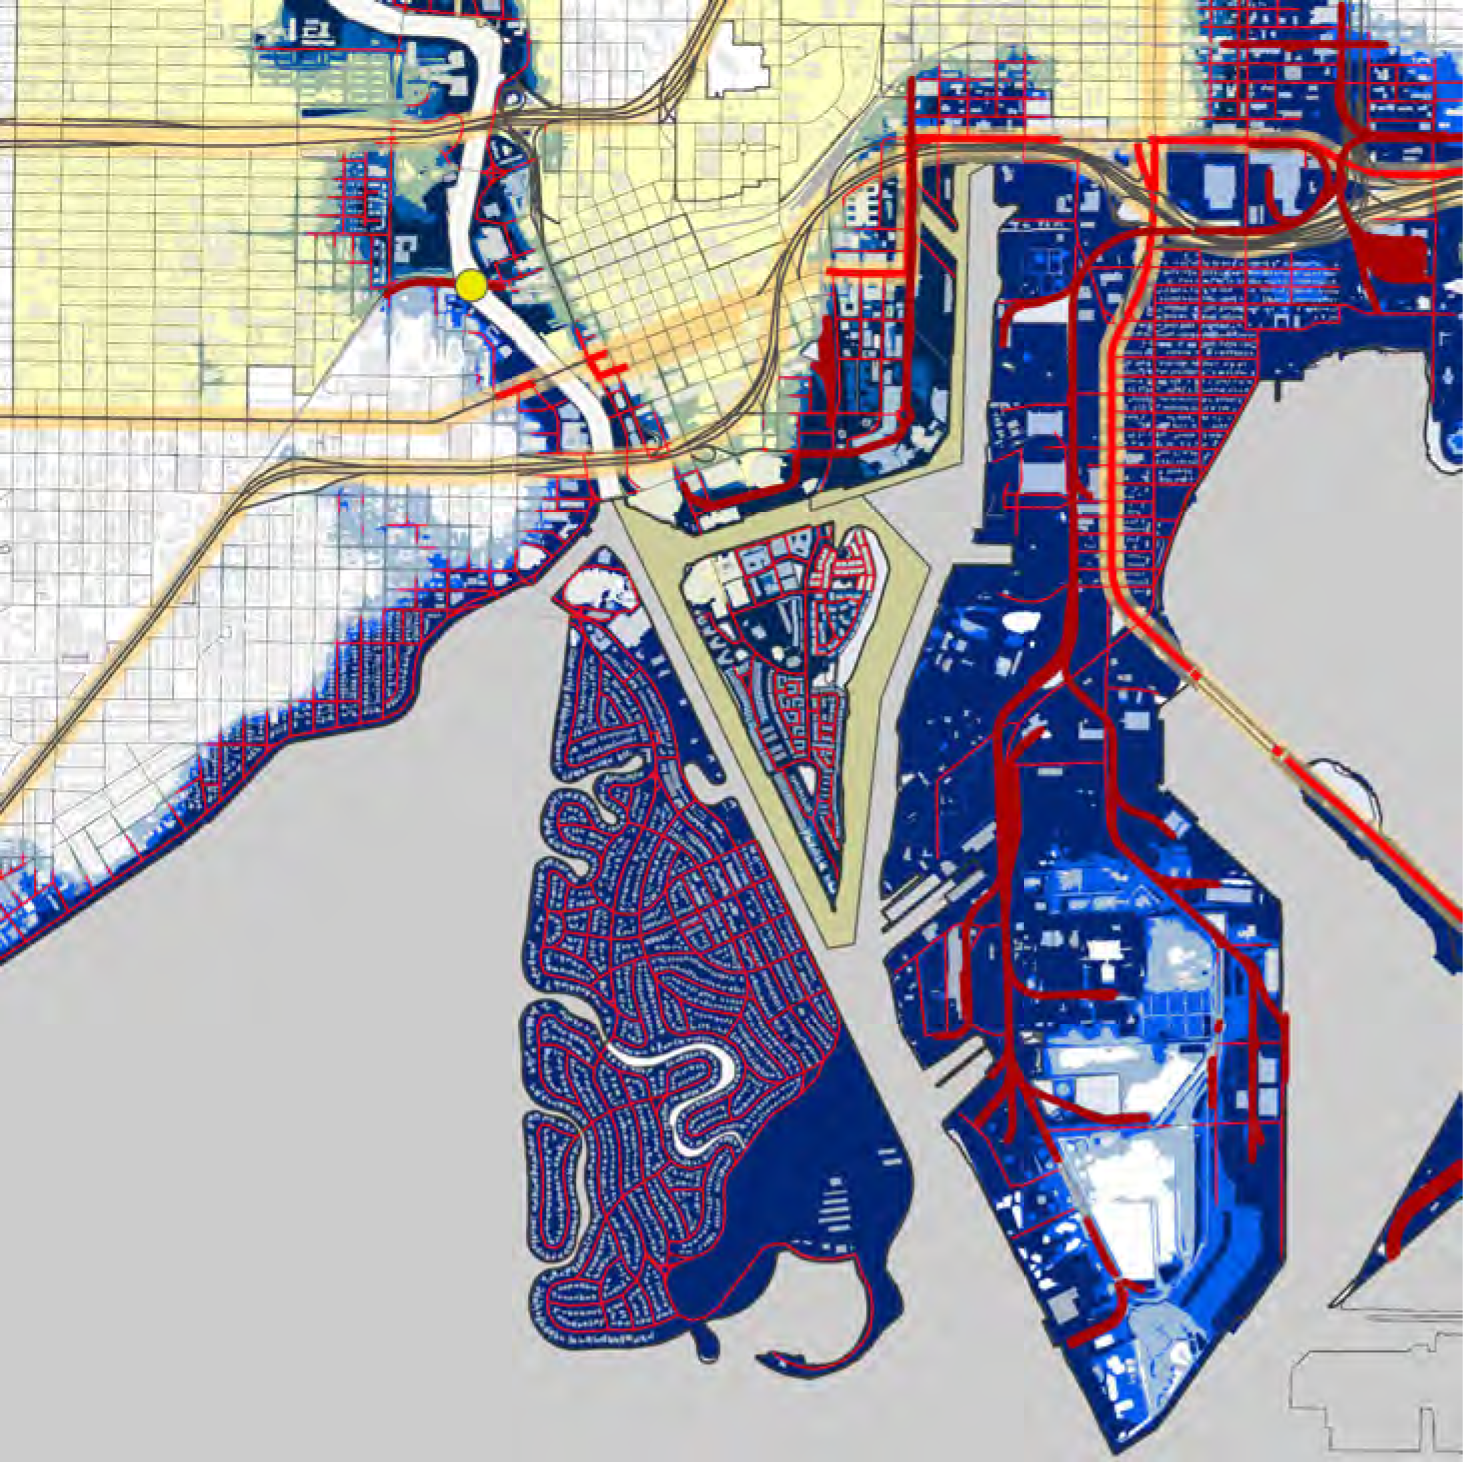
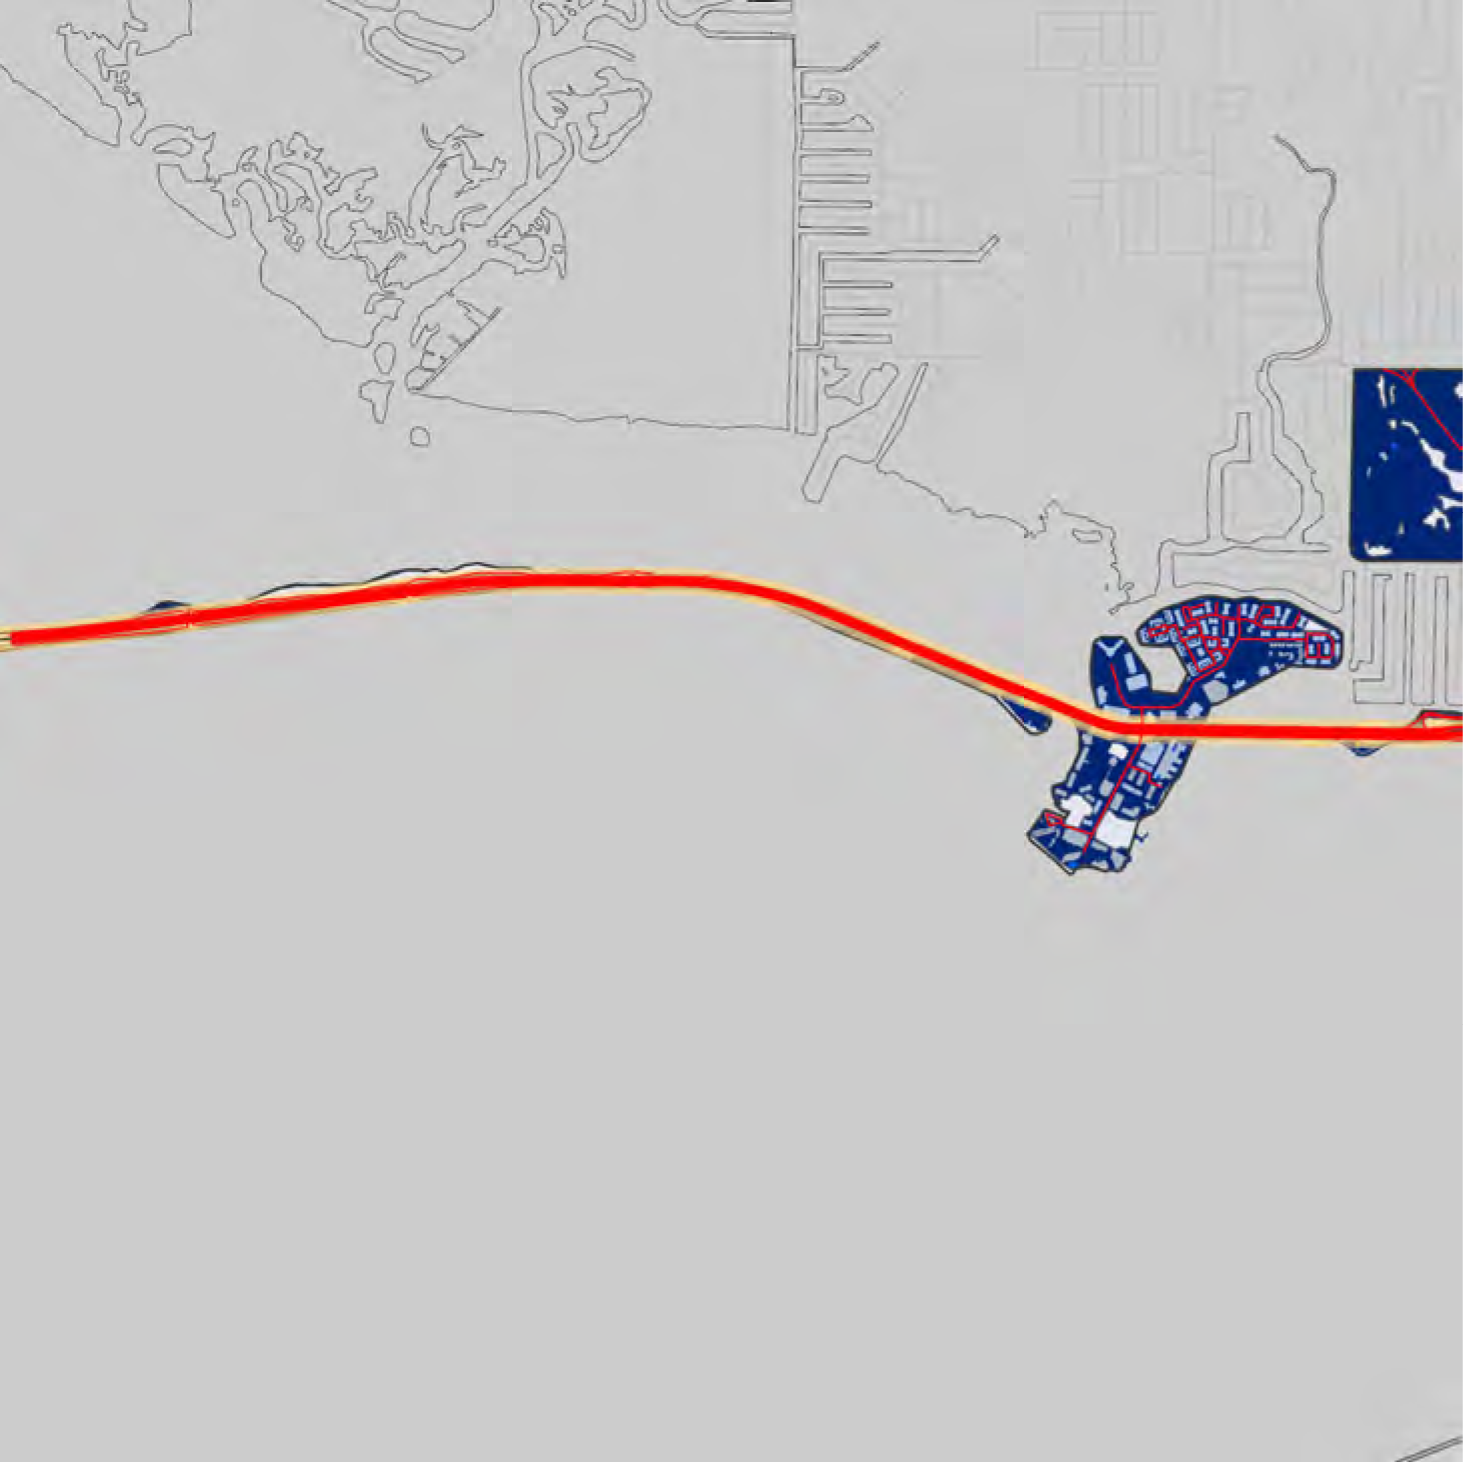
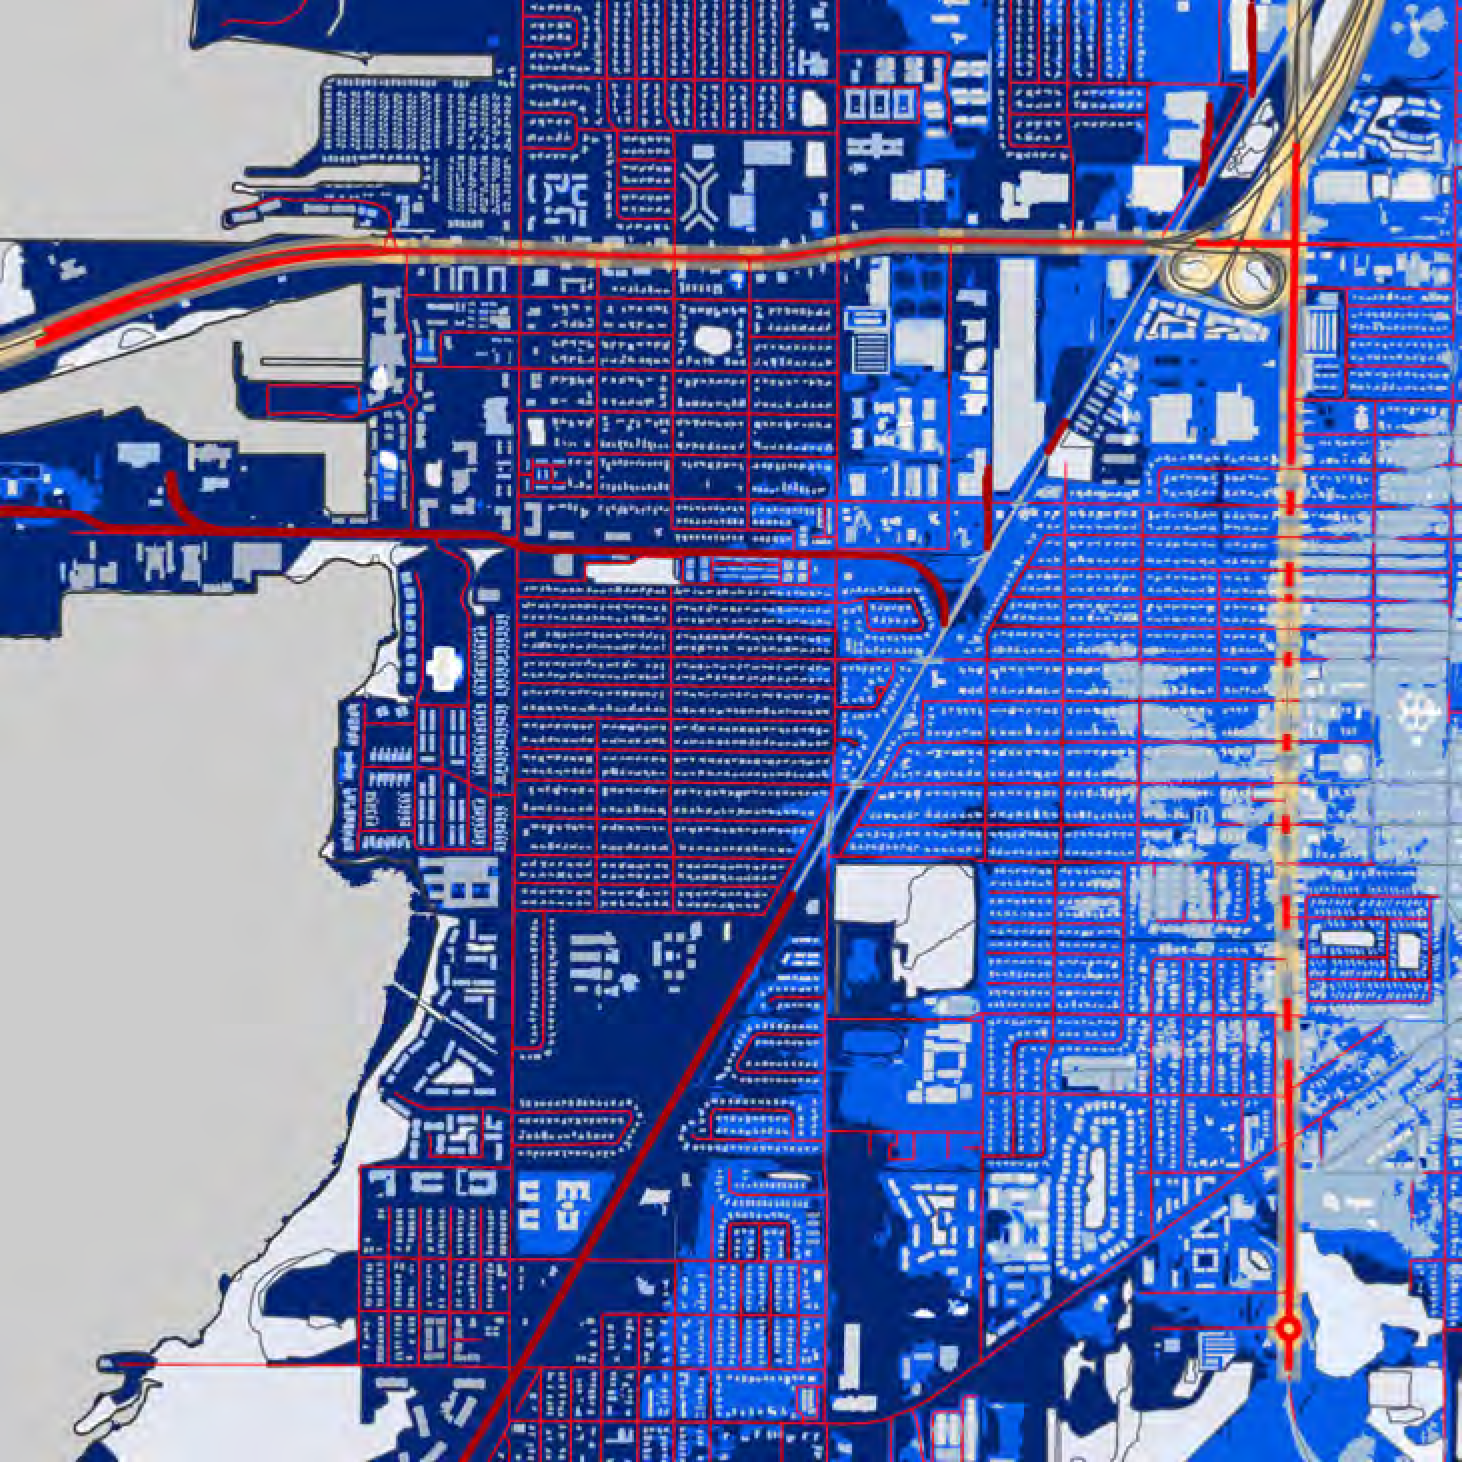
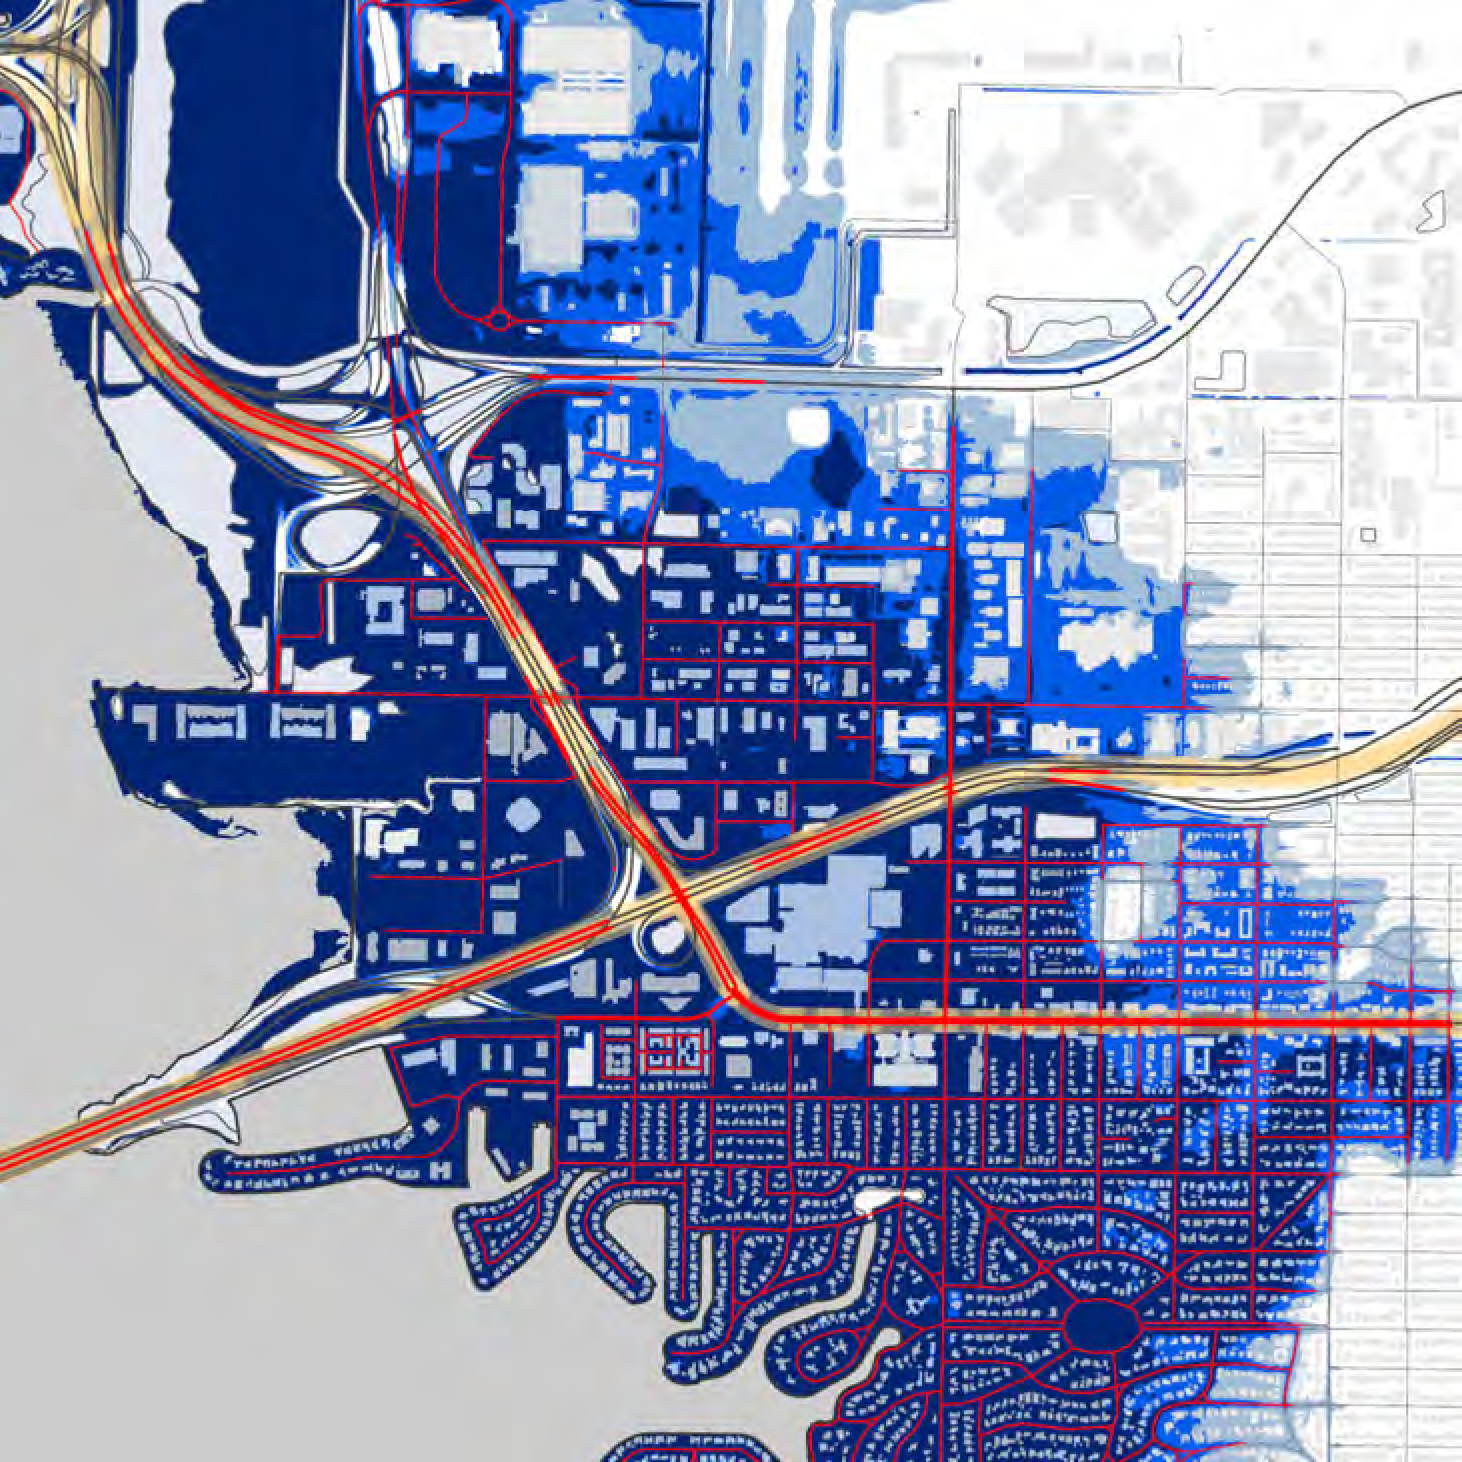
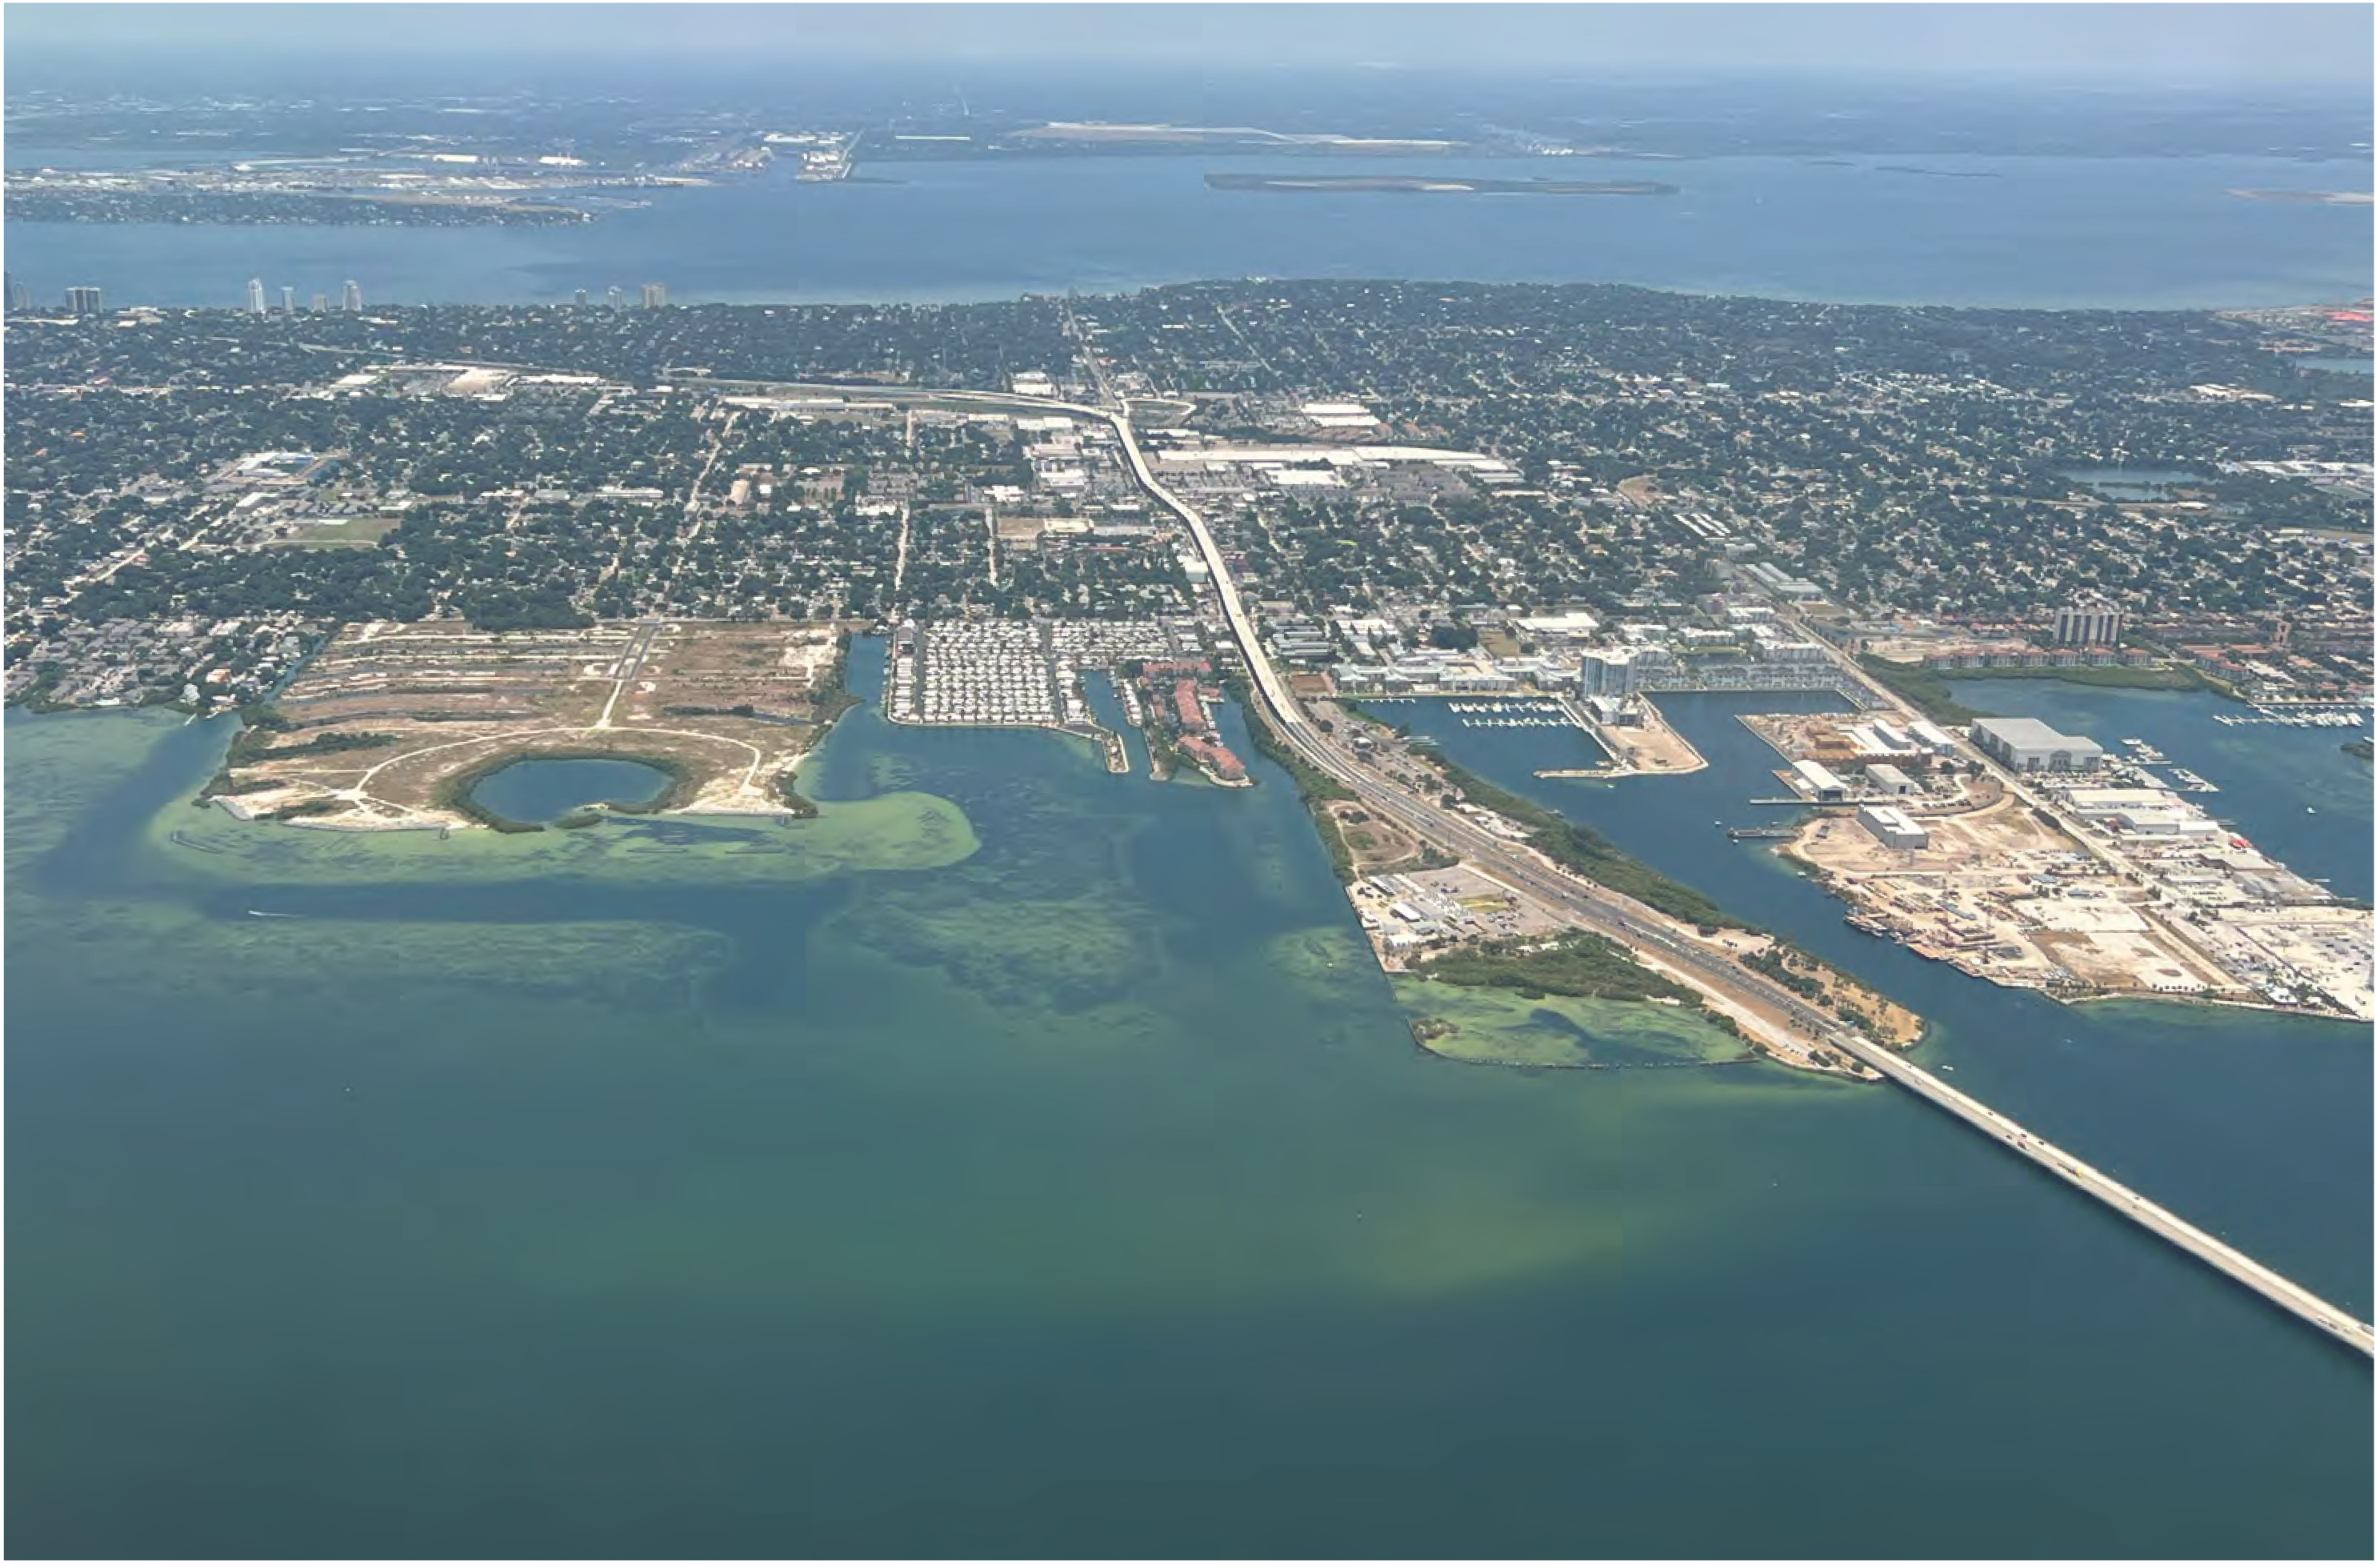
FIGURE 63: IMPACTED TRANSPORTATION ASSETS ALONG THE WESTSHORE AREA DUE TO STORM SURGE. FIGURE 64: IMPACTED TRANSPORTATION ASSETS NEAR THE HOWARD FRANKLAND BRIDGE DUE TO STORM SURGE.
PUBLIC TRANSPORTATION
Tampa’s primary public transportation system relies on buses, which are associated with bus stops and stations, and the city streets on which they utilize. Tampa also has a 2.7-mile streetcar system that connects Ybor City with Downtown. This includes 11 stations and the rail lines that guide it. This system could be disrupted by flooding, especially at bus stops or stations where commuters gather before boarding. Flooding in these locations should be considered through an equity lens. Buses can provide a more accessible mode of transportation for lower income populations.
FINDINGS
Sea Level Rise
There are no projected impacts due to sea level rise.
Rainfall
With a 100-year rainfall event there are impacted bus stops throughout the city. These are mostly along major roadways, which are described in a previous section. Impacted bus stops are shown in the map provided.
Storm Surge
Storm surge is typically associated with hurricane scenarios, when the transit system may be halted. However, stops may be impacted by storm surge flooding or wave energy, as well as the roads that service the system. Numerous stops in peninsular South Tampa, Westshore, and Downtown Tampa are impacted by the modeled surge scenarios.
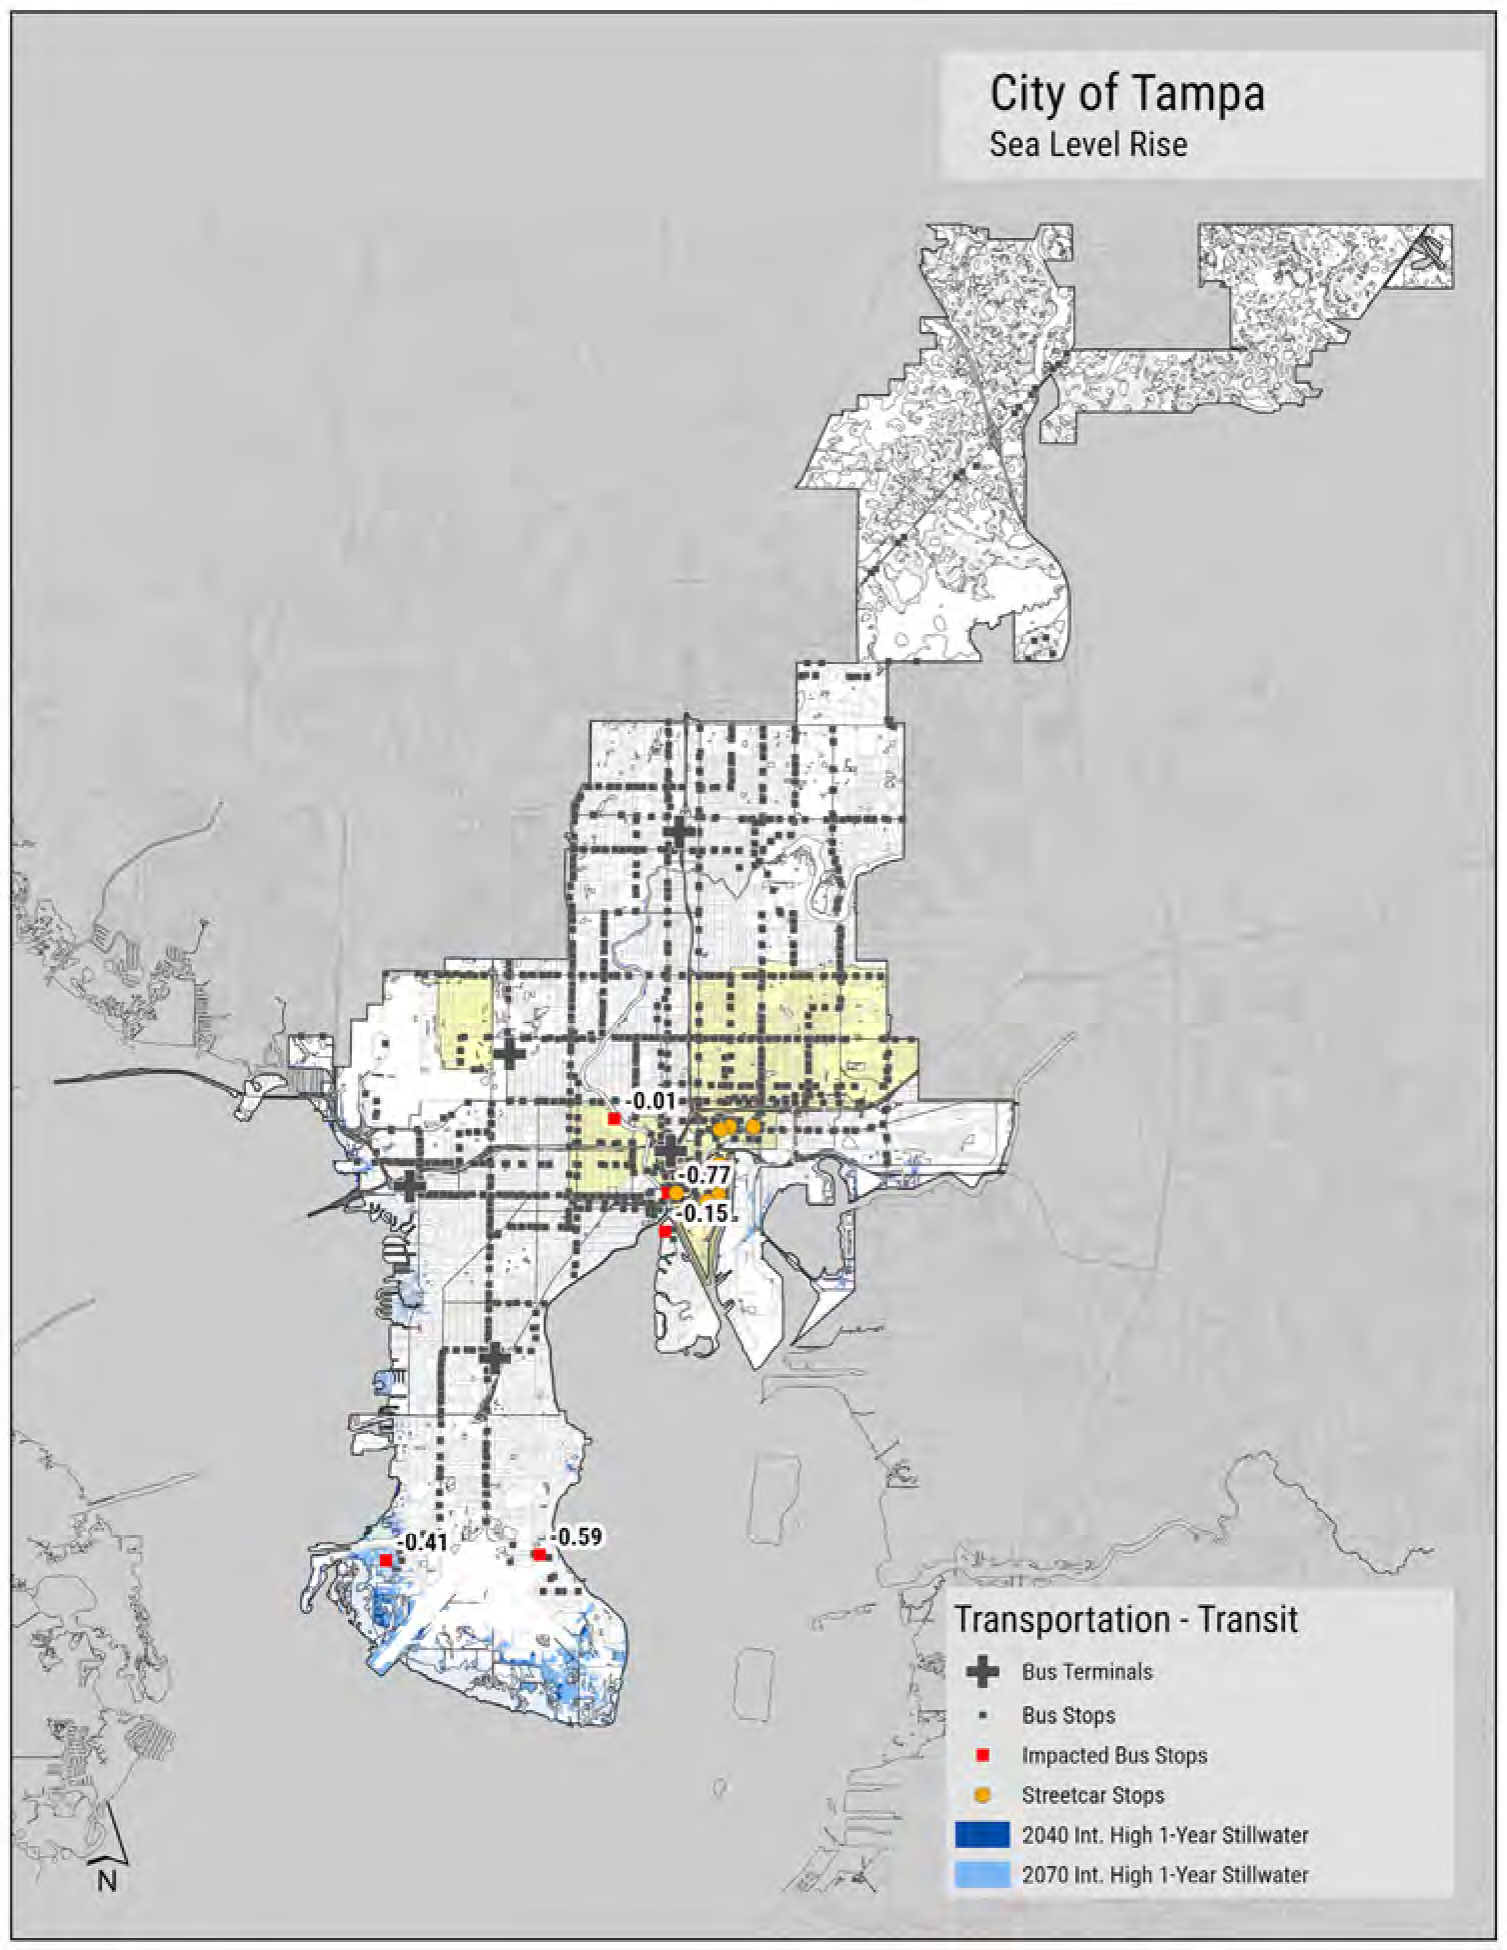
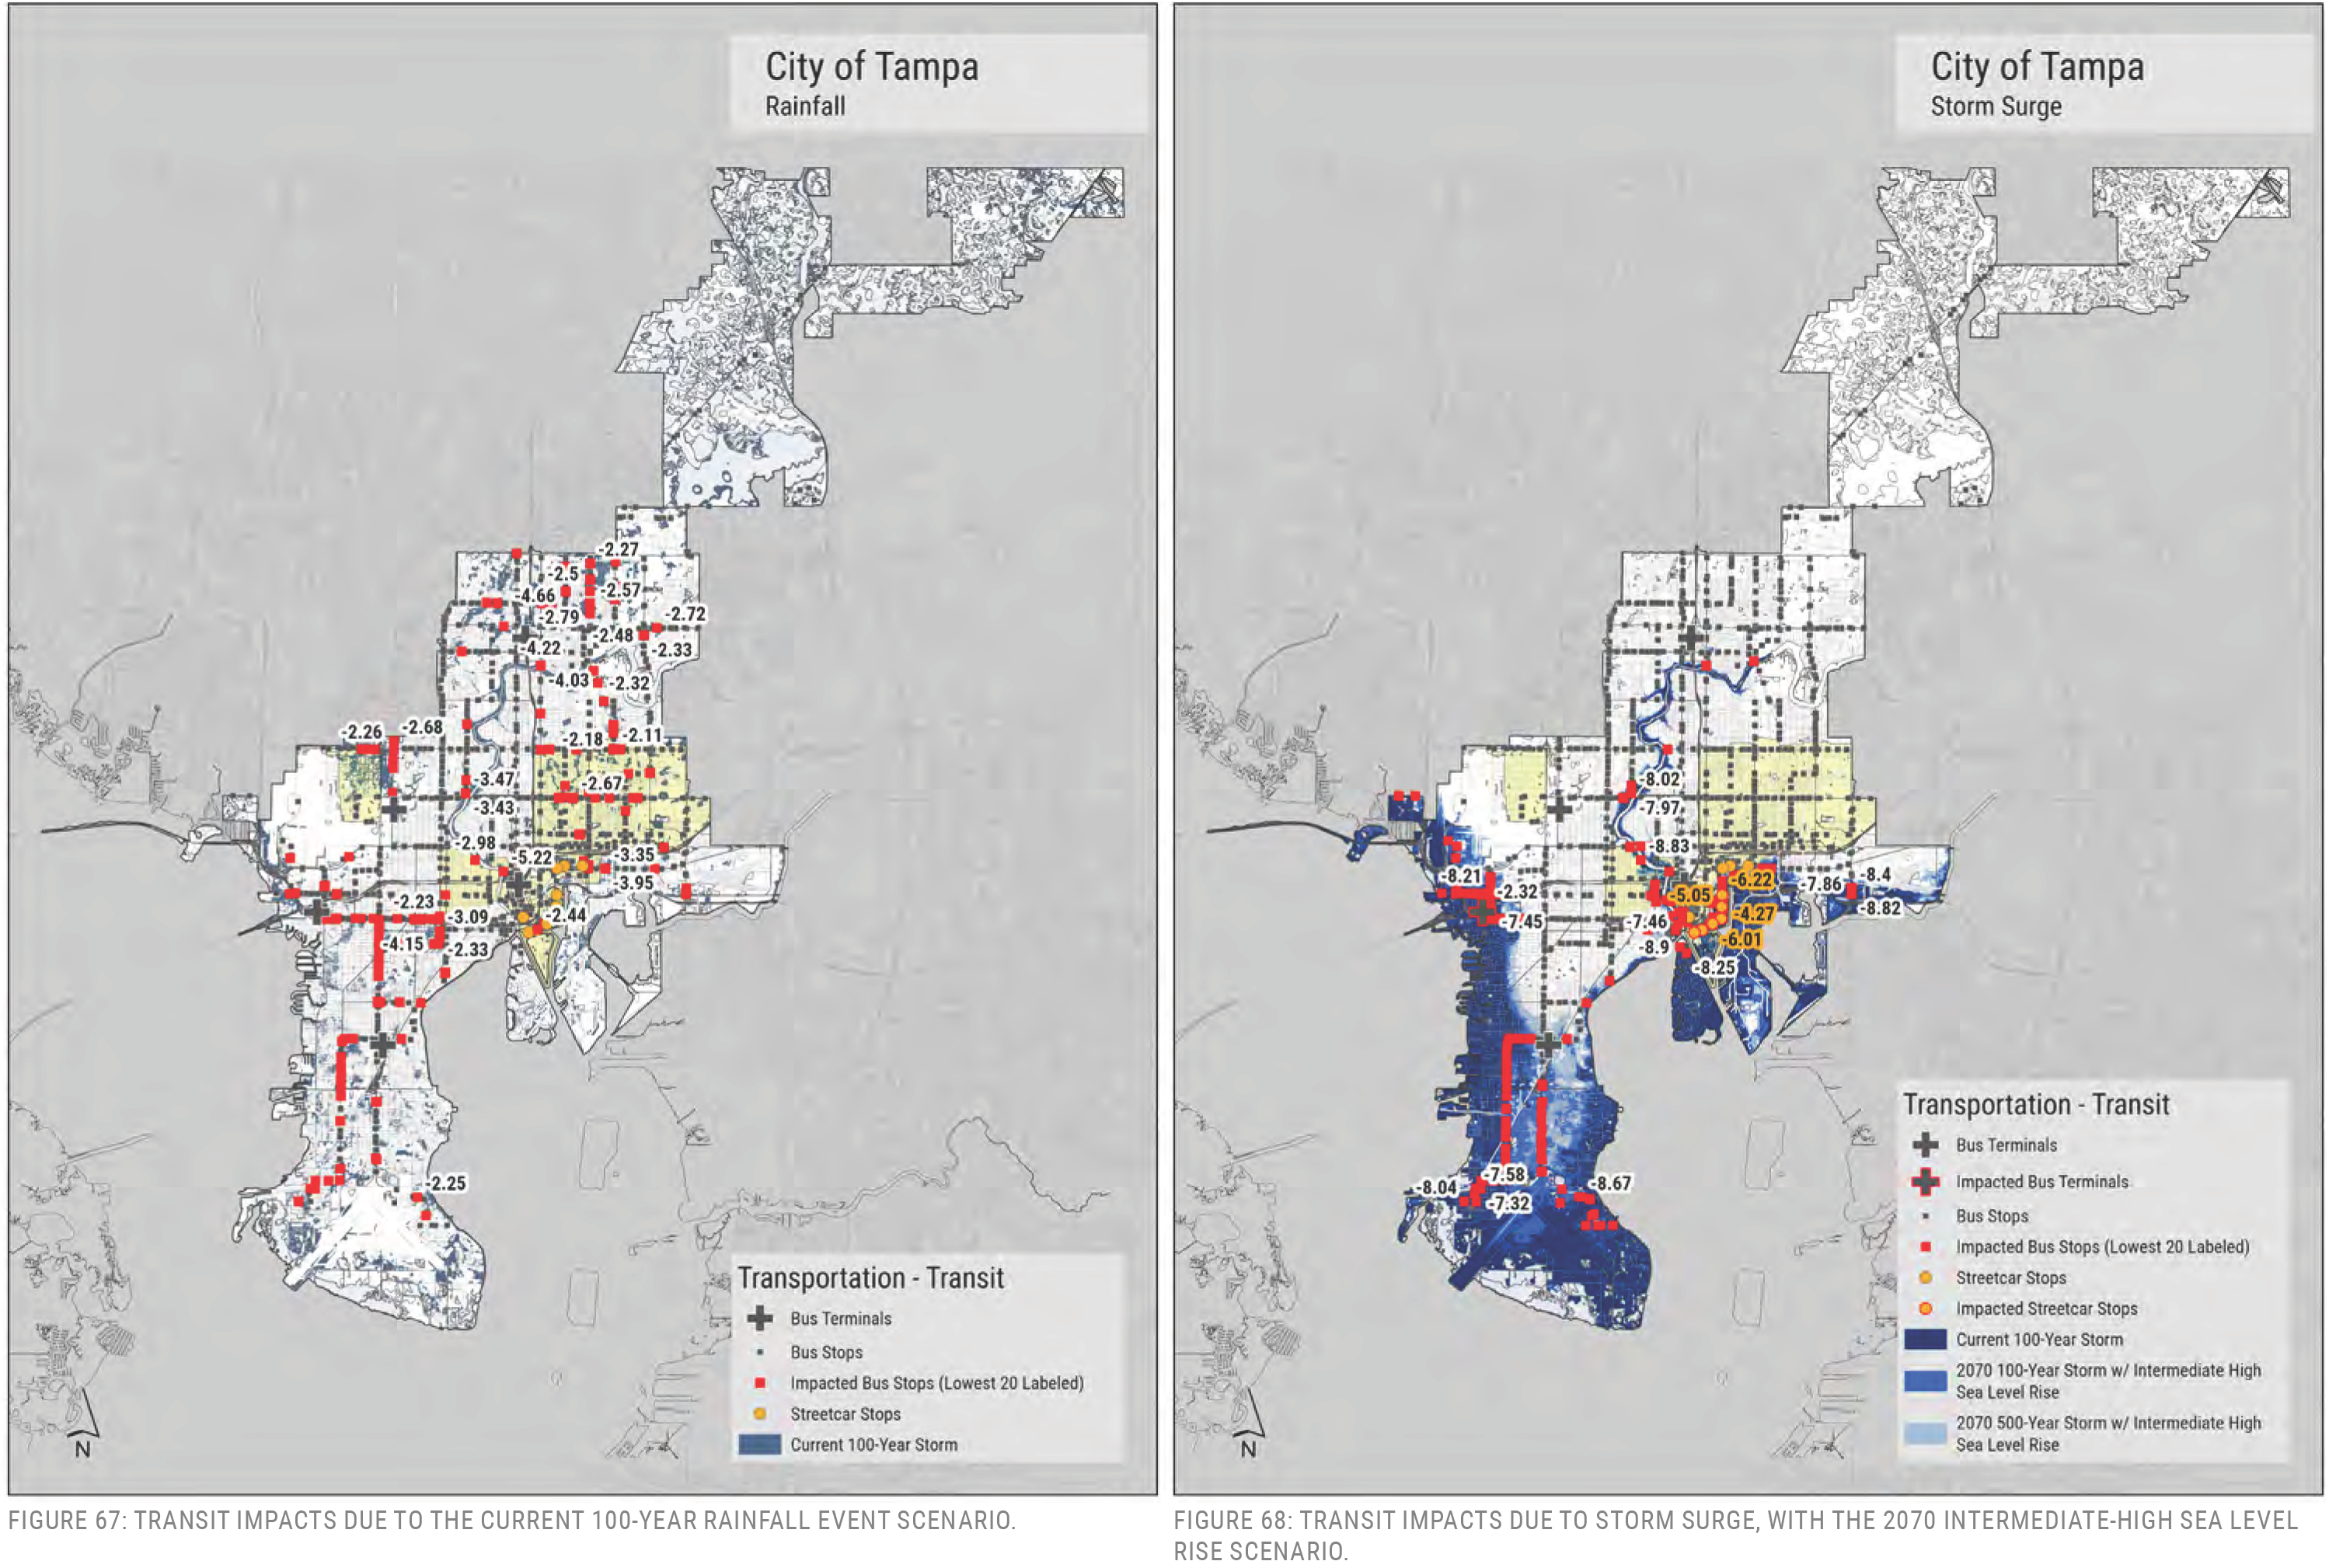
STRUCTURES
This asset category includes all built structures within the City of Tampa. City-owned properties are discussed in a separate section. The actual point of entry for flooding, where water could enter a structure, was not included in the data provided. Instead, this study uses a structure’s adjacent surface grade, taken from the digital elevation model, to determine each building’s potential exposure to flooding – where water would be at or near the building at ground level. In some cases, buildings have steps leading to the entrance or they may be raised on pilings. Such buildings would not be sensitive to minimal ground level flooding. If a building is flooded, the vertical extent and the duration both play a role in potential damage. The materials of the structure also matter. Flooring, wood framing, and drywall can be impacted by small amounts of water intrusion. Building systems, such as electrical and HVAC components, are also susceptible.
Tampa’s distribution of structures is relatively even throughout the city. In some locations structures are larger or denser, typically associated with areas of commerce or multi-family housing. The least dense area is in New Tampa, in the northeast part of the city. The type of structure, spatial distribution of structures, and structure size are all factors that can be considered for creating approaches towards adapting an area to future flooding (University of South Florida, 2021).
In Florida, significant changes were made to the building code after Hurricane Andrew (1992), first as the South Florida Building Code in 1994, with statewide adoption of more stringent building criteria in 2002. These changes have been shown to reduce flooding impacts (Simmons, et al., 2018). Many of Tampa’s structures were built before the 2002 date. Many were also built before there was any FEMA guidance from the National Flood Insurance Program. This program provides elevation guidance for structures and was established in 1968 but took many years to catch on and be used by communities. Structures constructed before these rules were mandated or codified by Florida Building Code may be below current 100-year event levels and be vulnerable to flooding. This study does not account for every building and its individual elevation. Instead, it highlights the ground elevation where flooding may occur at a structure. A structure may be more or less sensitive to flooding depending on its design and contents.
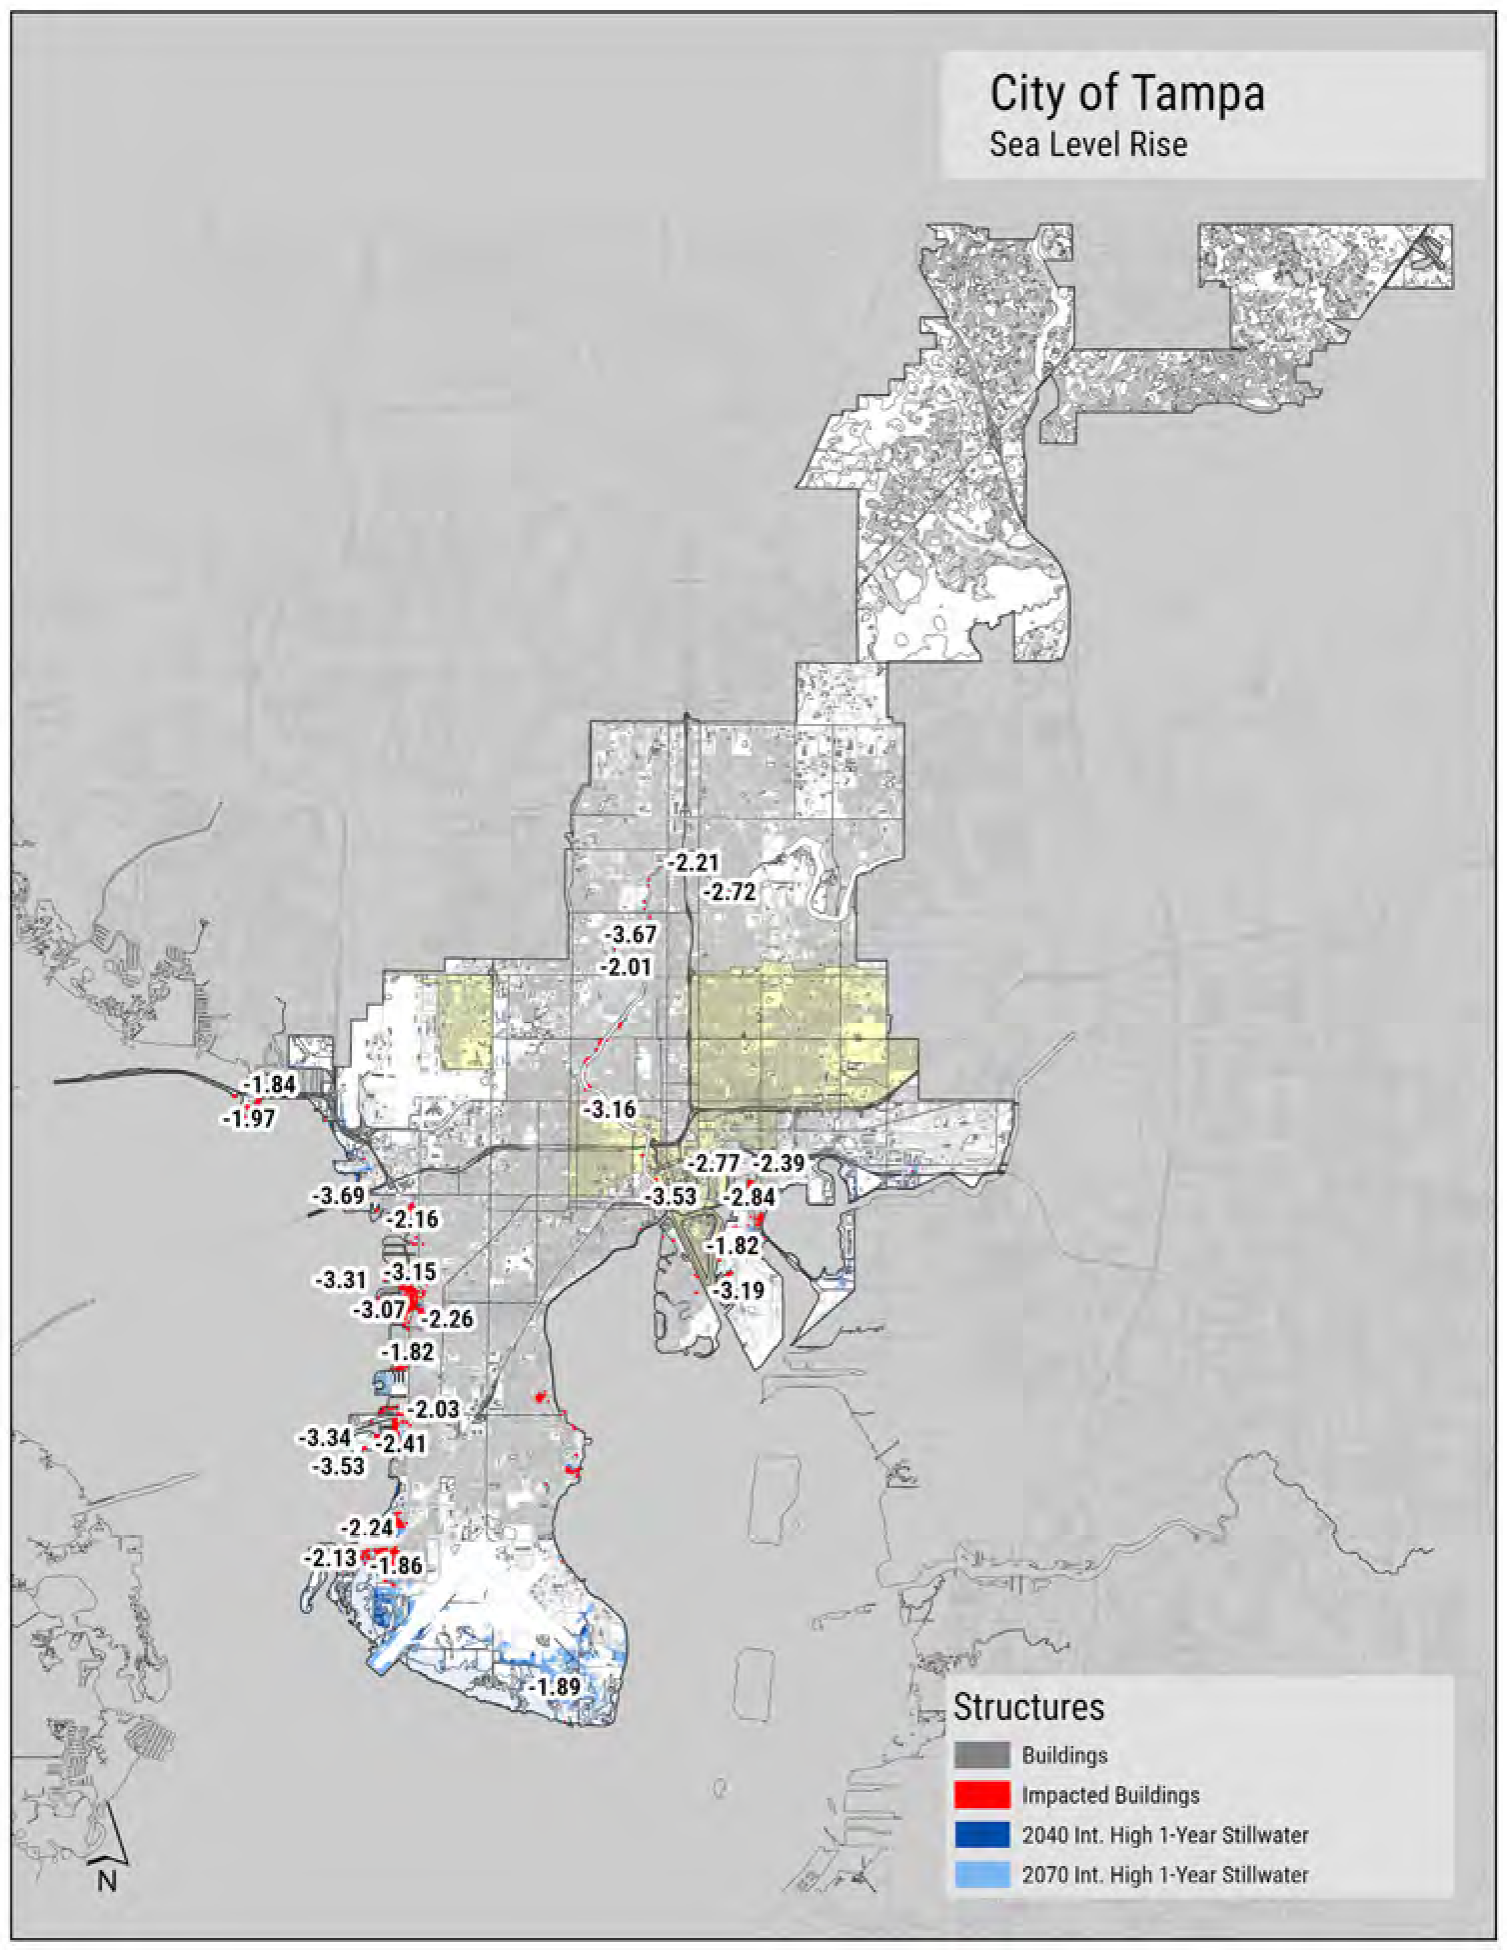
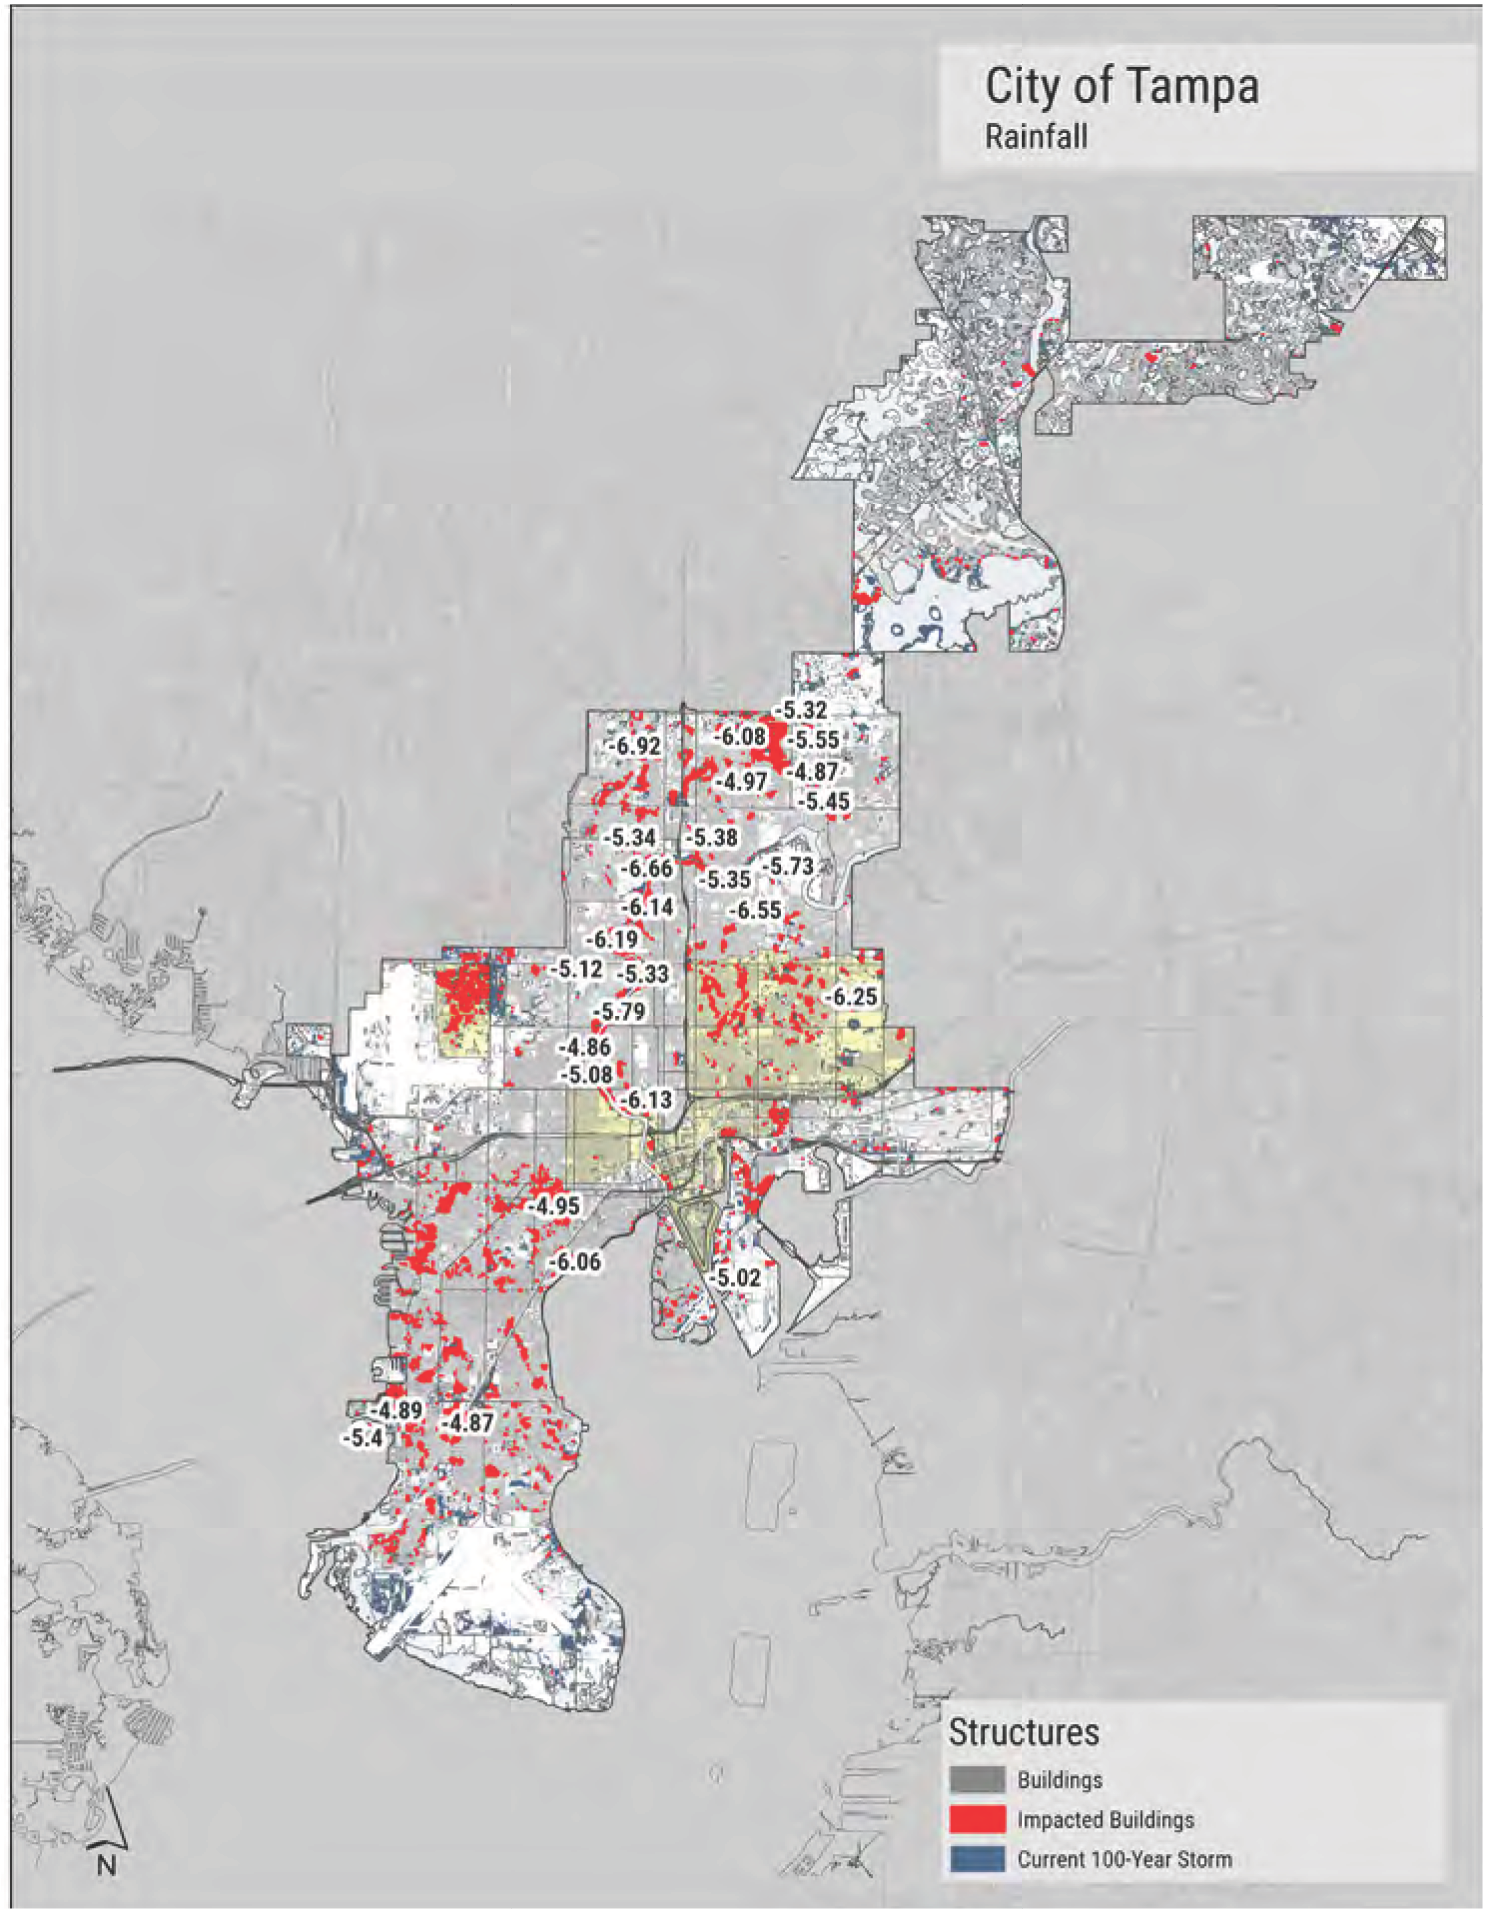
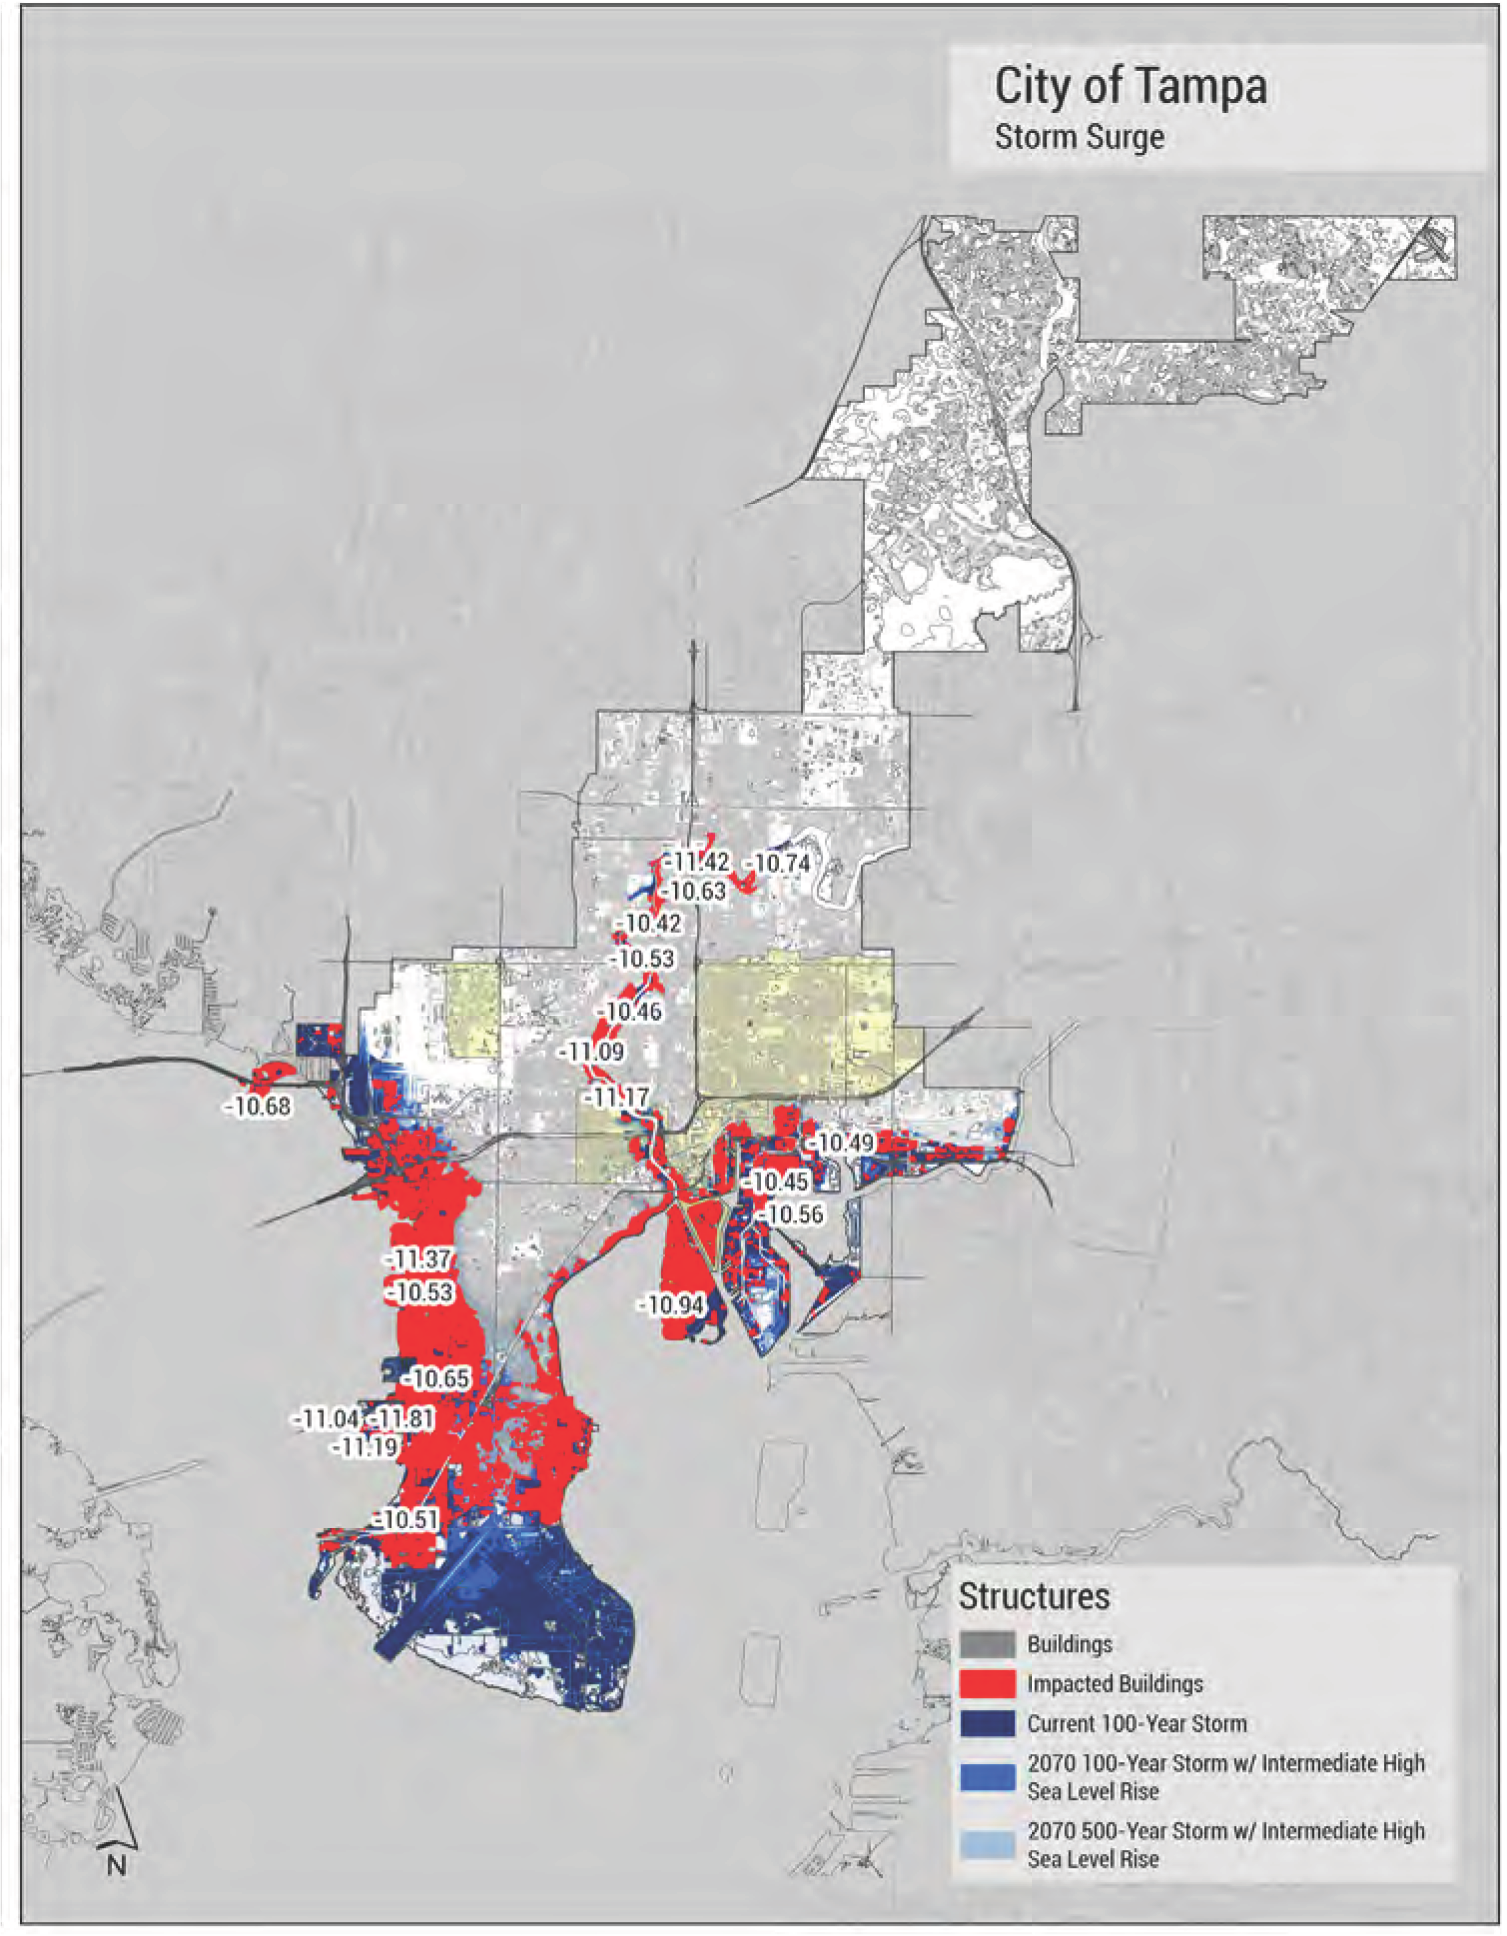
FINDINGS
Sea Level Rise
Locations of concentrated risk are very similar for structures as they are for stormwater and transportation systems. Primary focus areas include:
- Sunset Park
- Near the west end of Gandy Boulevard
- Port Tampa City
- Palmetto Beach
- Isolated locations along the Hillsborough River
Rainfall
The distribution of rainfall impacts are very different, spread evenly throughout Tampa with some areas of concentrated vulnerability. These include:
- Drew Park
- Palmetto Beach
- University Square
- Parkland Estates
- Along the Hillsborough River
Other areas with distributed flooding include:
- The South Tampa Peninsula
- East Tampa
- The south end of Davis Islands
- The Port of Tampa at Hooker’s Point
- North of Busch Boulevard
Storm Surge
The brunt of storm surge flooding would be incurred:
- On the west side of the South Tampa Peninsula
- Davis Islands
- Palmetto Beach
- Along the Hillsborough River
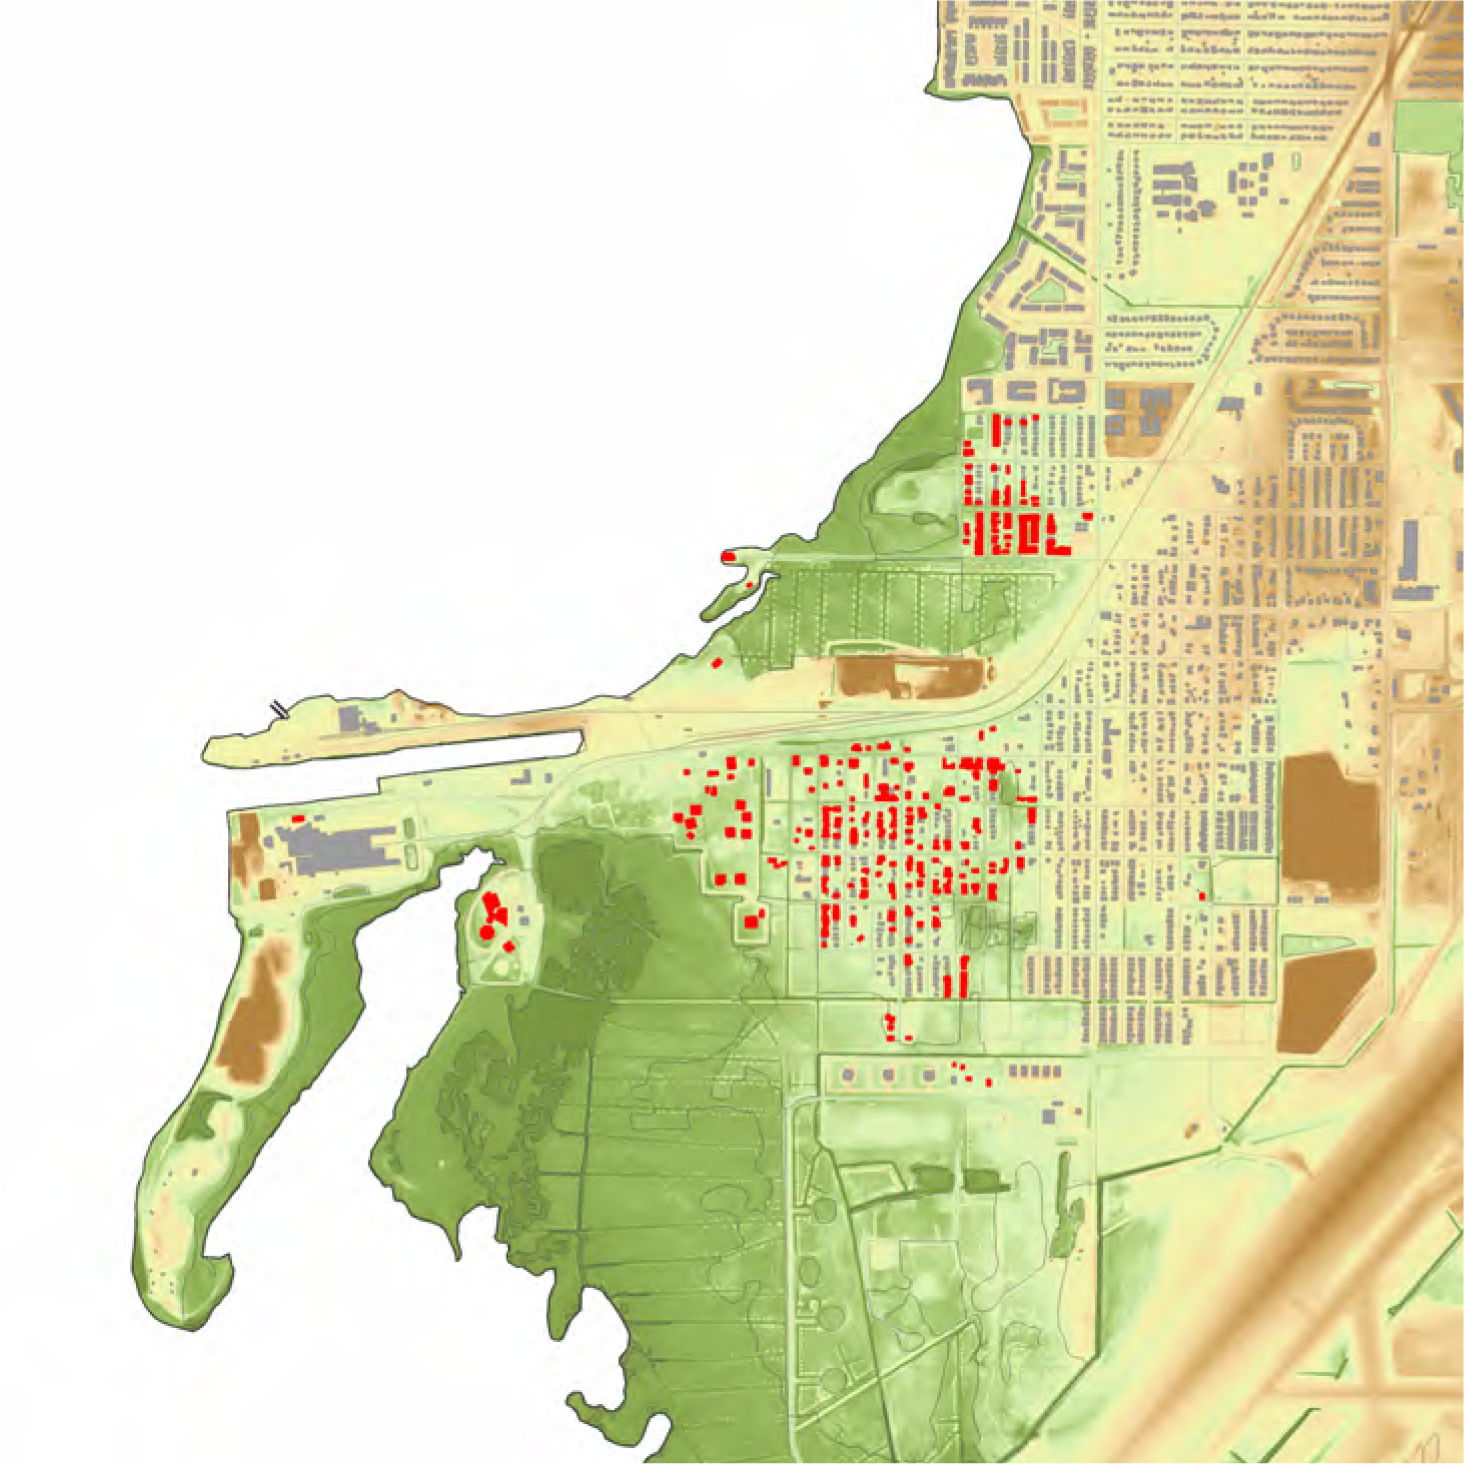
The 100-year storm would be comparable to what was recently experienced in Fort Myers Beach with Hurricane Ian (2022), higher than what was experienced with Hurricane Helene (2024) in Tampa. Accounting for 2070 sea level rise scenarios would add almost three feet to the water height.
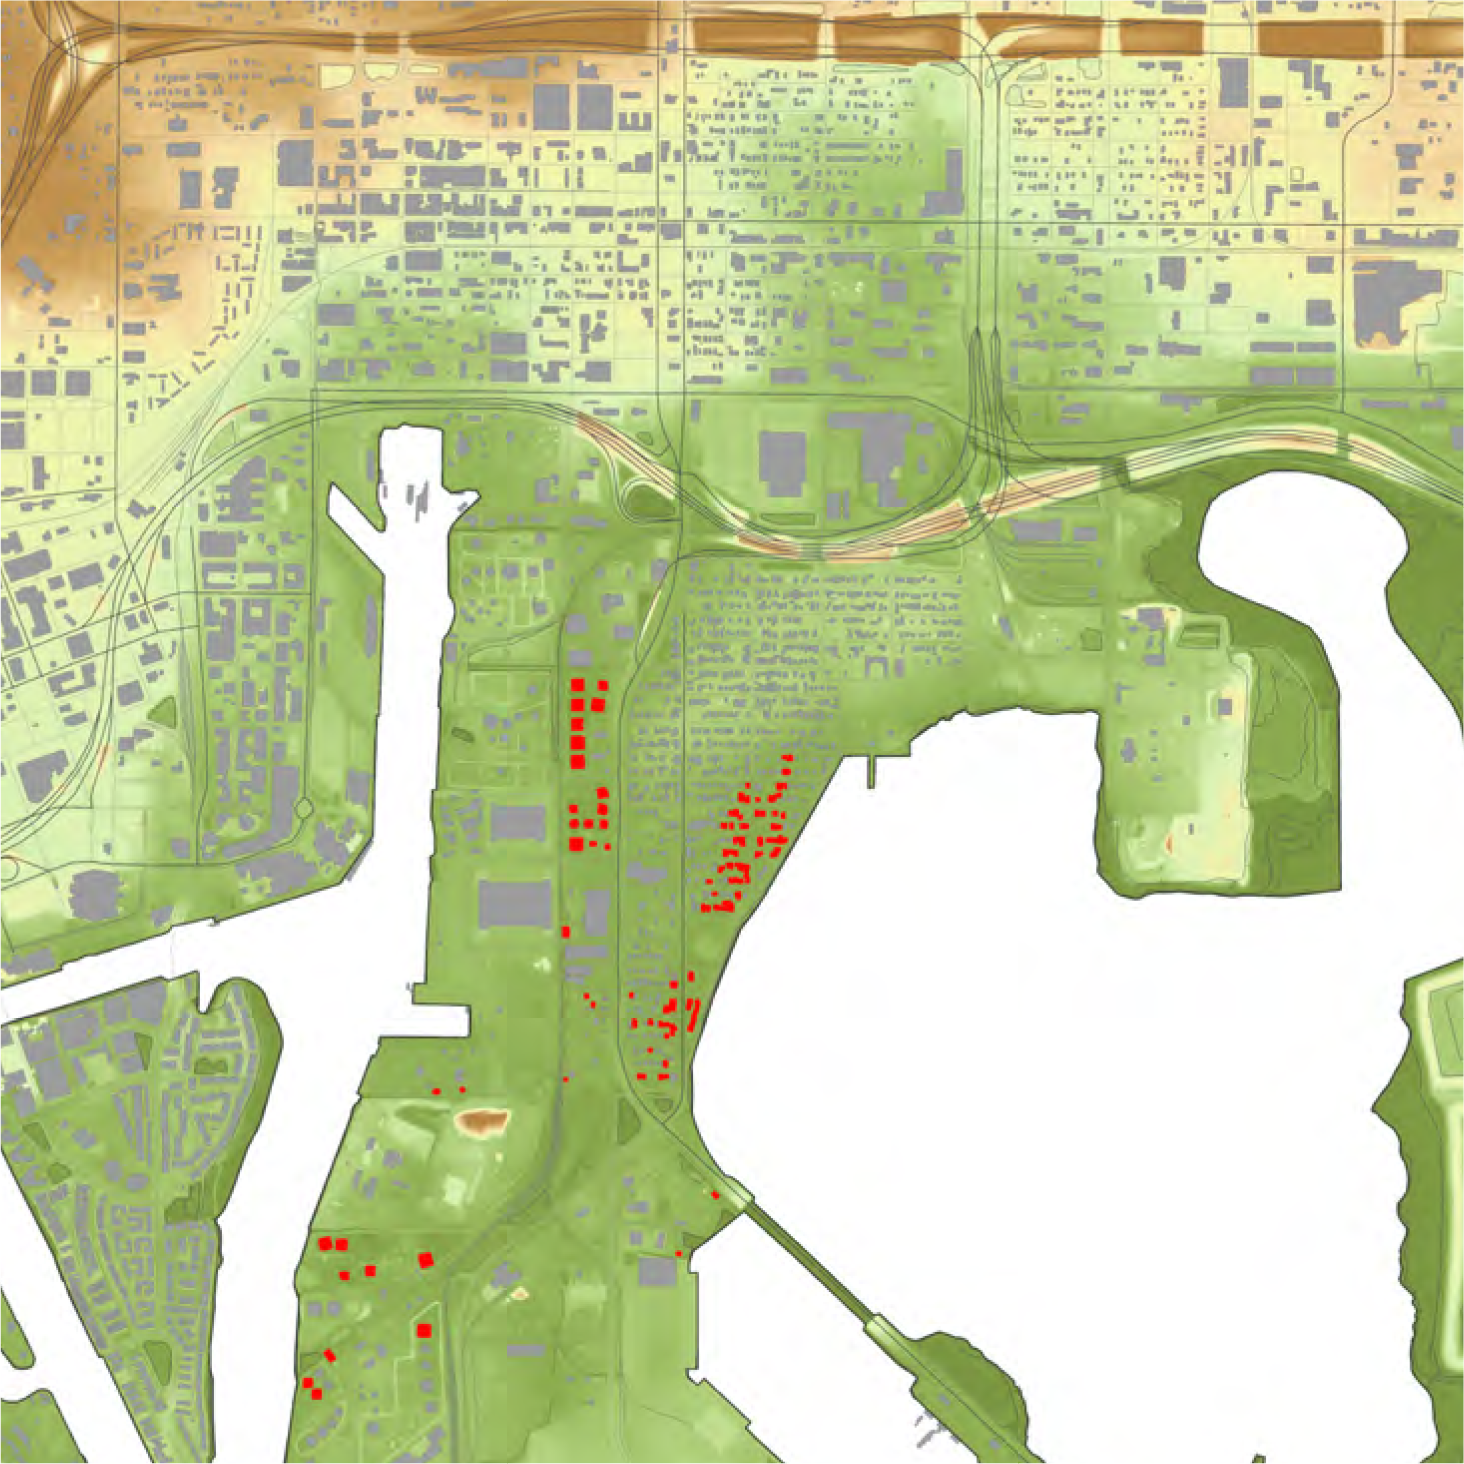
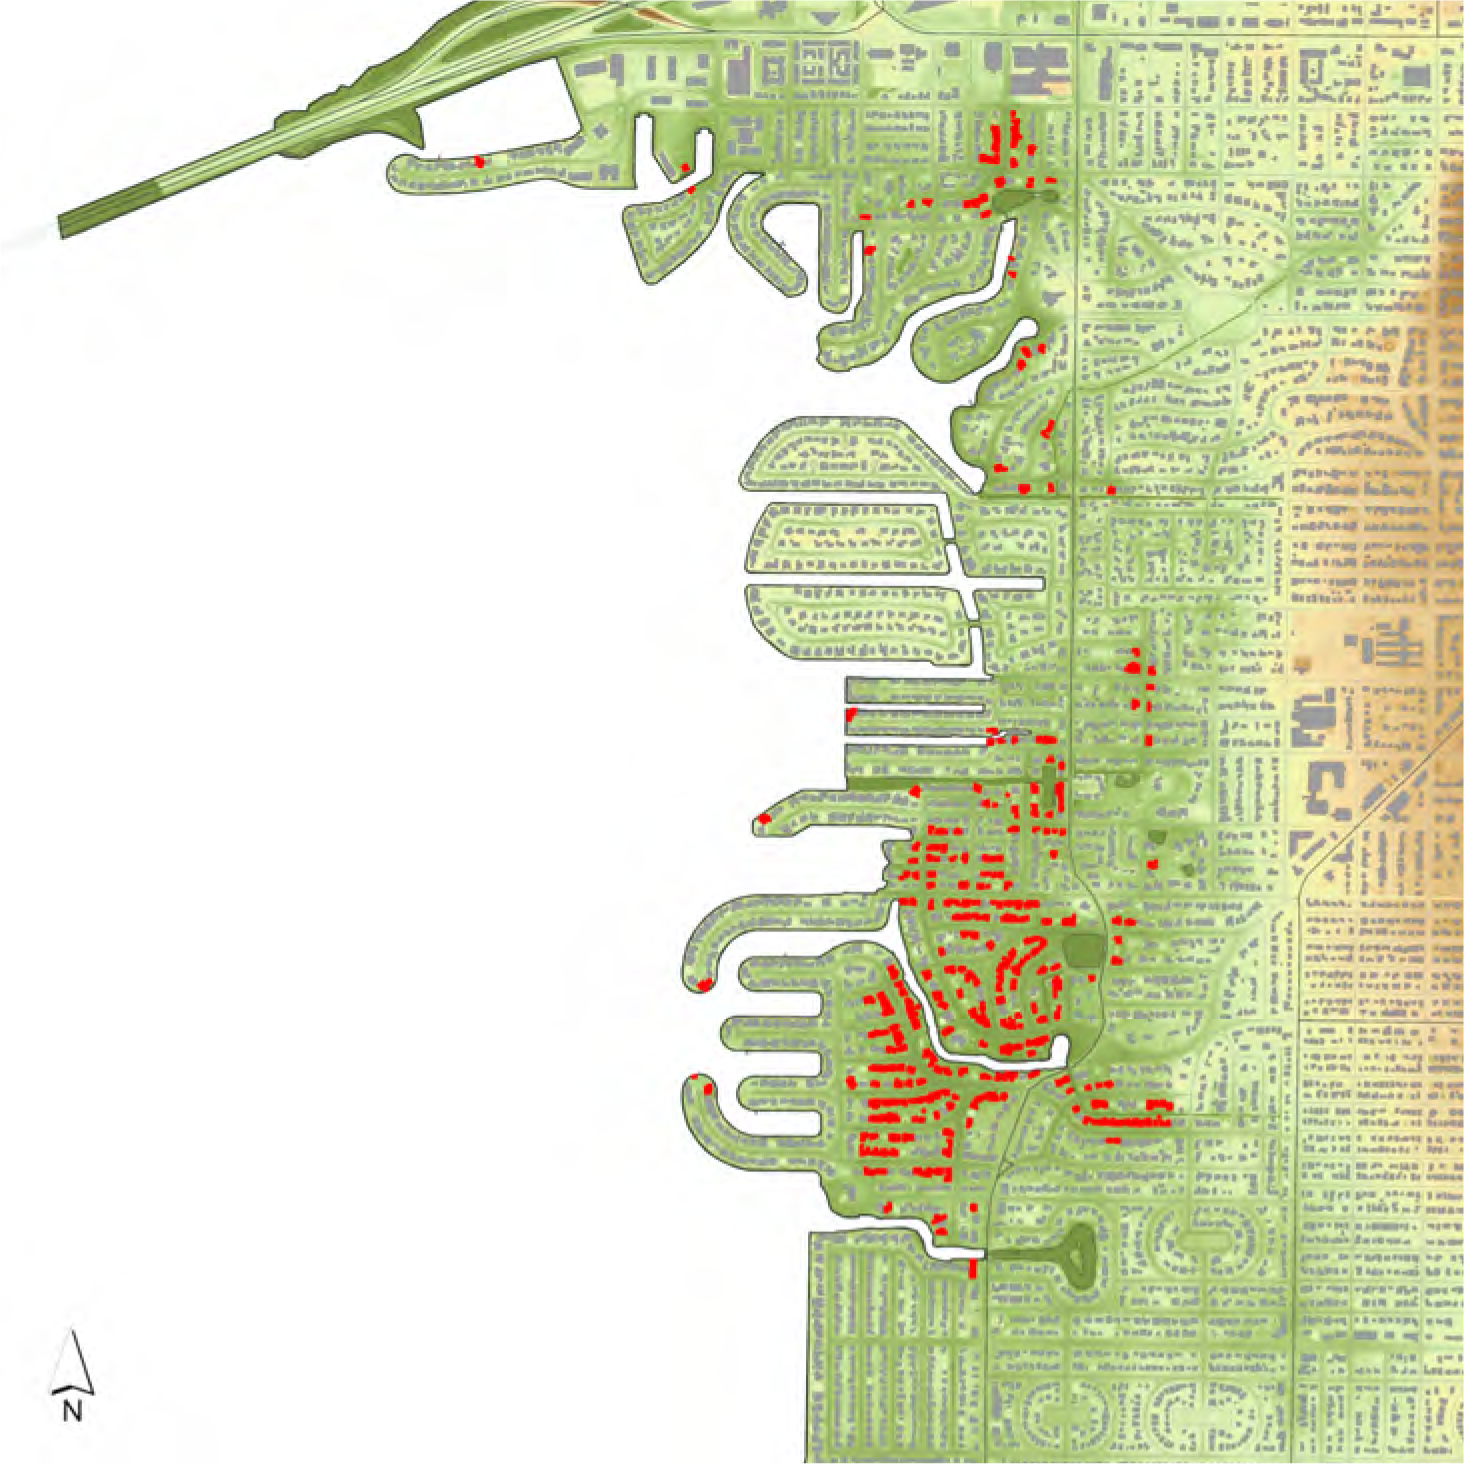
GOVERNMENT FACILITIES
This category of assets consists of five different classes: city-owned properties, city-owned community centers, state government facilities, correctional facilities, and military installations. Generally, these facilities are distributed evenly throughout the city. However, there is a noticeable void of community centers in the South Tampa / Westshore area of the peninsula, something that could potentially coincide with future opportunities to provide additional emergency management support. The University of South Florida is home to a group of state-owned facilities.
As was described for all structures within the city, the exact finished floor elevations for each government facility – the height where water can enter – needs further review. This study identifies locations and depths of ground flooding as a point of departure for further evaluation.
Detailed evaluations of storm surge flooding have recently been completed for Port Tampa Bay and the Howard F. Curren Wastewater Treatment Plant (Applied Sciences, 2024; and Applied Sciences, 2022).
CITY-OWNED PROPERTIES
The city owns a wide variety of properties, including City Hall, the Tampa Theatre, the Tampa Museum of Art, Solid Waste facilities, a bomb squad building, street sweeper housing, comfort stations, community centers, and administration buildings. Each has unique characteristics in terms of sensitivity and consequence if impacted. These facilities are distributed throughout the city with concentrations downtown, in a corridor along I-275 west of downtown, and north from downtown generally following the Hillsborough River. Facilities managed by Parks and Recreation (Community Recreation Centers) and Mobility (Parking Lots) are separate from the following list of findings.
FINDINGS
Sea Level Rise
Within this category of properties, there are no structures within the 2070 intermediate-high floodplain. The lowest structures are:
- The Davis Island Park Restrooms, at elevation 6.26 feet NAVD88
- The Joe Abrams Fitness and Wellness Center at 7.35 feet
- The Marjorie Park Dockmaster Buildings at 8.11 feet
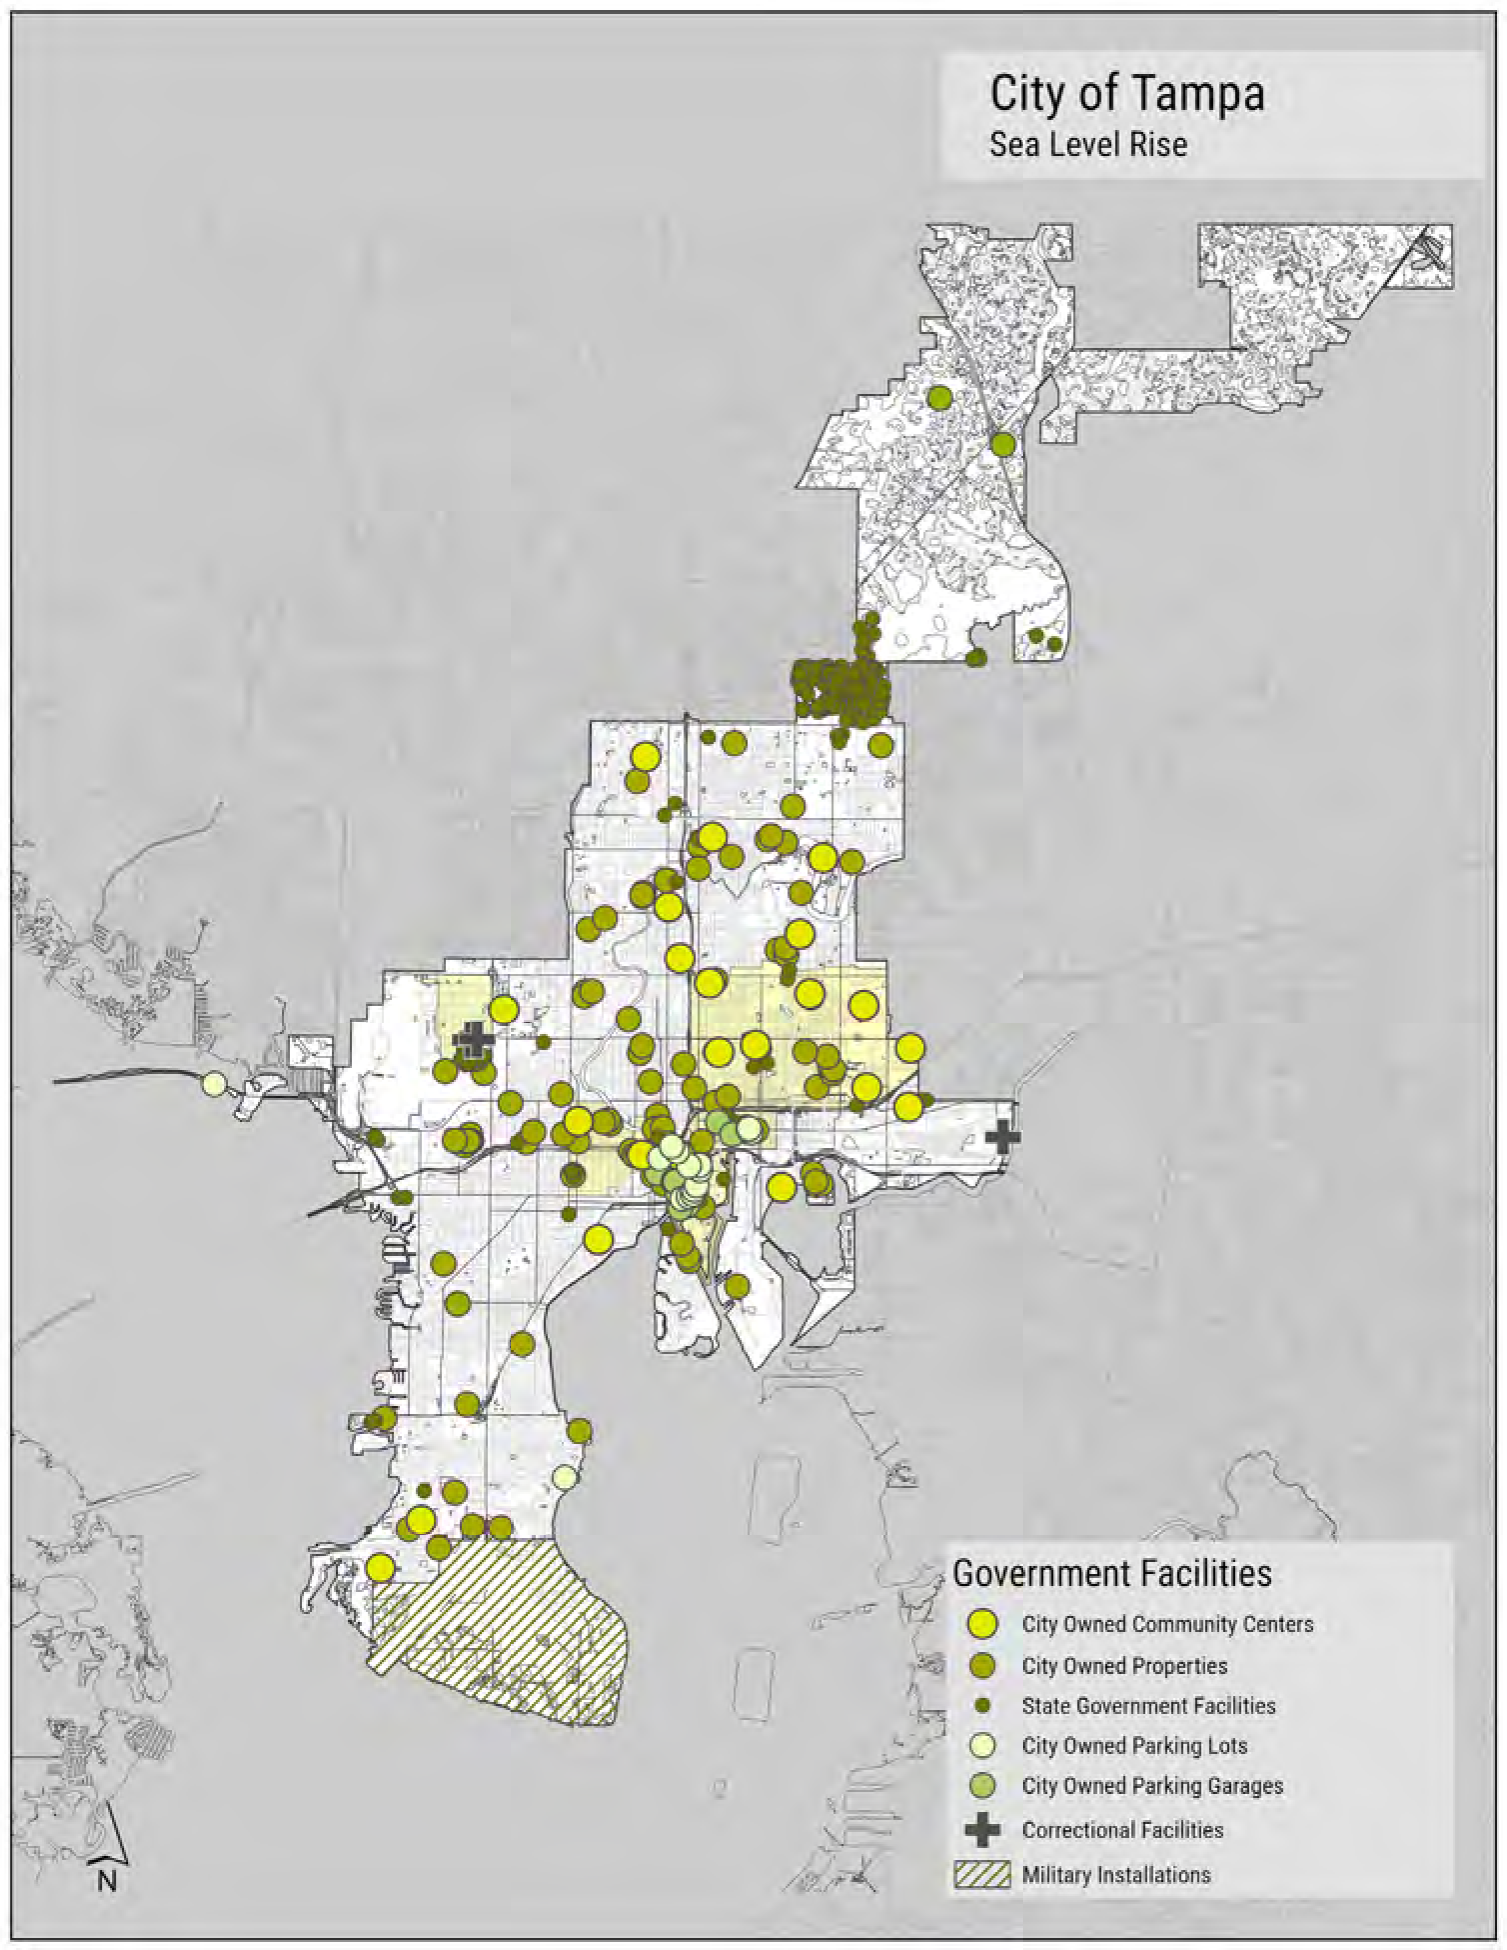
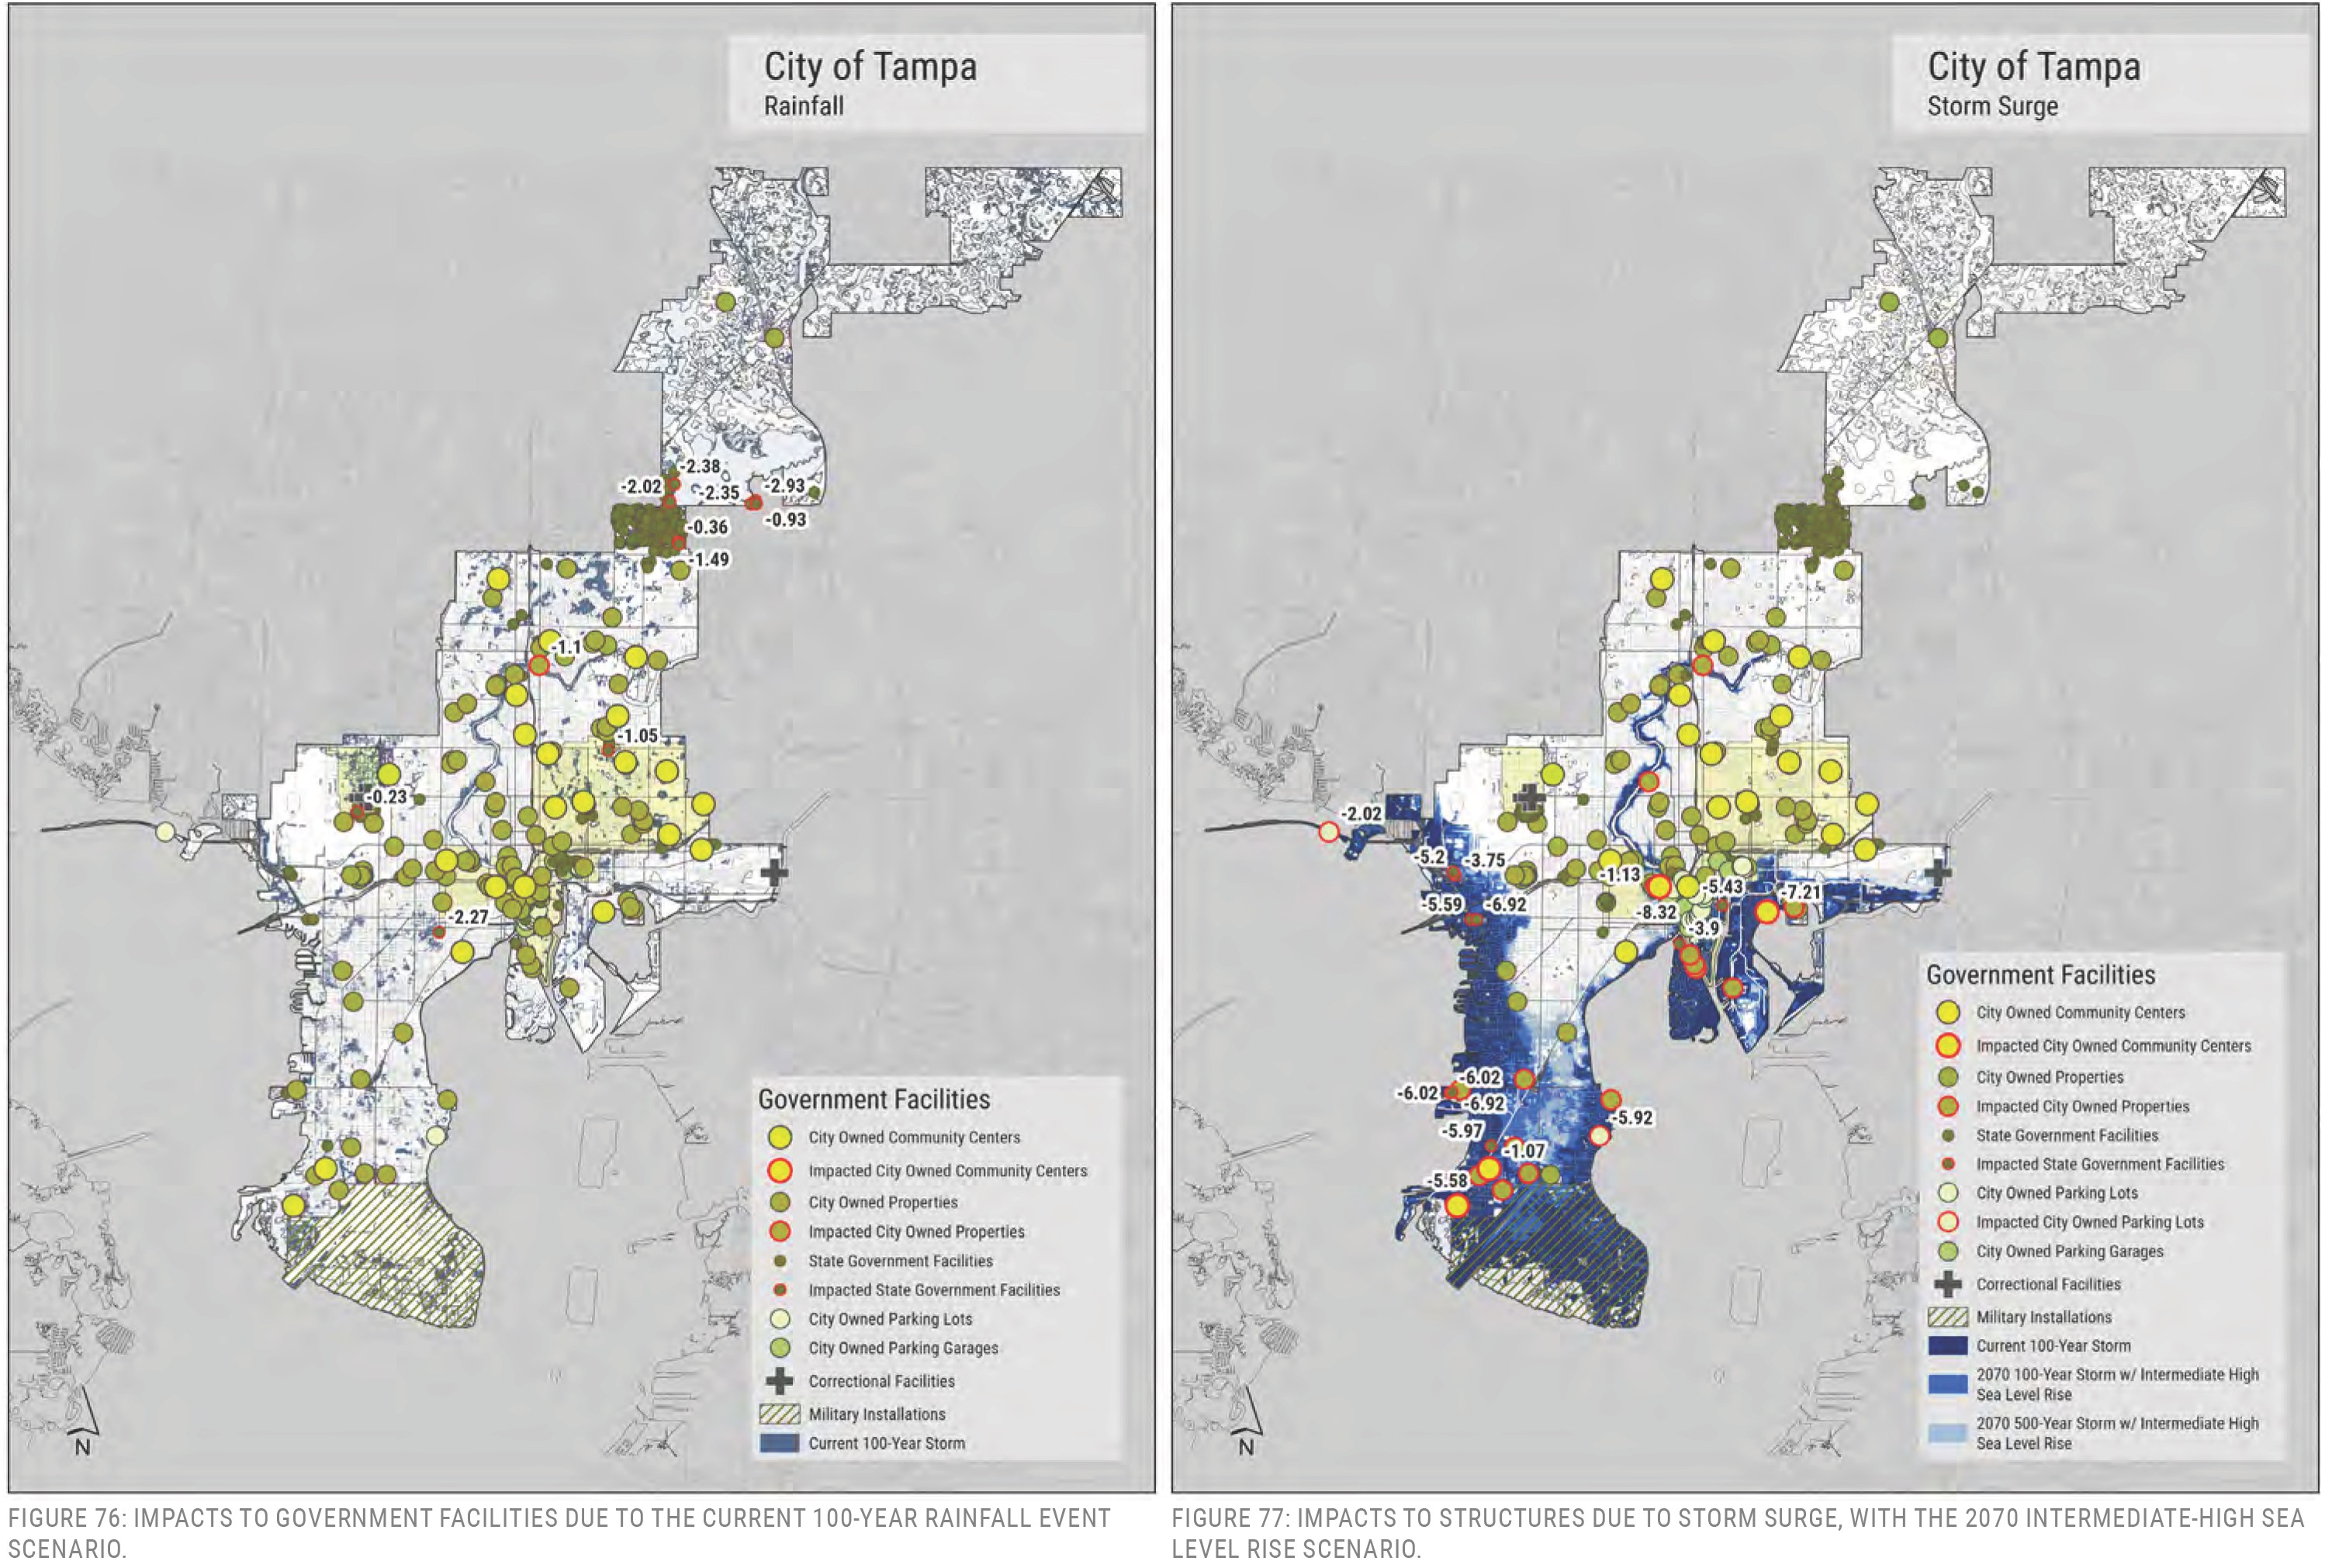
FIGURE 76: IMPACTS TO GOVERNMENT FACILITIES DUE TO THE CURRENT 100-YEAR RAINFALL EVENT SCENARIO.
FIGURE 77: IMPACTS TO STRUCTURES DUE TO STORM SURGE, WITH THE 2070 INTERMEDIATE-HIGH SEA LEVEL RISE SCENARIO.
Rainfall
In a 100-year rainfall event, the only property within this data set that would be affected is:
- The Sulphur Springs Aquatics Maintenance Building
Storm Surge
For storm surge, with the 2070 intermediate high scenario, the list includes (those with an asterisk are not impacted by the current 100-year storm surge scenario):
- Davis Island Park Restroom
- Joe Abrams Fitness & Wellness Center
- Marjorie Park Dockmaster Buildings
- Sulphur Springs Aquatics Maintenance Building
- Keep Tampa Bay Beautiful, Inc. (Leased)
- Sweeper Facility
- Spanish American War Band Stand
- *TPD K-9 Training Modular
- *Solid Waste Brush Site Office
- *Foster Comfort and Storage
- *Marcum Substation
- *Sandra W. Freedman Tennis Complex
- *Salty Sol (Gandy Boat Ramp) Restroom
- *Bobby Hicks Grandstand and Filter Building
COMMUNITY CENTERS
Community recreation centers are gathering places that often host activities, sports, childcare and other community services. They can be an important resource and a place of familiarity, especially during hazardous events. Some community centers act as hubs where sandbags or other materials may be distributed, or where elections may take place.
FINDINGS
Sea Level Rise
No community centers in Tampa will be impacted by sea level rise by 2070, however the area around the Southwest Port Tampa Community Center may experience annual high tide flooding by the year 2070. There was interest from department personnel to pursue potential renovations for this facility, possibly with the incorporation of additional building resilience or community emergency support tools.
Rainfall
No centers were within rainfall floodplains either. However, the Hunt Park Community Center, Ragan Park Community Center, and Williams Park Community Centers were in close proximity to where the current 100-year storm may cause flooding.
Storm Surge
For storm surge, with the 2070 intermediate high scenario, a few recreation centers are within the expected floodplain (those with an asterisk are not impacted by the current 100-year storm surge scenario):
- The facility at Julian B. Lane Park is within the current storm surge floodplain, but it’s primary building entry is at 16.3 feet NAVD88. The base flood elevation in that location is 11 feet.
- The Port Tampa Community Center (the finished floor elevation is unknown).
- The Southwest Port Tampa Community Center (the finished floor elevation is unknown).
- The DeSoto Park Community Center (the finished floor elevation is unknown).
During the analysis the following community centers were noted by the project team as candidates for providing future post-disaster programming, potentially with assistance through resilience grant-funding programs. These facilities are close to the South Tampa peninsula but are outside of evacuations zones A-D (they are both in evacuation zone E). South and West Tampa do not have nearby evacuation shelters.
- David Barksdale Center @ MacFarland Park
- Hunt Park Community Center @ Al Lopez Park
CITY OWNED PARKING
The city of Tampa owns a number of parking lots and garages. The majority of them are located downtown.
FINDINGS
Sea Level Rise
There is only one facility that is susceptible to future sea level rise scenarios:
- Ben T. Davis Beach and the Ben T. Davis Boat Ramp Parking Lot
Storm Surge
- Parking lots at boat ramps and marinas, such as the Bayshore Marina, Davis Islands Boat Ramp, Gandy Boat Ramp, Lowry Park Boat Ramp, and at Picnic Island
CORRECTIONAL FACILITIES
FINDINGS
There are no correctional facilities impacted by flood scenarios within the City of Tampa.
STATE GOVERNMENT FACILITIES
FINDINGS
Sea Level Rise
No state government facilities would be impacted by sea level rise.
Rainfall
The 100-year rainfall scenario would affect:
- The Tampa district office for the Department of Education
- Various insignificant structures at the University of South Florida, including:
- Golf course shelter b (8th tee)
- Golf course shelter c (12th tee)
- A picnic pavilion at riverfront park
- A shed at Riverfront Park
- Canoe storage at Riverfront Park
- Softball complex pavilion north
- Softball complex batting building
- The district administration center at Hillsborough Community College
- The Tampa Wholesale Produce Market on Hillsborough Avenue
Storm Surge
For storm surge, with the 2070 intermediate high scenario, the list includes (in order of lowest to highest - those with an asterisk are not impacted by the current 100-year storm surge scenario):
Note: Addresses were not included in the data.
- A Storage Shed at the Fish and Wildlife Conservation Commission
- General Services Administration Building for the Department Of Education
- A carport at the Fish and Wildlife Conservation Commission
- A Workshop And Carport at the Fish And Wildlife Conservation Commission
- 4704-B Montgomery Ave., owned by the Department Of Health
- 5100 W Kennedy Blvd Building, owned by the Department Of Economic Opportunity
- Tampa Port Authority - Joseph Garcia International Center
- Concourse Center 4, owned by the Department Of Legal Affairs
- South Tampa Center Advanced Health Care Facility, owned by the University Of South Florida
- Concourse Center LII Office Building, owned by the Auditor General
- *WEDU TV Facility, owned by the Department Of Education
MILITARY INSTALLATIONS
FINDINGS
The MacDill Air Force Base is the only military installation in Tampa city limits. This facility is impacted by sea level rise, rainfall, and storm surge. It has recently conducted an independent vulnerability assessment.
A few recreation facilities were evaluated in closer detail.
Kwane Doster Community Center
7506 S Morton St
Vulnerabilities:
- Potential Sea Level Rise
- Storm Surge
Location
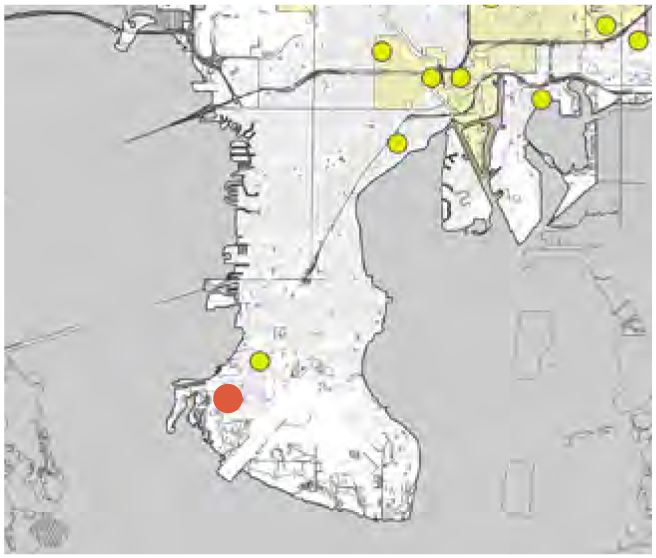
Sea Level Rise (2040 and 2070 IH)
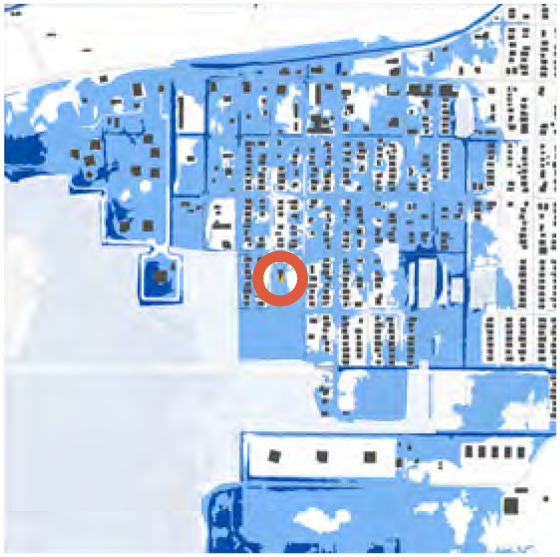
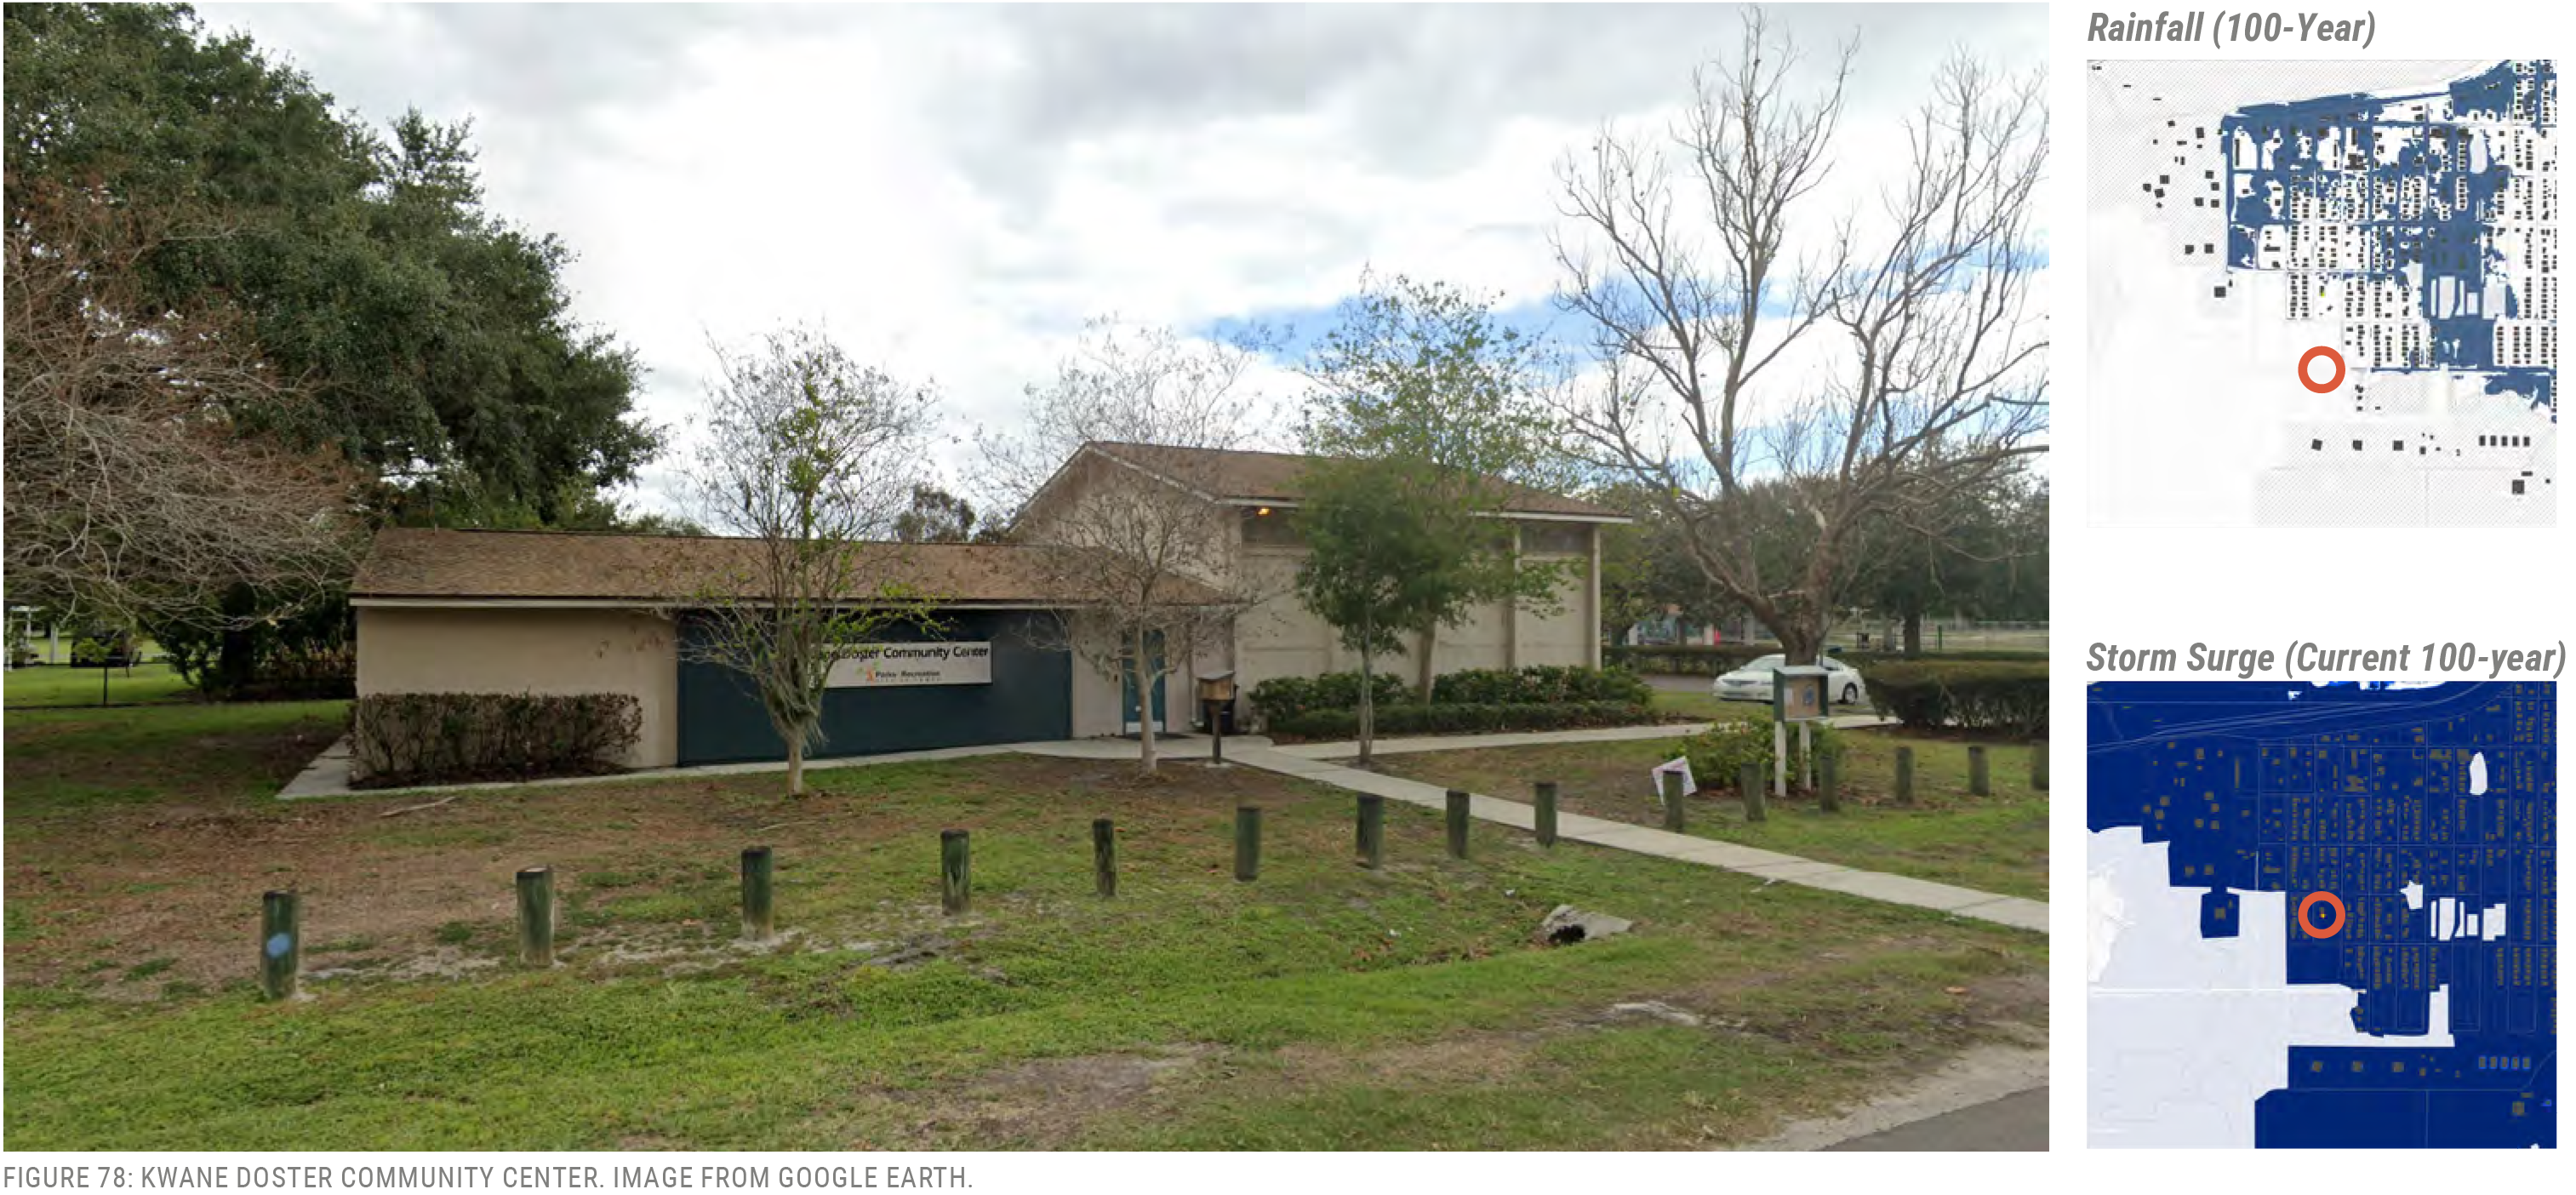
Port Tampa Community Center
4700 W Lancaster St
Vulnerabilities:
- Storm Surge
- Sea Level Rise (2040 and 2070 IH)
- Rainfall (100-Year)
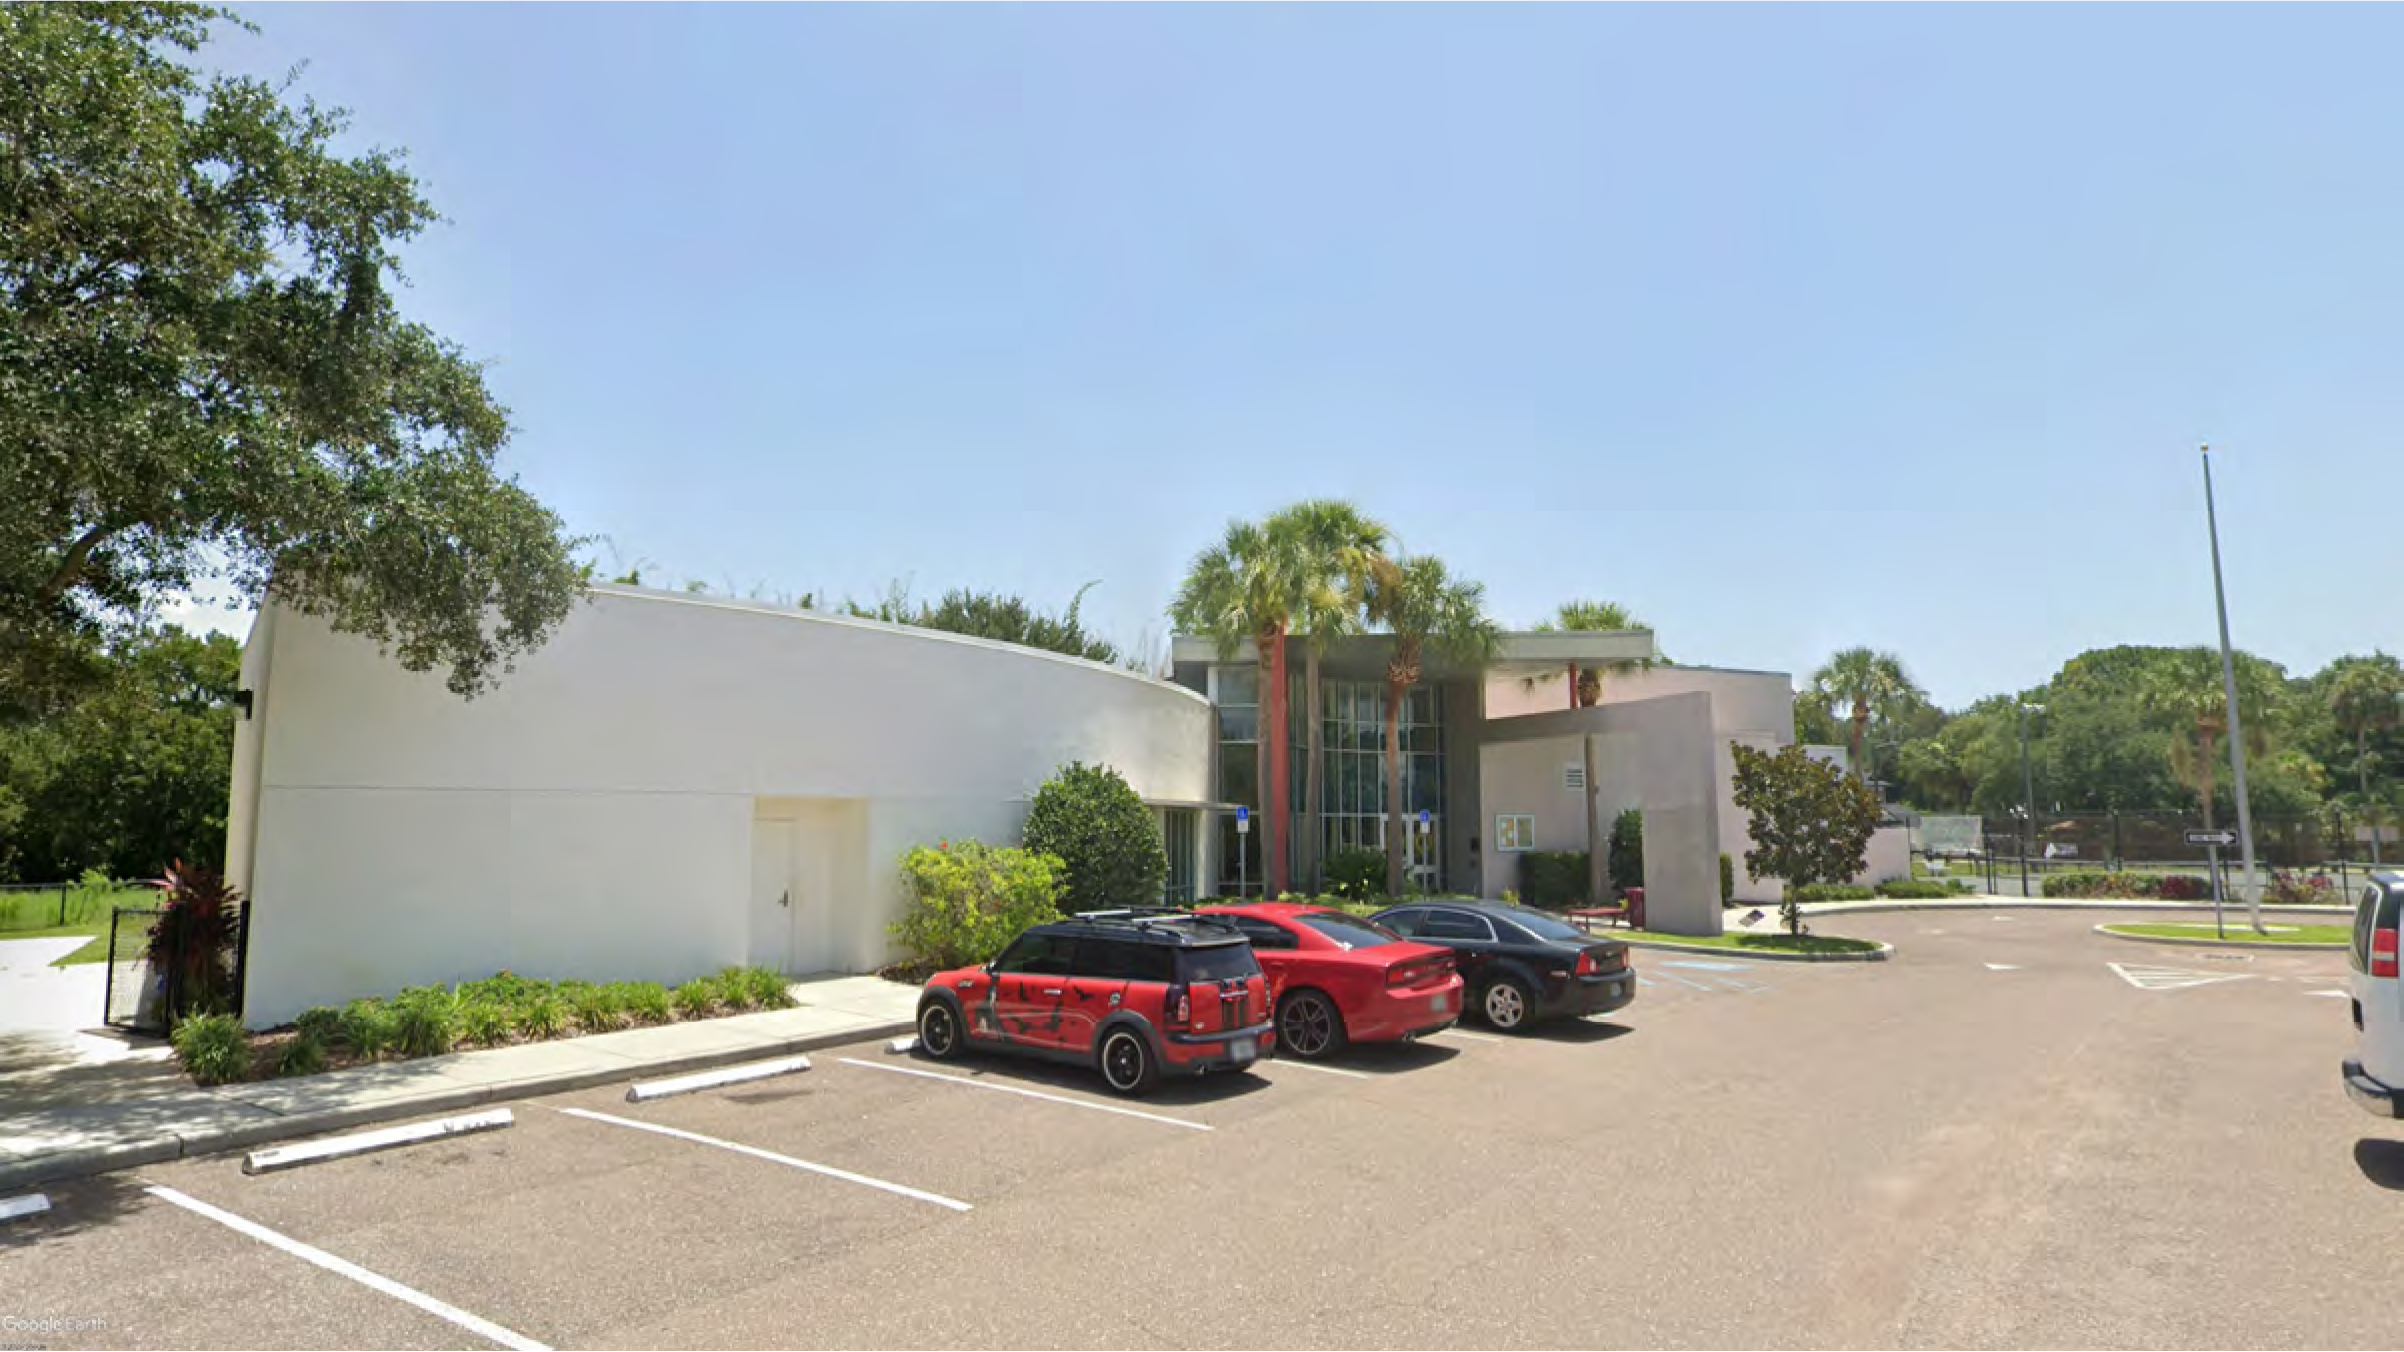
Hazard Visualizations
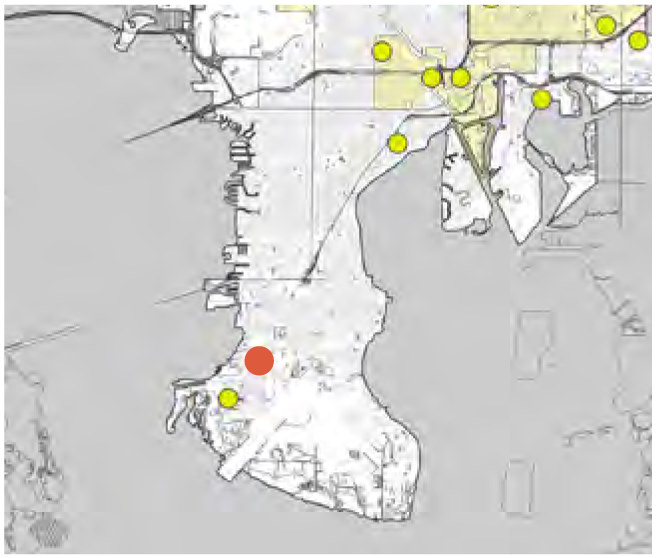
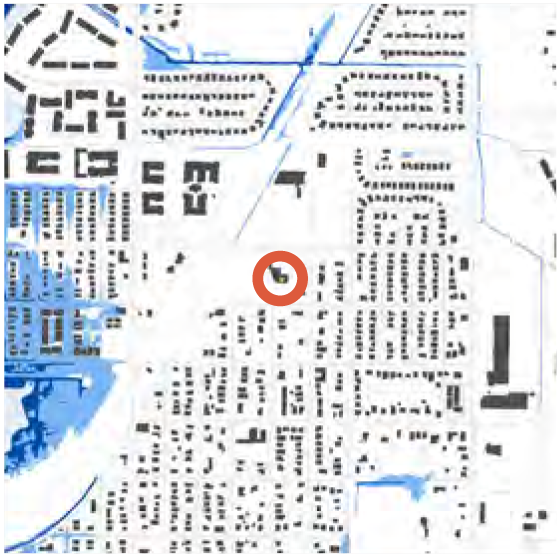
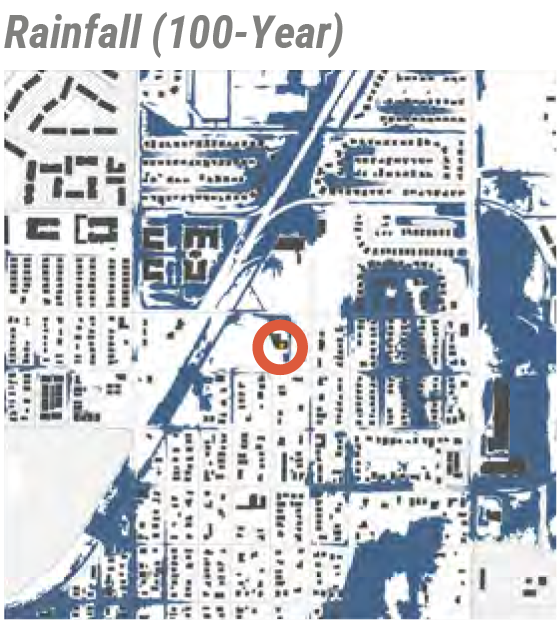
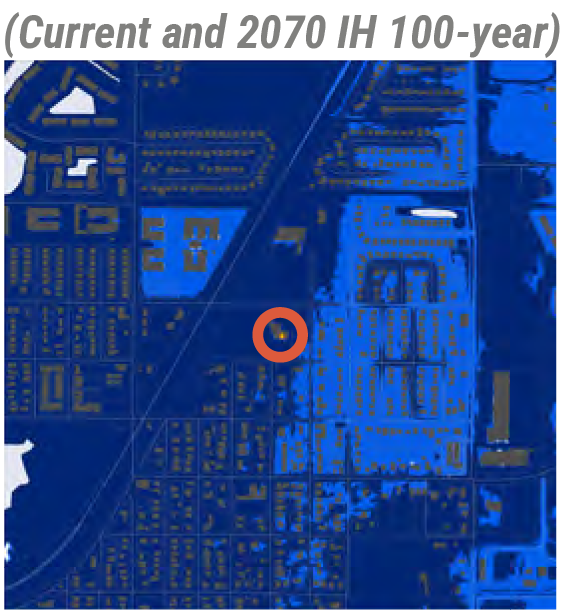
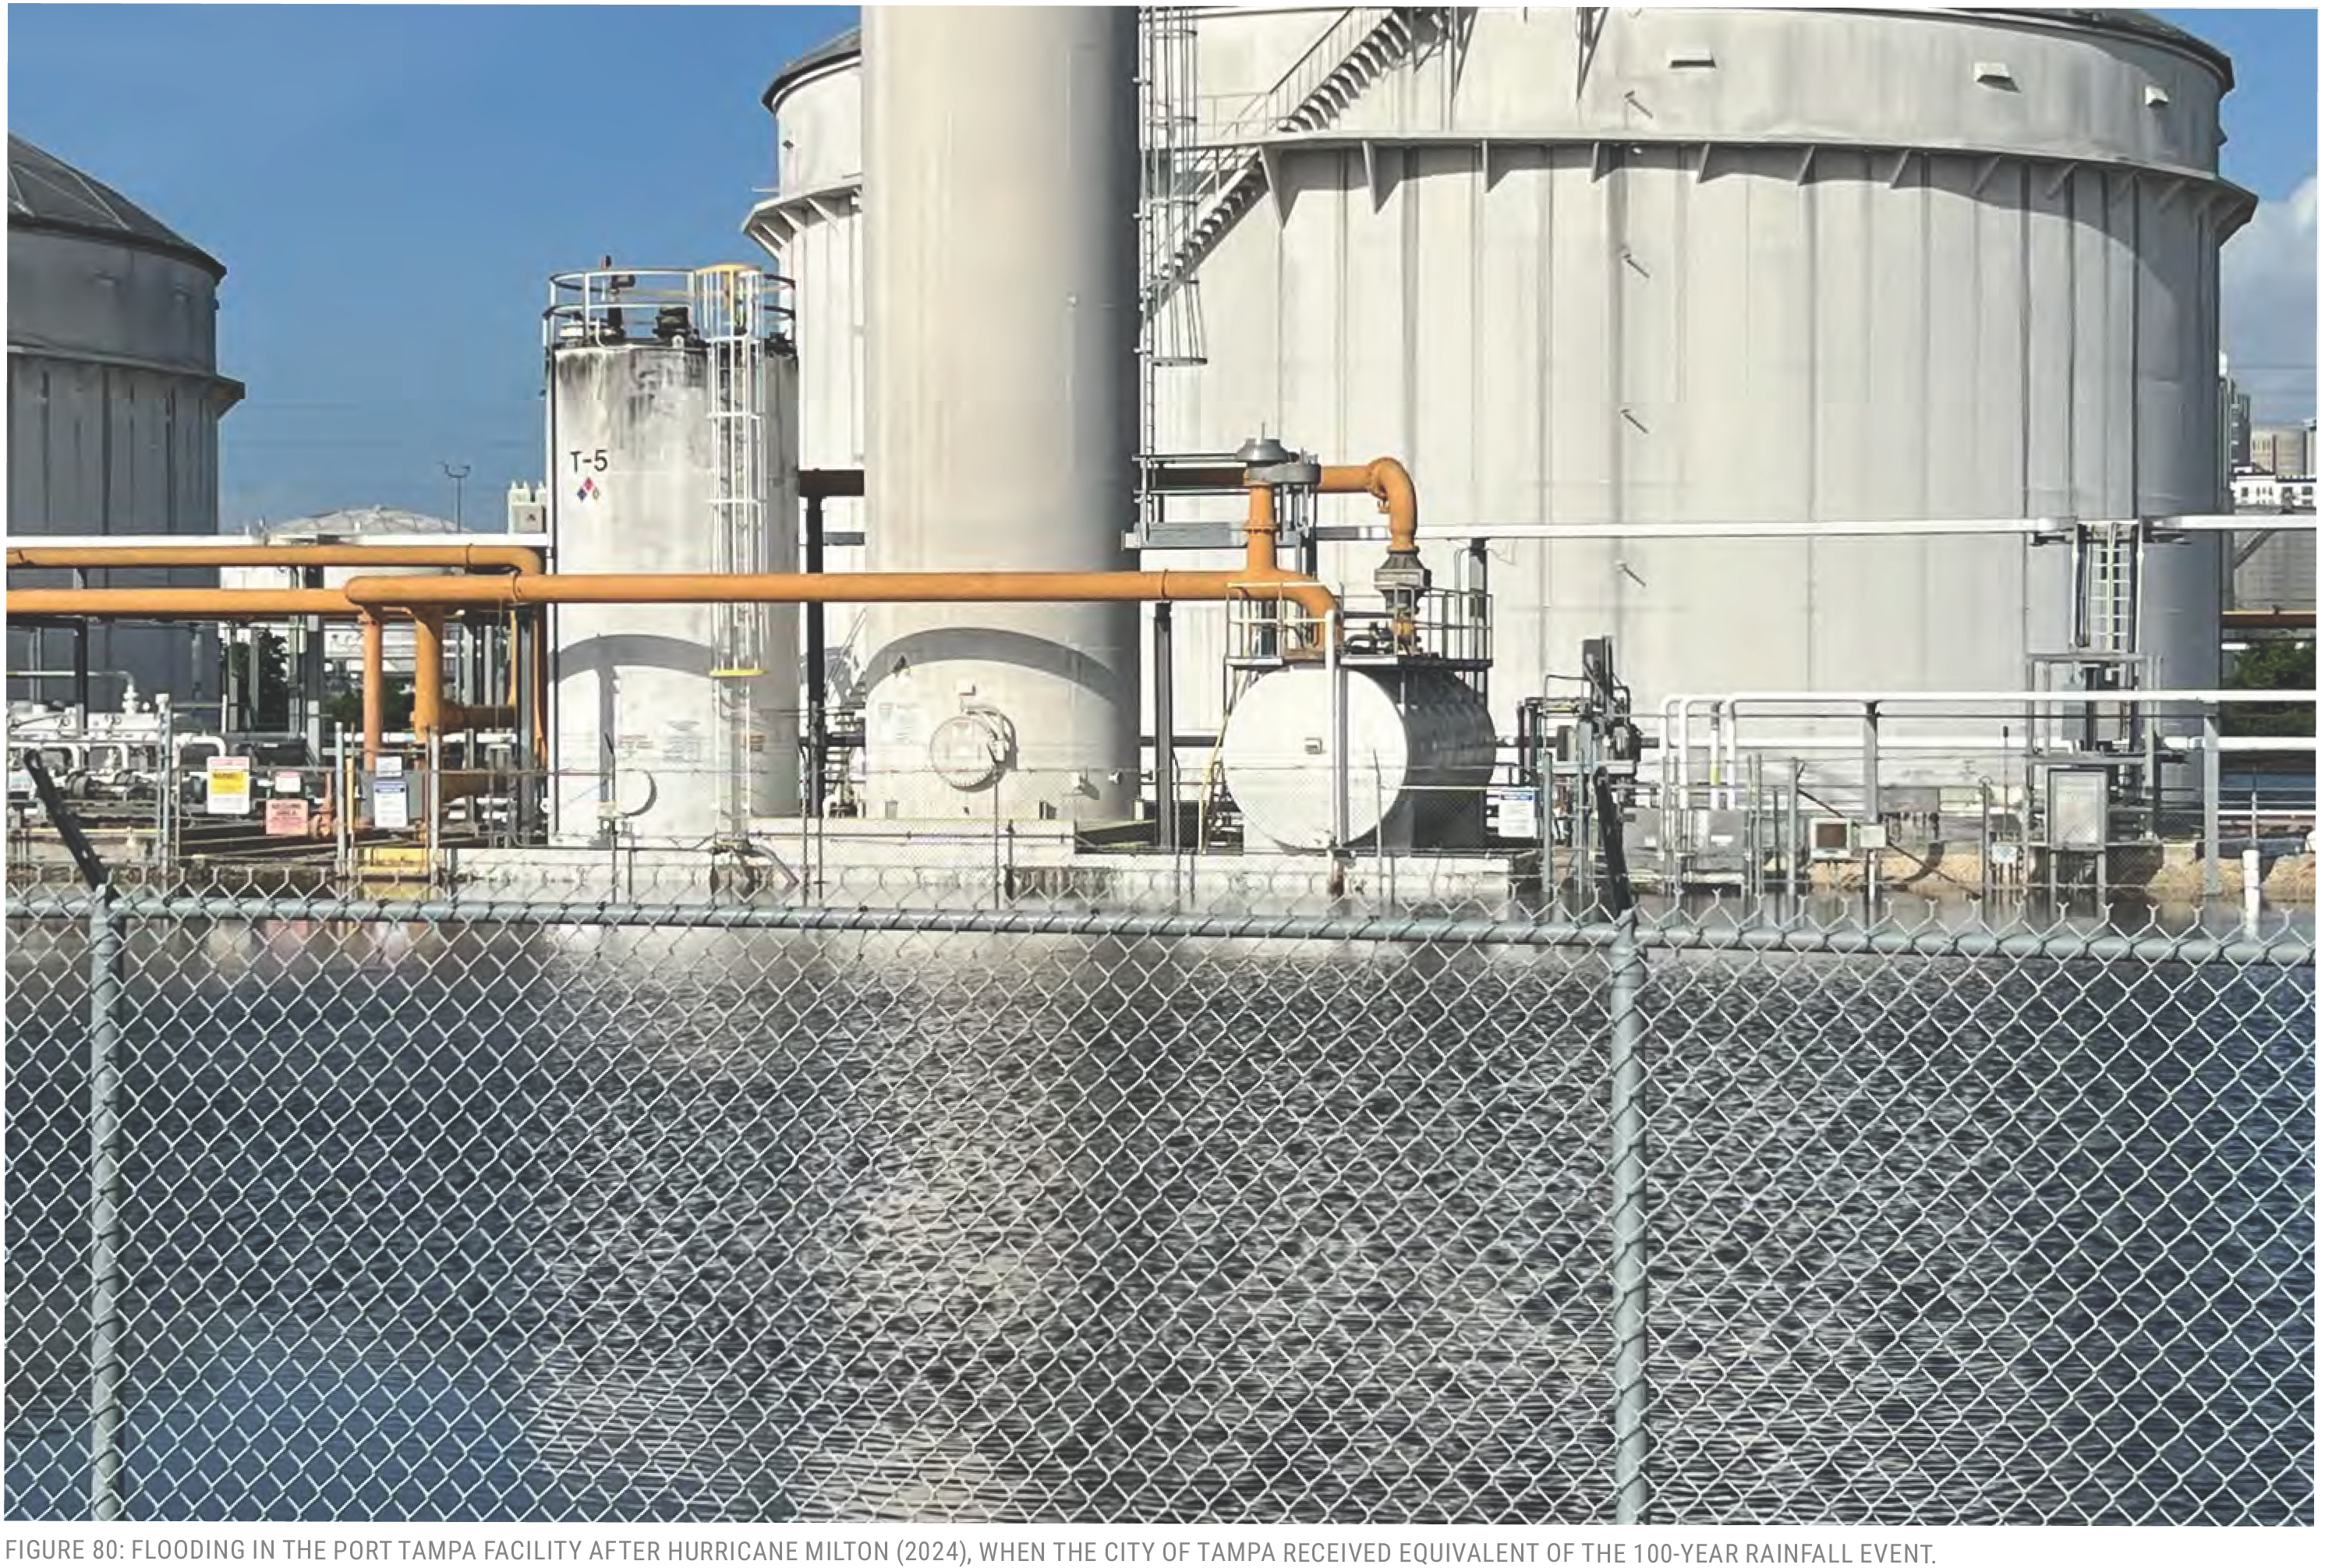
COASTAL PUBLIC AMENITIES
Tampa’s municipal assets include multiple locations that facilitate connection between the community and its waterfront. This includes: piers, beaches, boat ramps and docks, and marinas. These sites will inherently be affected by sea level rise and storm surge. Structural elements can be negatively impacted by higher water elevations, which can also cause increased erosion at the beaches. The consequences of sea level rise impacts are also cultural. Damage to the coastal public amenities, for example the recent erosion at Ben T. Davis Beach during Hurricane Debby, can diminish opportunities to engage with the water or to enjoy the coastal edge.
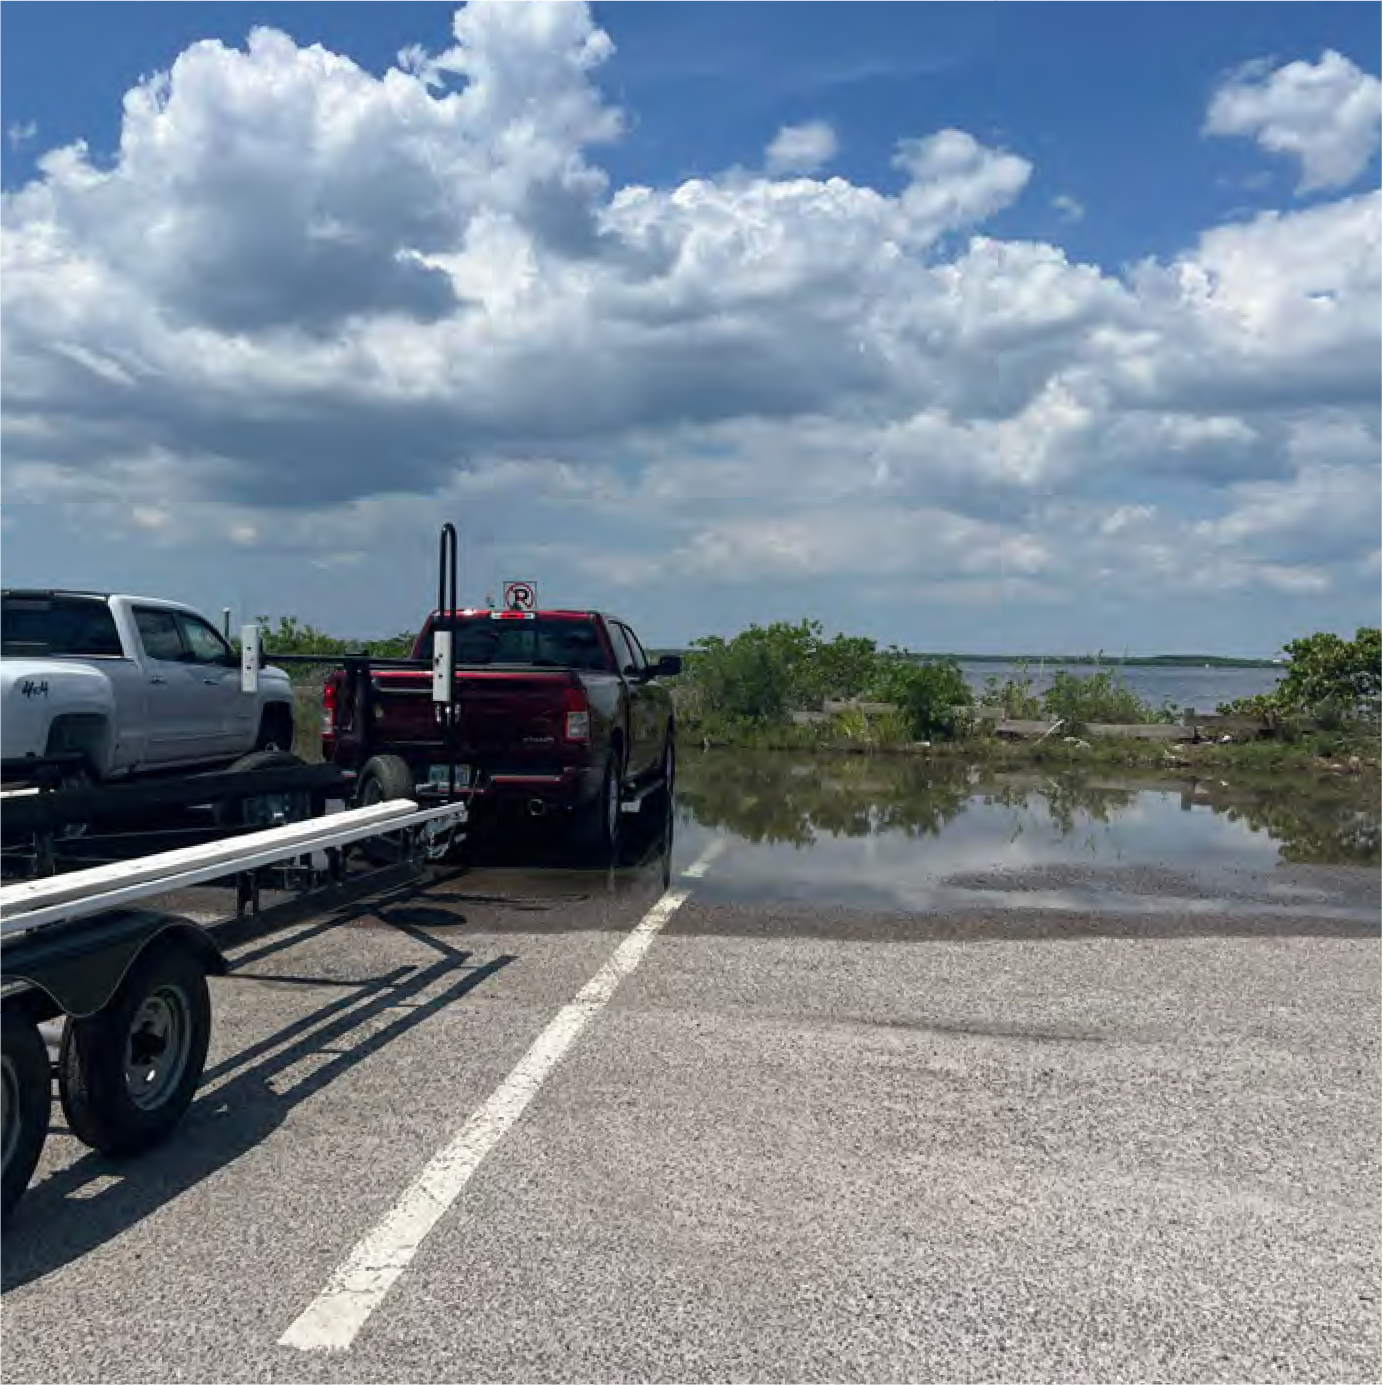
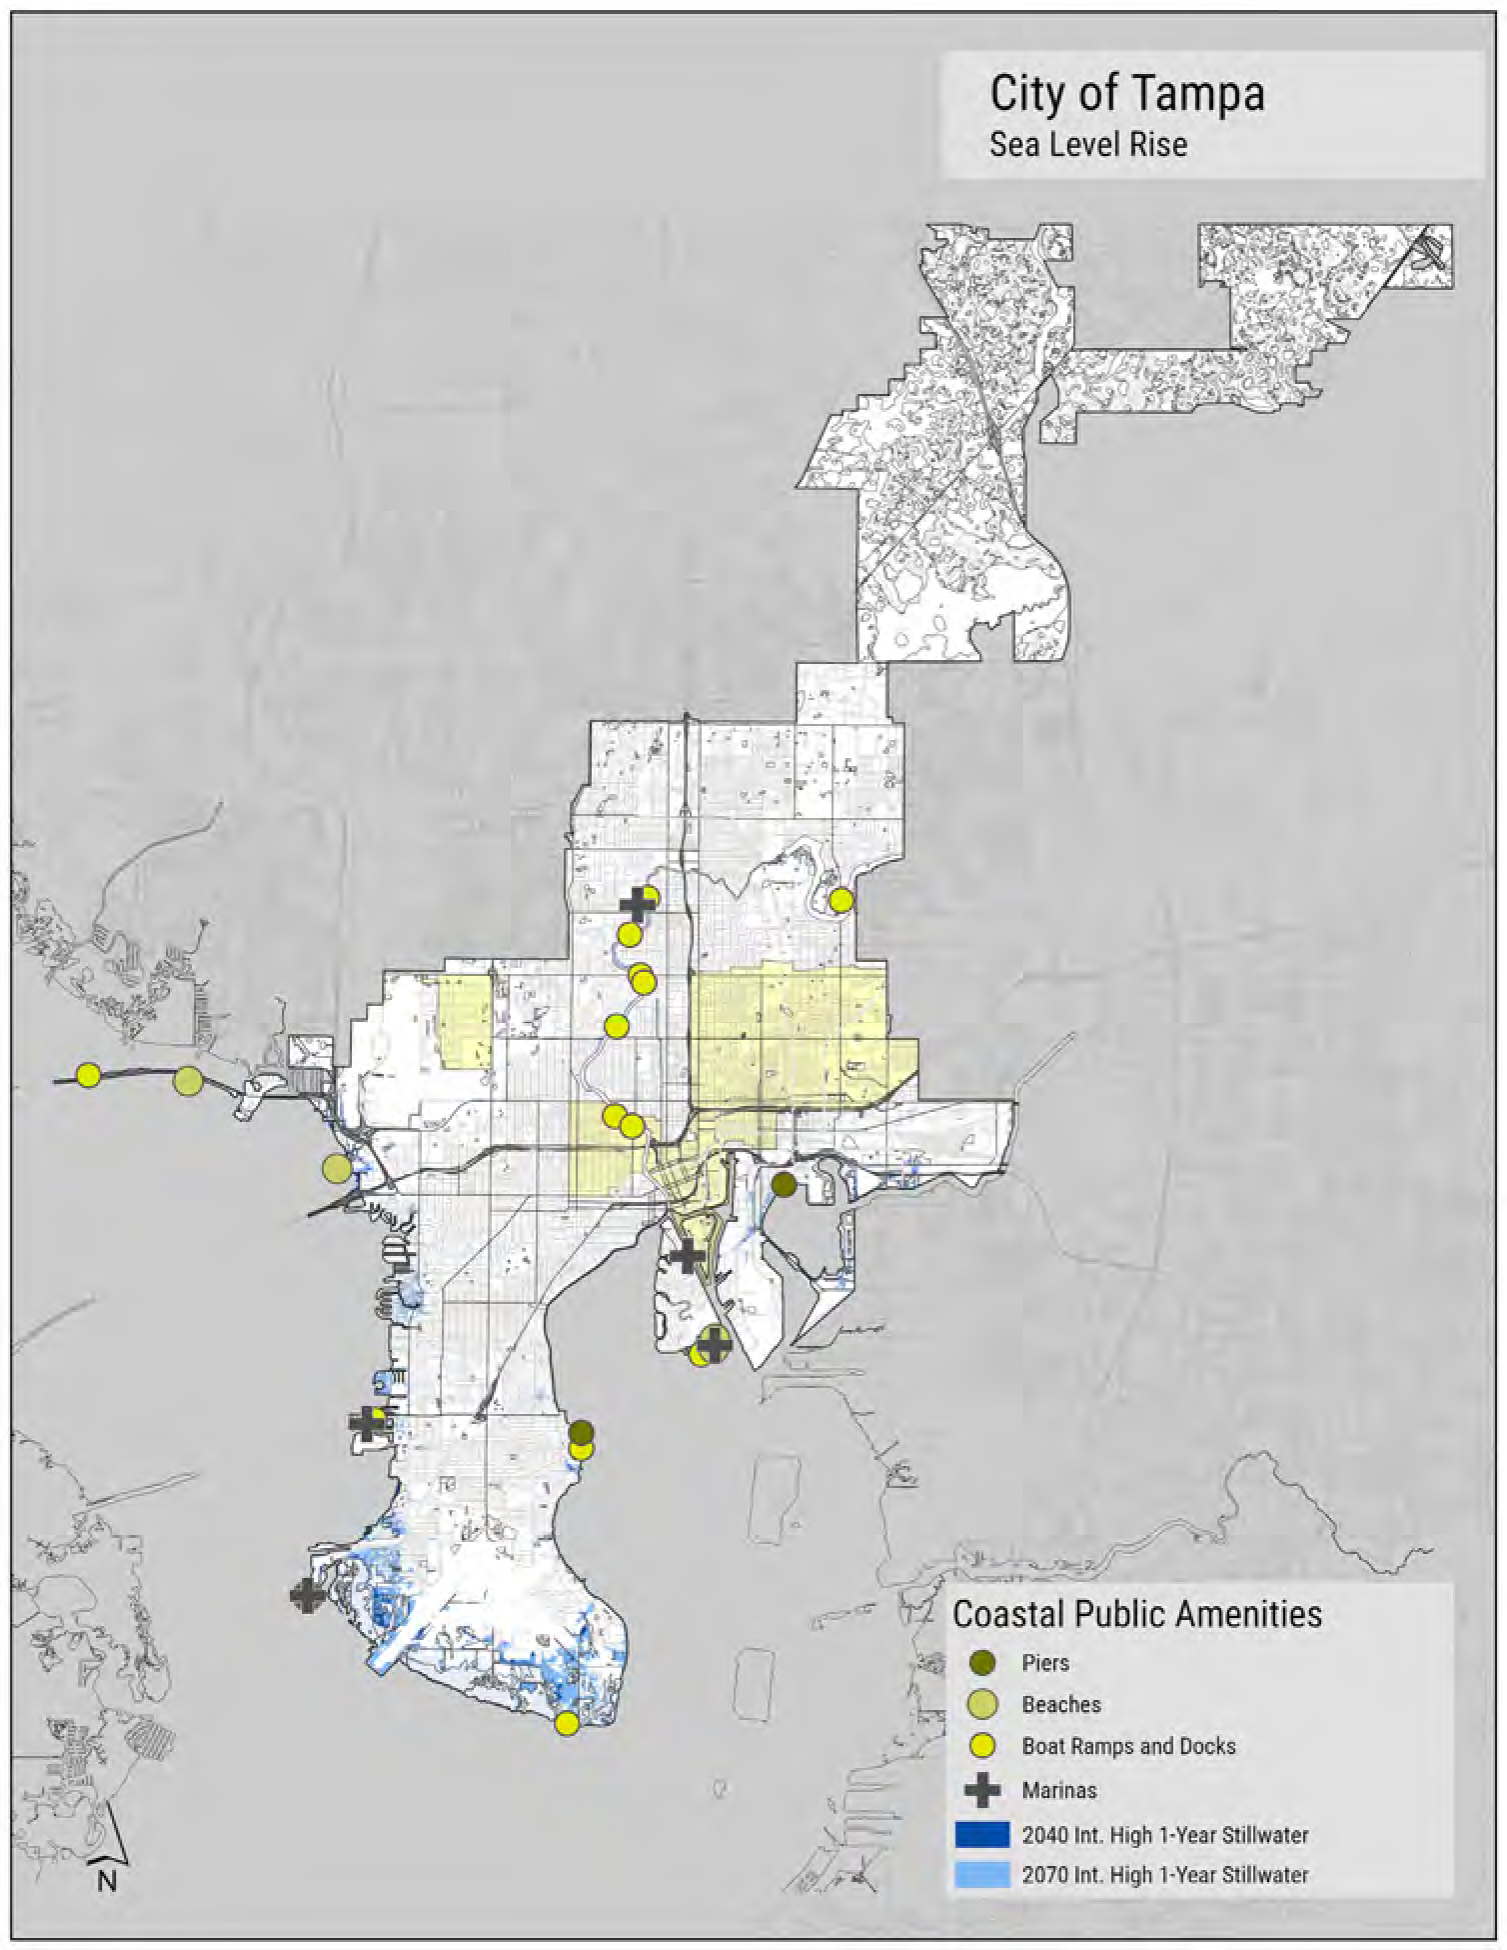
MARINAS, DOCKS, AND BOAT RAMPS
These coastal facilities can be found along the Hillsborough River and adjacent to the bay. Florida led the nation in most registered pleasure boats, surpassing one million in 2022 (Krietz, 2022). Hillsborough County has the fifth highest within Florida with more than 40,000 boats registered. Ramps, docs, and marinas are important for keeping or launching those boats and for fulfilling the cultural and recreational needs of Tampa residents. Most of these facilities have floating docks with connections to the land.
FINDINGS
Sea Level Rise and Storm Surge
Increase in sea level elevation can create problems for coastal structures if not accounted for.
Ramps include:
- Picnic Island Park
- Gandy Park South
- Lowry Park
- Ben T. Davis Beach
Marinas include:
- Marjorie Park Yacht Basin
- Davis Islands Seaplane Basin
PIERS
Pier structures provide equitable pedestrian access over coastal waters. They can be used for fishing or passive enjoyment. The pier in Ballast Point is raised on a post structure and at DeSoto Park the pier is a solid land mass held in by seawalls.
FINDINGS
Increased sea levels could potentially impact the structure if overtopped. The structural integrity of each of these facilities is unknown.
BEACHES
The City of Tampa has five designated beaches. These locations provide individual or family gathering spots for passive recreation. They include:
- Ben T. Davis Beach
- Rocky Point Park
- Upper Picnic Island Beach
- Davis Islands Beach
- Davis Islands Dog Beach
FINDINGS
Higher water levels can cause erosion and can impact beach infrastructure such as shade structures, play equipment and benches. This recently occurred from storm surge associated with Hurricane Debby (2024) at Ben T. Davis Beach. Sand loss and higher water elevations can also reduce the amount of beach space, resulting in the loss of a cultural amenity.
BEN T. DAVIS BEACH
Recent storms, such as Hurricanes Debby and Helene brought higher tides and storm surge to the Tampa Coastline. This impacted many of the marinas, piers, docks and boat ramps, along with coastal facilities such as the beach at Ben T. Davis Park. High tides during Hurricane Debby severely eroded an already atrophied sand bank along the beach, which protects the Courtney Campbell Causeway highway.
After identifying Ben T. Davis Beach as a risk-prone area, an additional study was completed to determine the cultural value and best next steps for reducing the area's vulnerabilities.
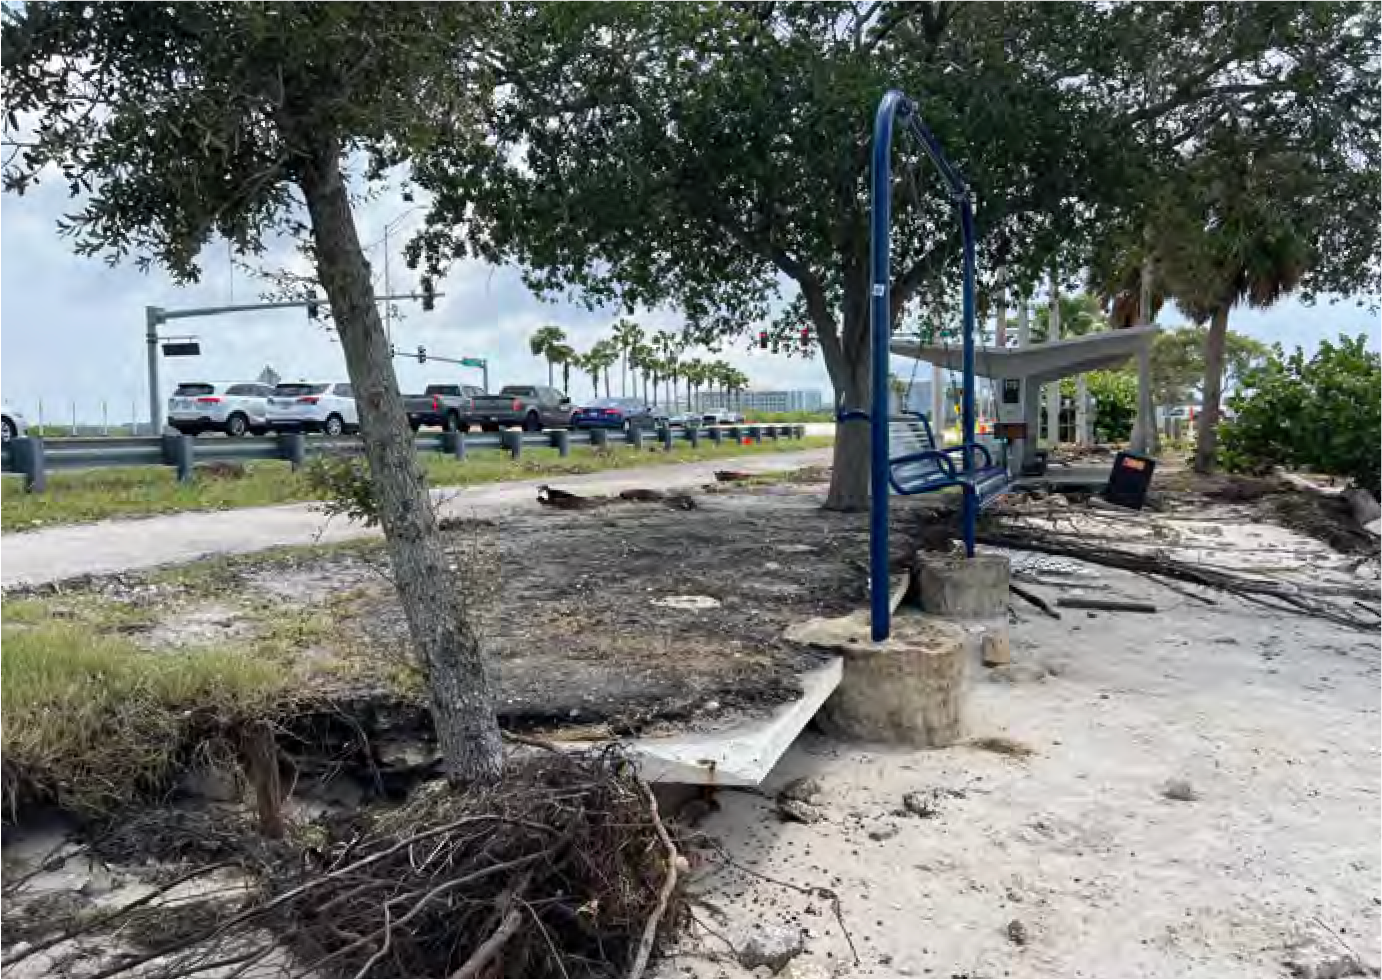
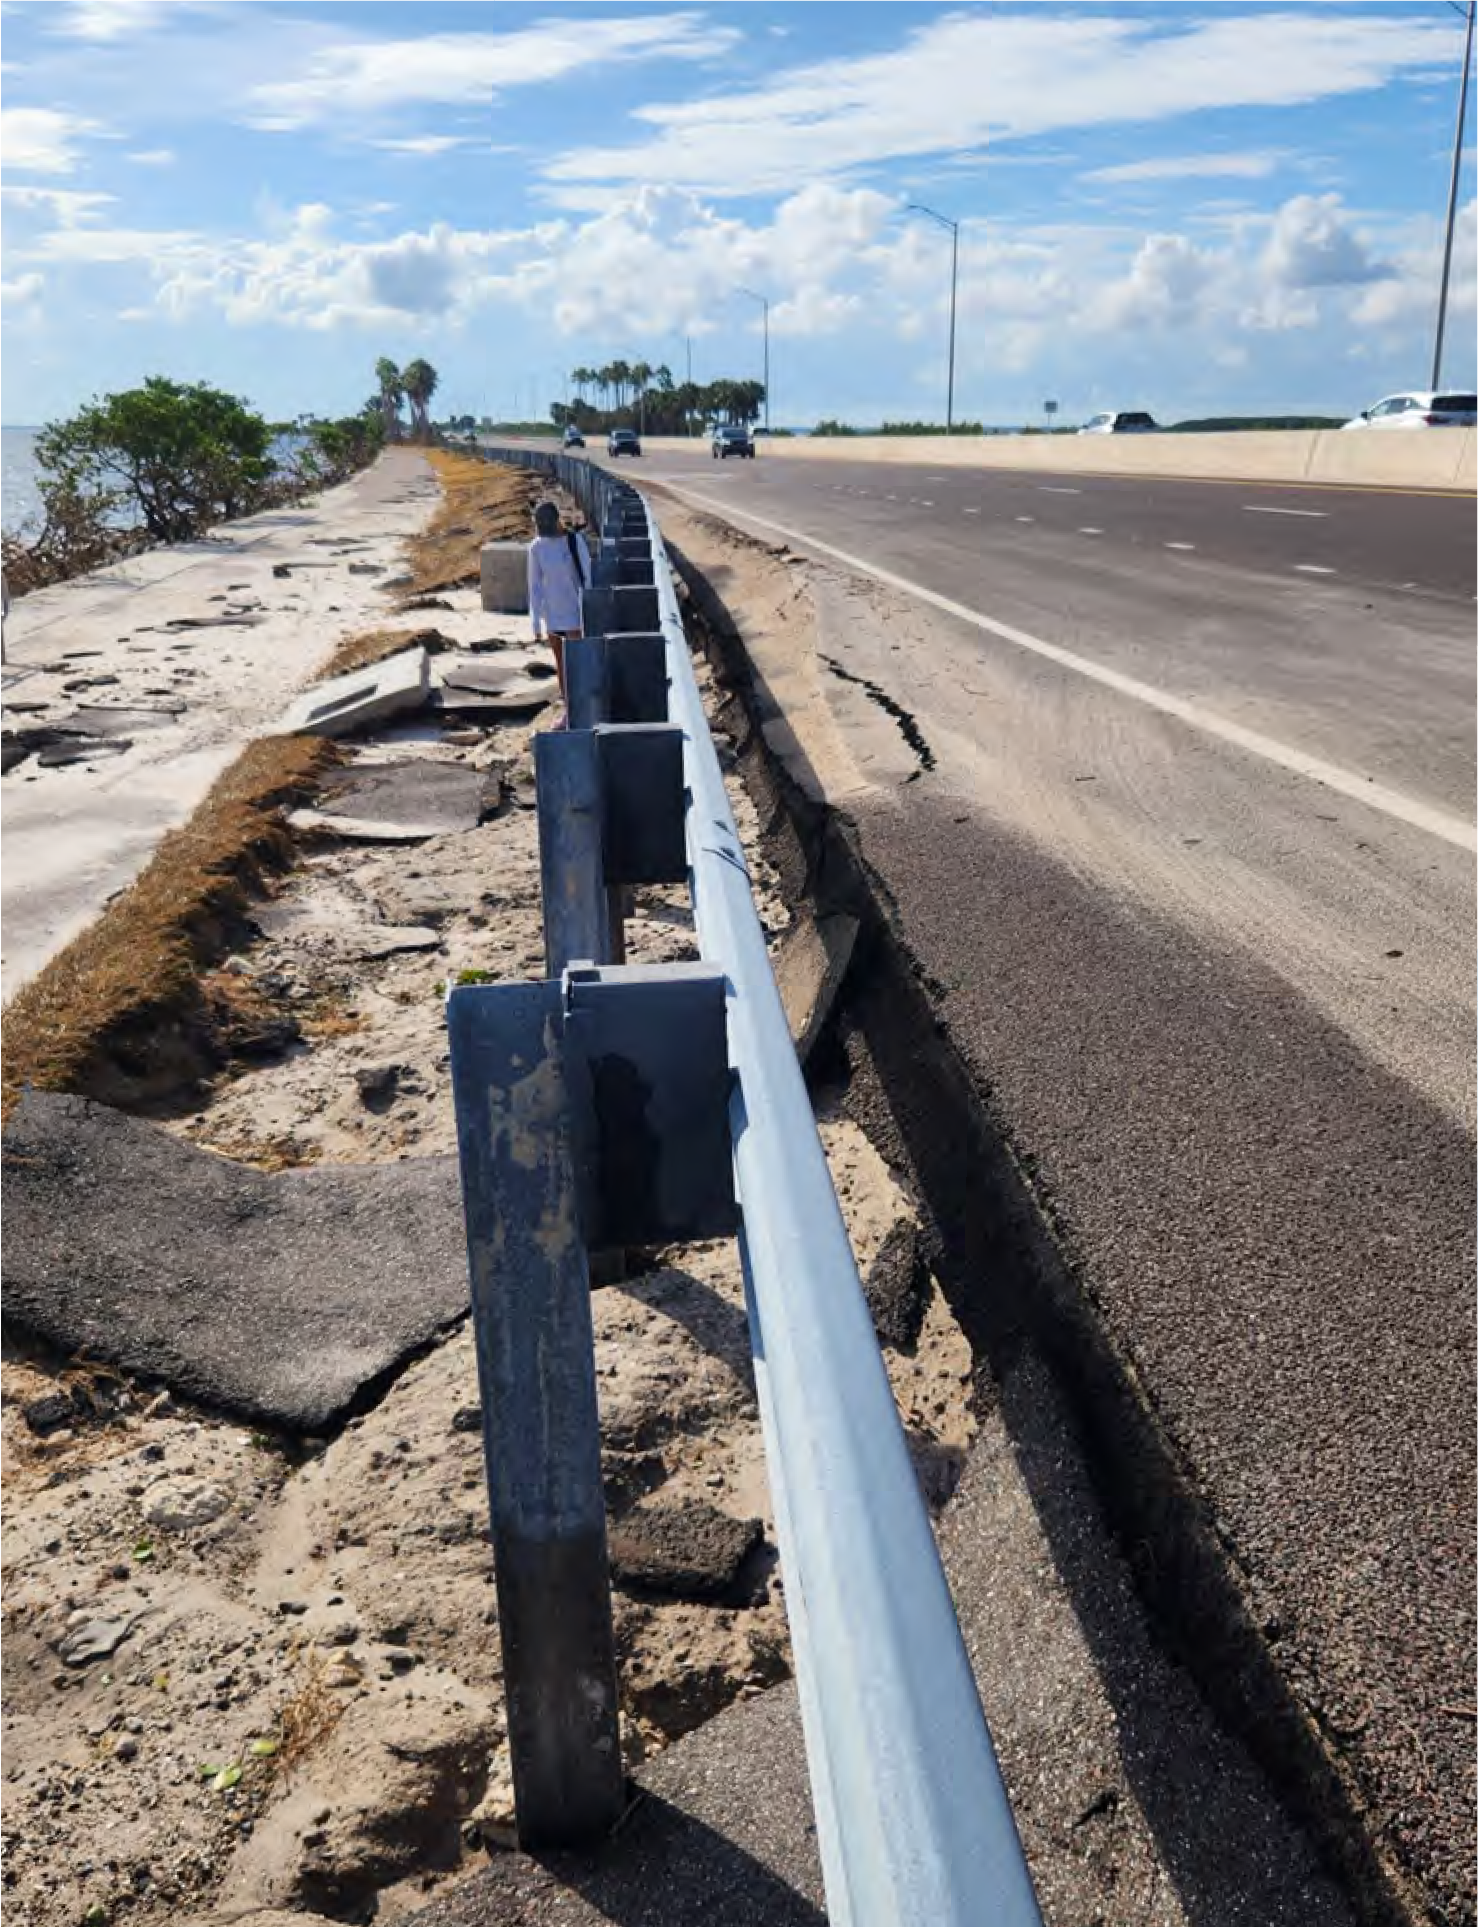
CULTURAL ASSETS
The city’s documented cultural assets are concentrated near early settlement locations, such as near Downtown, the Upper Hillsborough River, in Port Tampa City, West Tampa, and Beach Park. This includes cemeteries, which are on the perimeter of early development areas. These historic locations provide cultural touchpoints for early life in the city and are important to preserve for future generations.
FINDINGS
Sea Level Rise and Rainfall
Vulnerable locations related to sea level rise and stormwater include the Sulphur Springs Gazebo and Tower, Giunta Farm, and the Old Tampa Waterworks Pumping Station. However, the only facility that would be interacting with the floodplain is the Old Saint Mark Community Aid Center in Port Tampa City. This historic building was constructed in 1898 at 7218 S Sherrill Street.
Storm Surge
Storm surge projections, with the 2070 intermediate high scenario, include impacts to cultural assets concentrated in these areas:
- 2 in Port Tampa City
- 11 in Beach Park
- 2 in Davis Island
- 1 in Channelside
- 2 in Downtown CRA
- *1 in Ybor (not within the current 100-year storm surge projection)
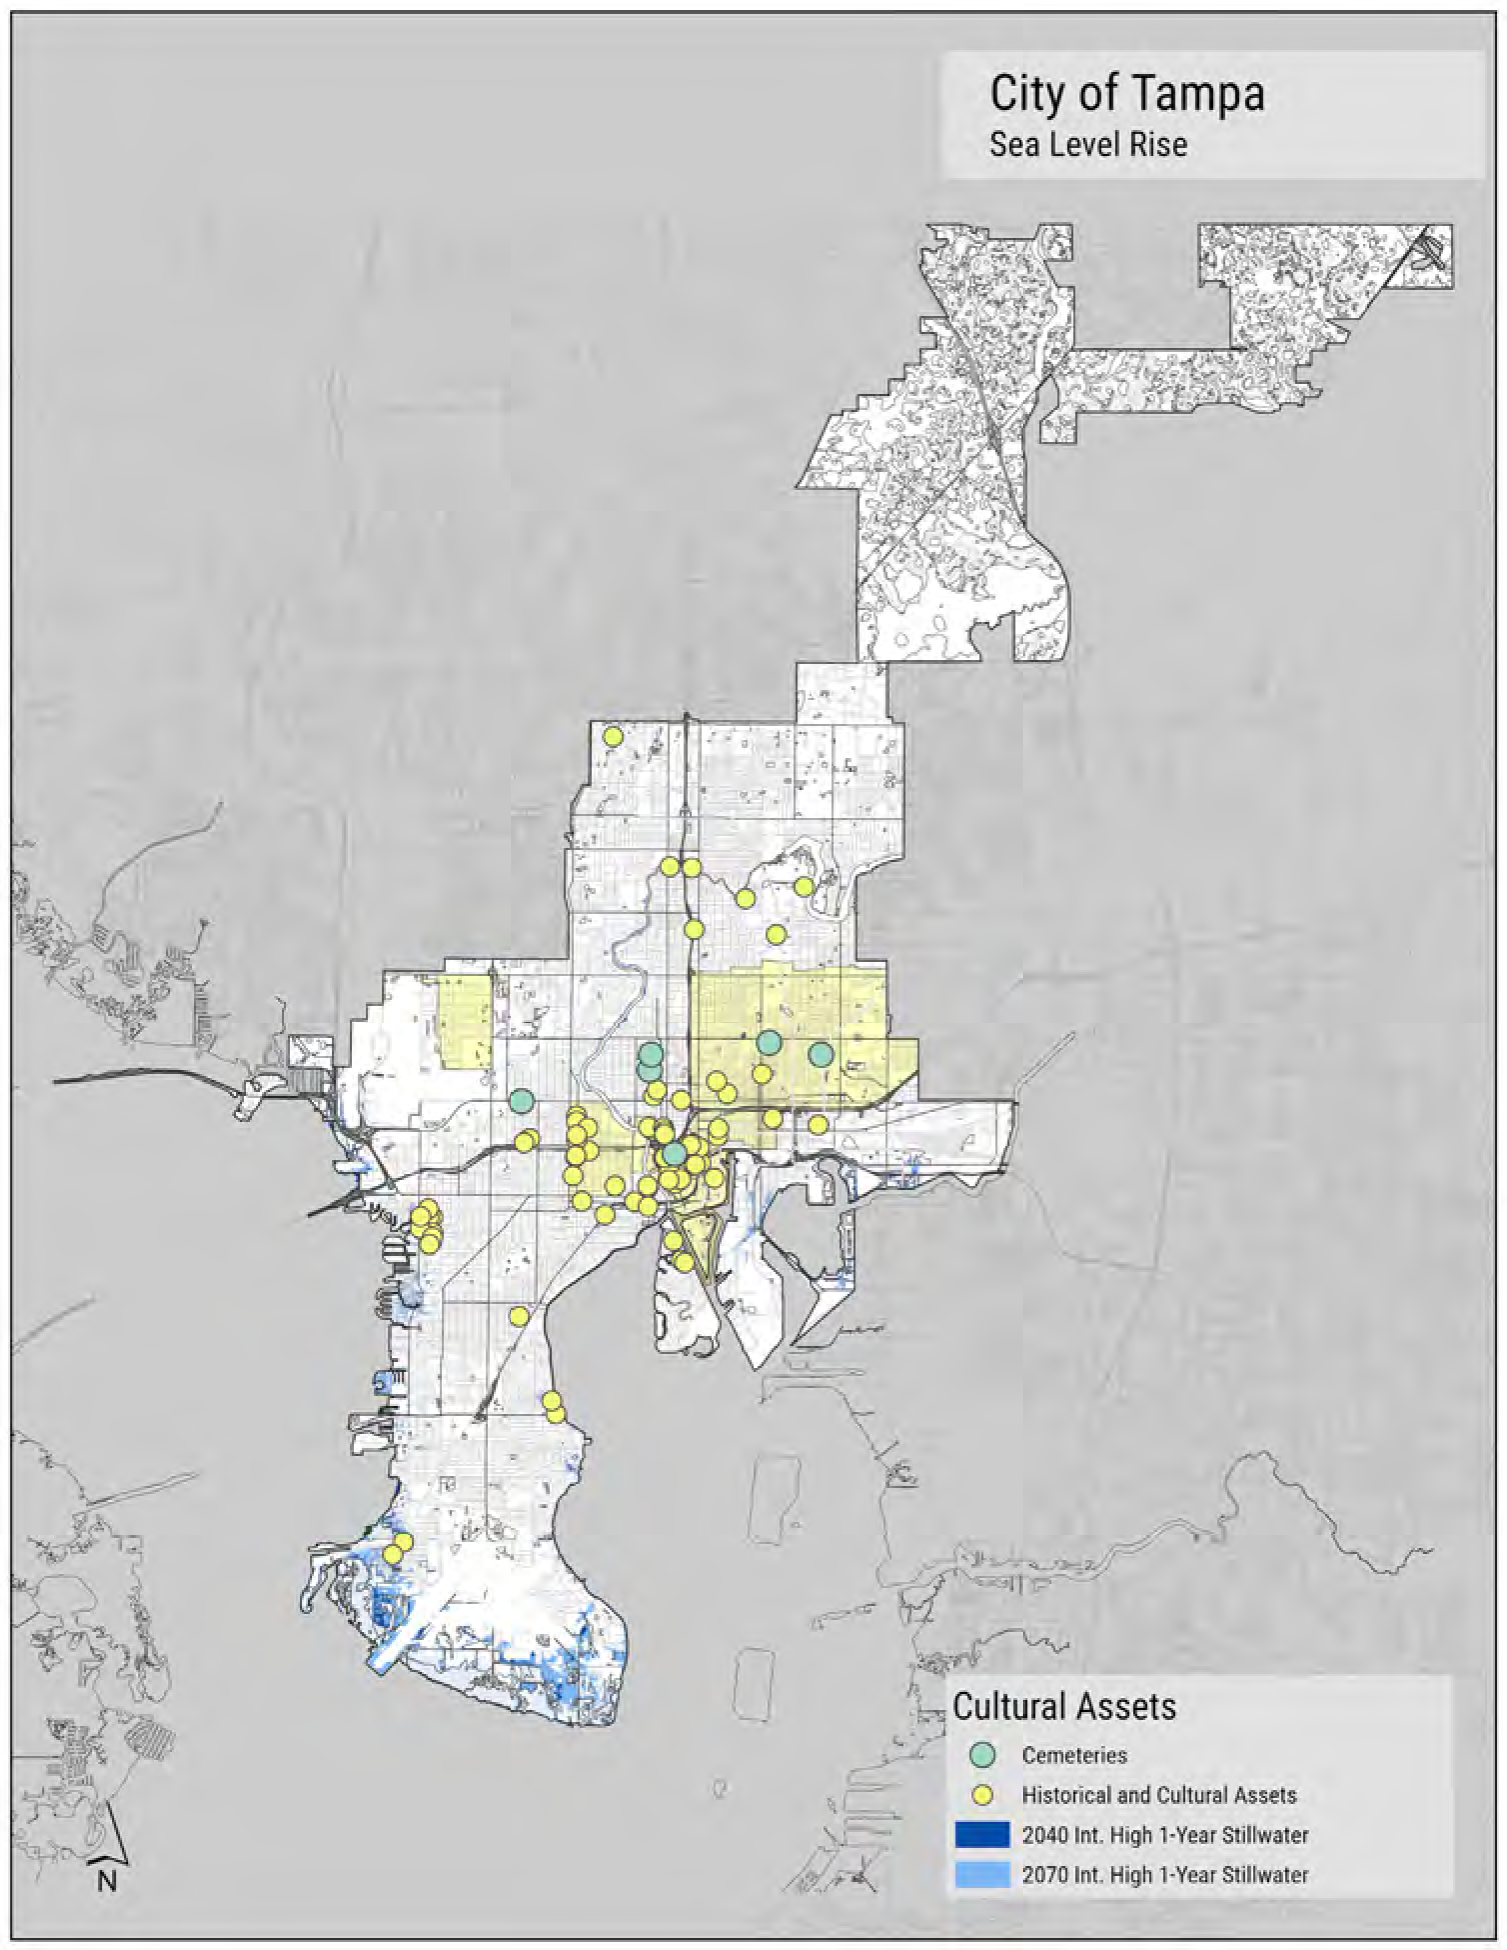
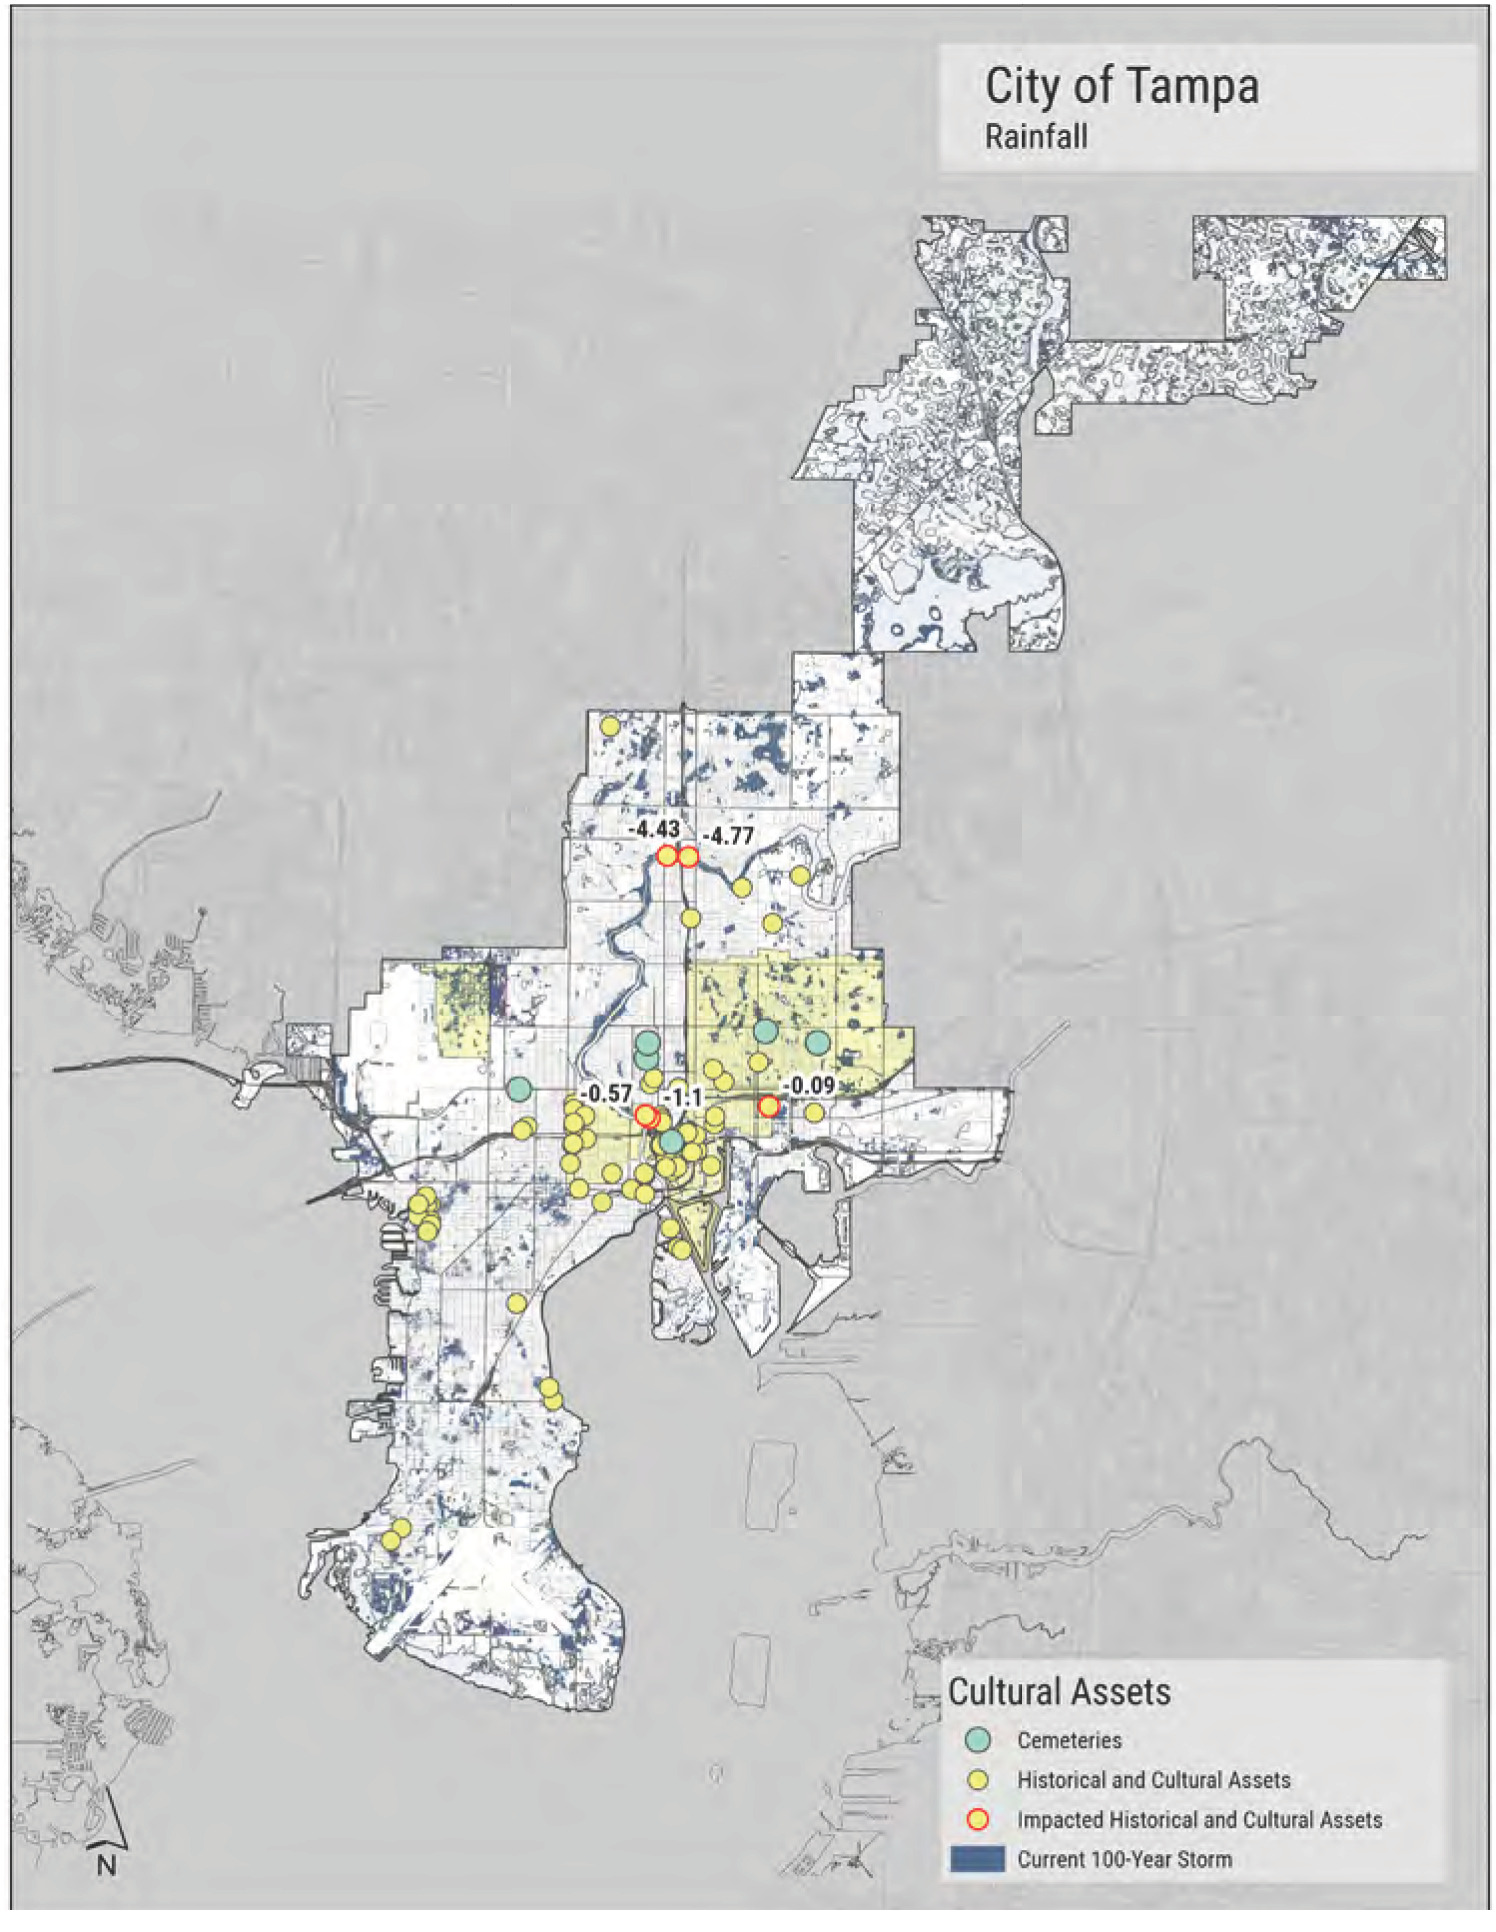
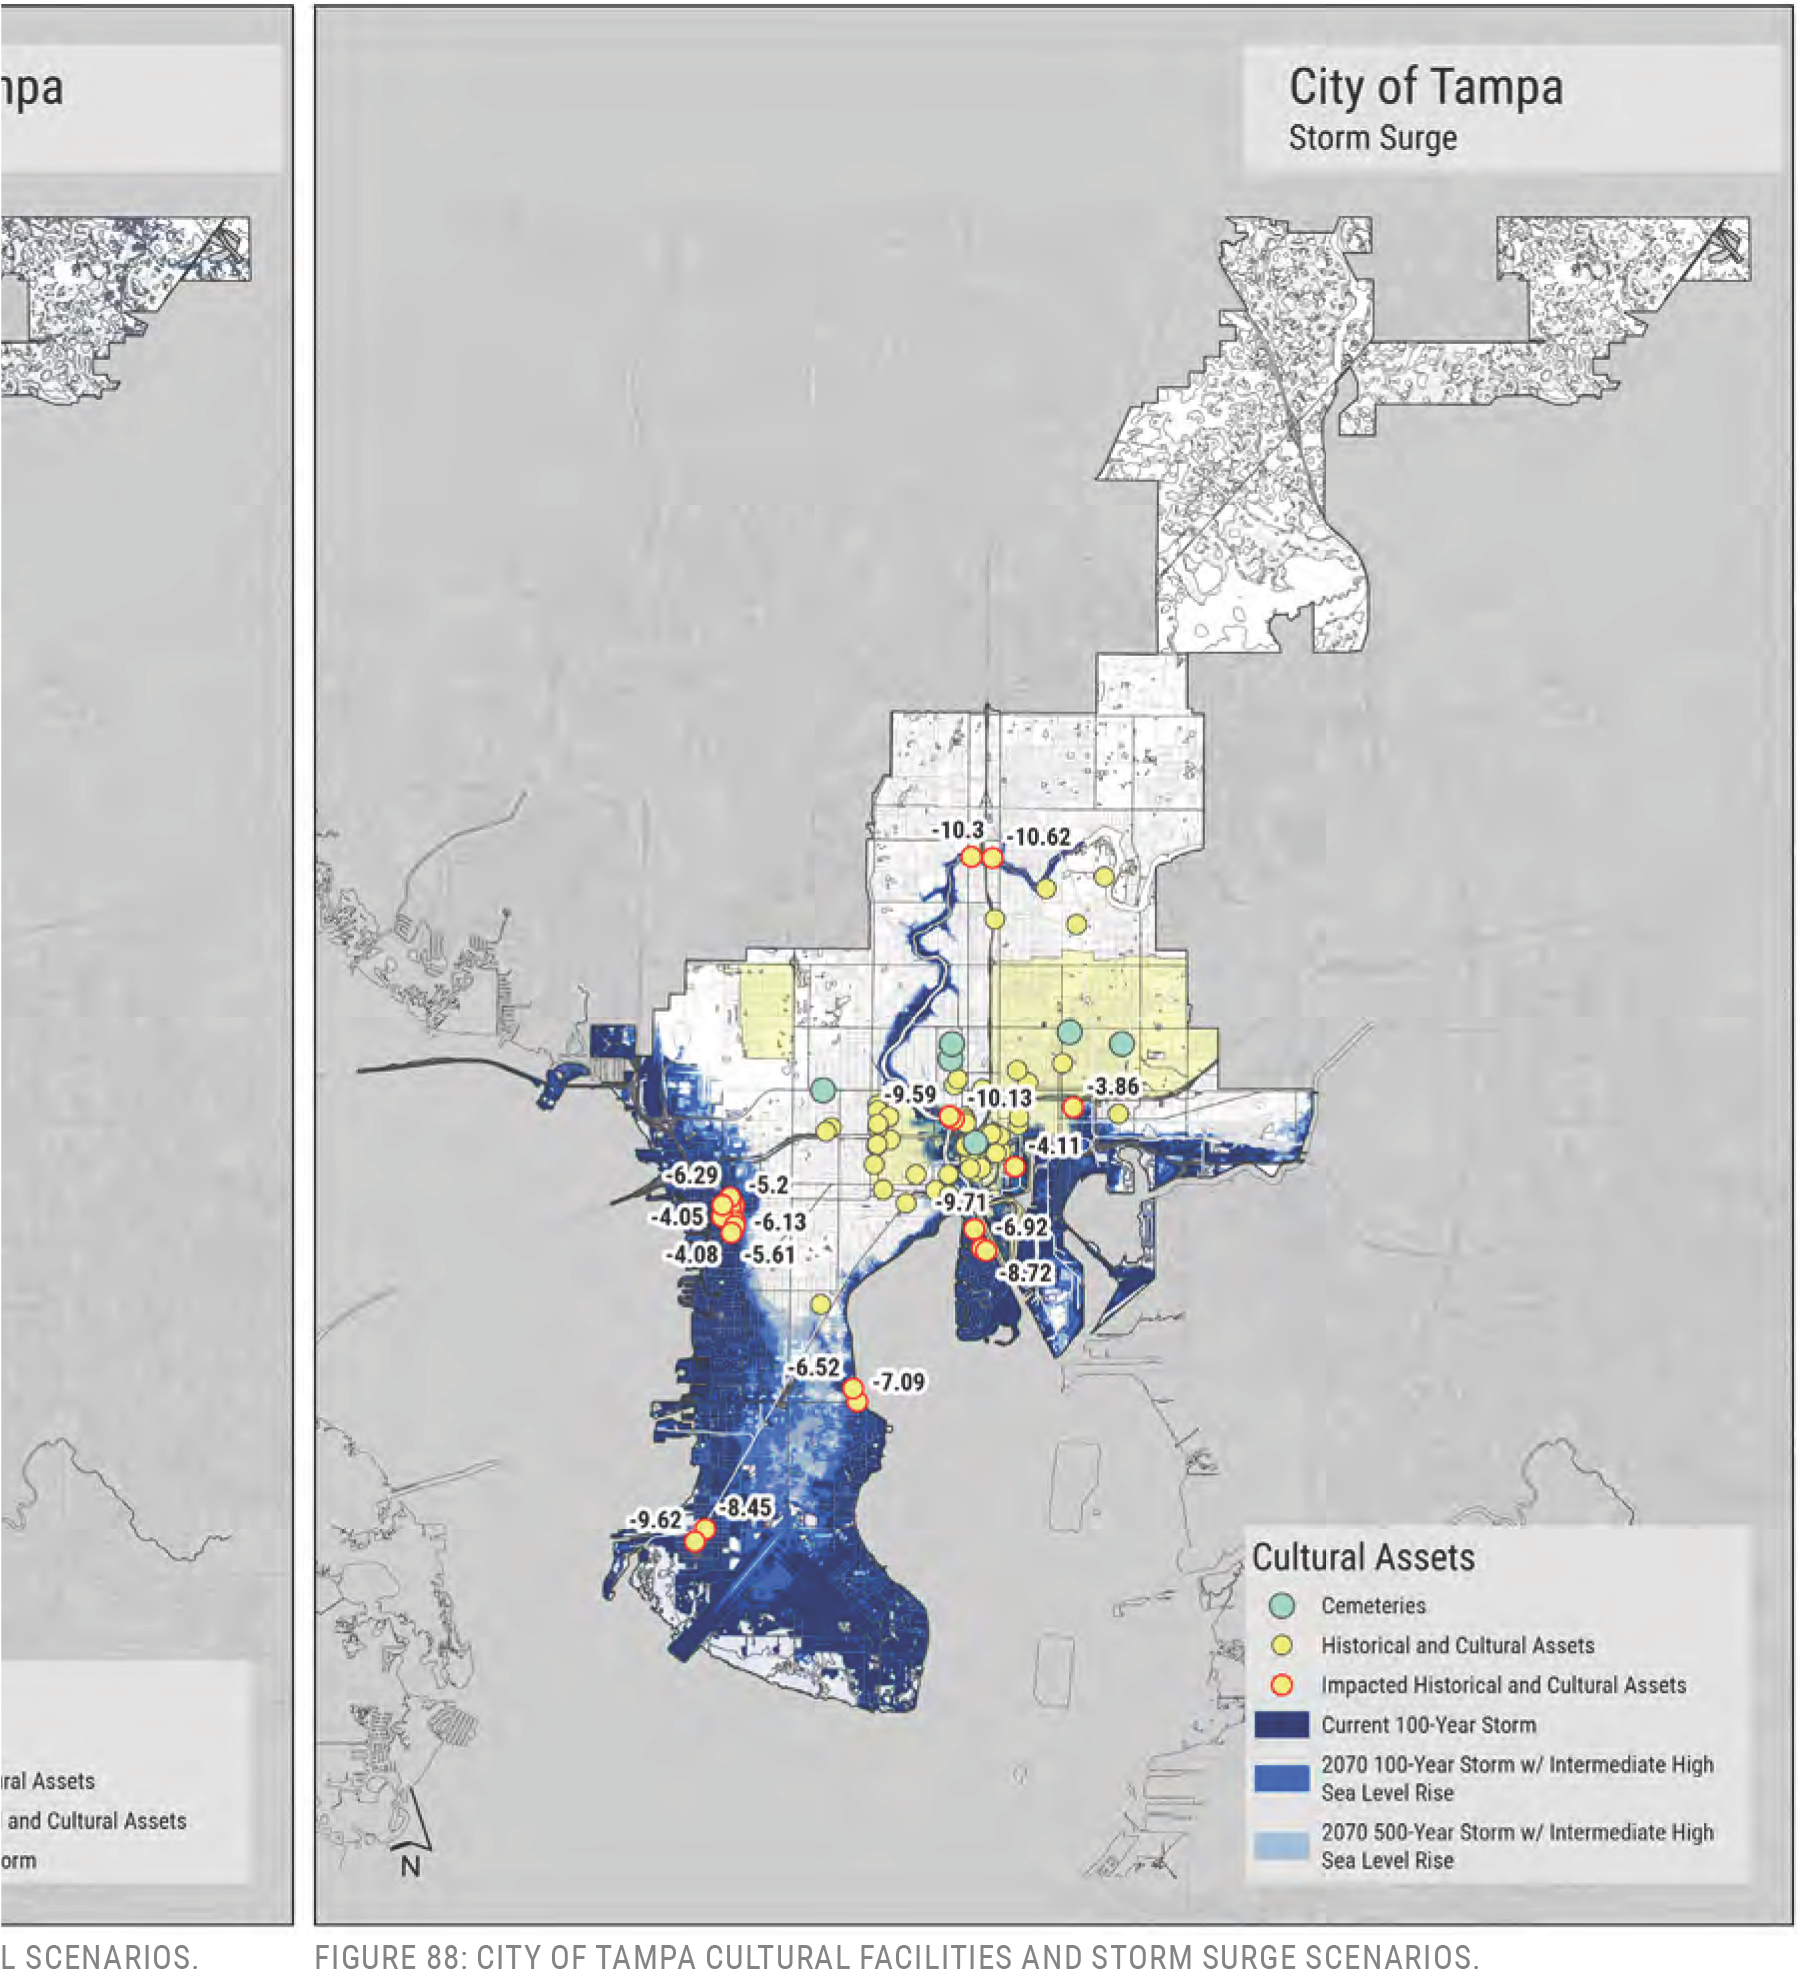
PARKS AND OPEN SPACE
Park properties are distributed throughout the city. Some are associated with recreation and others are properties owned and maintained by the Parks Department, such as specific street medians (Glenwood Drive, from Columbus to Ross for example). Due to the nature of Geographic Information System processing, it is difficult to determine the full extent of impacts to each park within the floodplain of sea level rise, rainfall, or storm surge. Many of these parks are waterfront. In such instances any park without a perimeter sea wall, which would create a vertical barrier between water and land, would appear to be impacted. However, the parks’ sensitivity and the extent of impacts is unknown. A closer evaluation of floodplains and property layout is needed.
If designed to withstand water inundation, there are minimal consequences when parks are flooded. In fact, they can be a useful buffer between fixed structures and the water. Landscapes inherently accommodate seasonal flooding. Plants and animals have evolved over millennia to endure cycles of water inundation. Designed landscapes would need to purposefully emulate these natural patterns and structures to accommodate seasonal or cyclical flooding. If not, the consequences can be more drastic. Plant materials often found in parks or residential landscapes cannot tolerate salt or may suffer if flooded for long periods of time. Impacts like this can restrict the usability of the park or cause deterioration and blight.
FINDINGS
Sea Level Rise
Parks noted with potential vulnerability to sea level rise include:
- Picnic Island – Erosion has already occurred at the coast causing damage to park structures.
- Tappan Tract Park – This is an open space area that could potentially shield the neighborhood to the east.
- Bayshore Linear Park and Tony Janus Park – This long continuous park and trail has been regularly inundated by high-tides, which will worsen with future projected high tide scenarios.
- Cotanchobee Fort Brooke Park – Interior areas may be inundated with high tide events in the future.
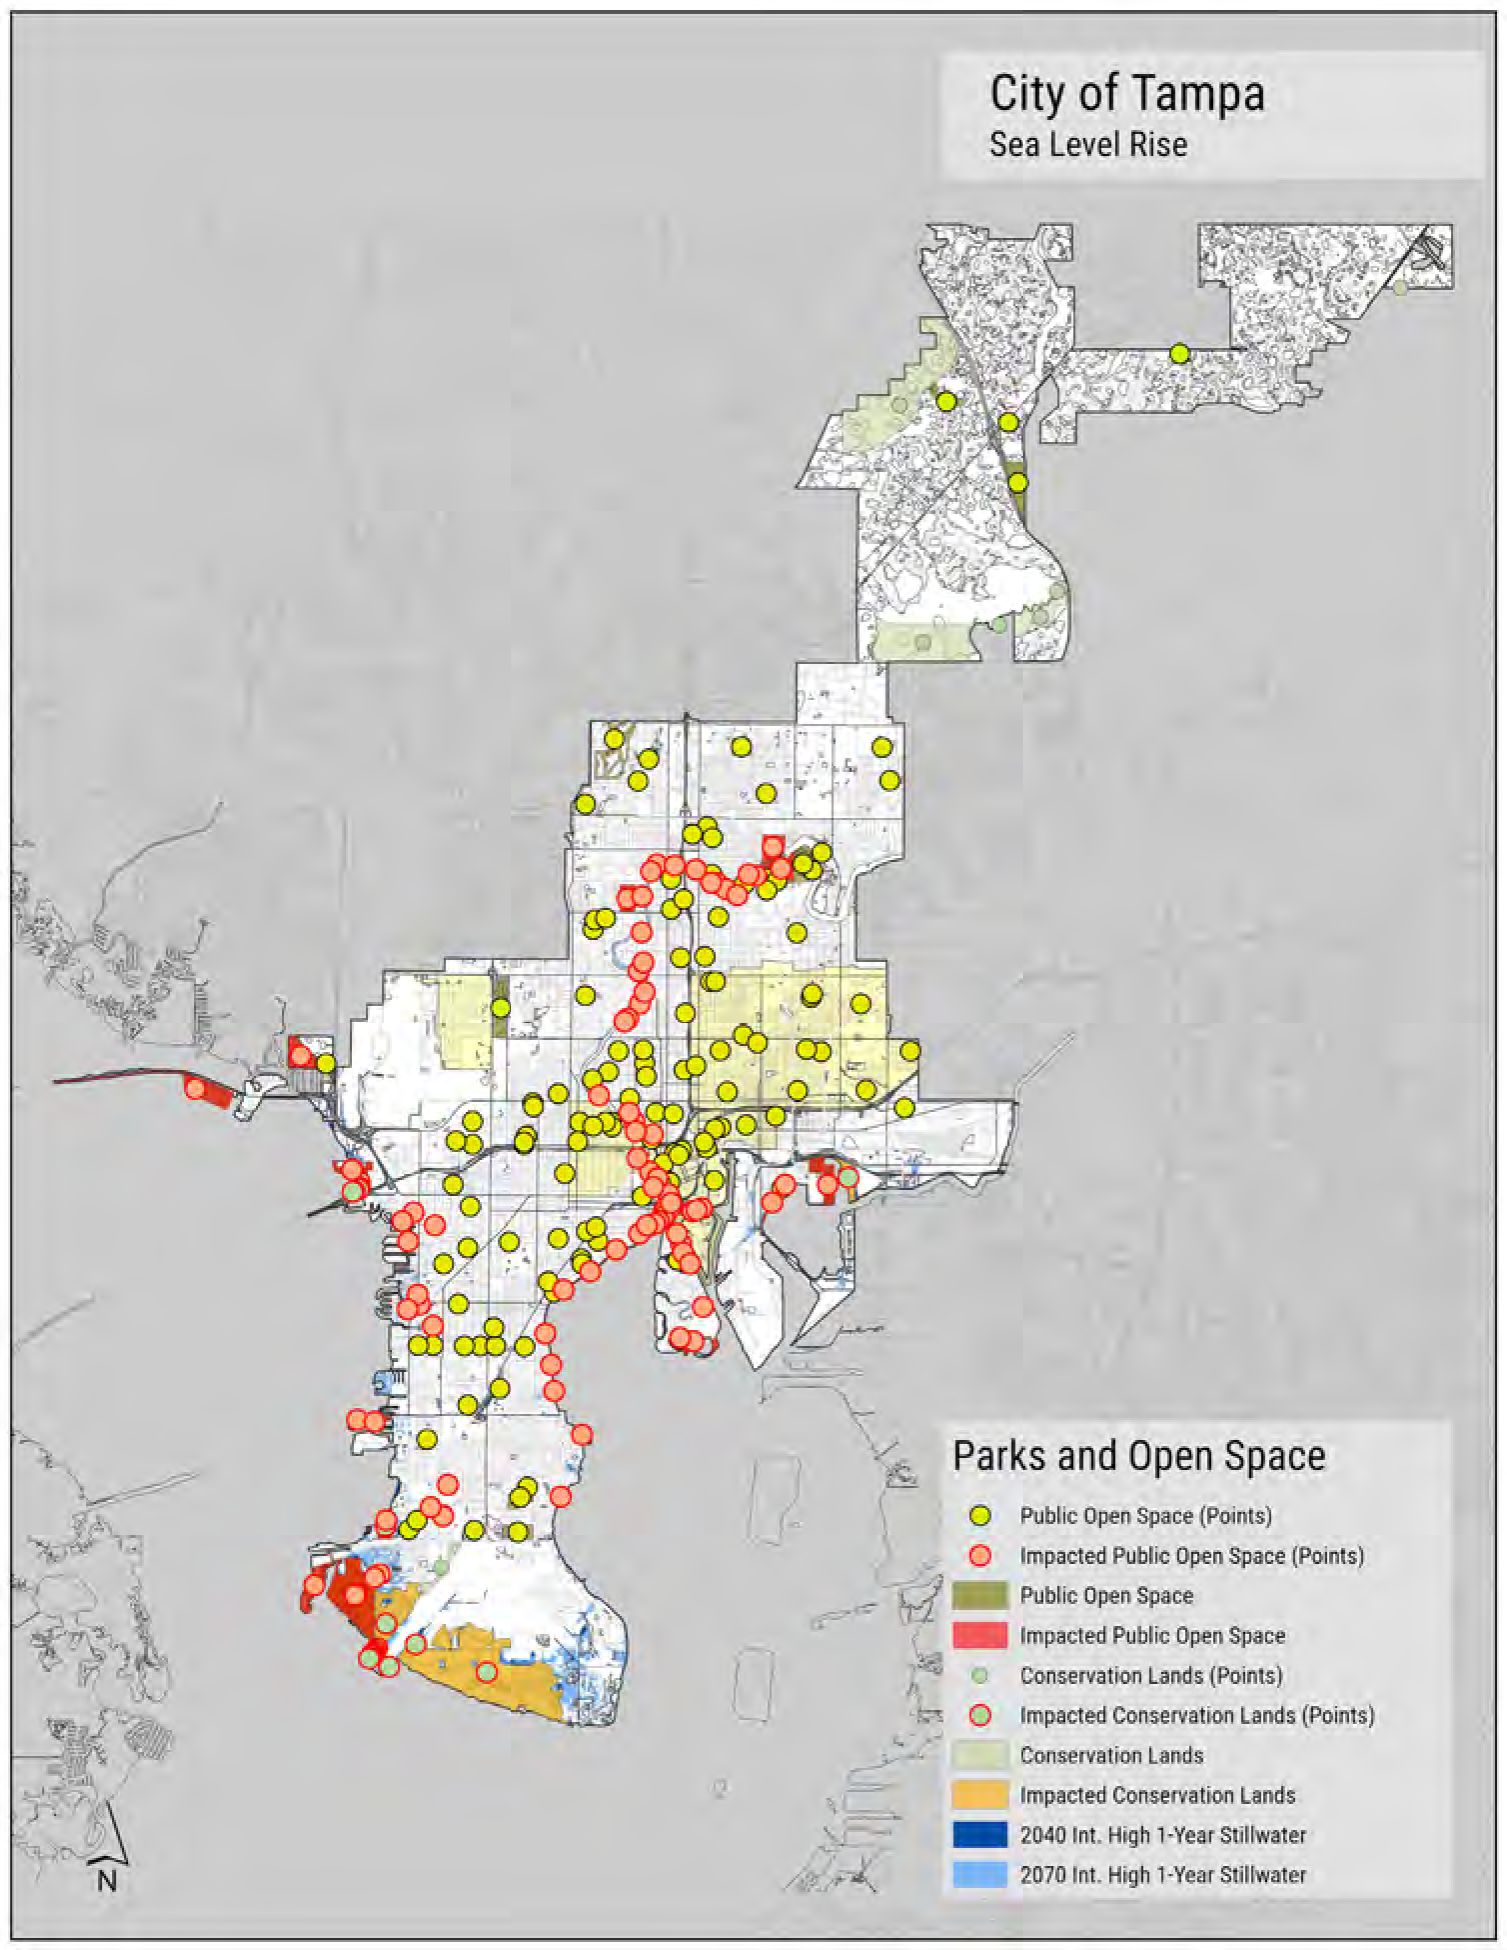
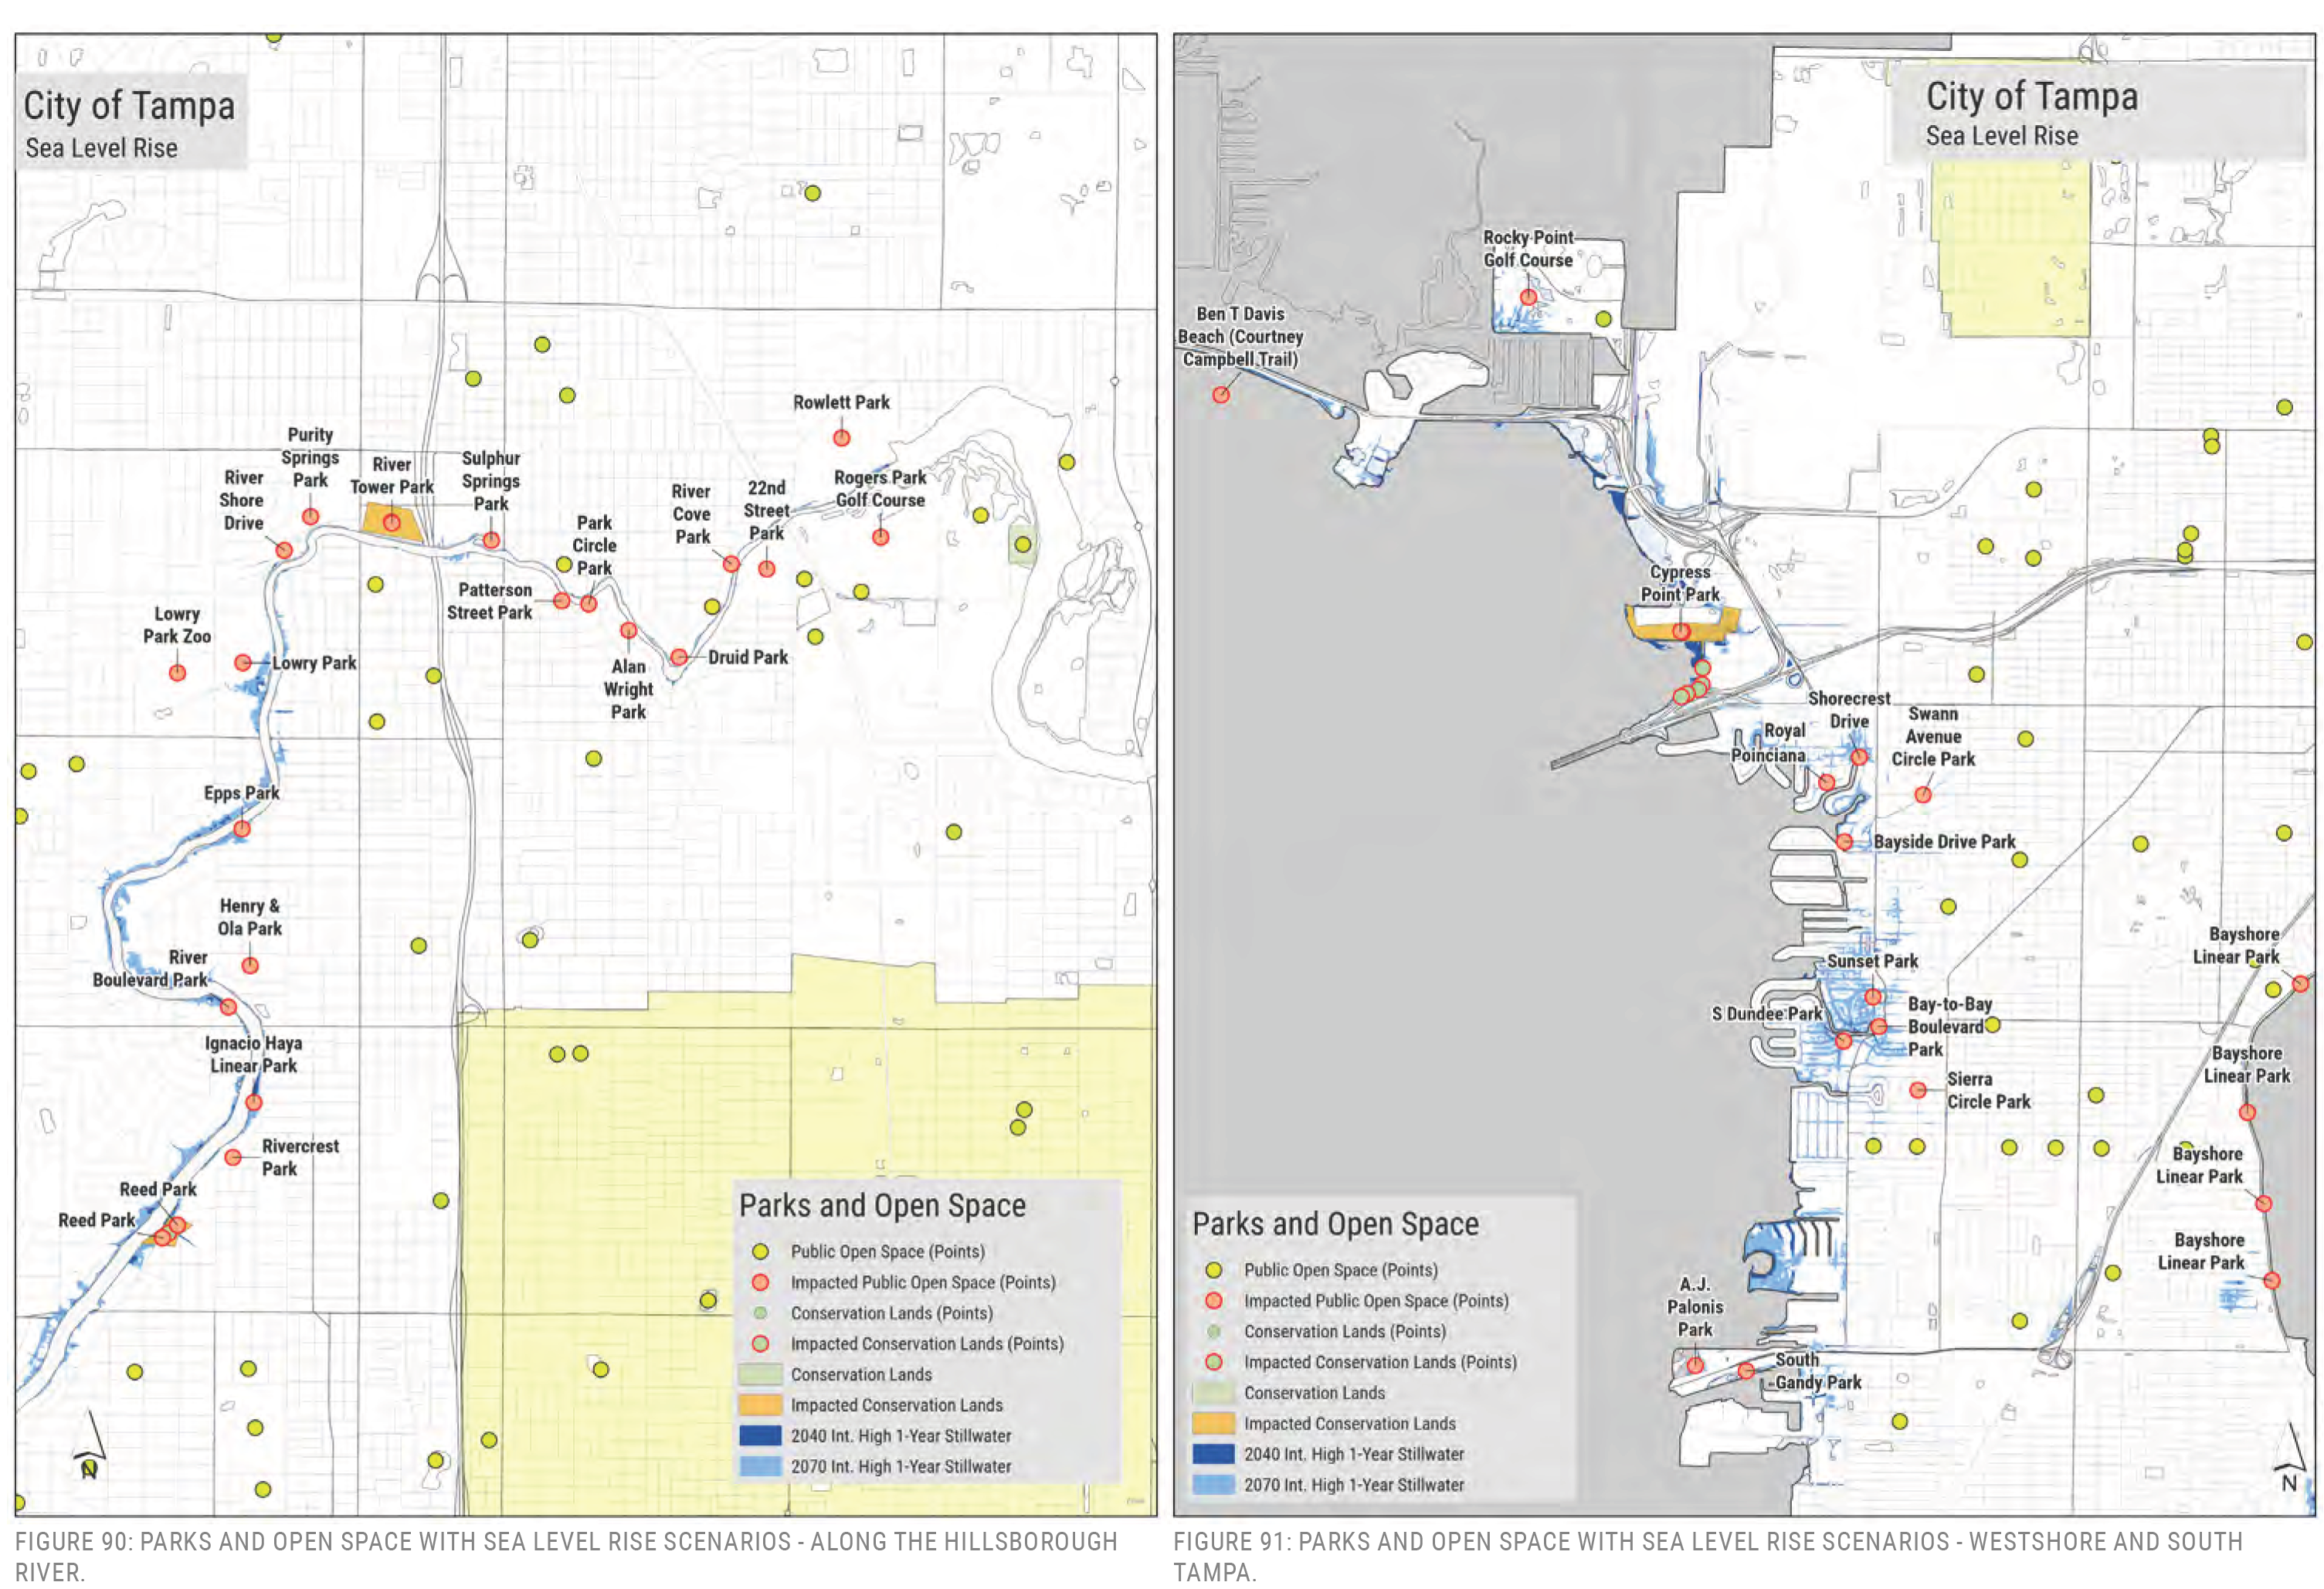
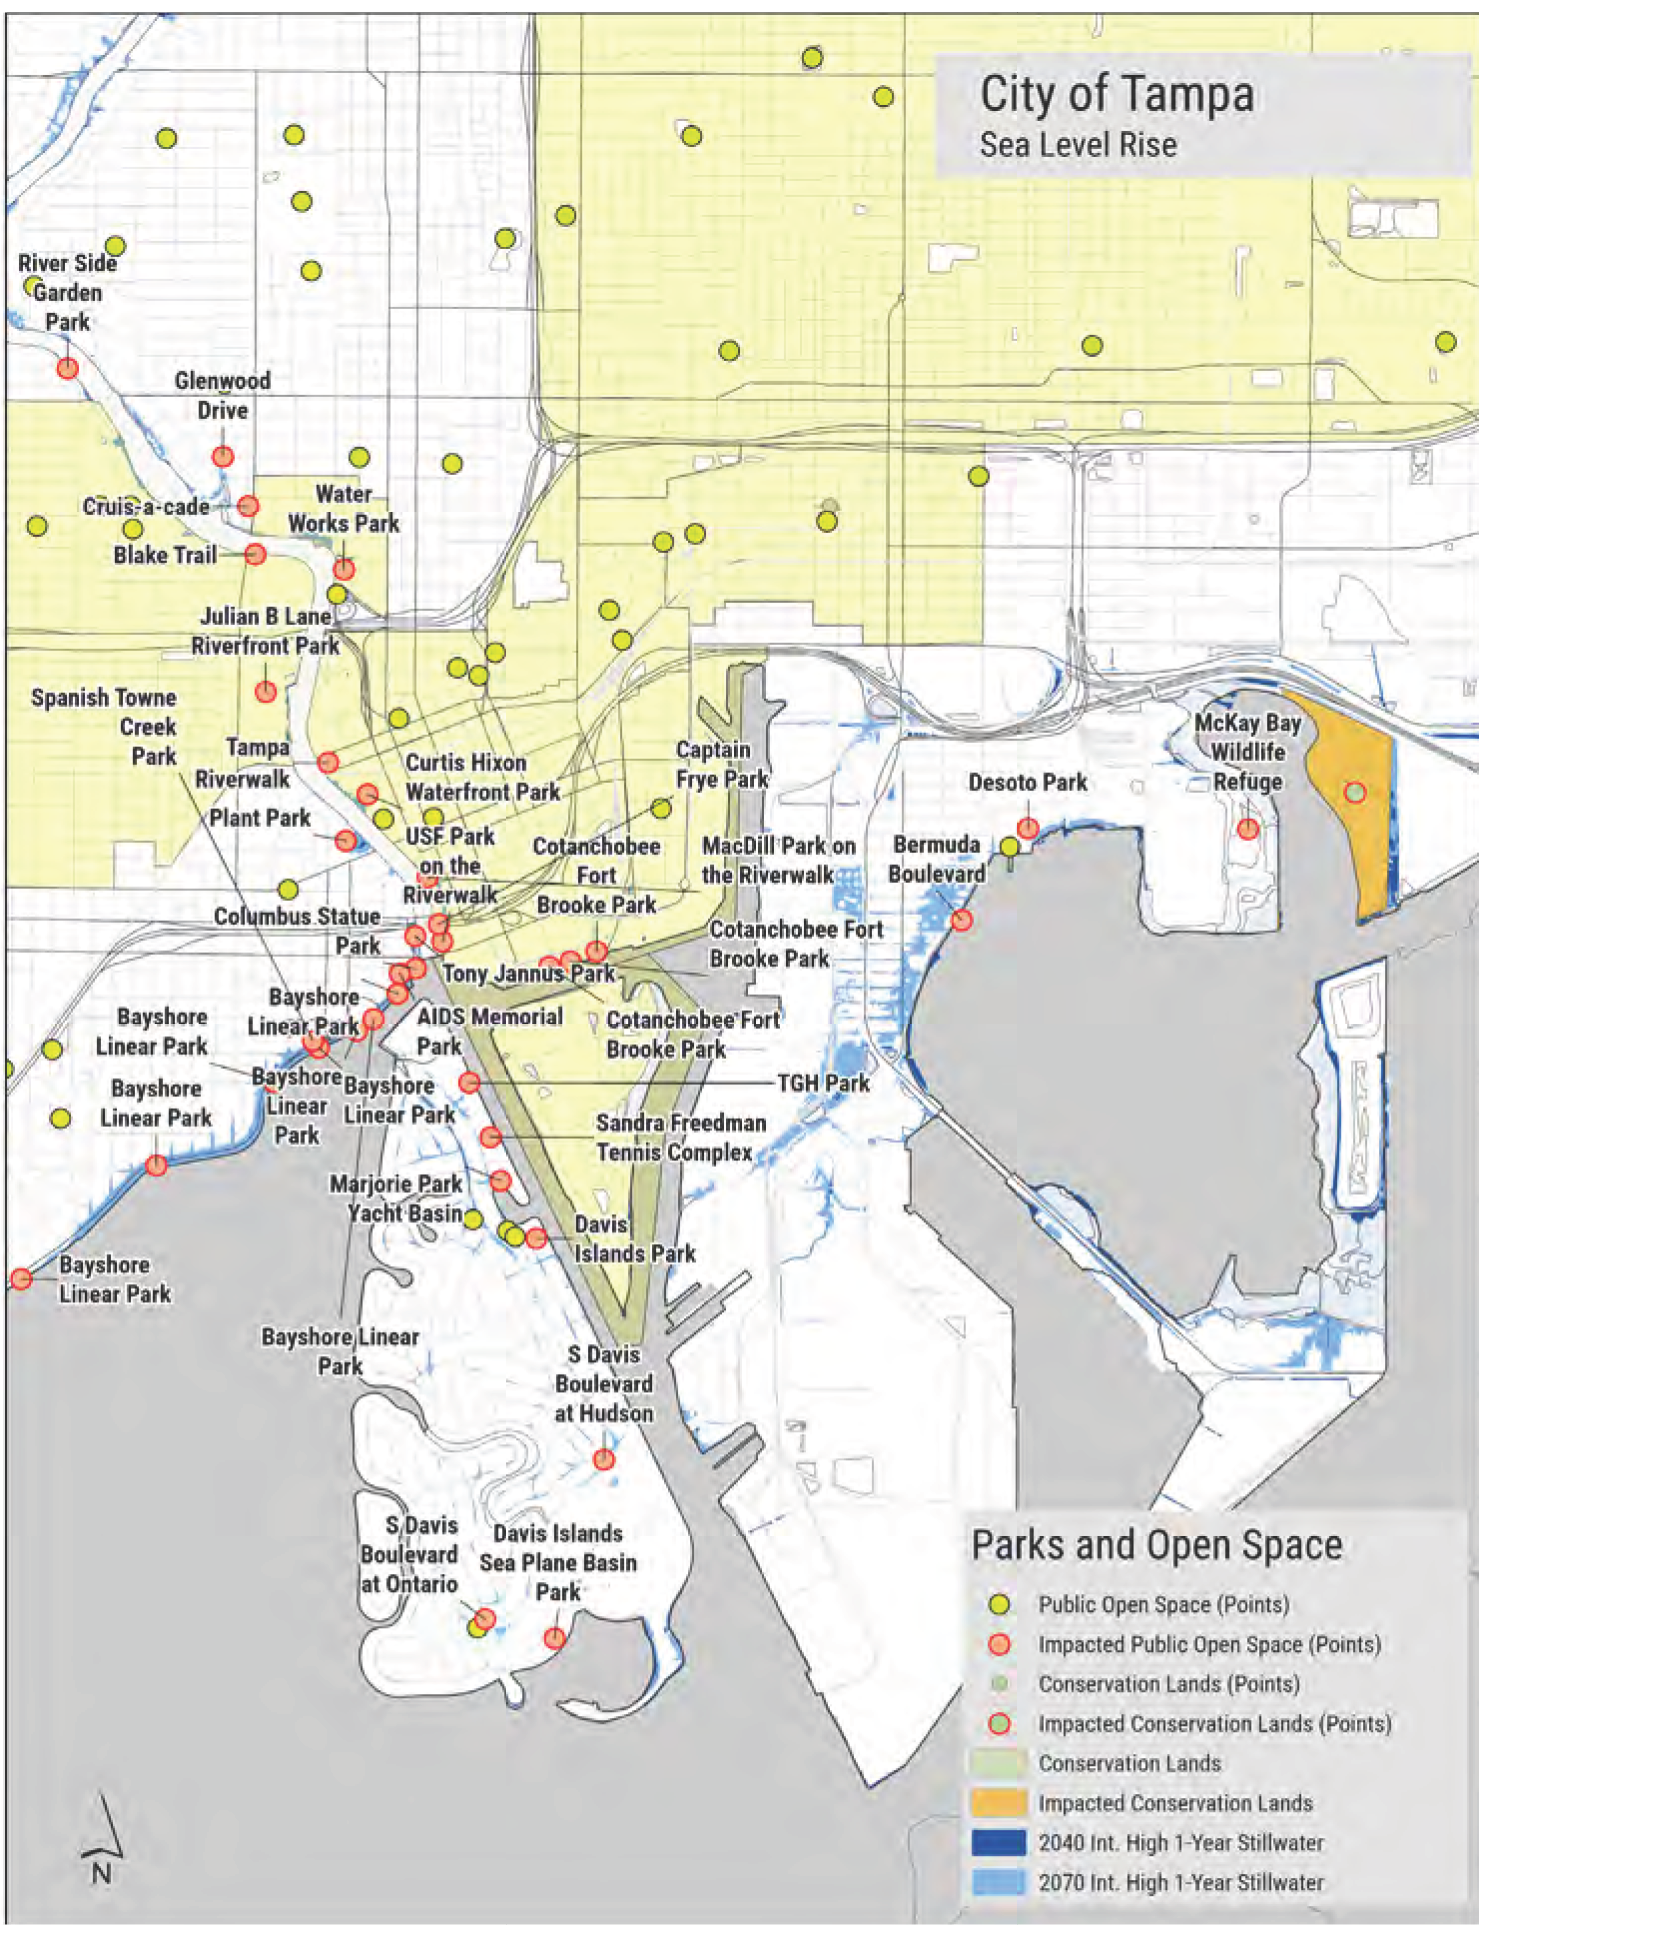
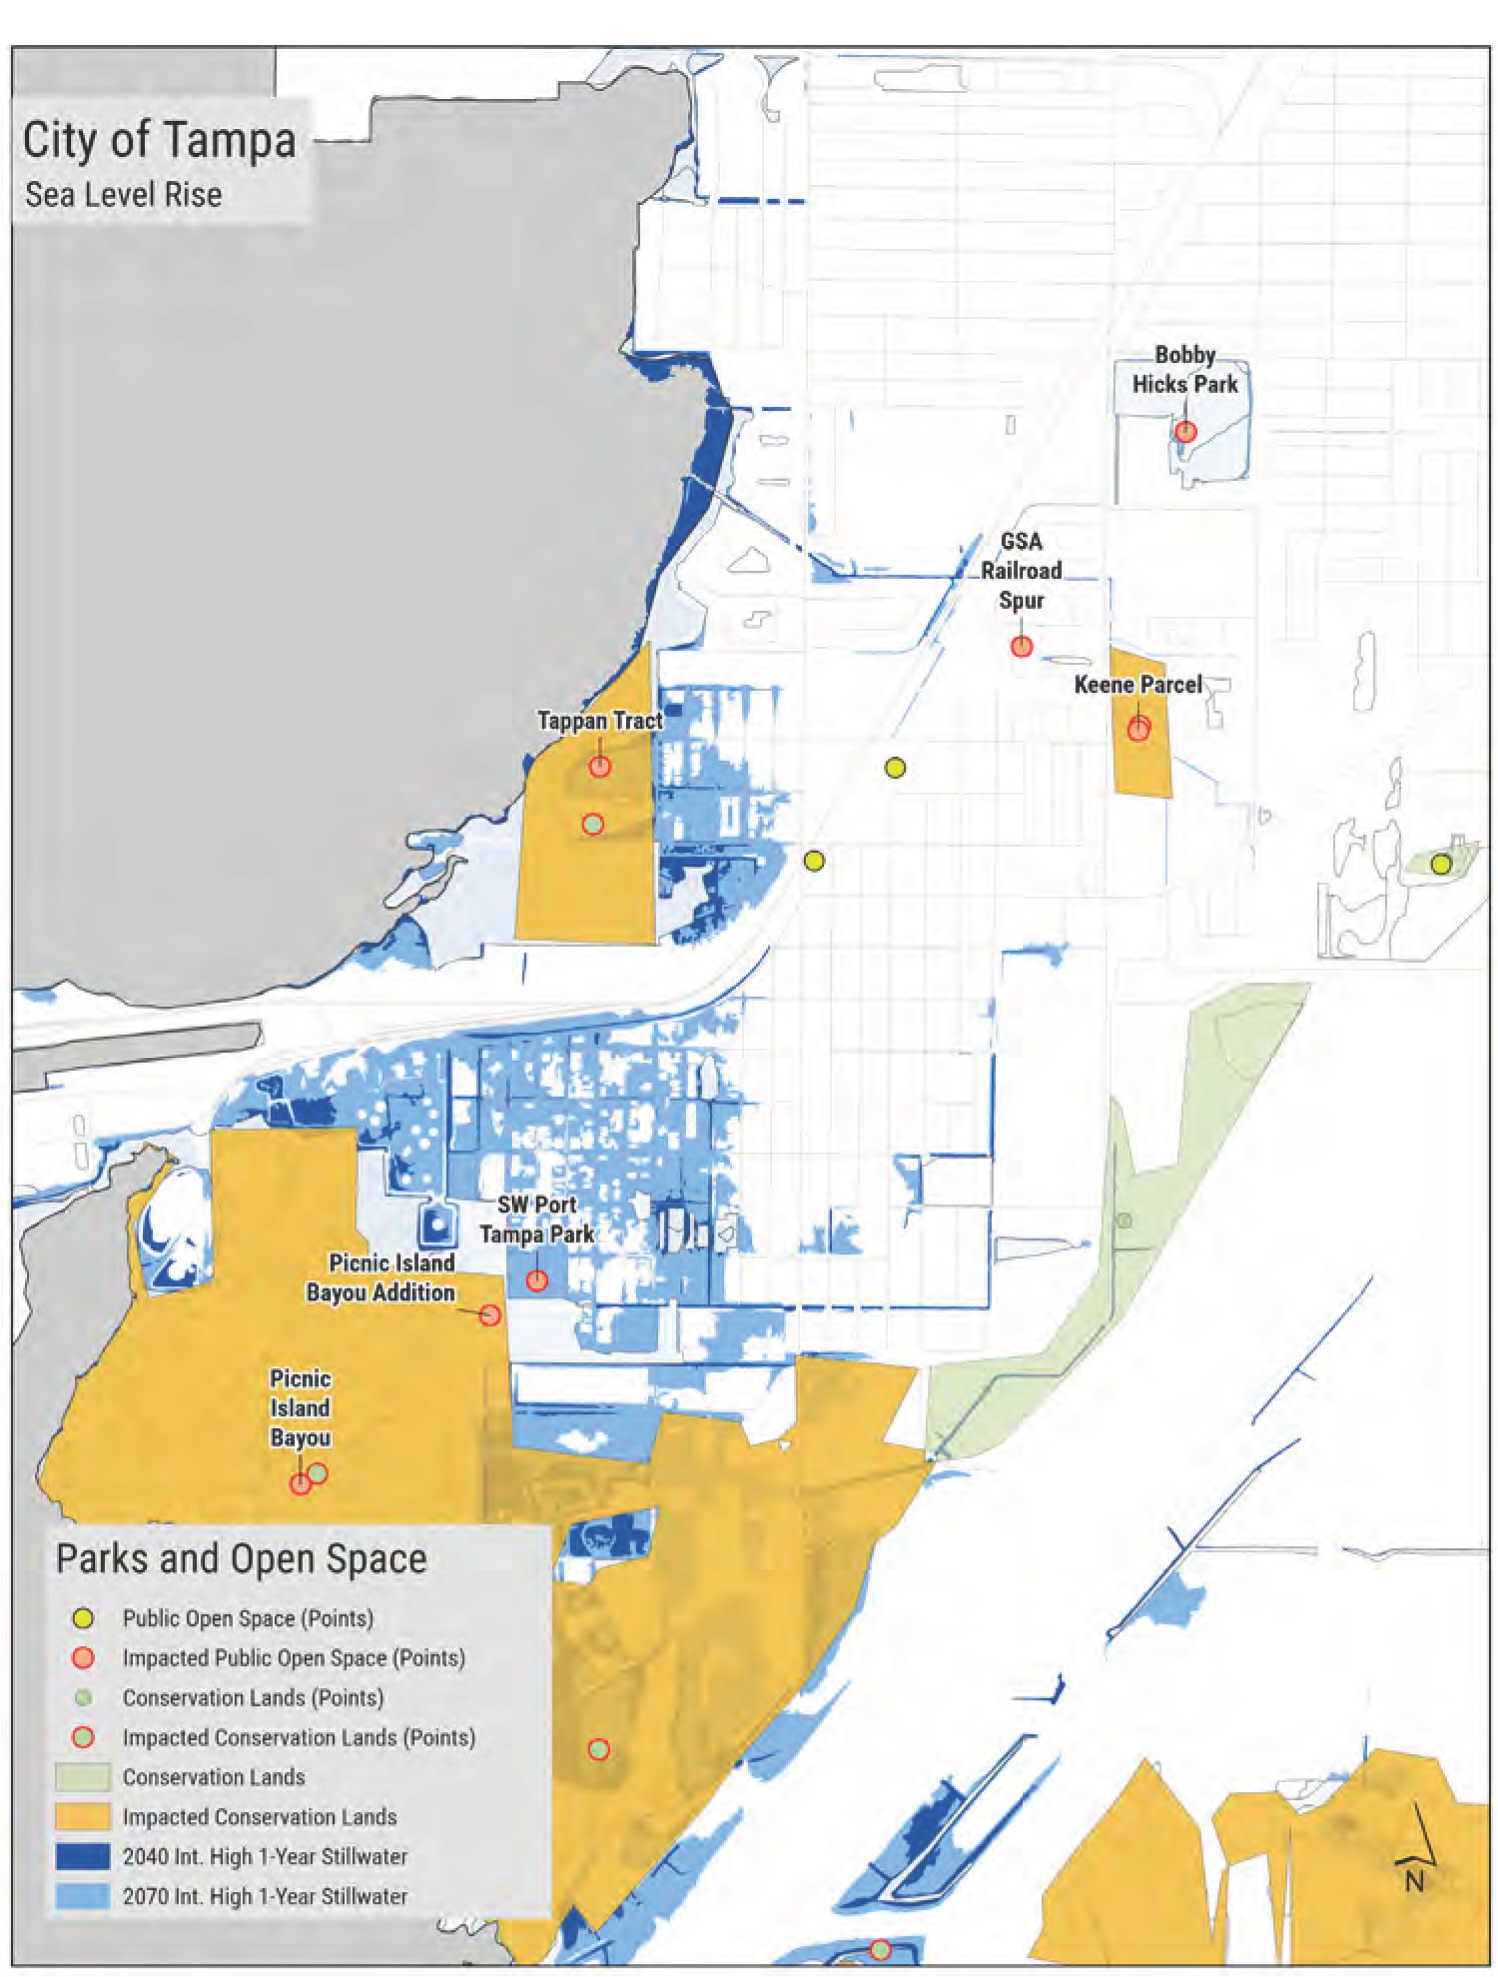
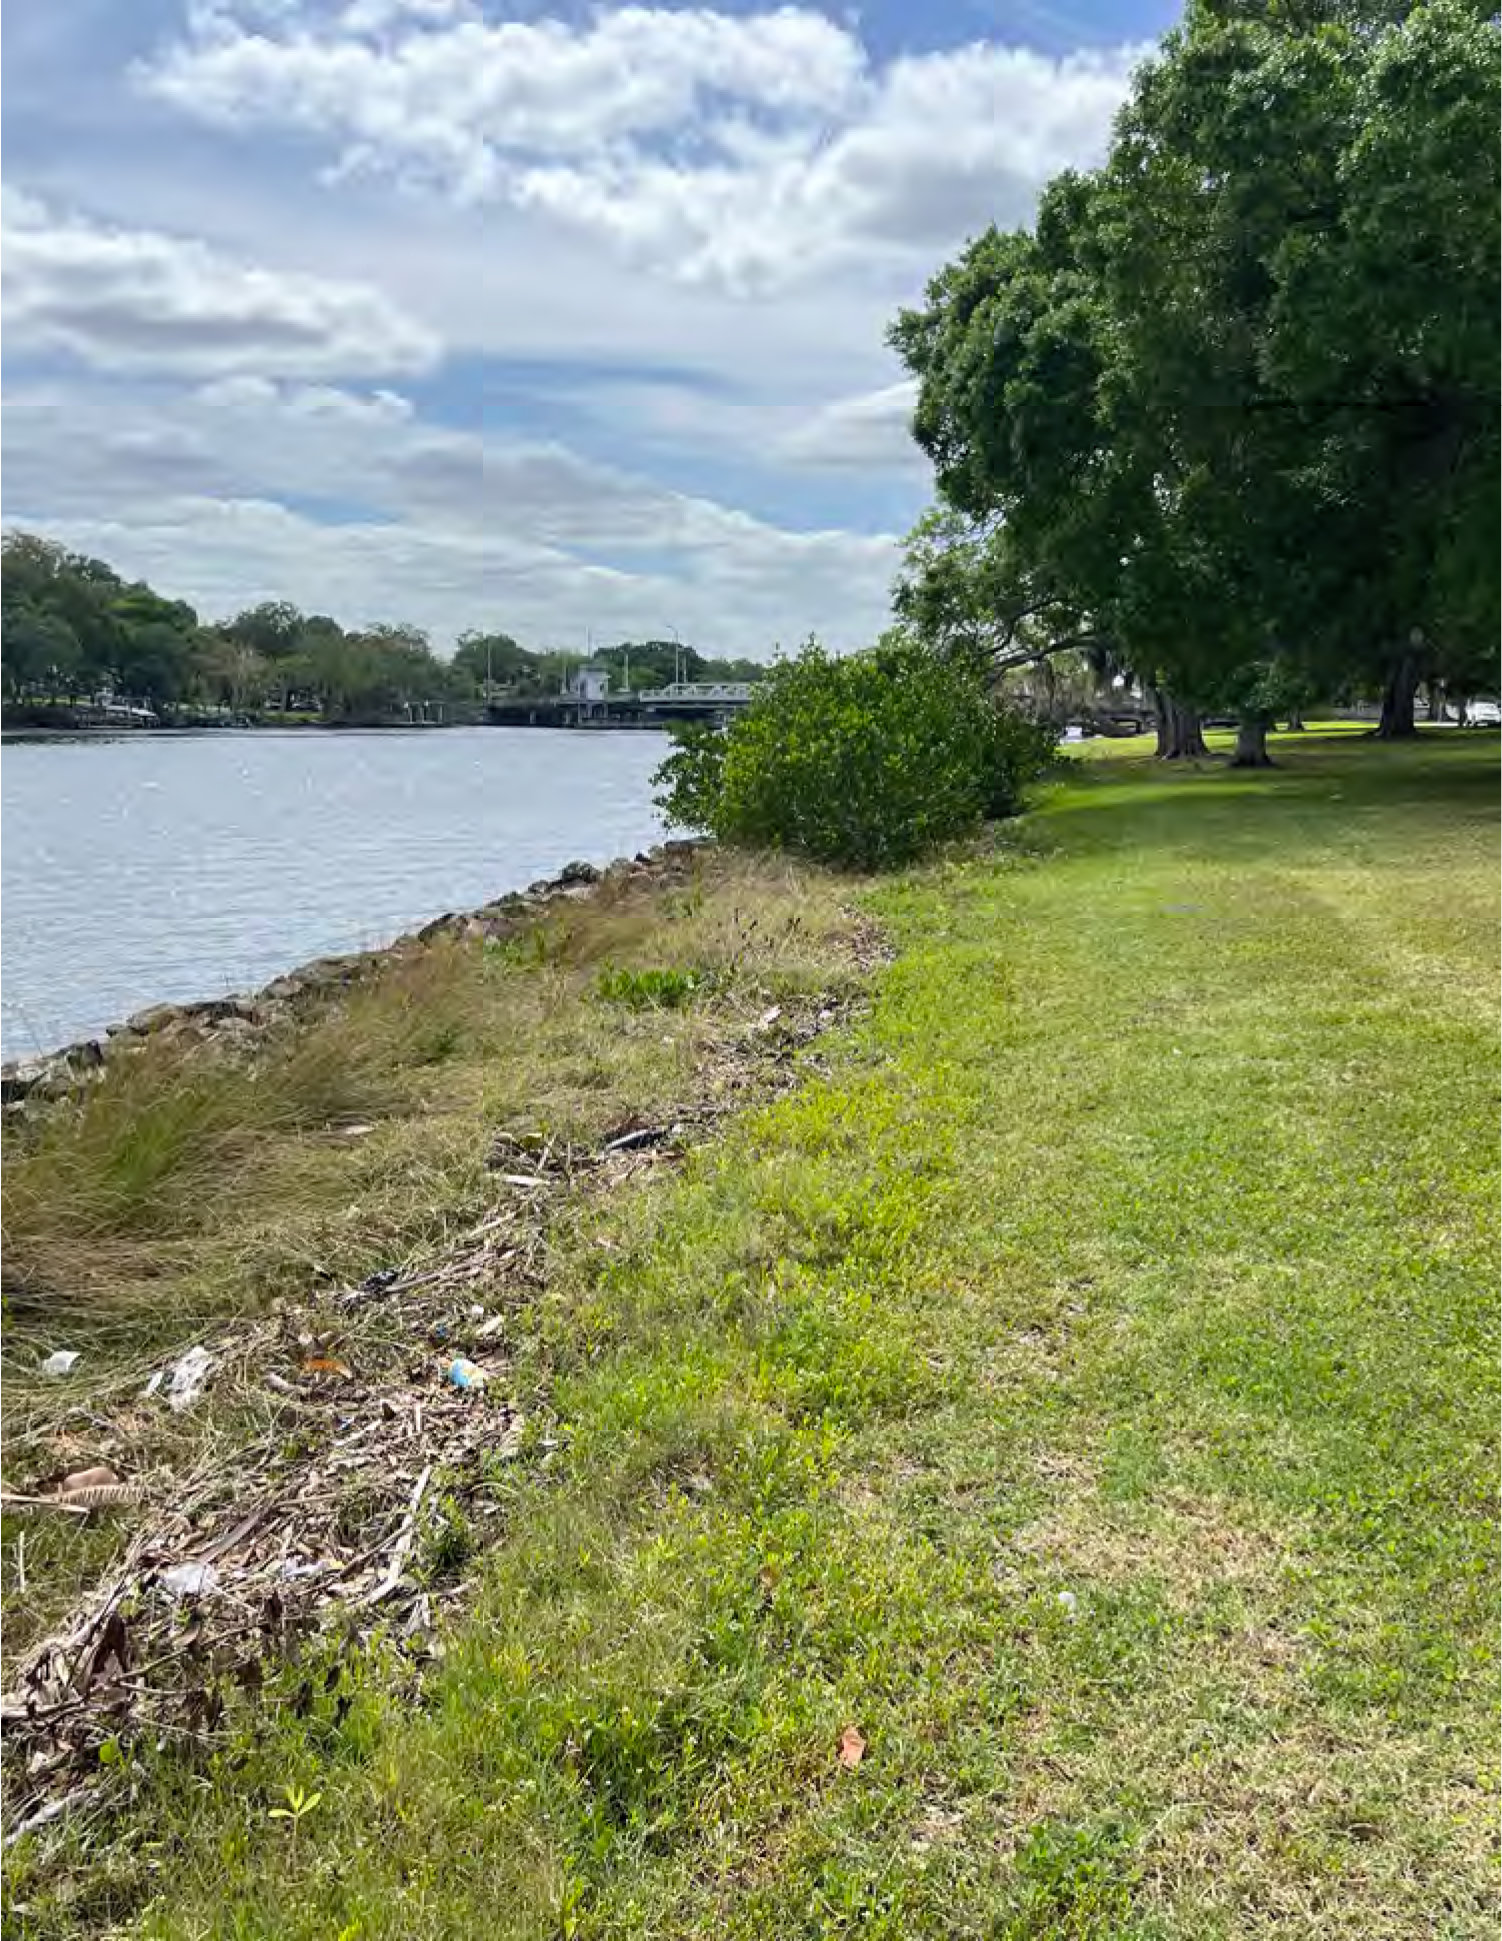
- Ben T. Davis Beach and the Courtney Campbell Trail – The main parking lot is at approximately 3.75 feet NAVD88, one foot below the 2070 intermediate-high sea level rise scenario. Some other areas, especially on the north side of the Courtney Campbell Causeway, are low-lying and could be impacted by future high tide scenarios.
- The Rocky Point Golf Course – The southwest end appears to be hydraulically connected to the coast and would experience impacts under future sea level rise scenarios. The terrain is between three to five feet NAVD88 over a large expanse.
- Bermuda Boulevard – This linear park space is adjacent to the waterfront. The existing seawall is near the 2070 intermediate-high 1-year sea level projection of 4.76 feet NAVD88.
- USF Park on the Riverwalk and Captain Frye Park – These two parks are near or slightly lower than the 2070 intermediate-high 1-year sea level projection of 4.76 feet NAVD88.
- Reed Park
- Ignacio Haya Linear Park
- River Boulevard Park
- Epps Park
- Lowry Park
- Bobby Hicks Park – This inland park, which includes Robinson Lake, is hydraulically connected to the coast. When water levels at the coast are elevated salt water may be introduced to this freshwater system.
- Bay to Bay Boulevard Park – This park would be significantly inundated with the 2040 intermediate-high projection 1-year stillwater event, which would worsen to encompass the entire park by 2070 (with the same intermediate-high scenario).
- Deck height information is unknown for the Tampa Riverwalk. Future construction should consider elevated water levels.
Rainfall
As “open space,” parks are often designed to absorb stormwater. In some instances, however, there may be more water than the park can withstand. This would have to be determined on a site-by-site basis, using the maps as an indicator of overlaps between rainfall and park space. A few notable parks that show potentially large areas of influence of rainfall flooding include:
- Copeland Park
- Al Lopez Park
- The Keene Parcel
- Cotanchobee Park
- The north end of Bayshore Linear Park
- Foster Park
- Parks along the Hillsborough River
Outreach during the vulnerability assessment revealed that access to Picnic Island is cut off from moderate storms, currently.
Storm Surge
Storm surge, like rainfall, would cause temporary inundation of park space but with saltwater instead of freshwater. Park components can also be impacted by the force of wave energy passing through, especially impacting light infrastructure such as trash cans and benches.
The extent of flooding from storm surge is widespread and includes areas of Rocky Point, Westshore, South Tampa, Ballast Point, Bayshore Boulevard, Davis Islands, Harbour Island, Channelside, Palmetto Beach, and along the Hillsborough River.
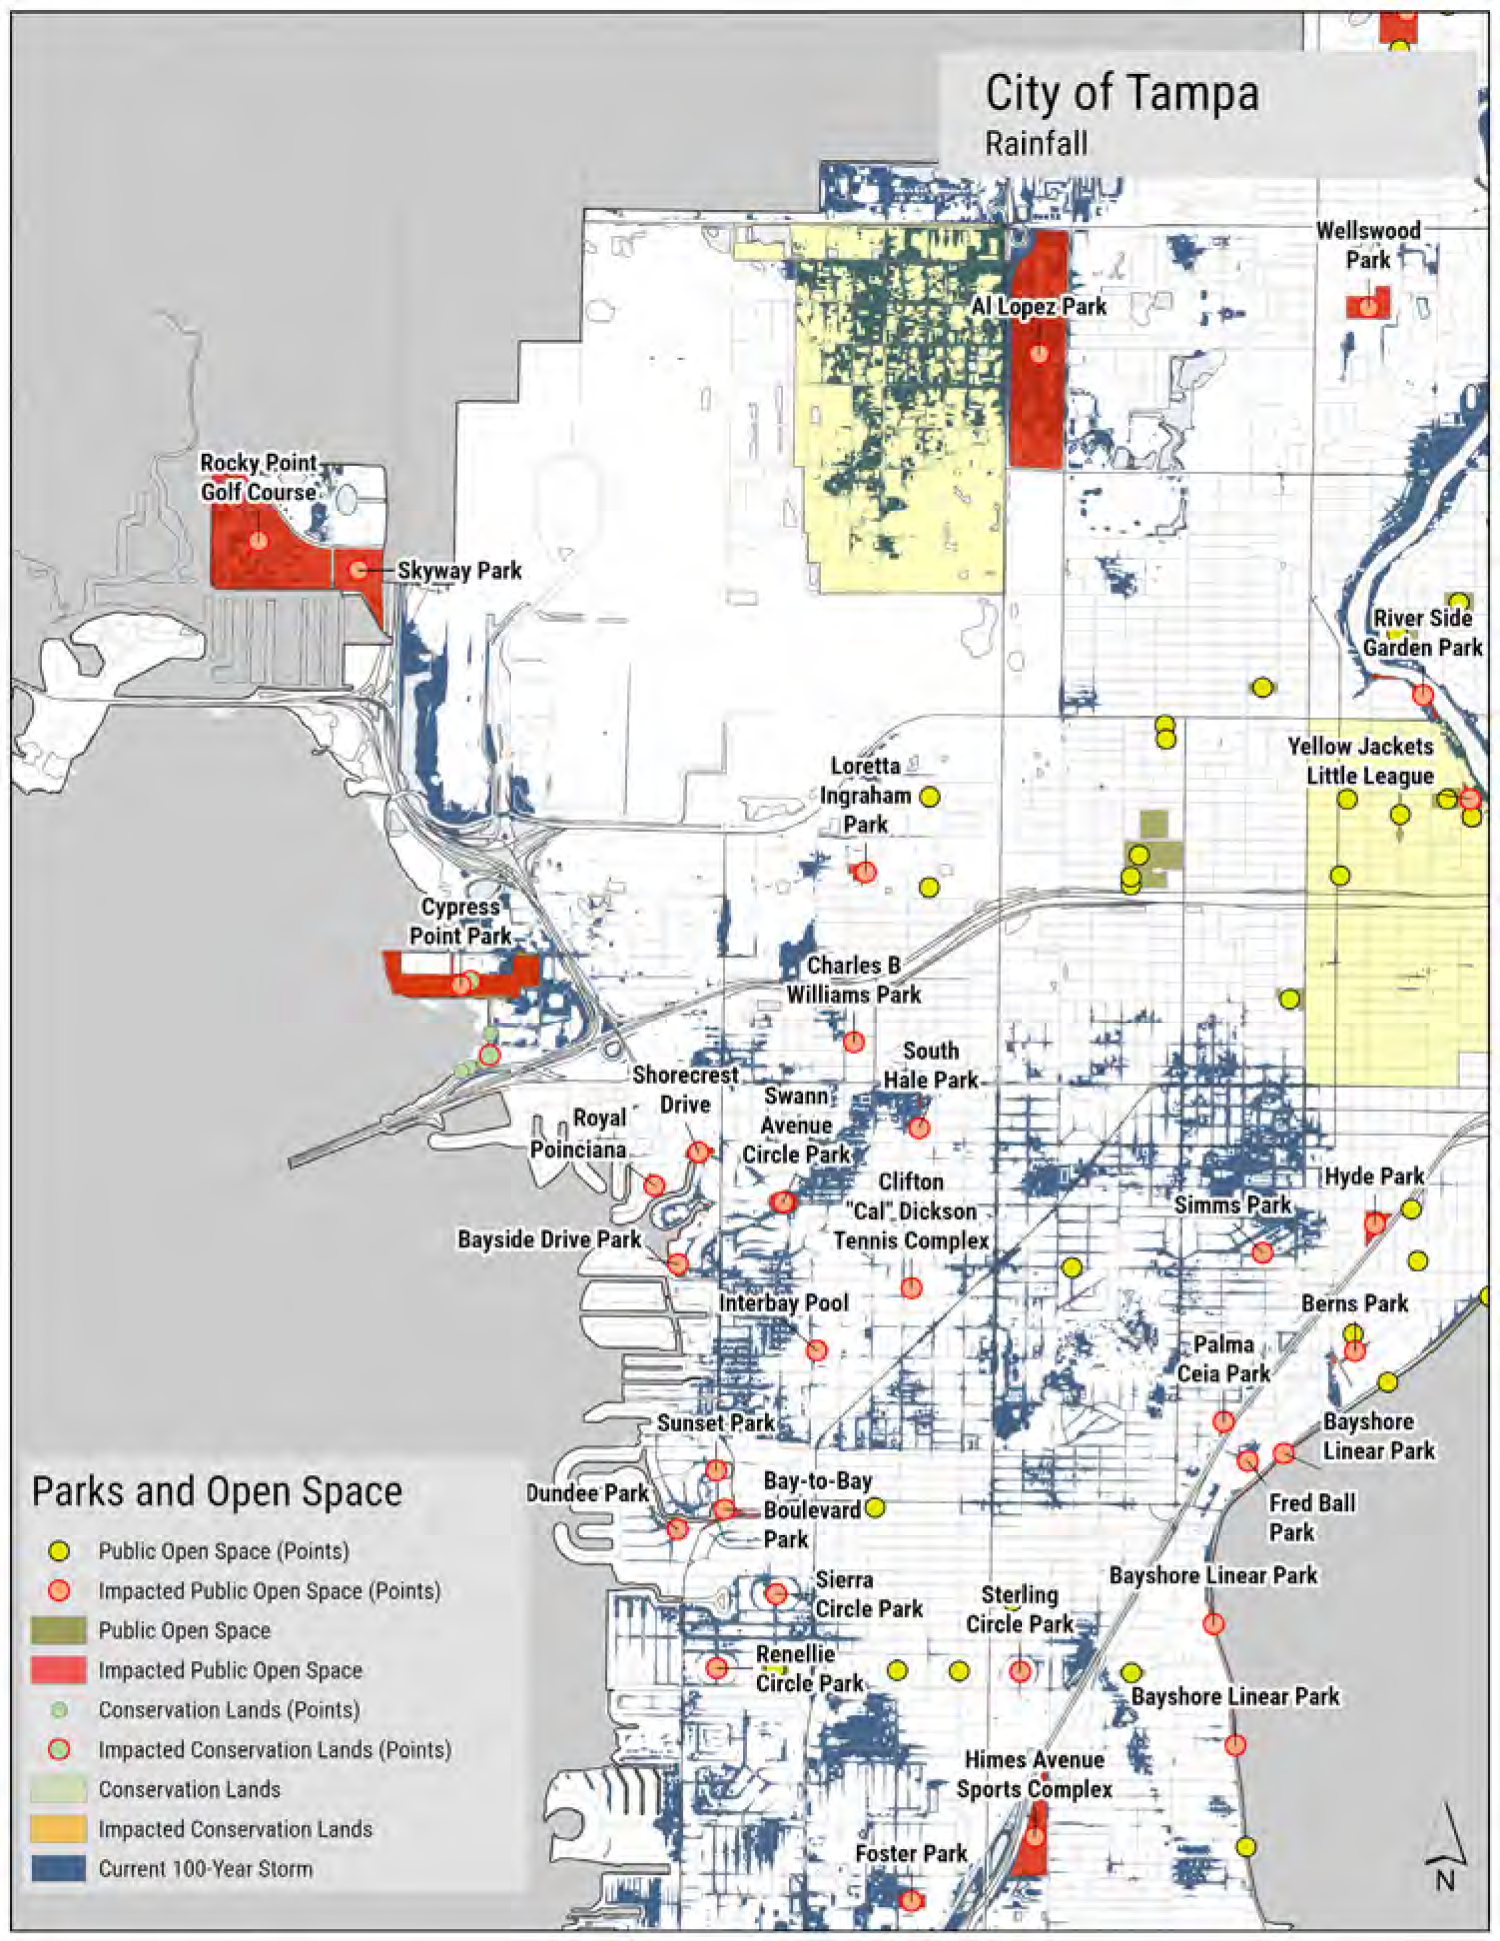
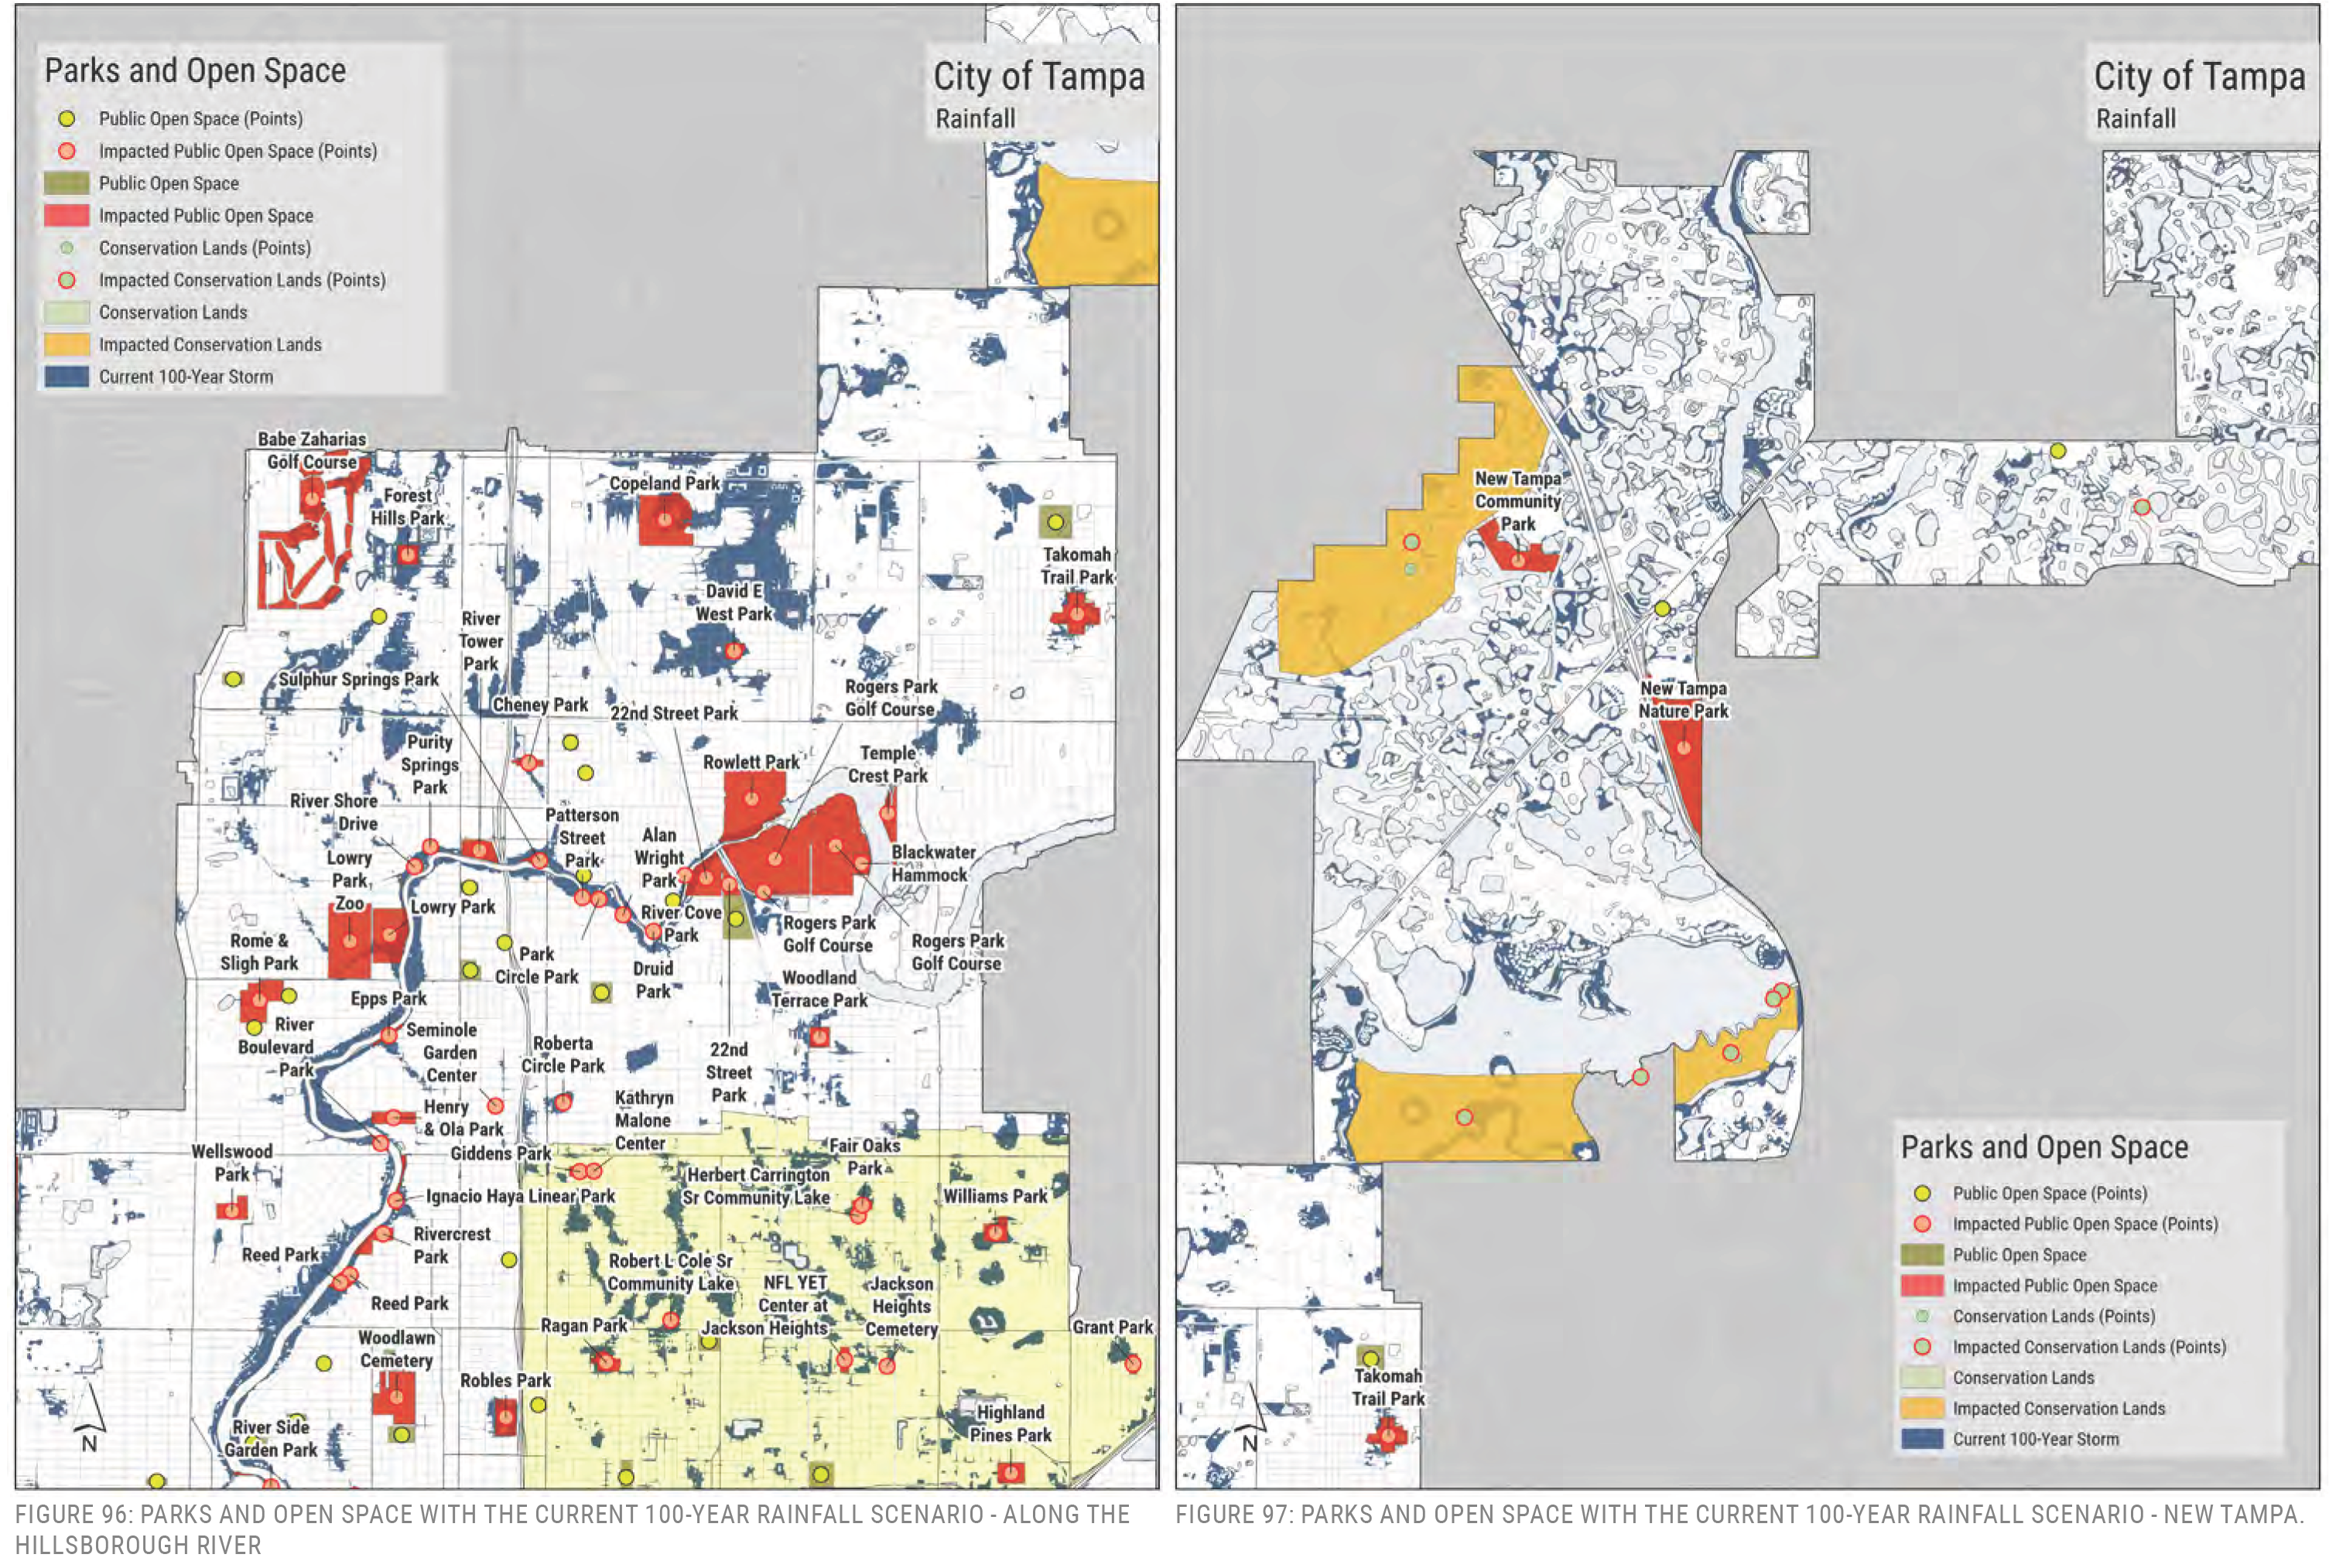
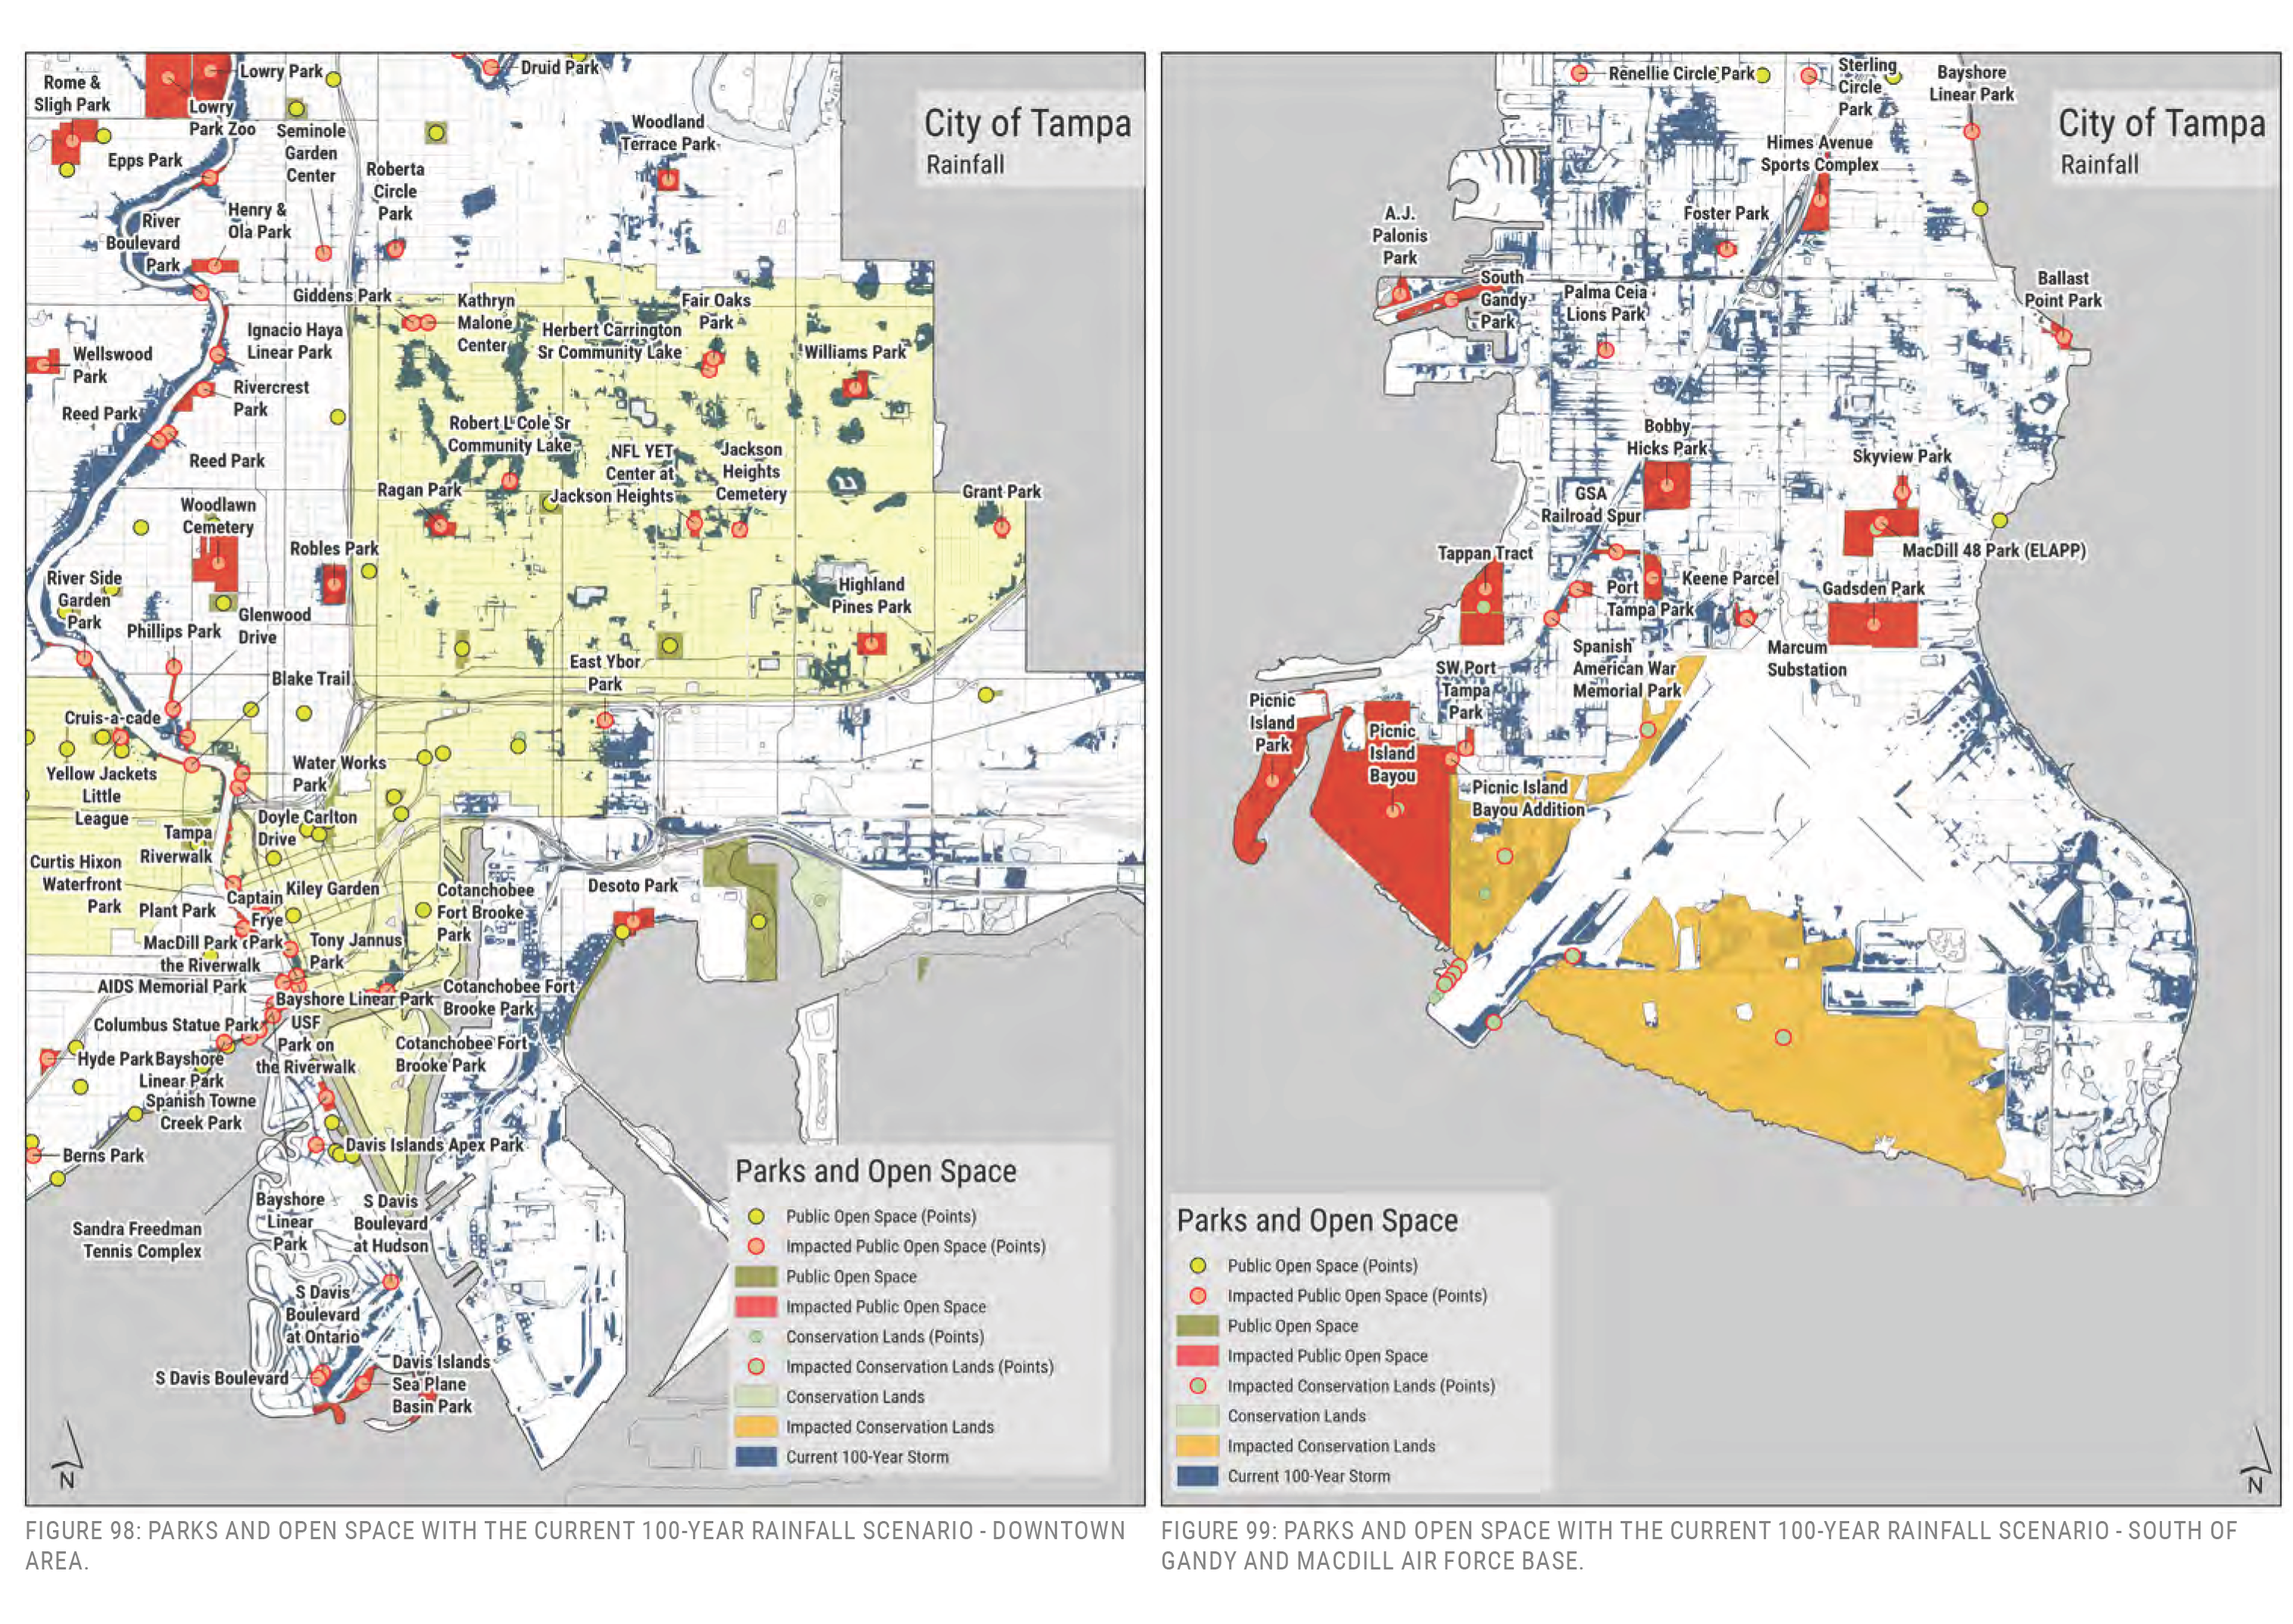
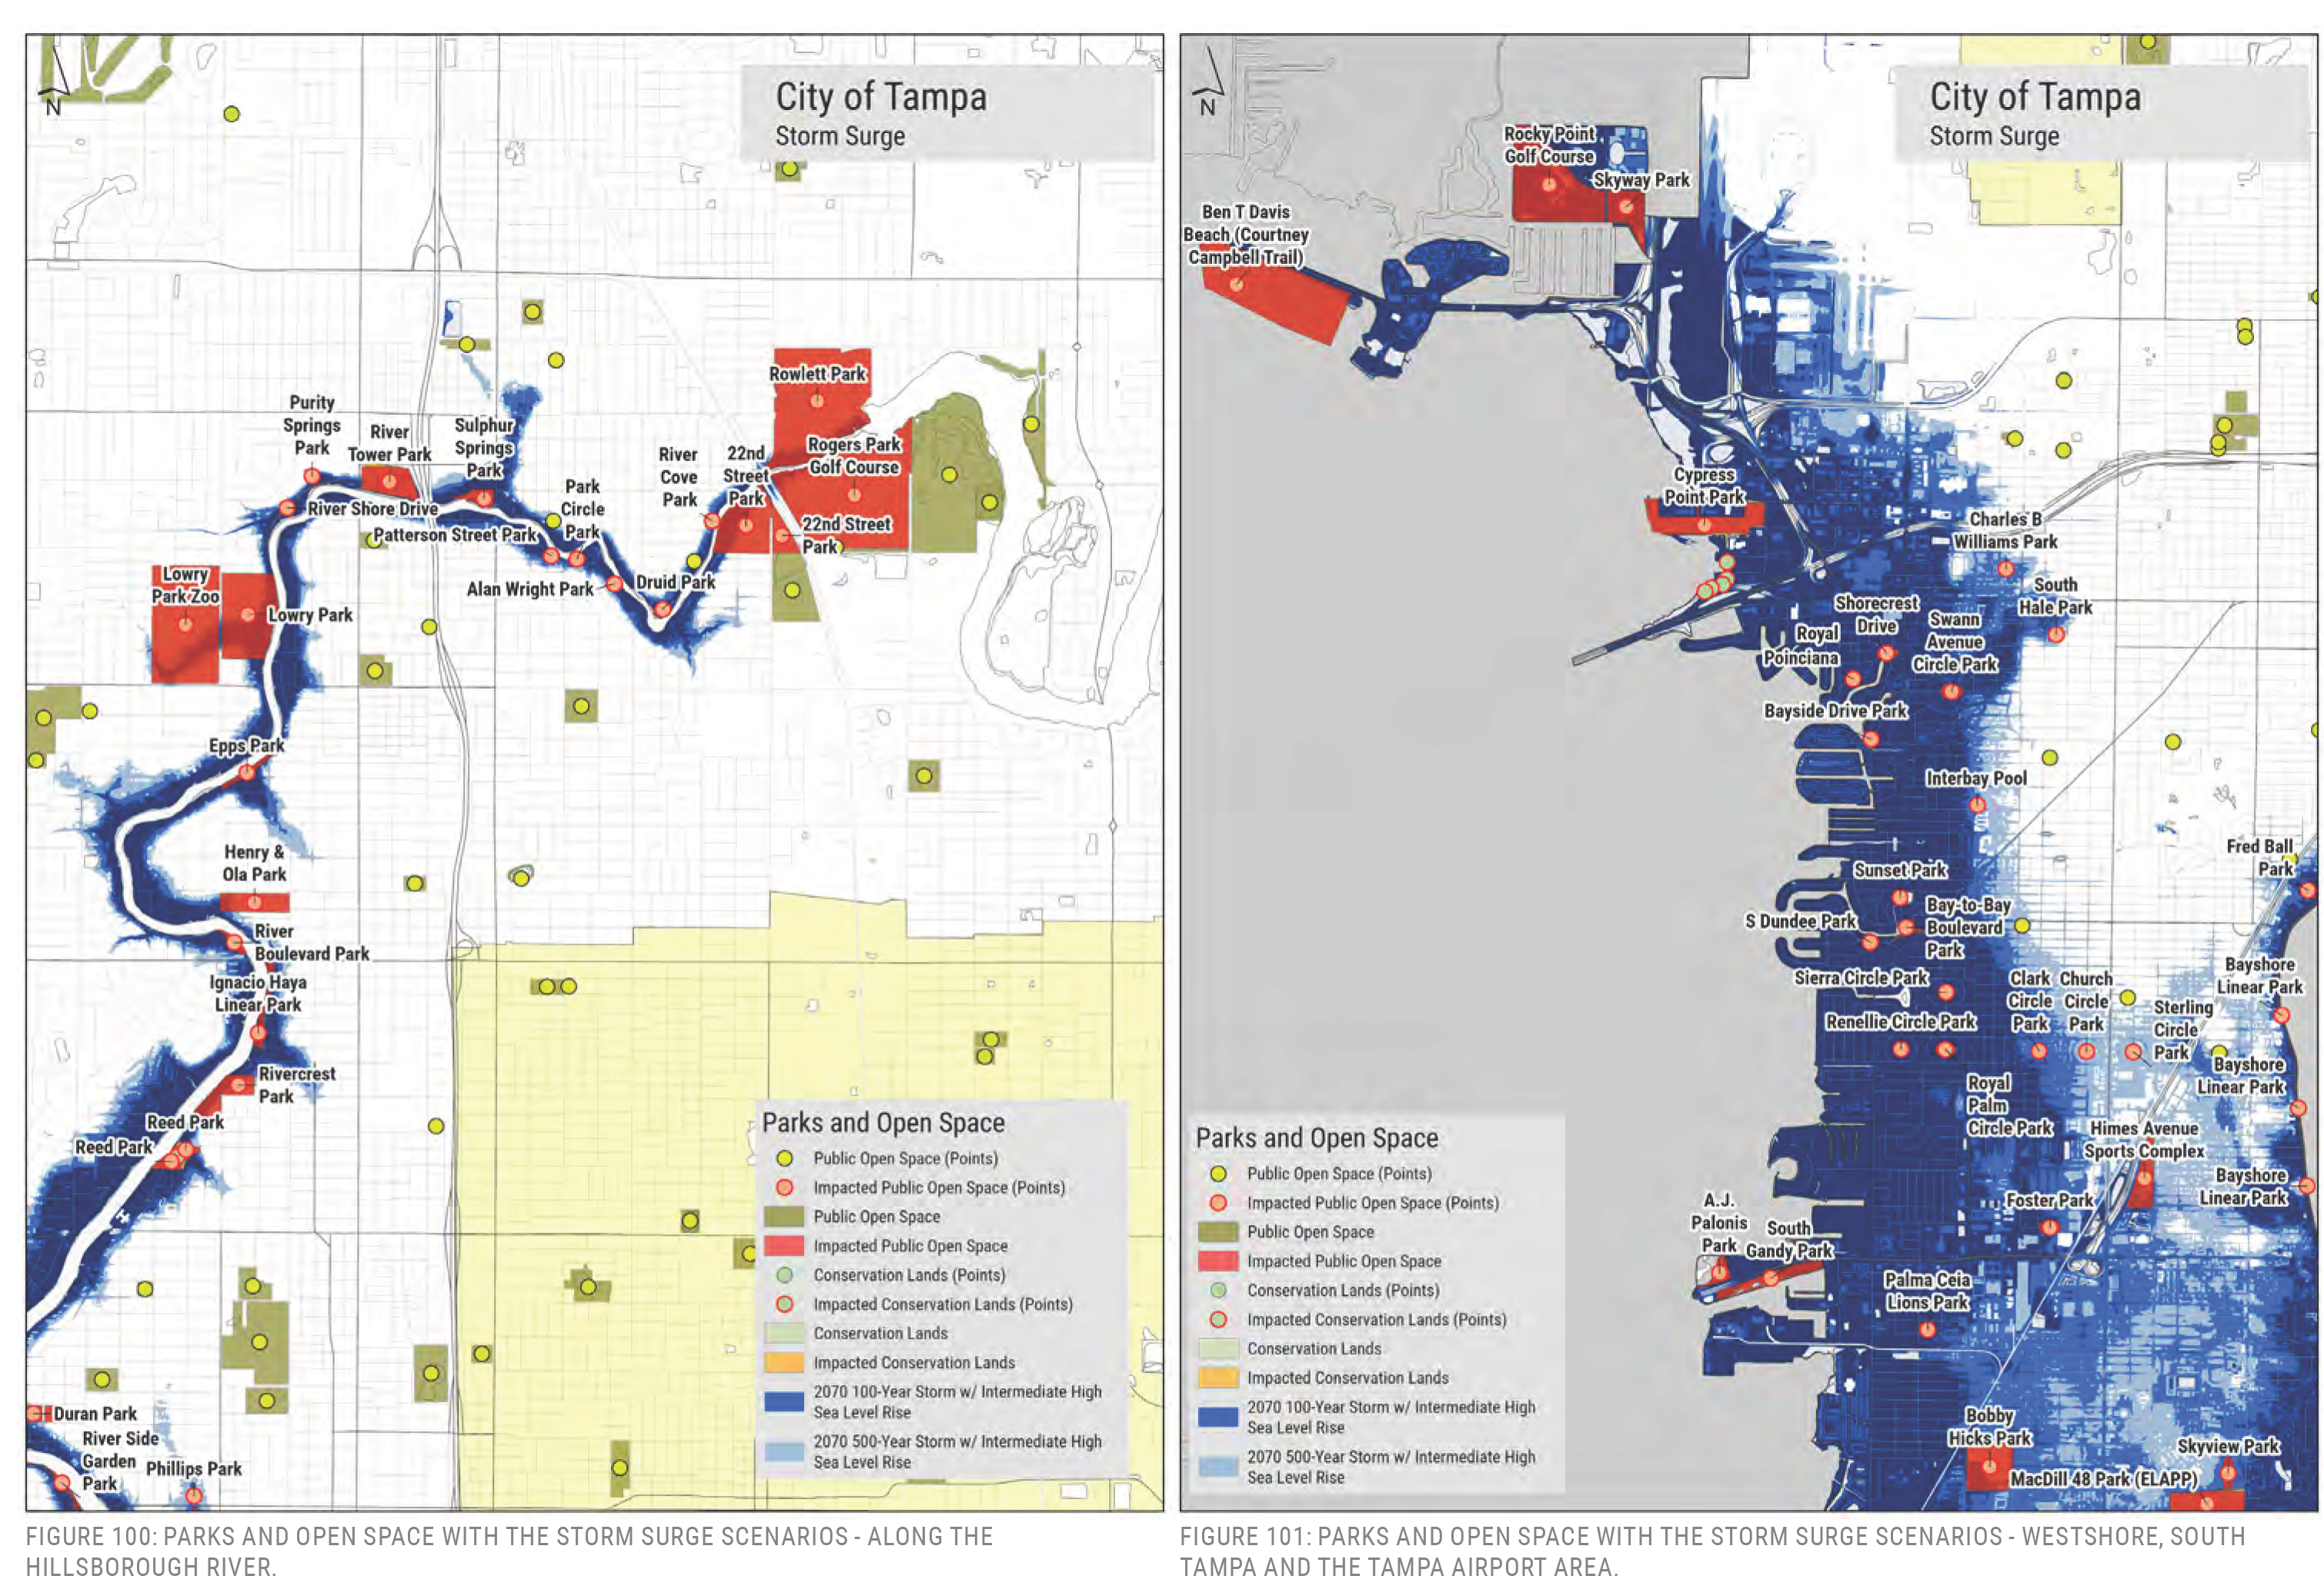
FIGURE 101: PARKS AND OPEN SPACE WITH THE STORM SURGE SCENARIOS-WESTSHORE, SOUTH TAMPA AND THE TAMPA AIRPORT AREA.
City of Tampa Storm Surge Parks and Open Space Public Open Space (Points) Impacted Public Open Space (Points) Public Open Space Impacted Public Open Space Conservation Lands (Points) Impacted Conservation Lands (Points) Conservation Lands Impacted Conservation Lands 27° 100-Year Storm w/ Intermediate High Sea Level Rise 2070 500-Year Storm w/ Intermediate High Sea Level Rise
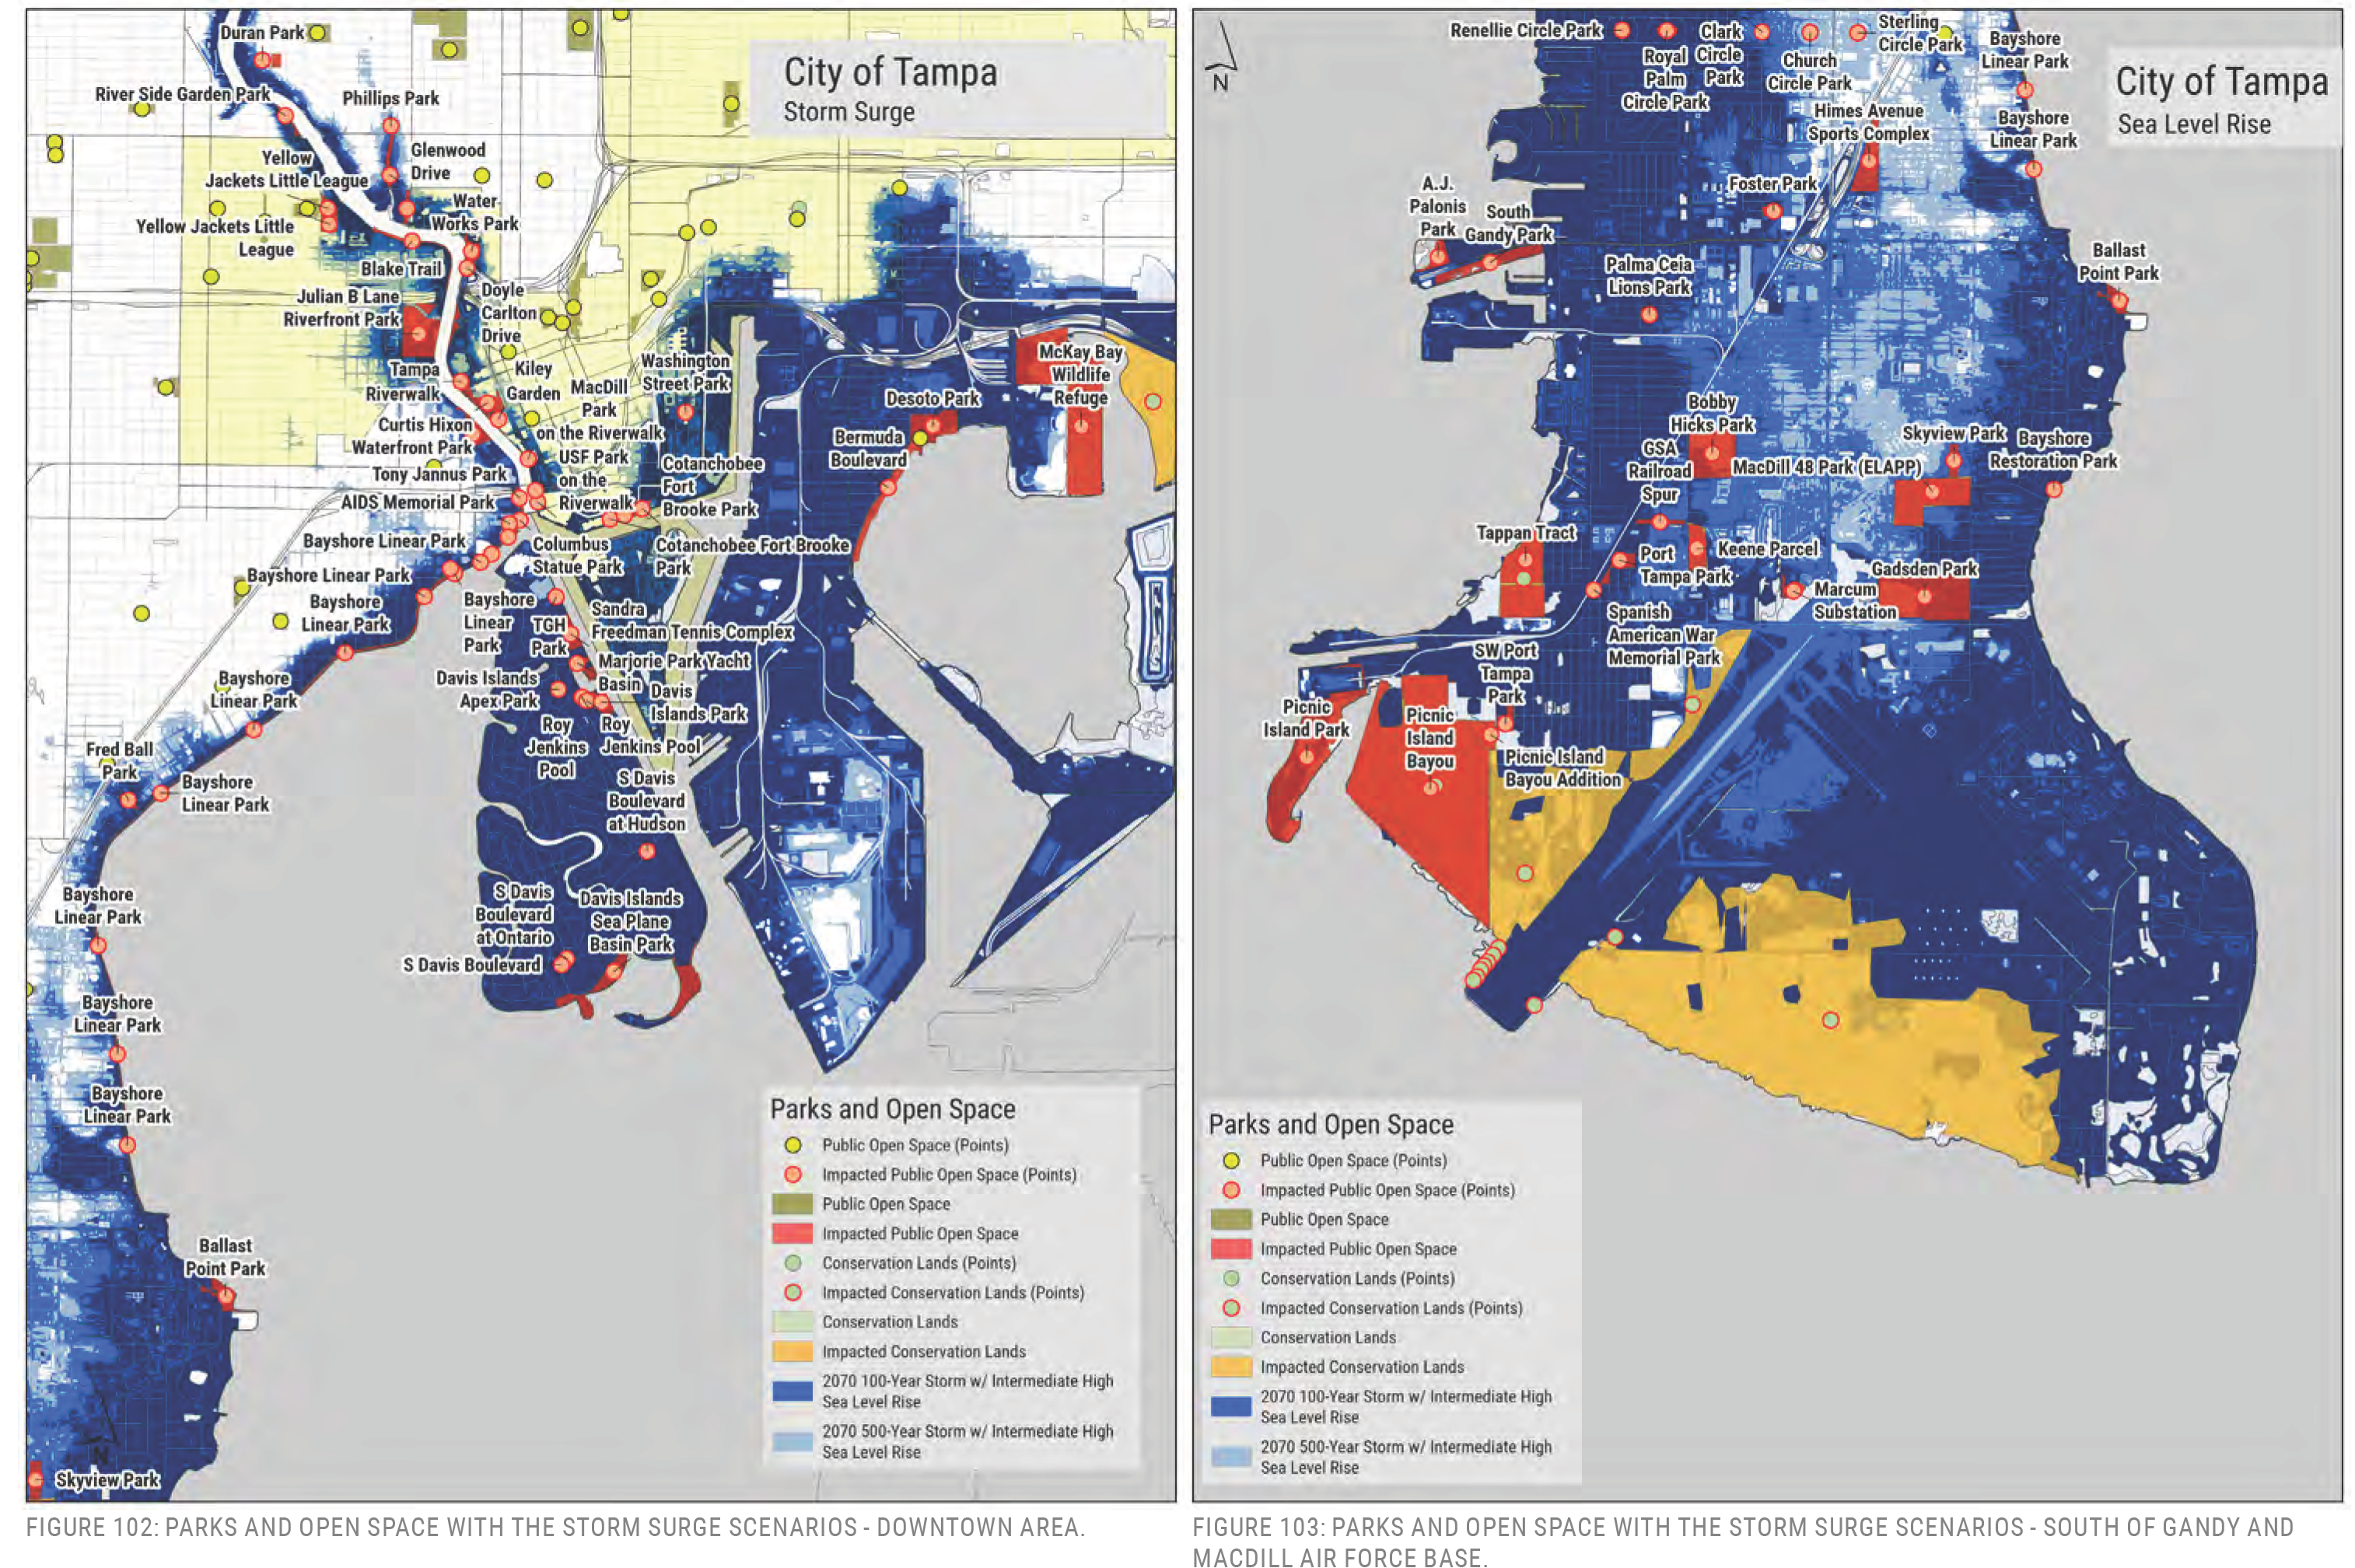
River,' 0 City of Tampa Storm Surge Parks and Open Space � Public Open Space (Points) I1 © Impacted Public Open Space (Points) [ Public Open Space ■ Impacted Public Open Space � Conservation Lands (Points) � Impacted Conservation Lands (Points) Conservation Lands Impacted Conservation Lands ■ 2,22322"�wm««on 2070 500-Year Storm w/ Intermediate High Sea Level Rise
FIGURE 102: PARKS AND OPEN SPACE WITH THE STORM SURGE SCENARIOS-DOWNTOWN AREA.
A.J. Parks and Open Space O Public Open Space (Points) � Impacted Public Open Space (Points) Public Open Space l Impacted Public Open Space � Conservation Lands (Points) � Impacted Conservation Lands (Points) Conservation Lands Impacted Conservation Lands ■ 2222222����«mean 2070 500-Year Storm w/ Intermediate High Sea Level Rise re City of Tampa Sea Level Rise
FIGURE 103: PARKS AND OPEN SPACE WITH THE STORM SURGE SCENARIOS-SOUTH OF GANDY AND MACDILL AIR FORCE BASE.
A few facilities were evaluated in closer detail.
Kwane Doster Community Center
7506 South Morton Street
Vulnerabilities:
- Potential Sea Level Rise
- Storm Surge
Location
Sea Level Rise (2040 and 2070 IH)
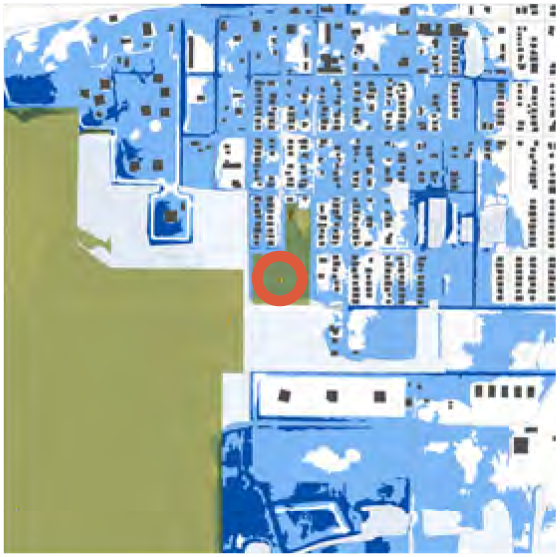
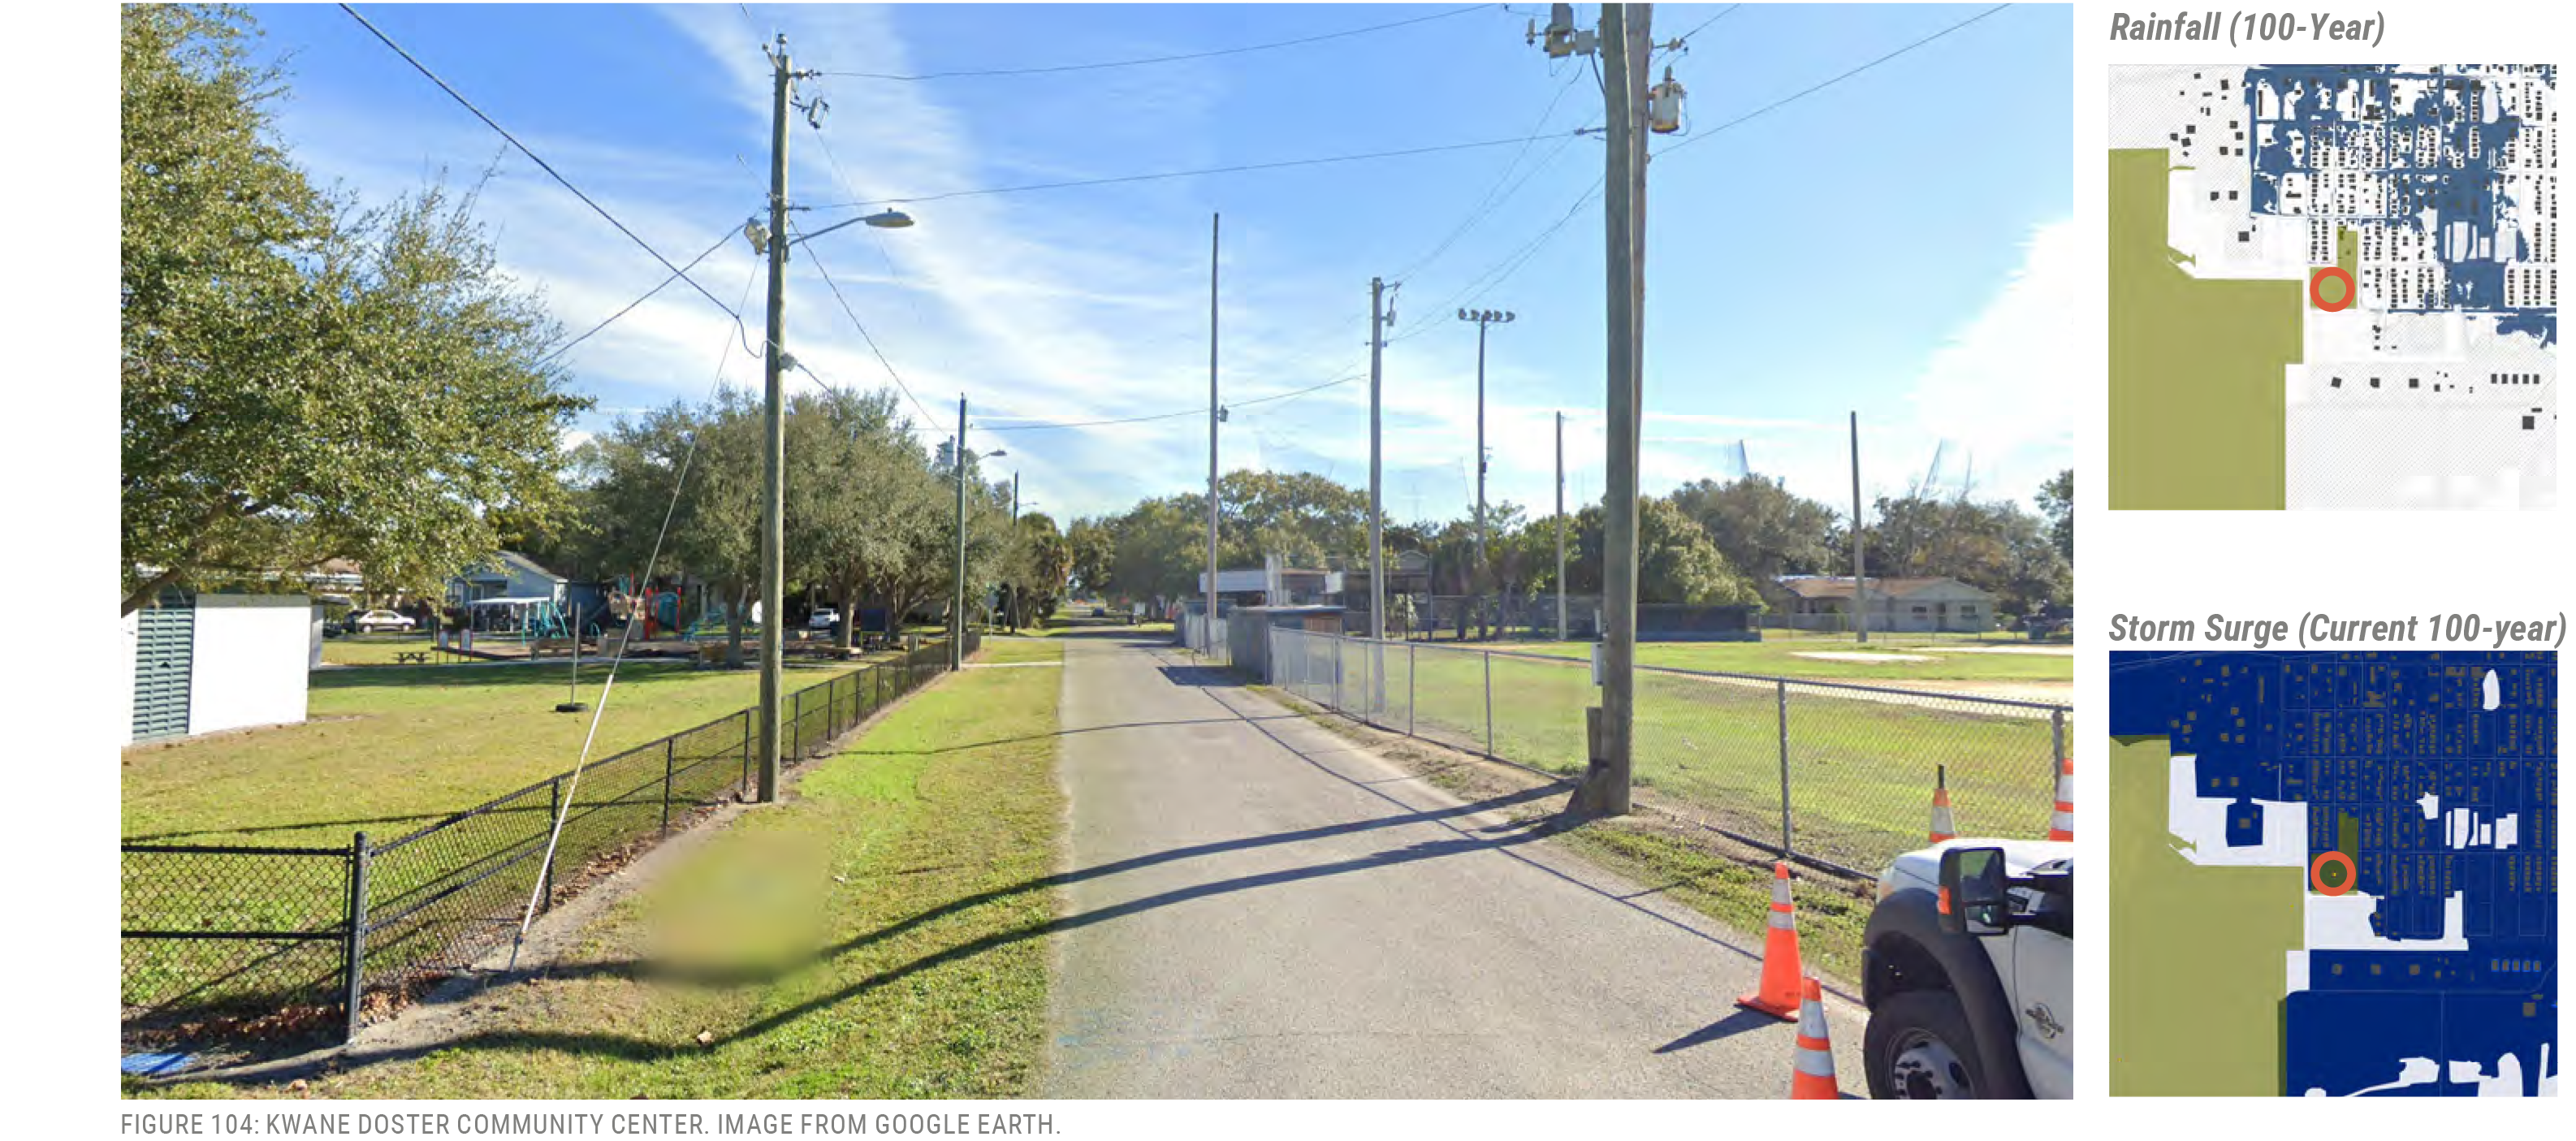
Tappan Tract Park
6601 South Sherrill Street
Vulnerabilities:
- Sea Level Rise
- Storm Surge
Location
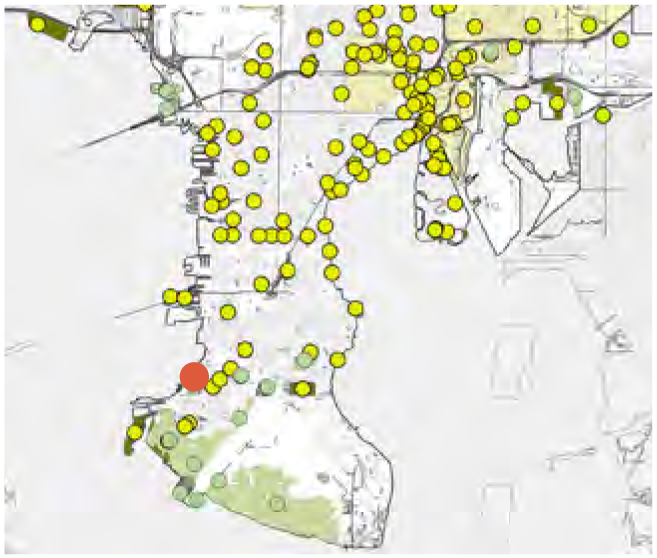
Sea Level Rise (2040 and 2070 IH)
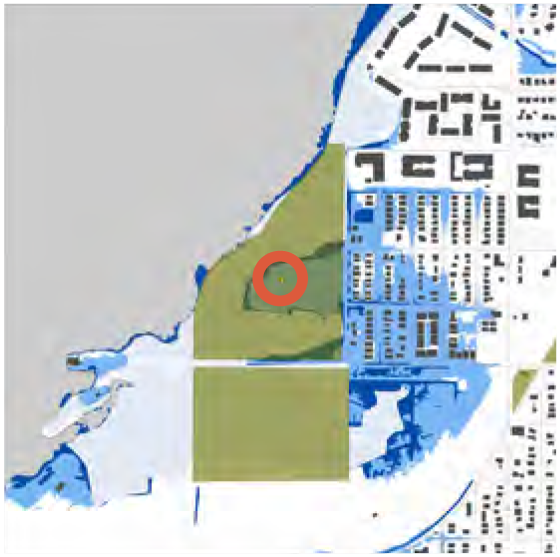
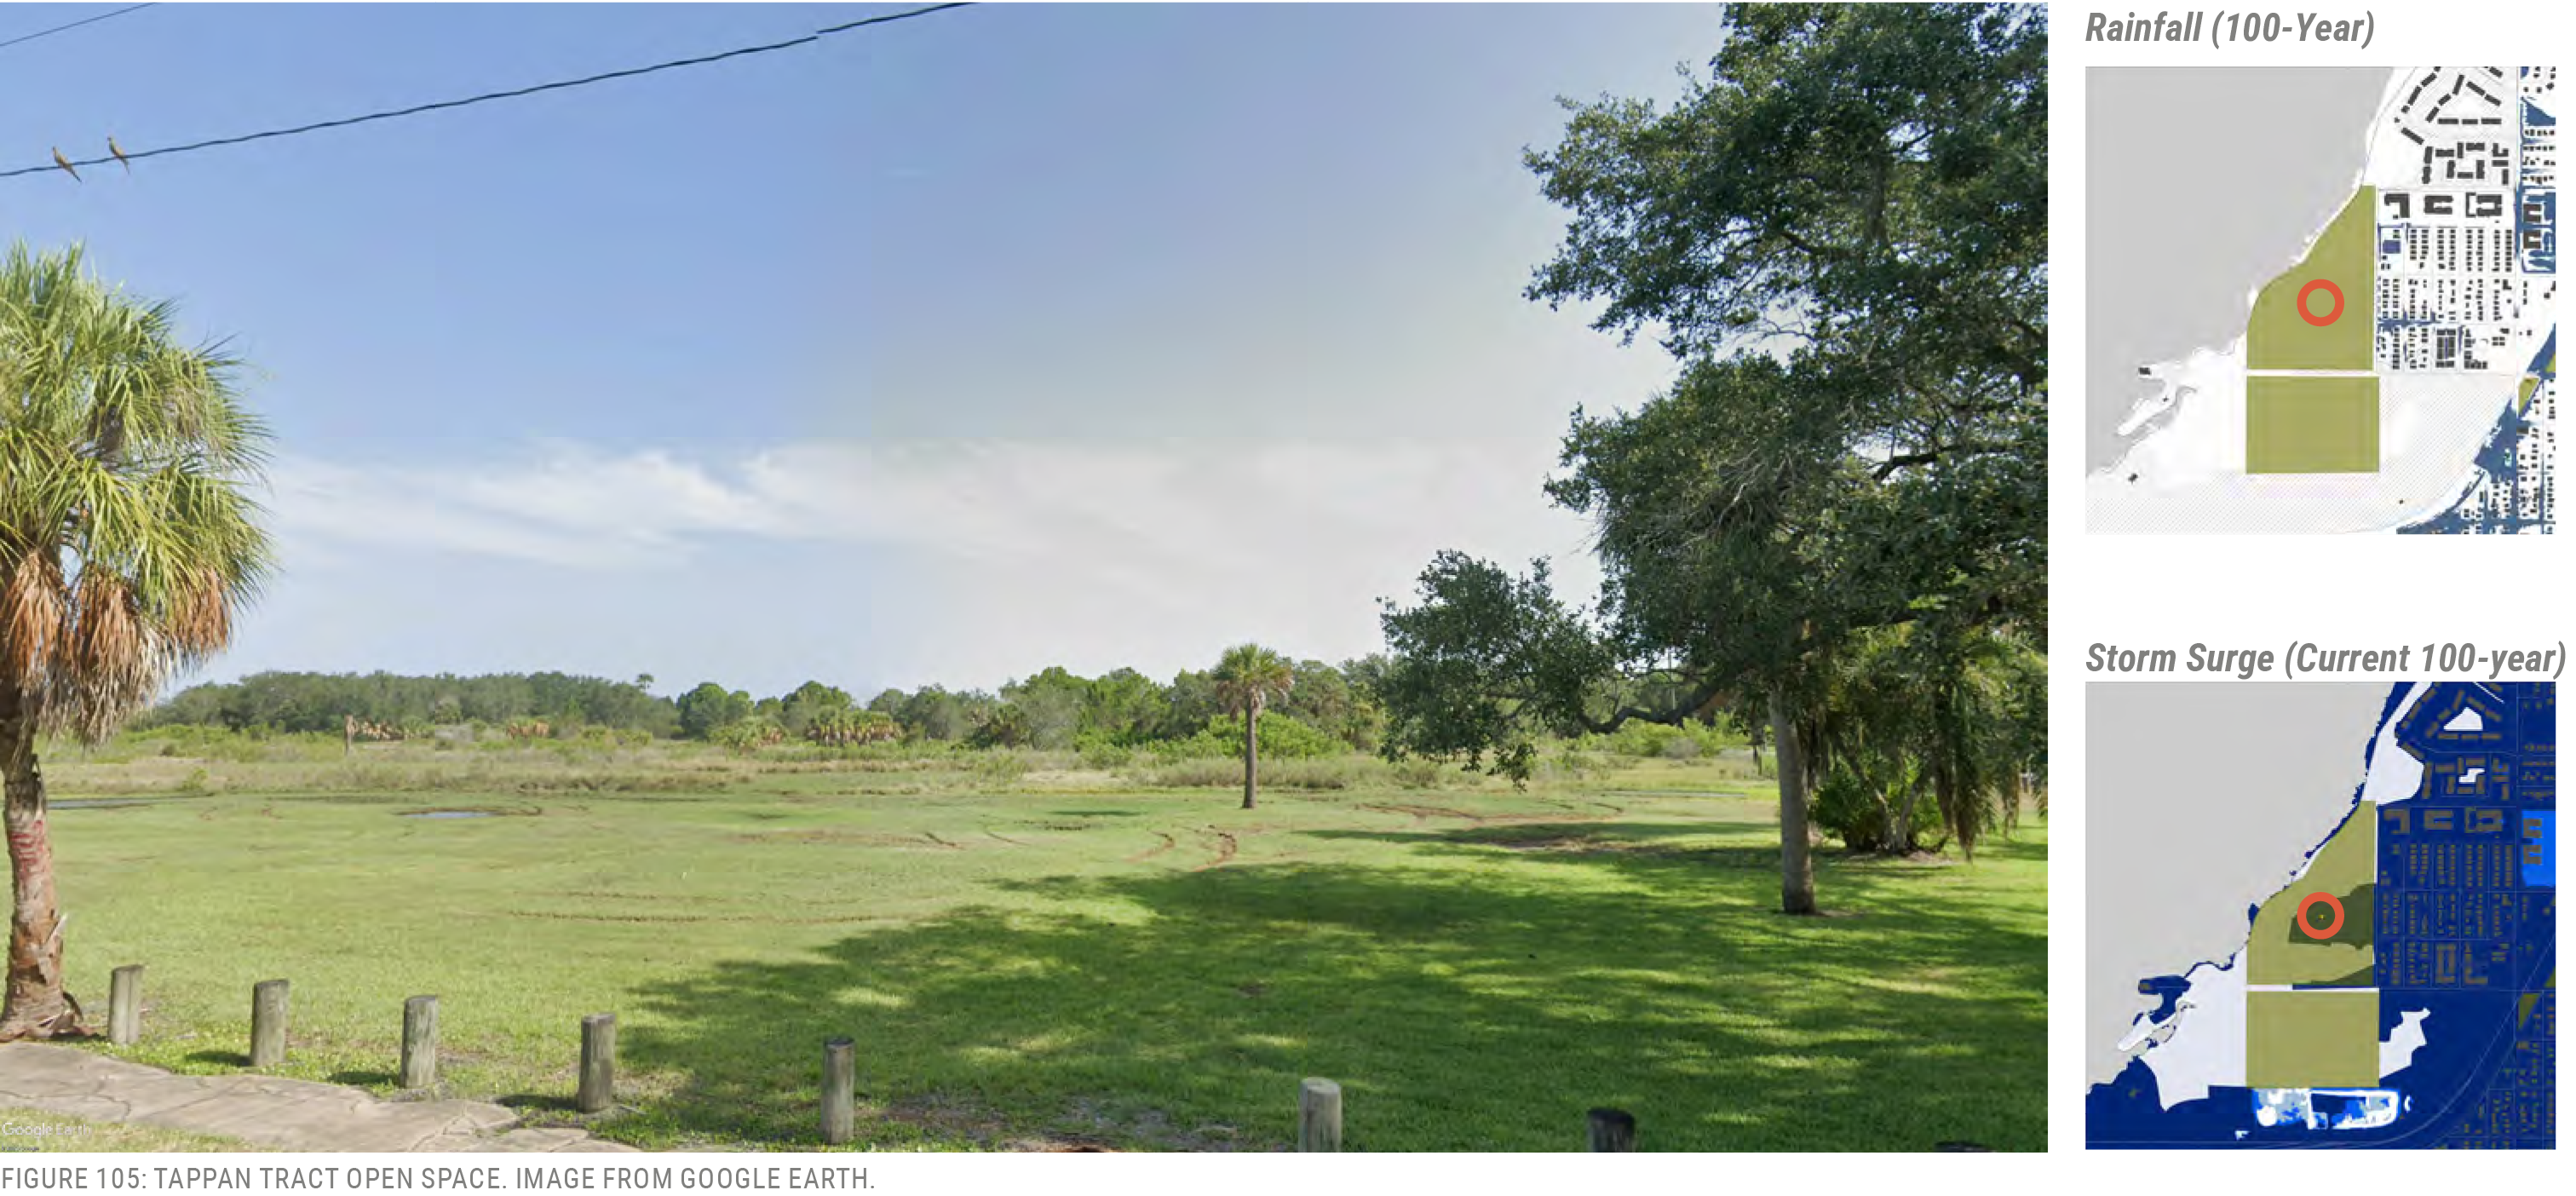
Bobby Hicks Park
4120 West Mango Avenue Park
Vulnerabilities:
- Sea Level Rise
- Rainfall
- Storm Surge
Location
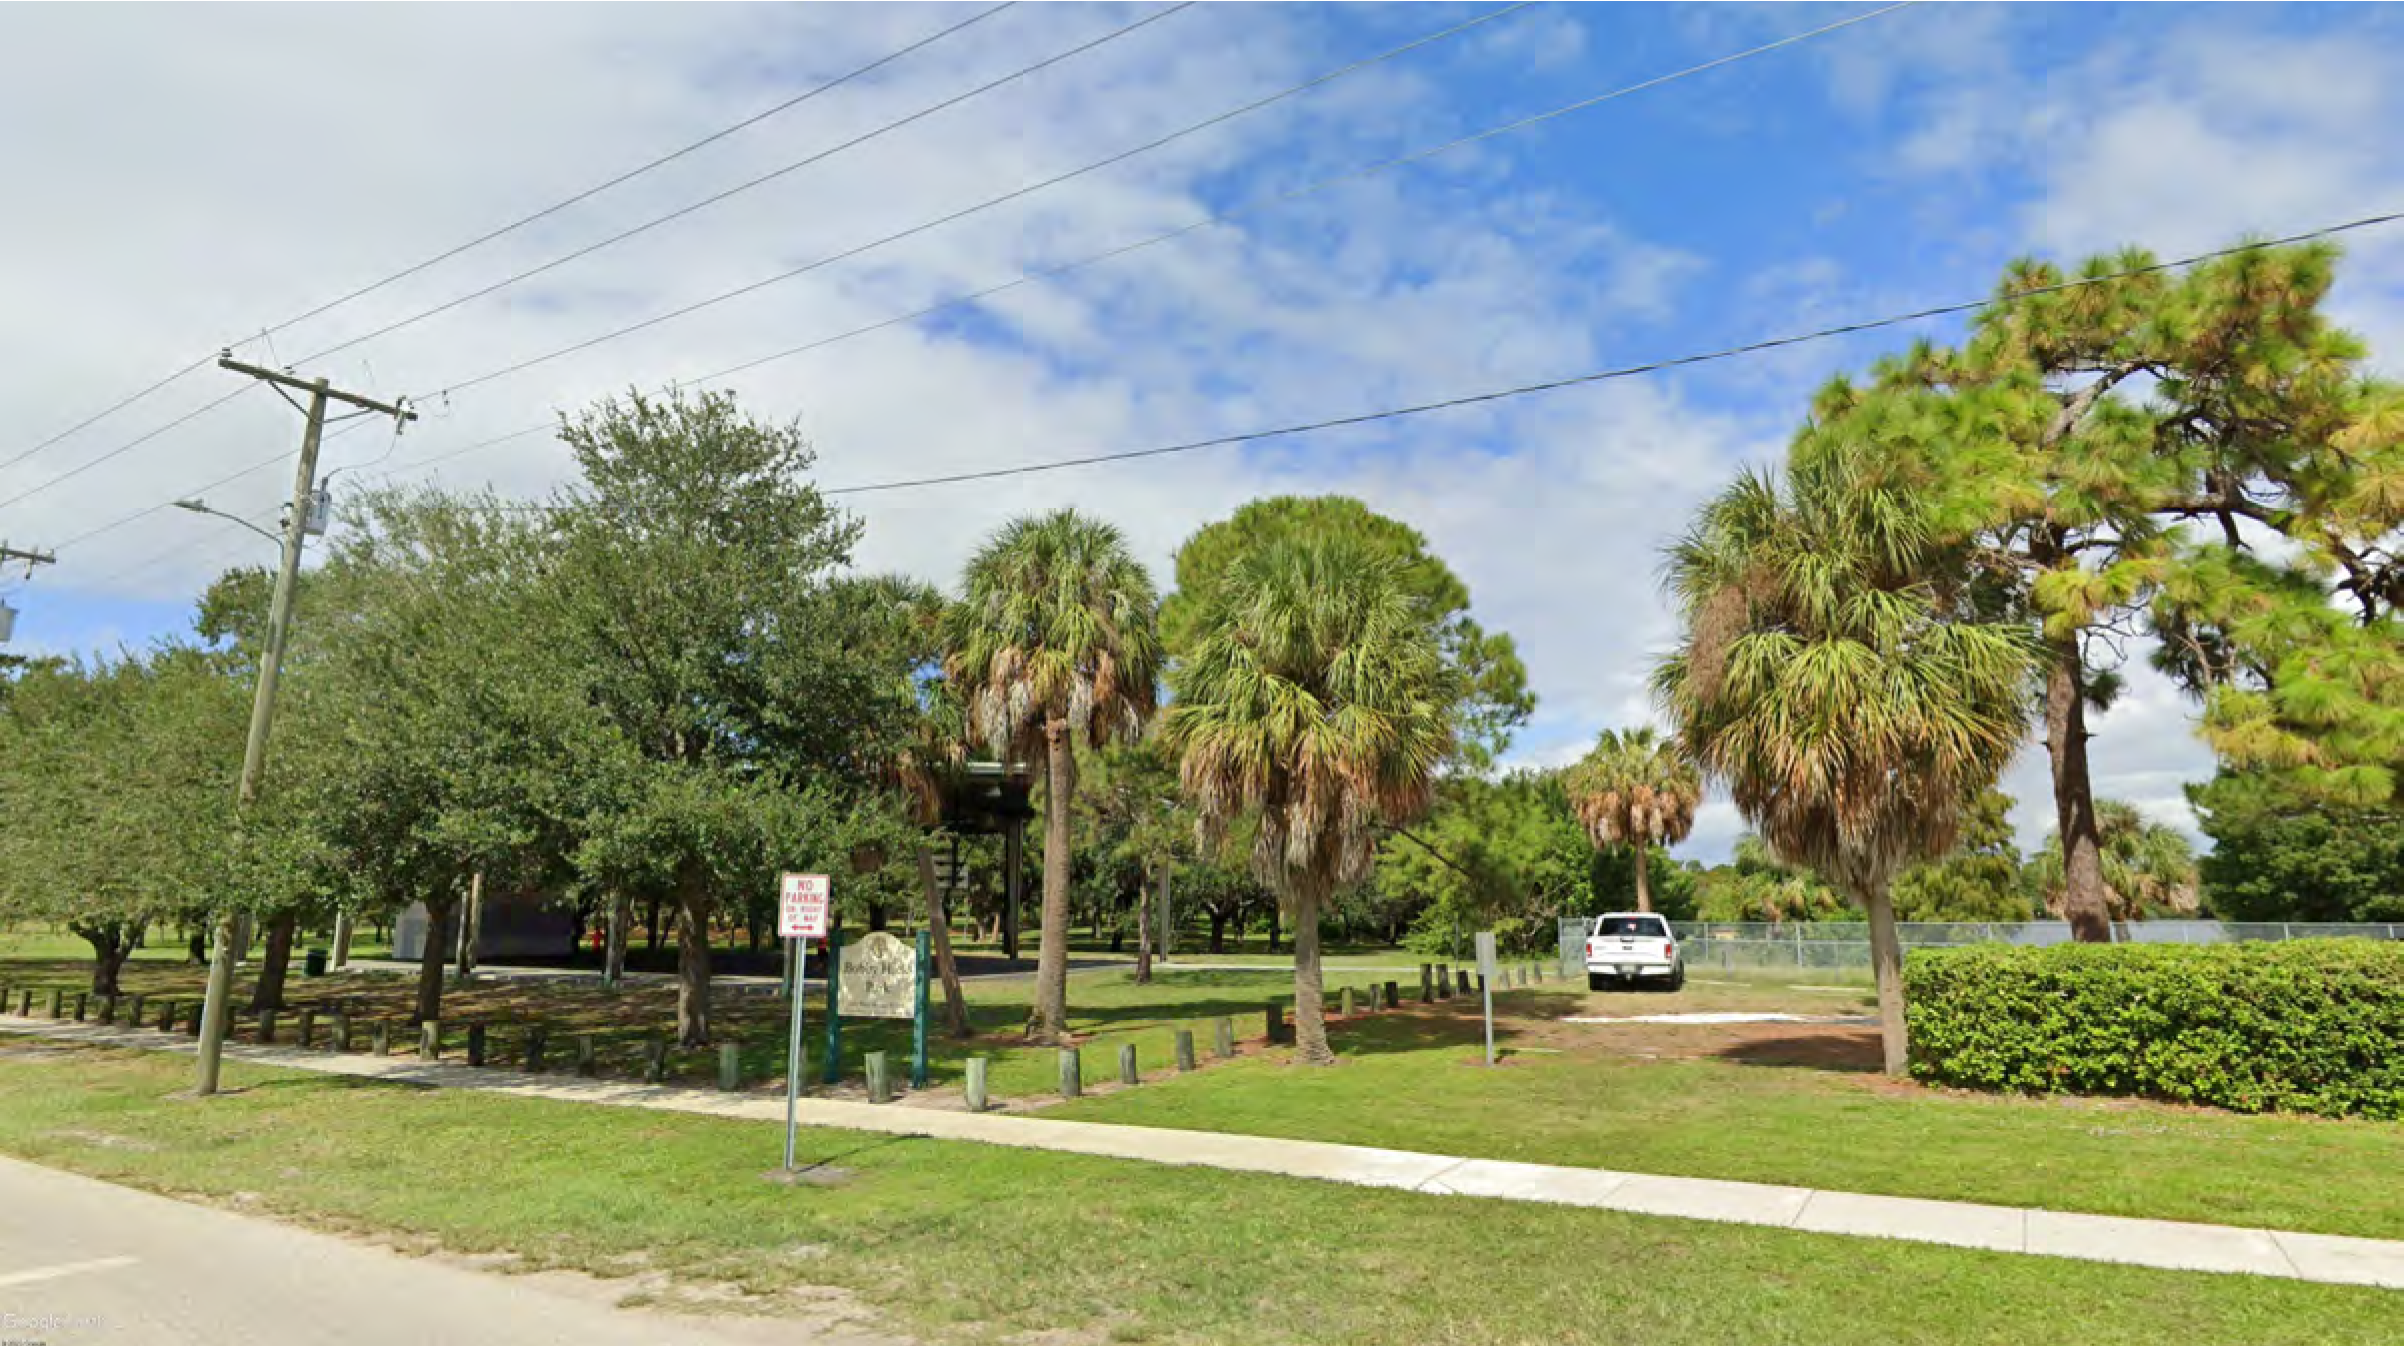
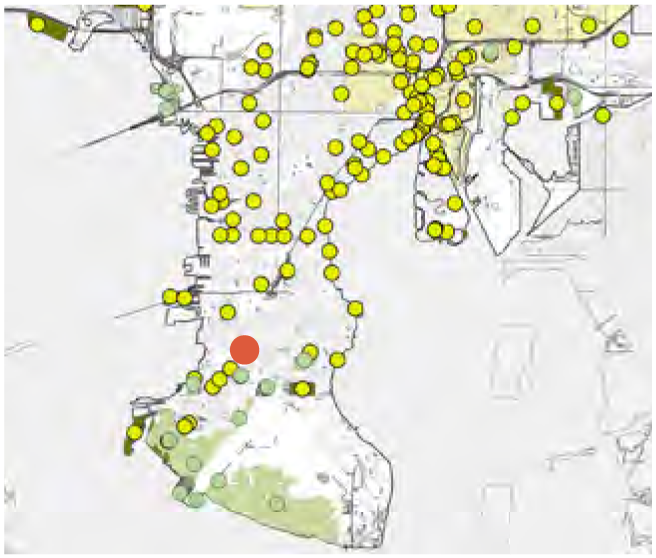
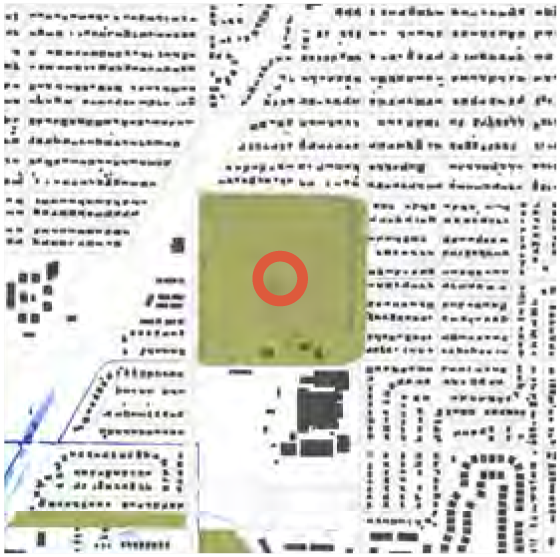
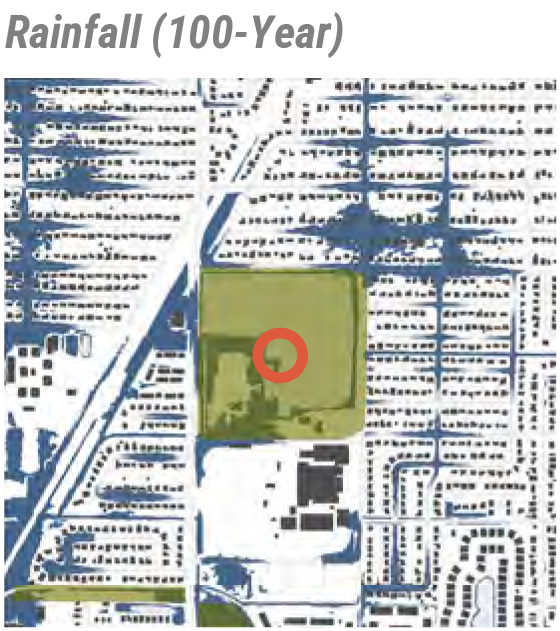 Rainfall (100-Year)
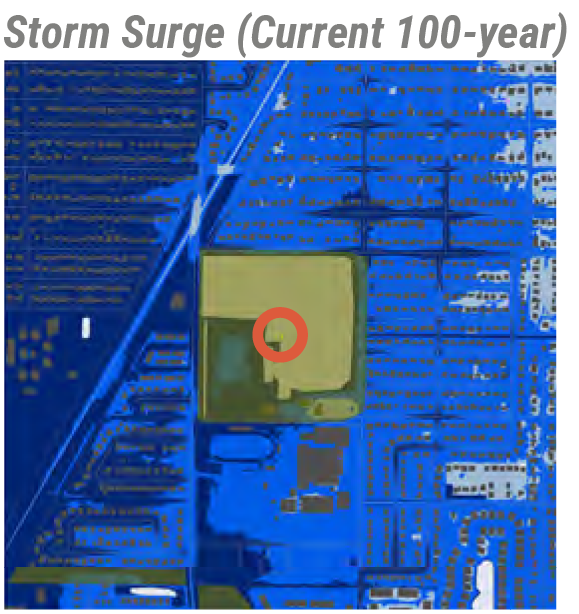 Storm Surge (Current 100-year)
South Gandy Park
5120 West Gandy Boulevard
Vulnerabilities:
- Sea Level Rise
- Storm Surge
Location
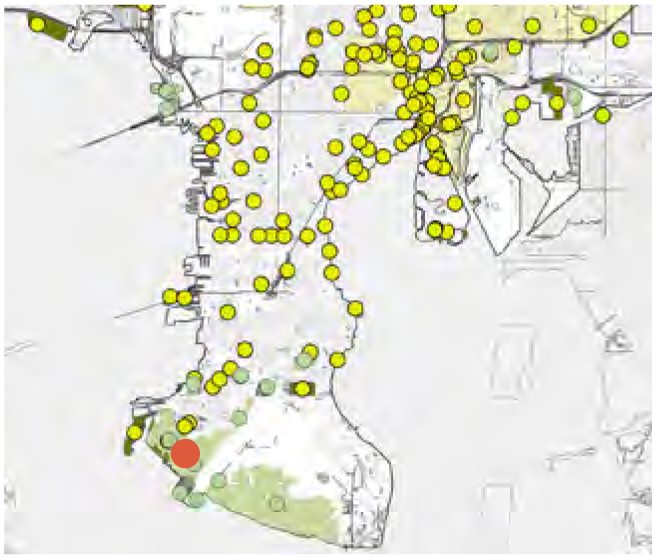
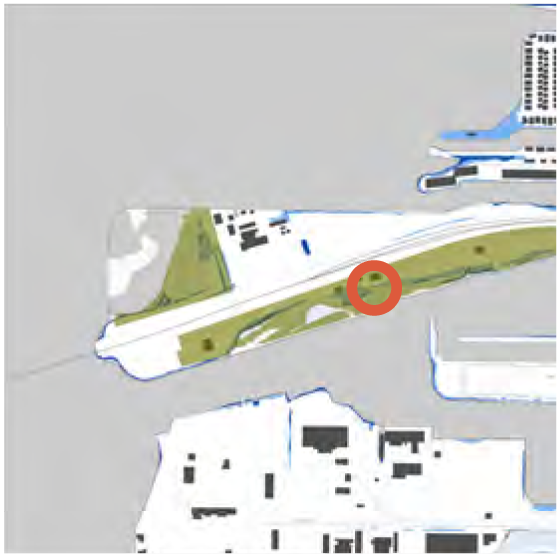
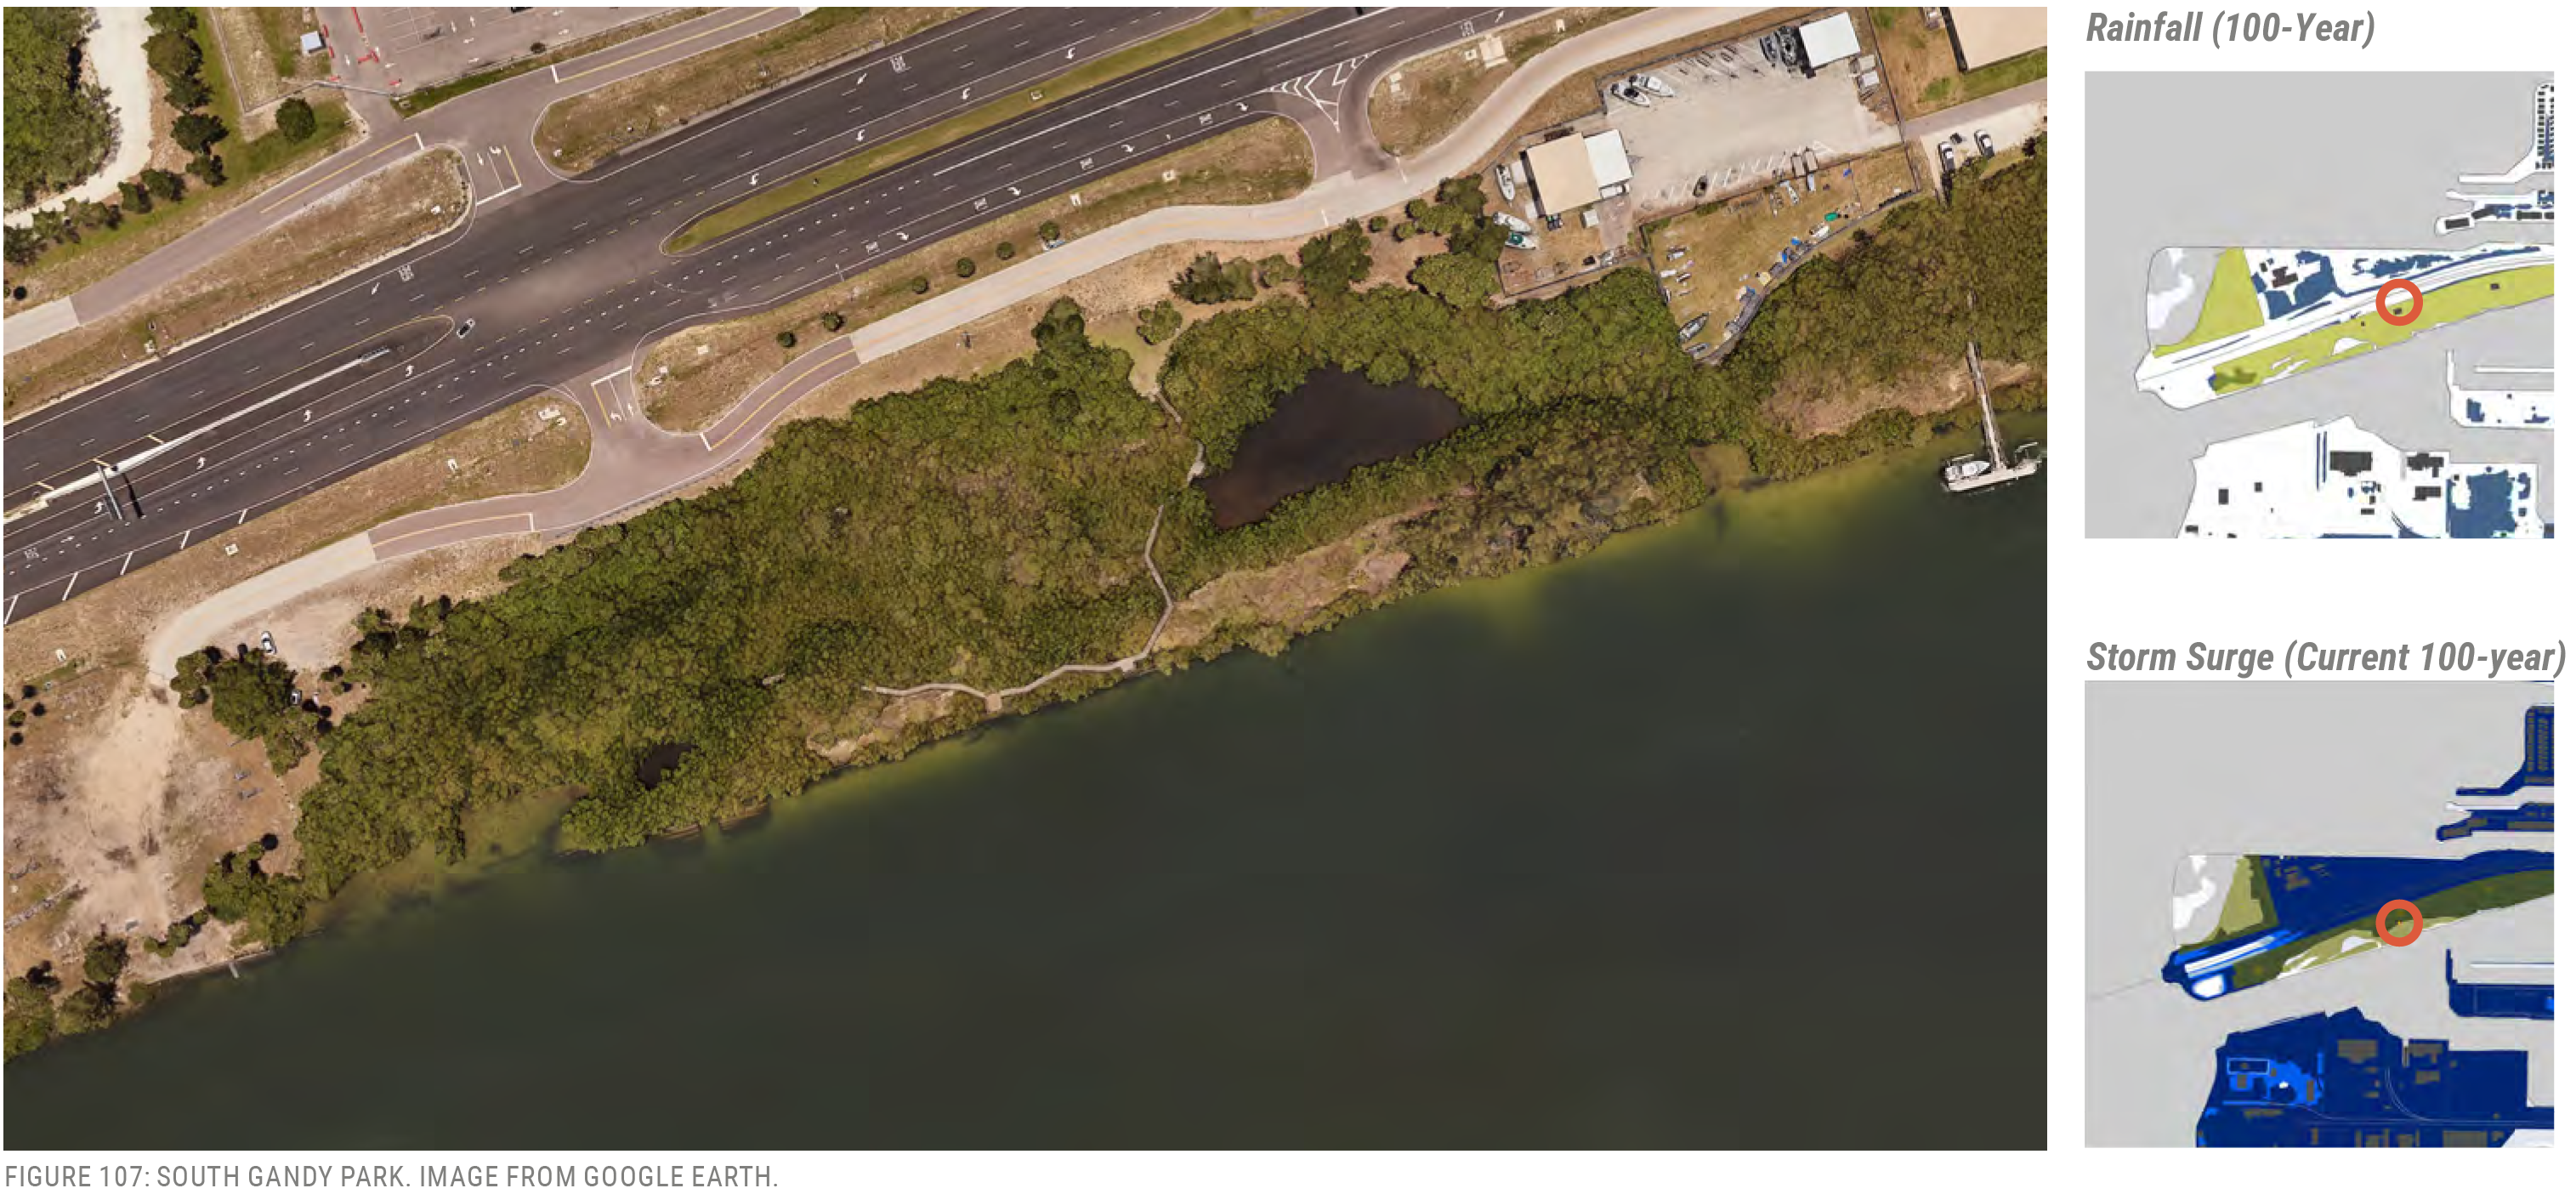
A.J. Palonis Park
5151 West Gandy Boulevard
Vulnerabilities:
- Sea Level Rise
- Storm Surge
Location
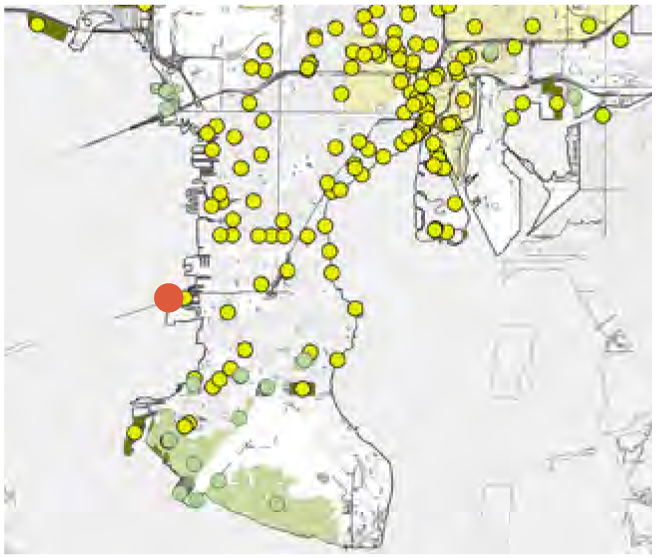
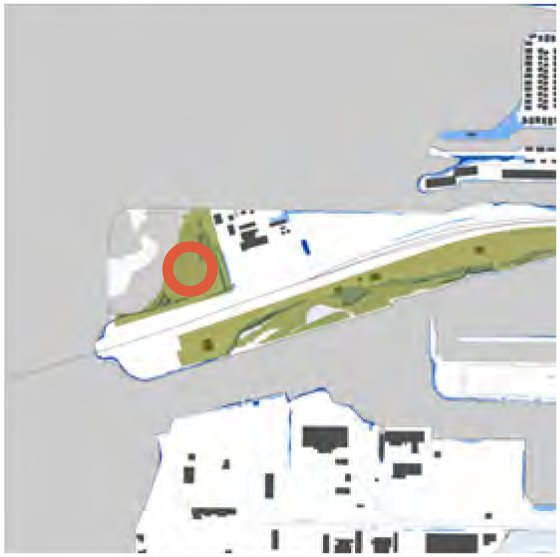
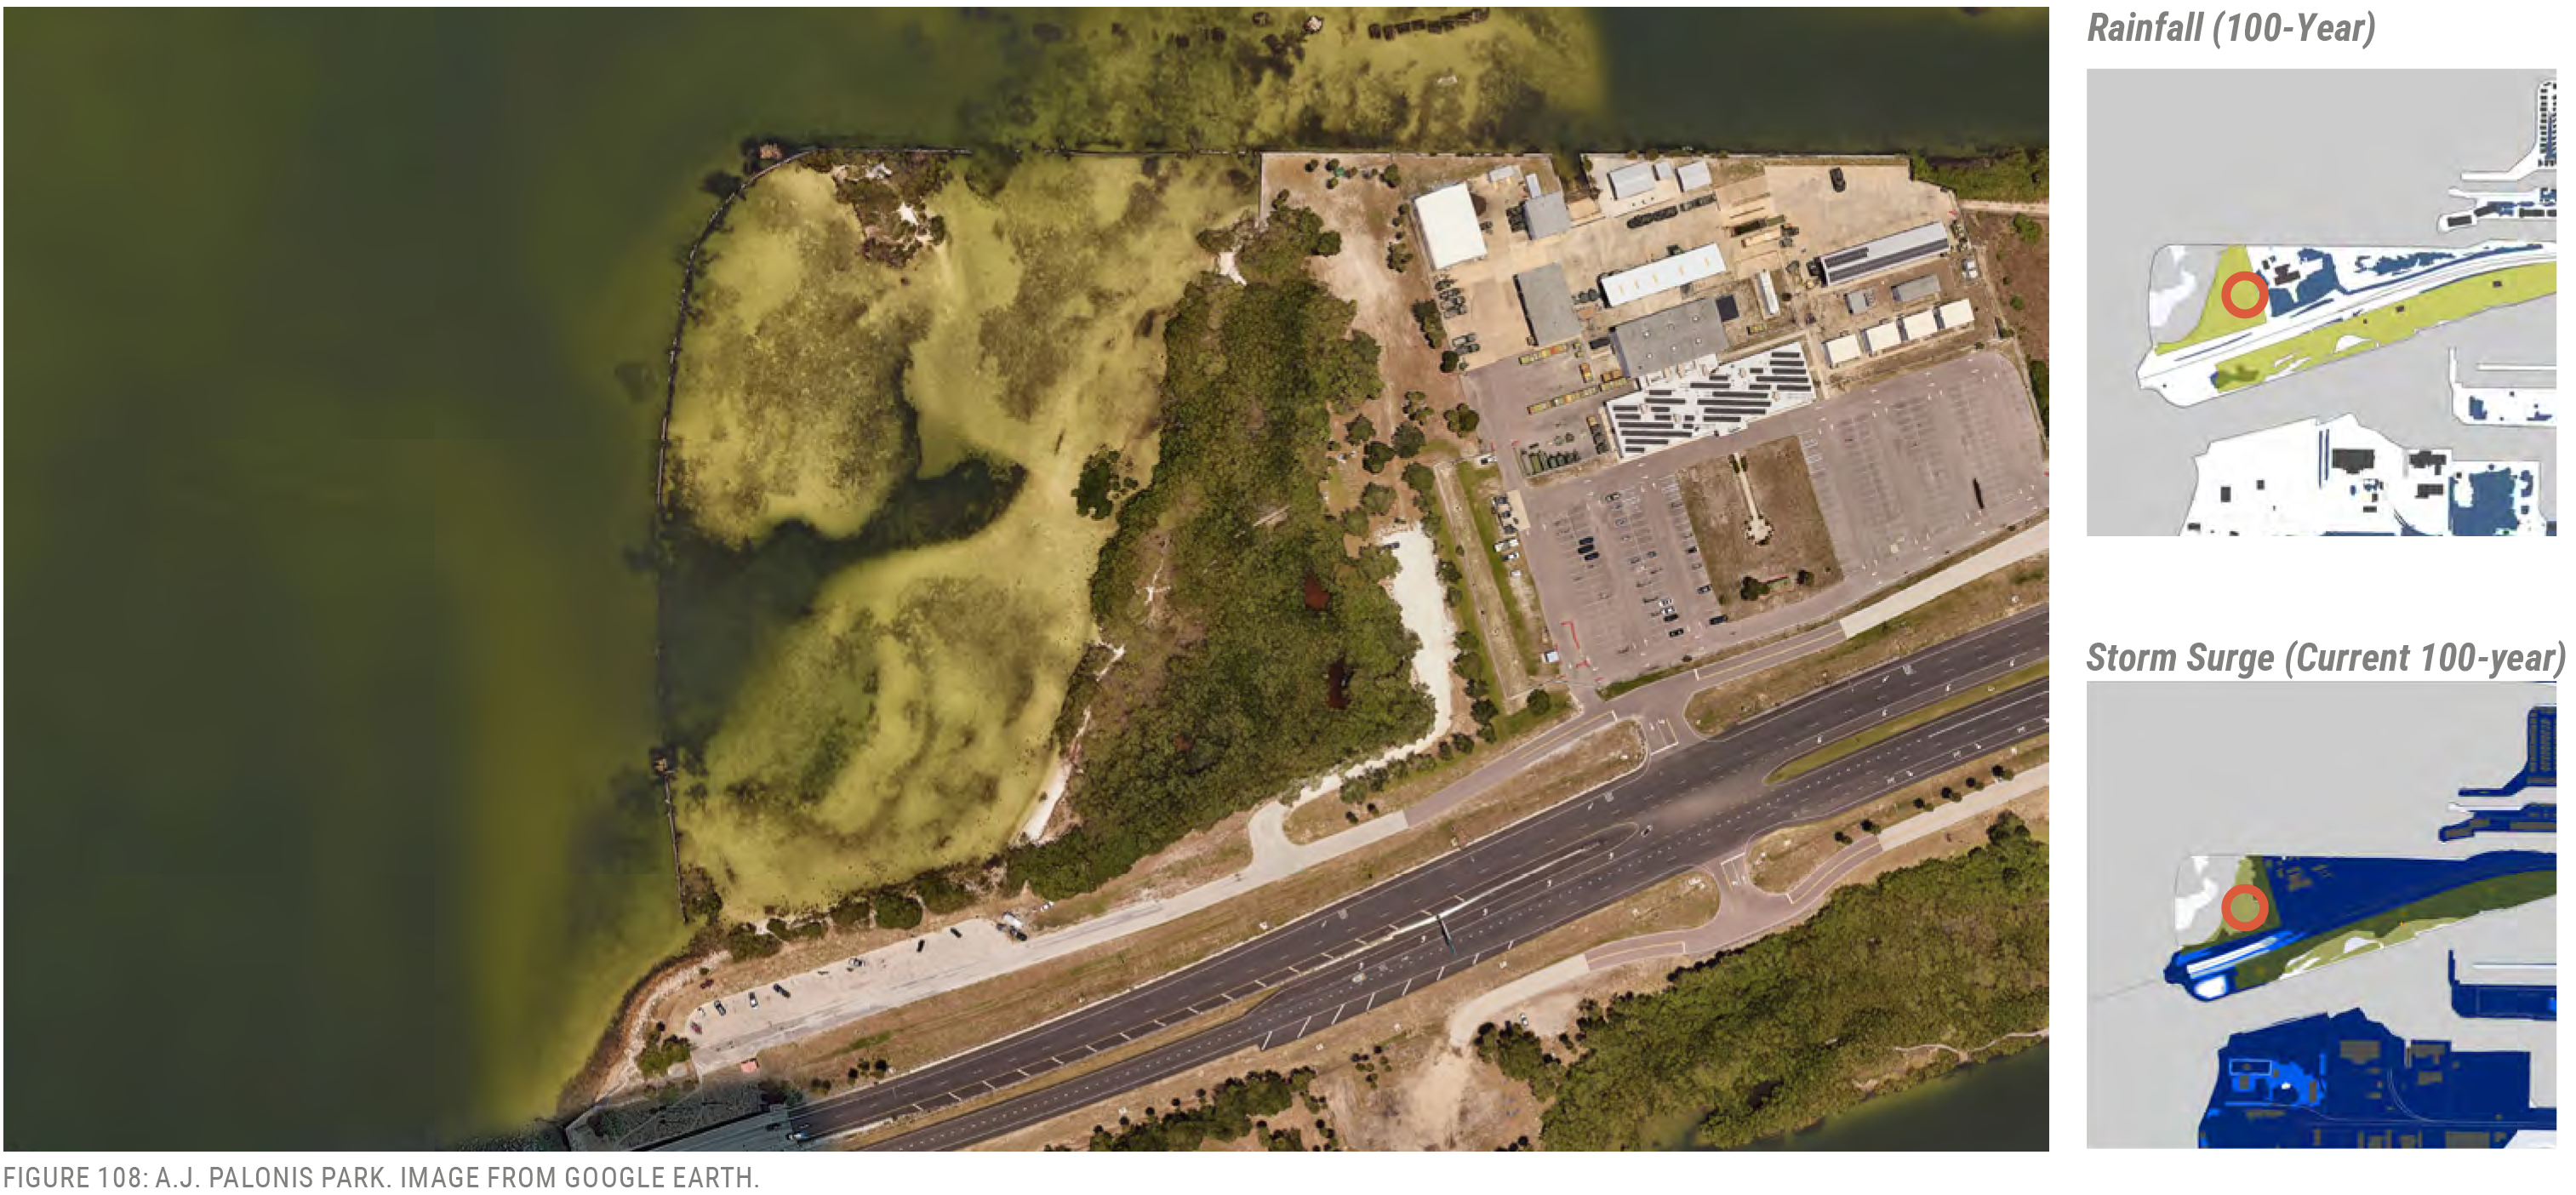
Bay To Bay Boulevard Park
Bay to Bay Blvd at Westshore Blvd
Vulnerabilities:
- Sea Level Rise
- Storm Surge
Location
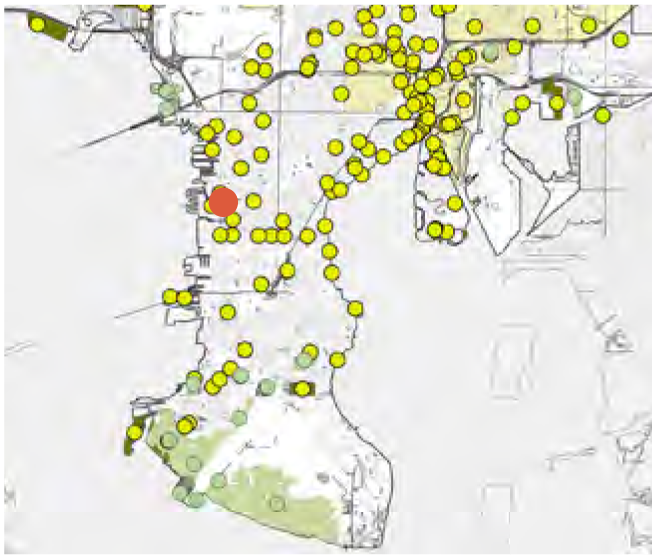
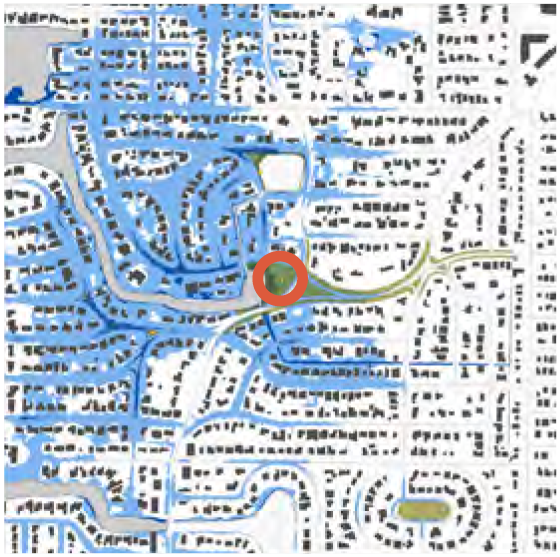
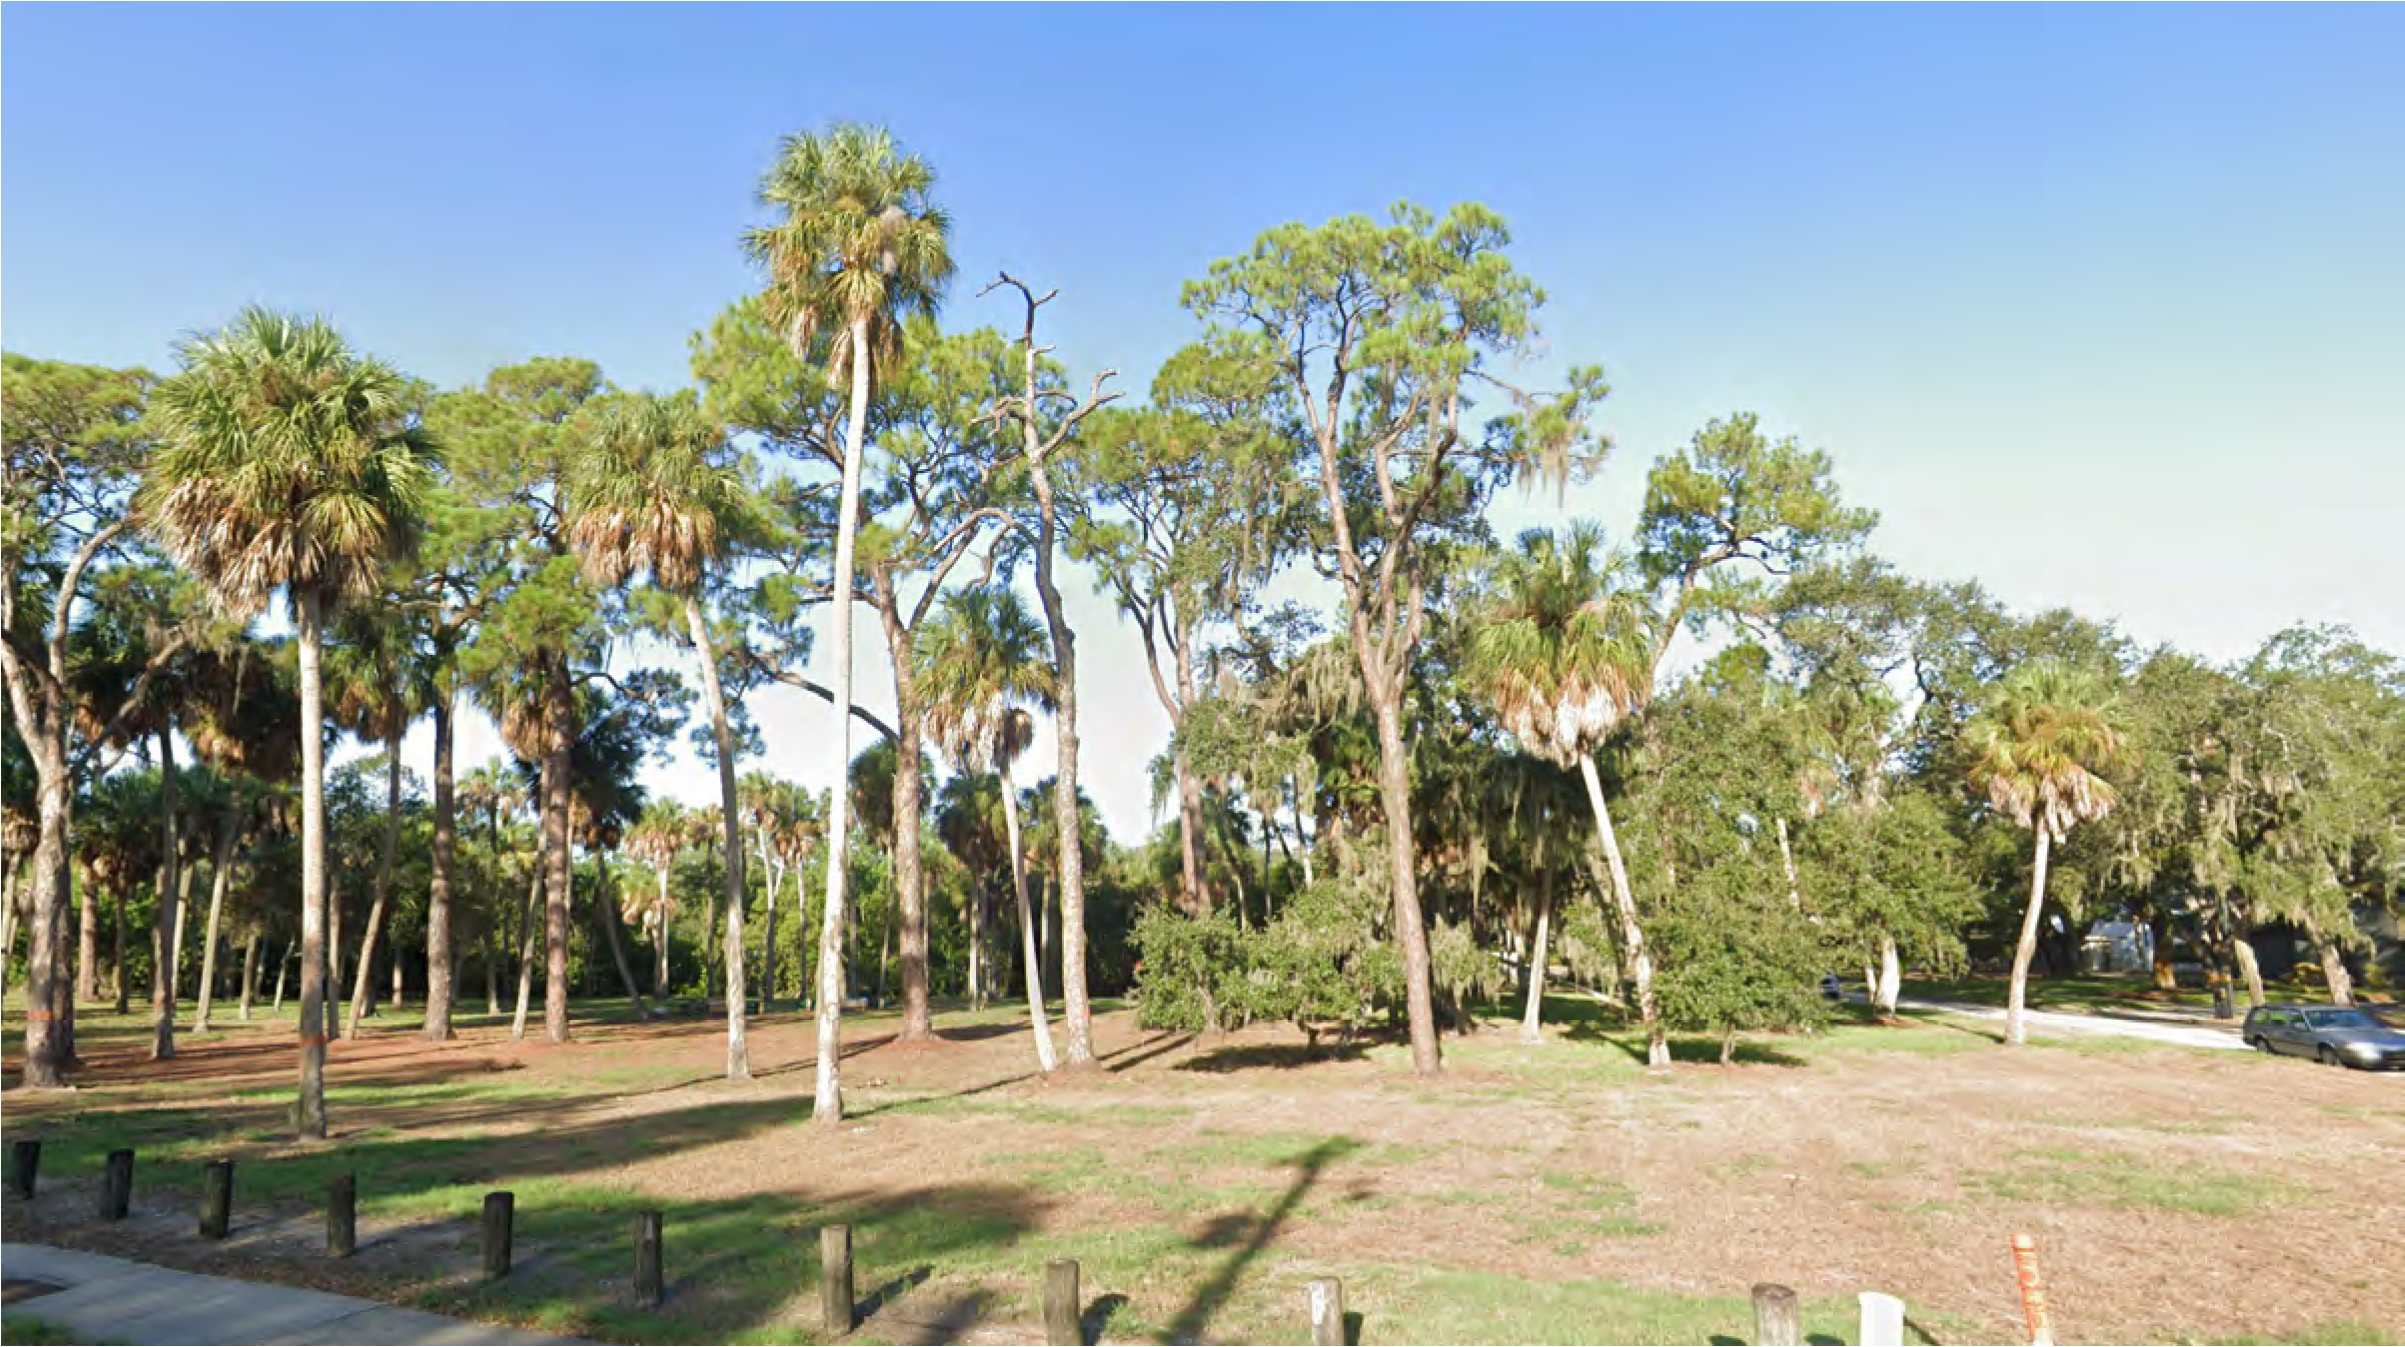
FIGURE 109: BAY TO BAY BOULEVARD PARK. IMAGE FROM GOOGLE EARTH.
Rainfall (100-Year)
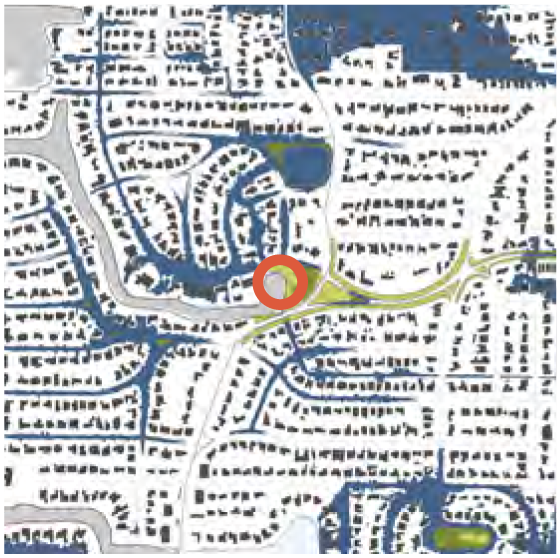
Storm Surge (Current 100-year)
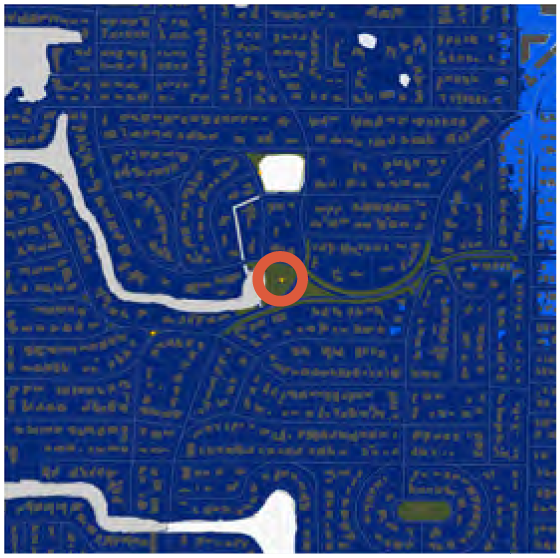
Bayshore Linear Park
Bayshore Boulevard
Vulnerabilities:
- Sea Level Rise
- Storm Surge
Location
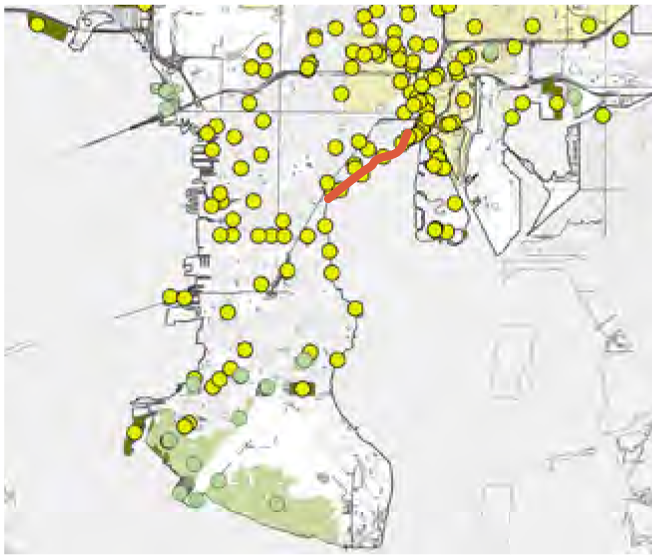
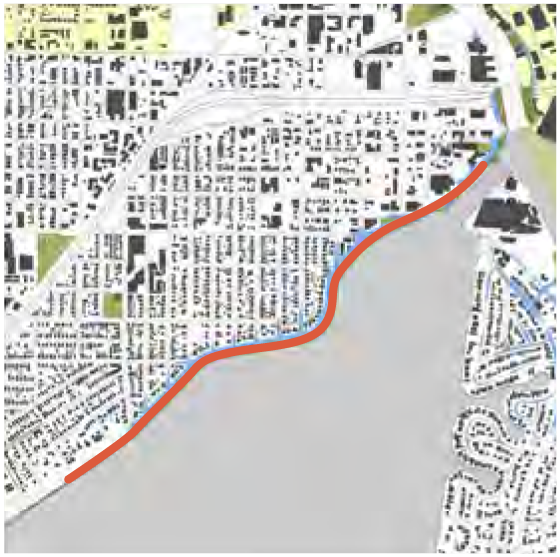
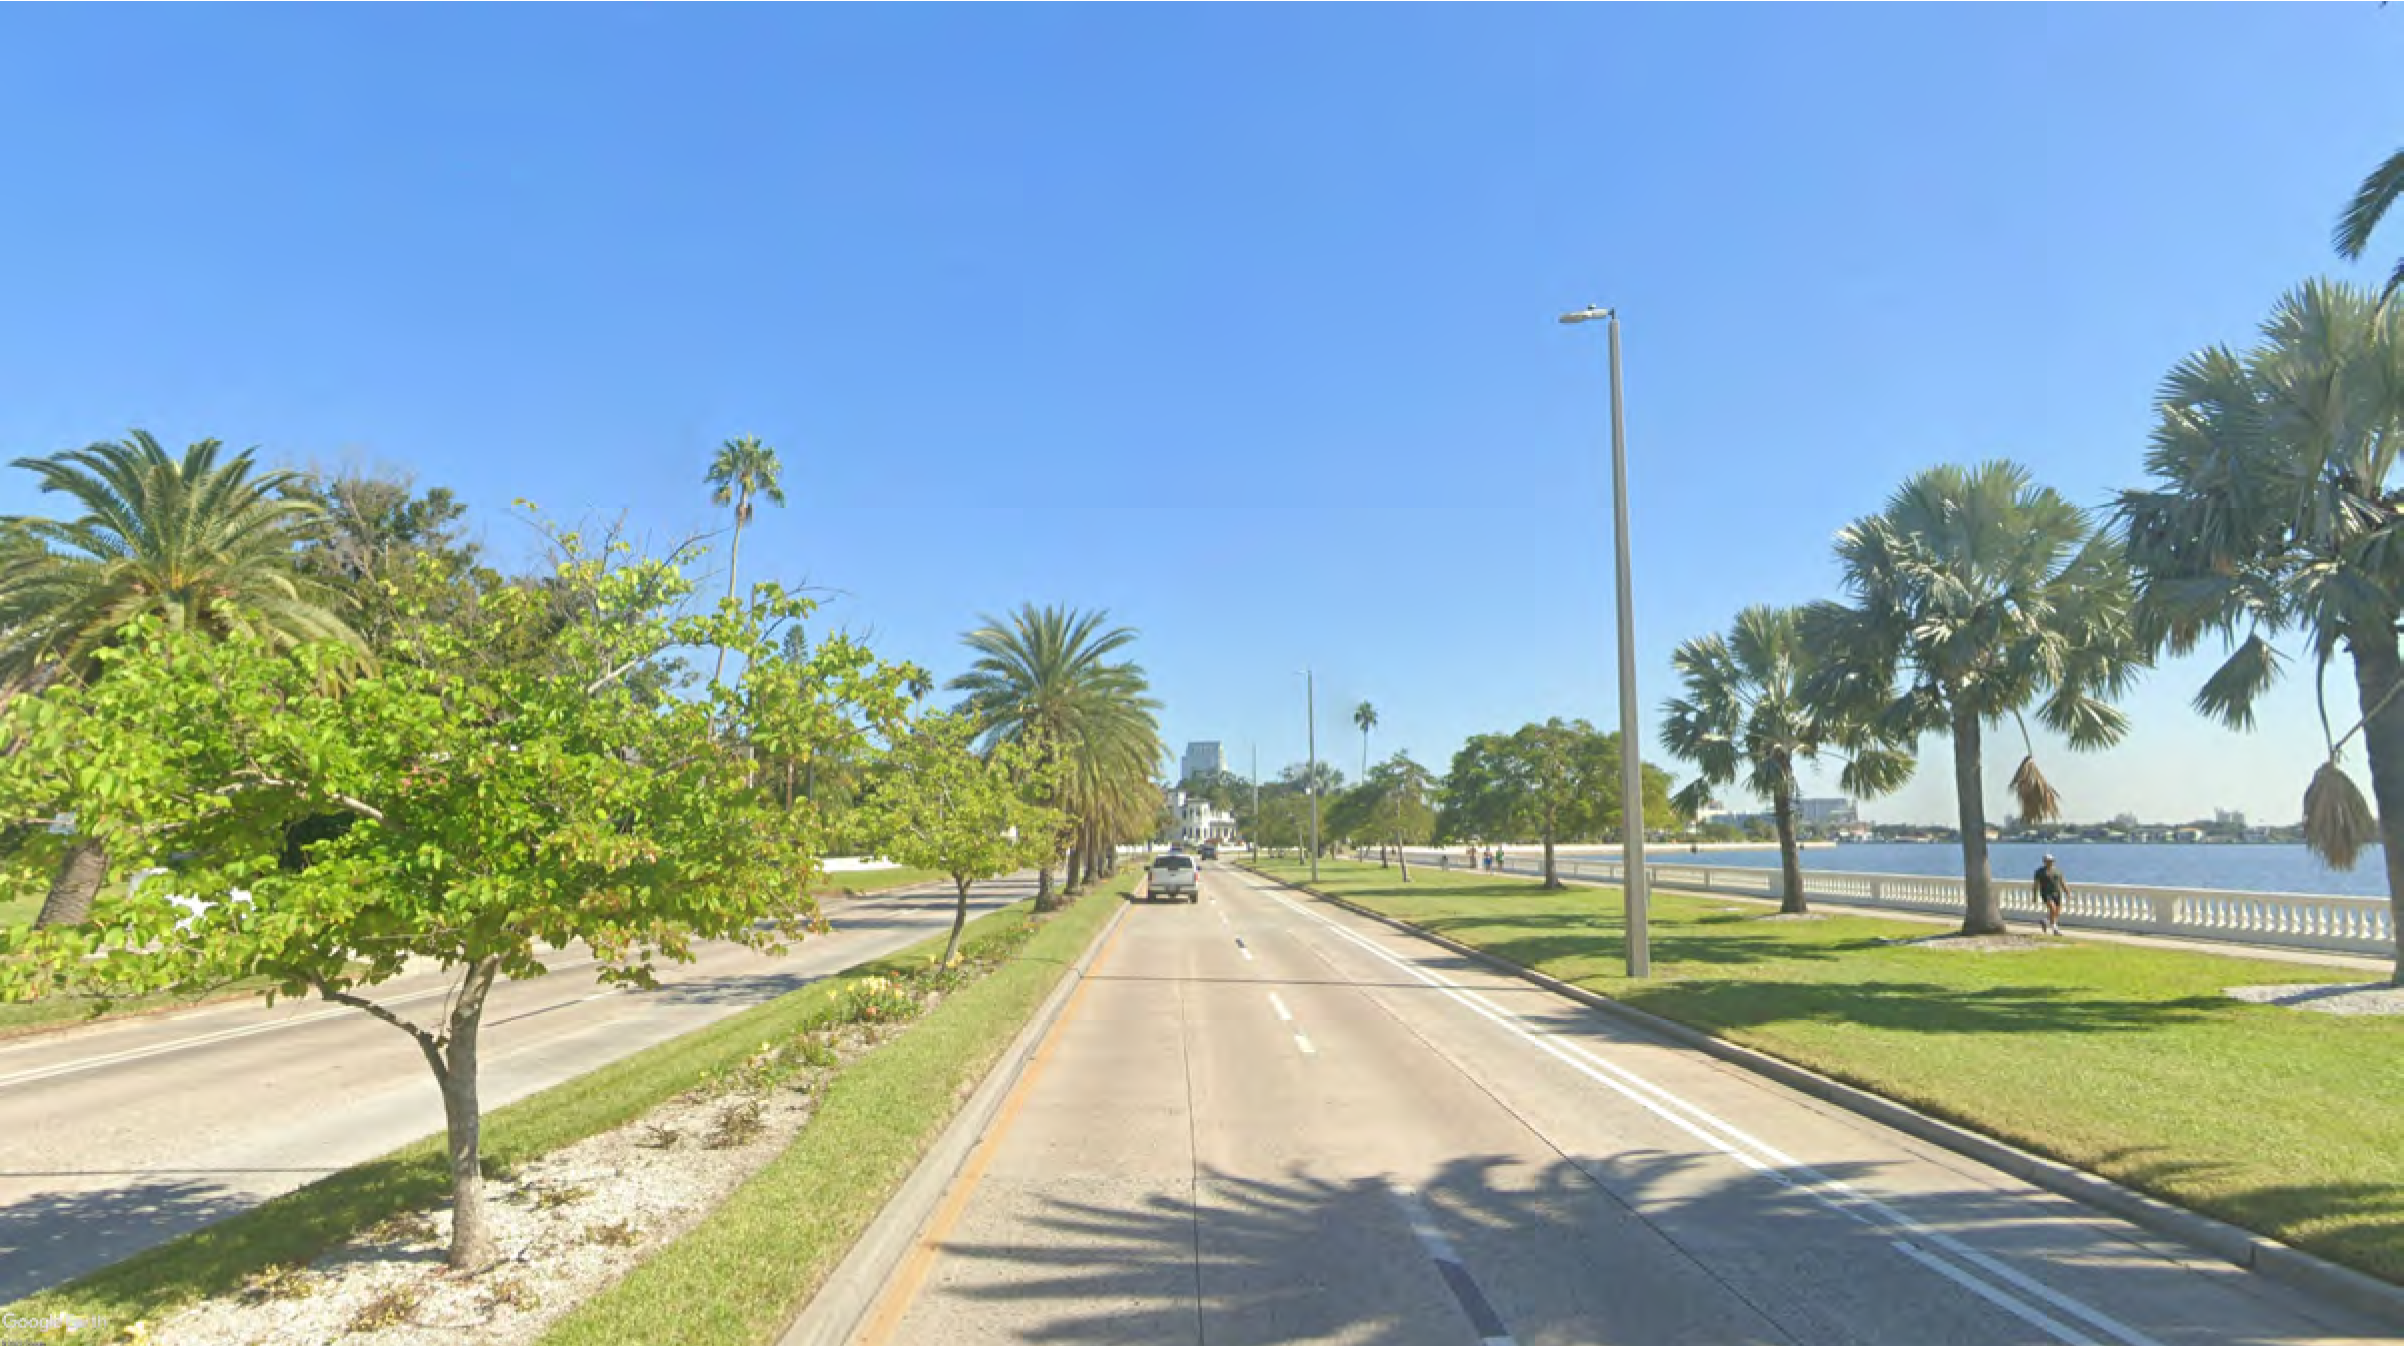
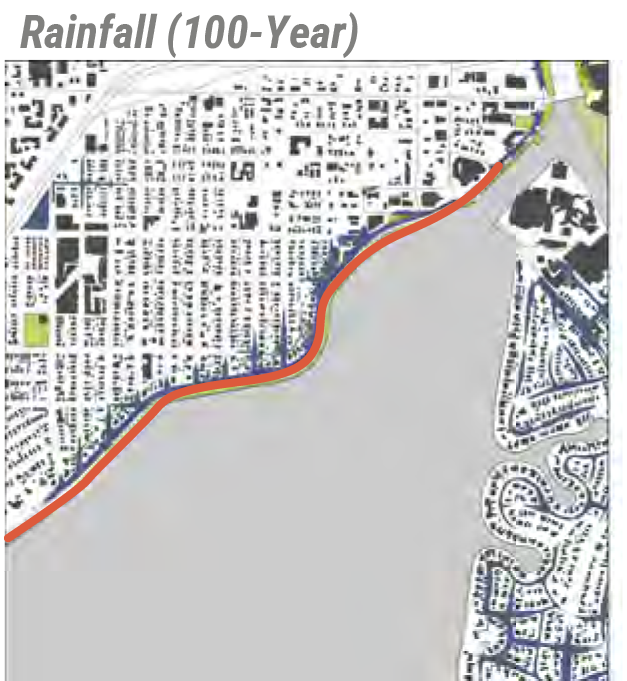
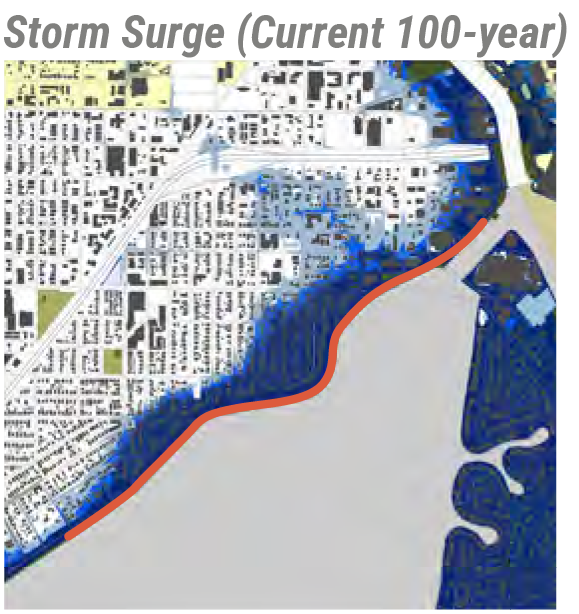
Cypress Point Park
5620 West Cypress Street
Vulnerabilities:
- Sea Level Rise
- Storm Surge
Location
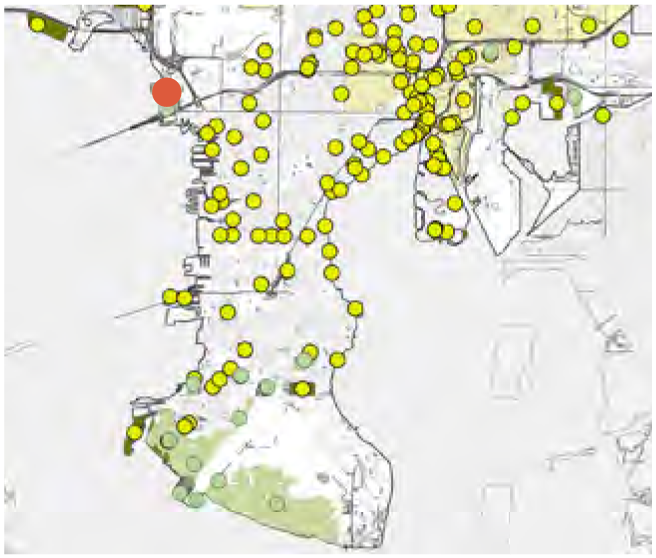
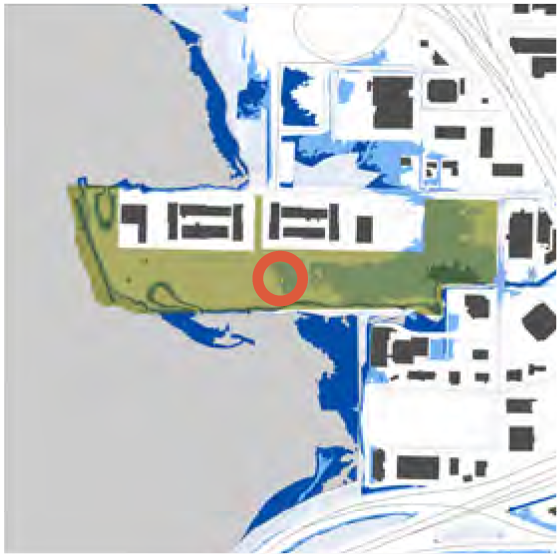
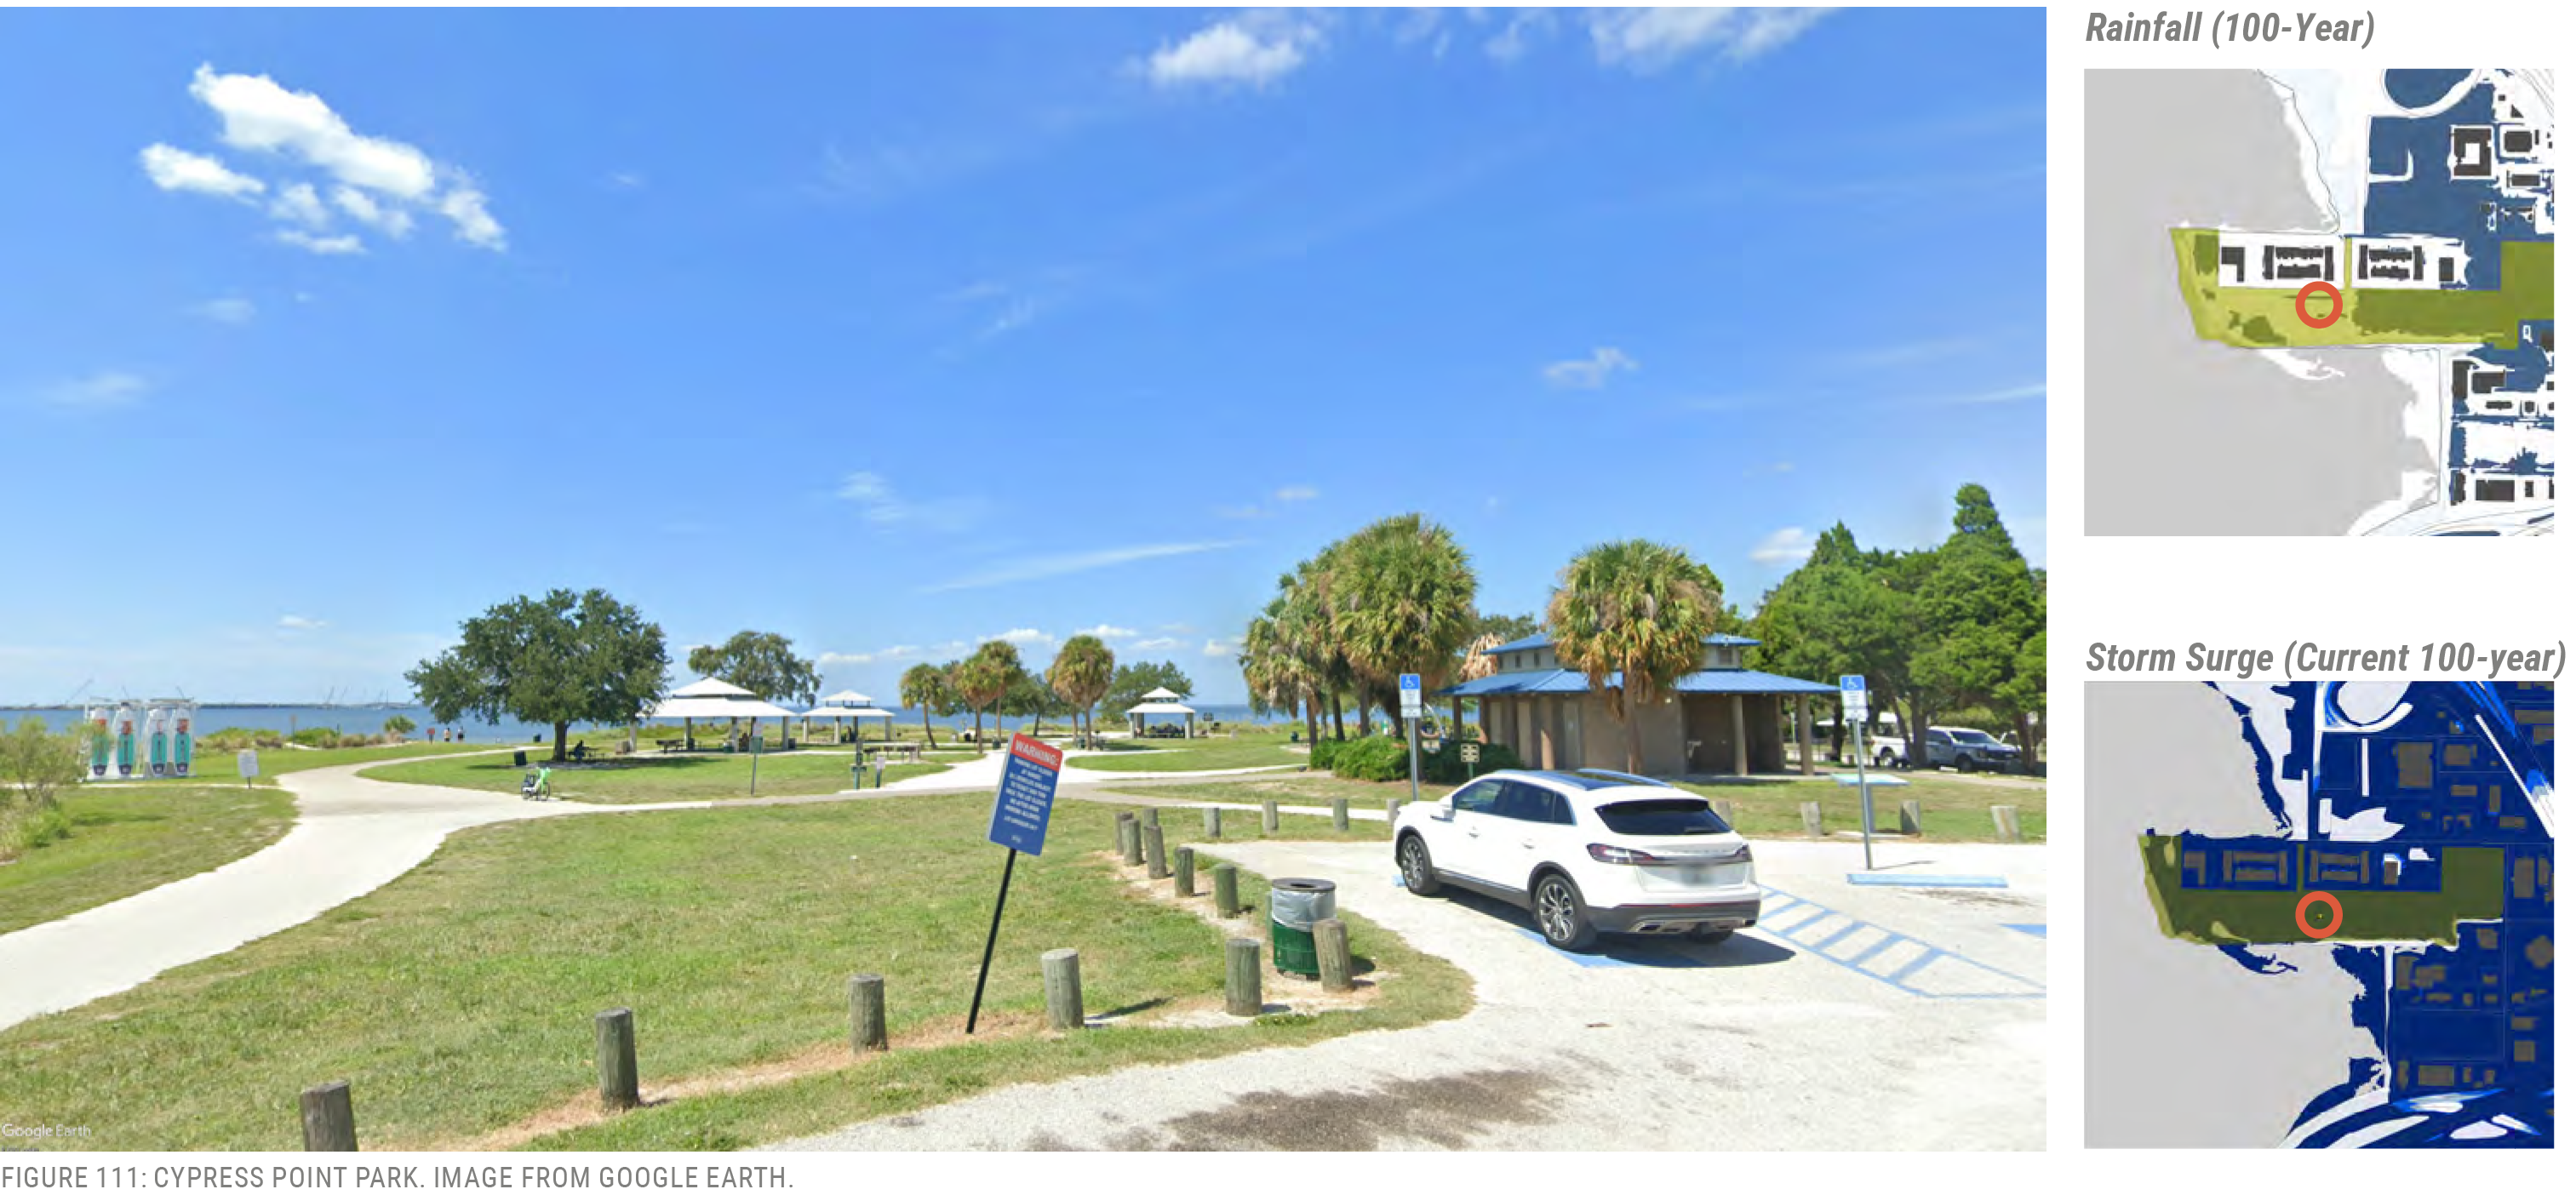
Reed Park
4300 Riverside Drive
Vulnerabilities:
- Sea Level Rise
- Storm Surge
Location
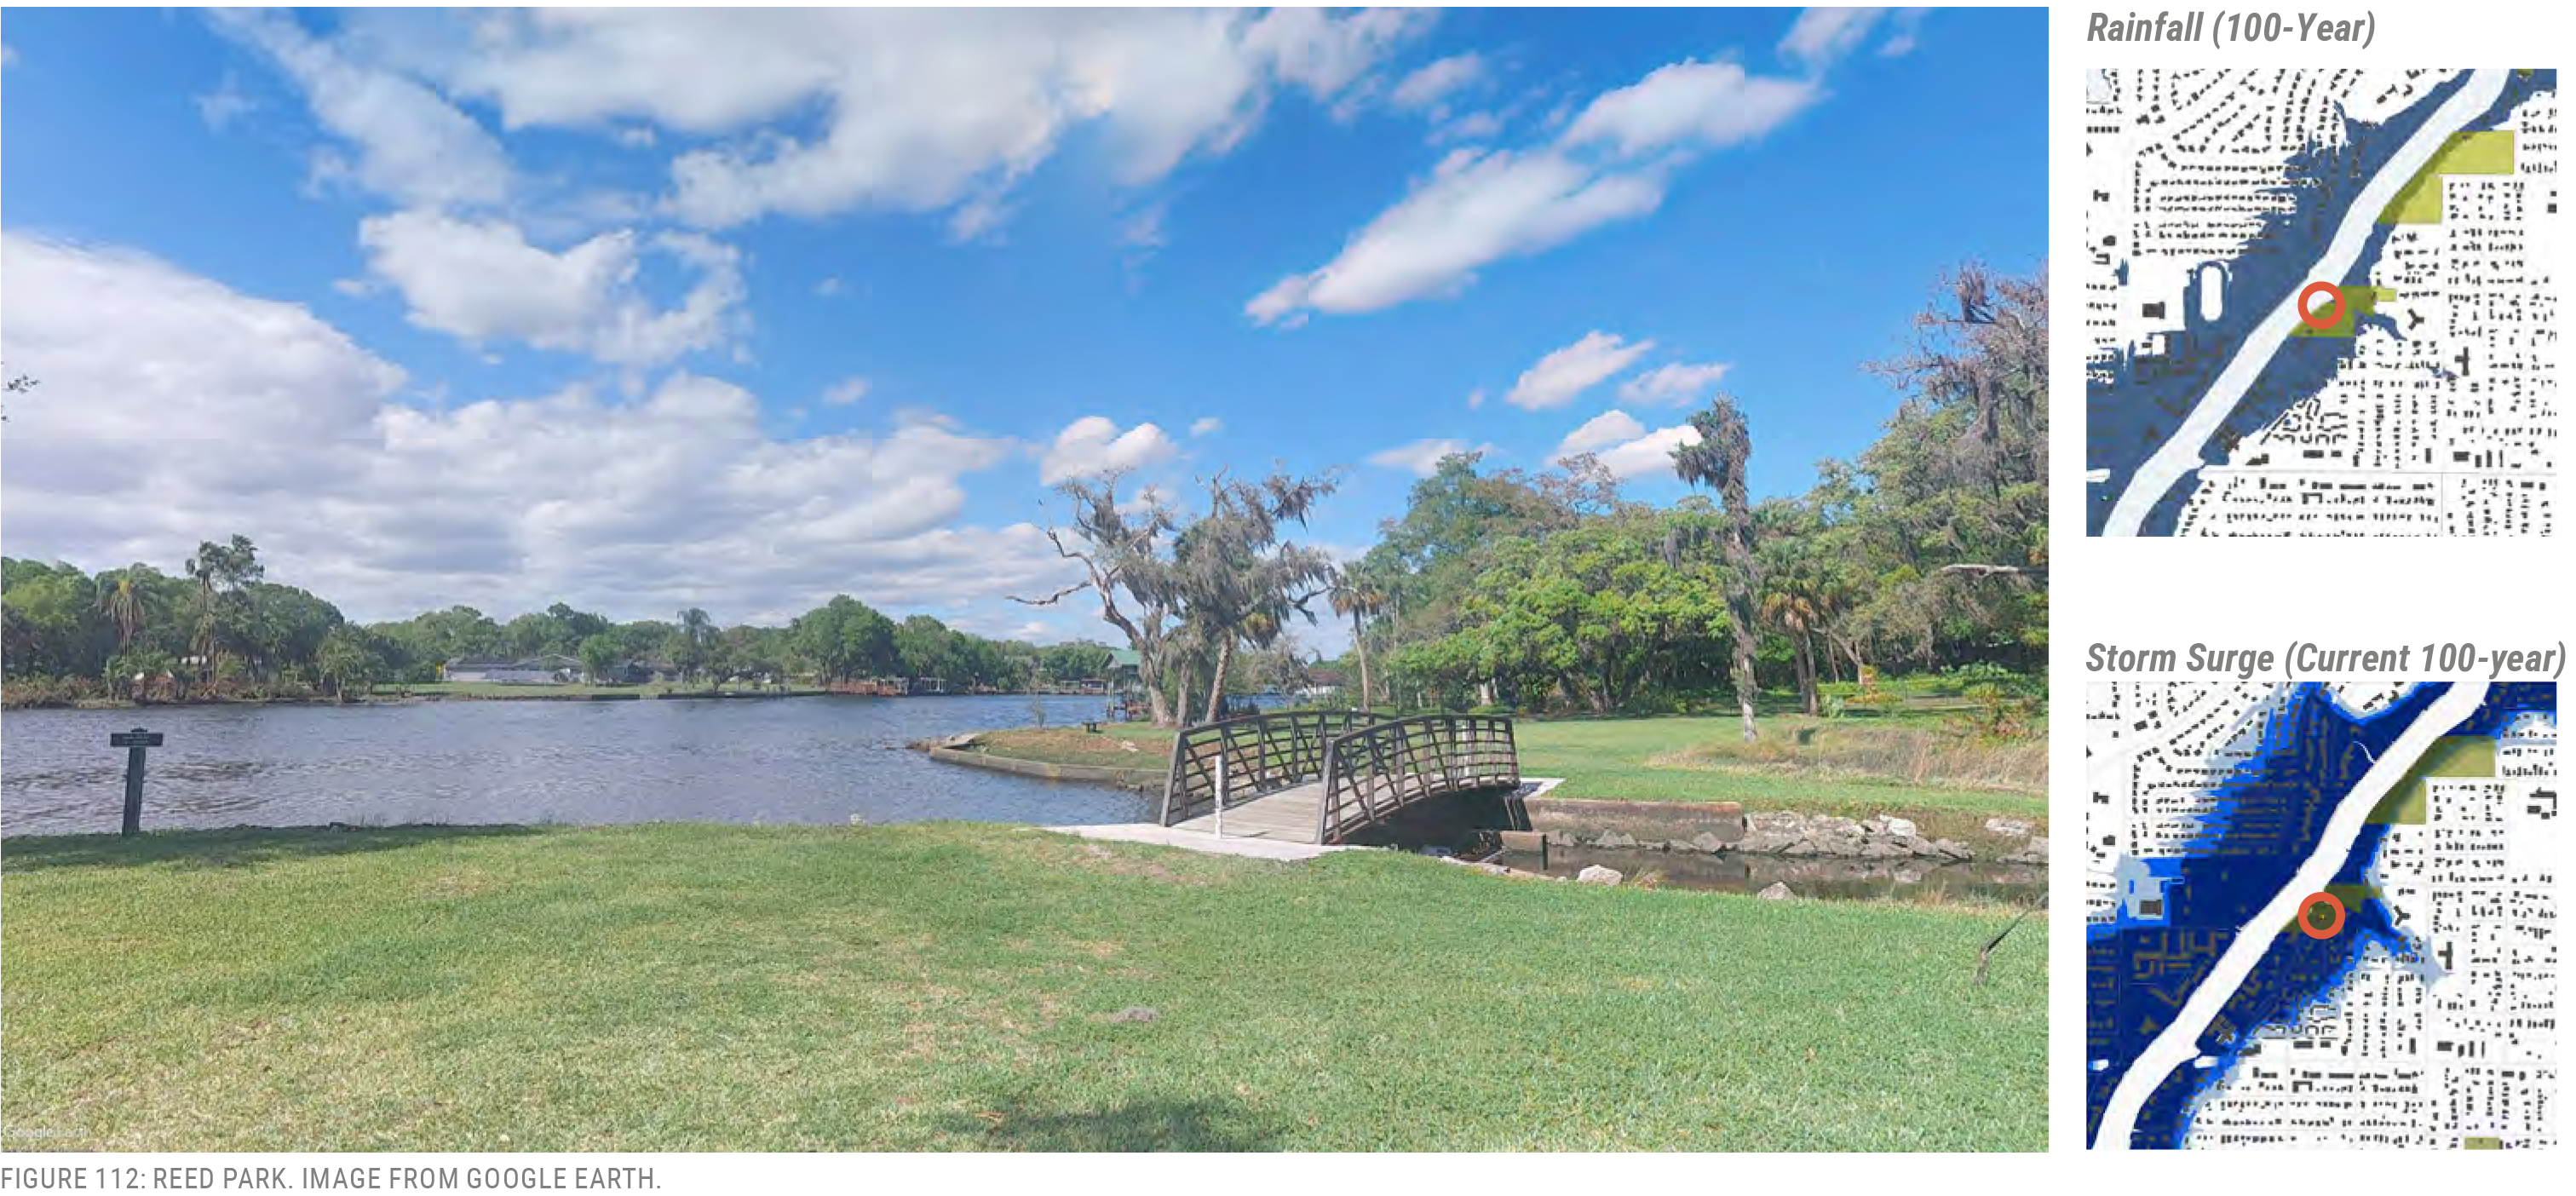
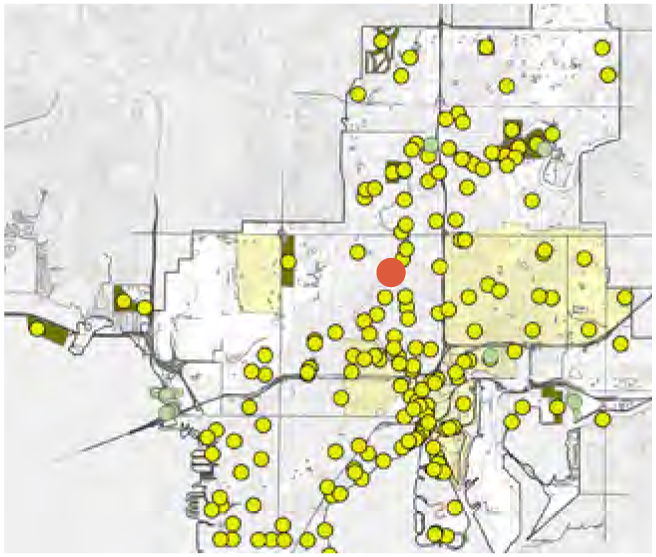
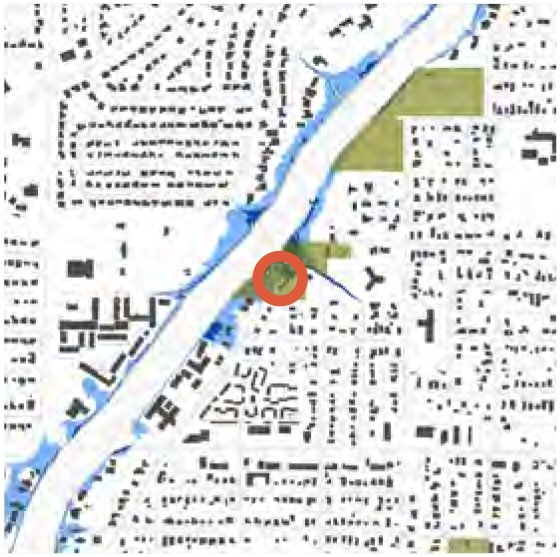
Ignacio Haya Linear Park
5000 North River Boulevard
Vulnerabilities:
- Sea Level Rise
- Storm Surge
Location
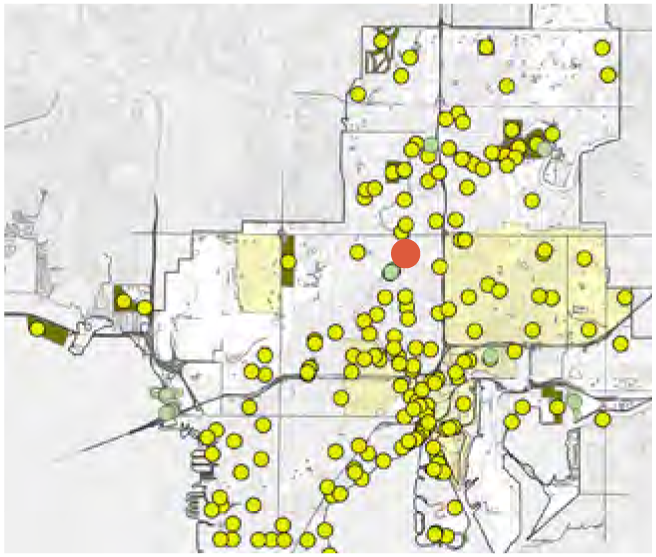
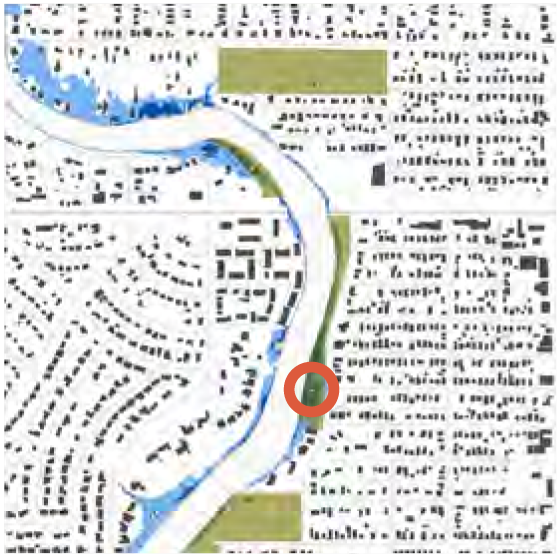
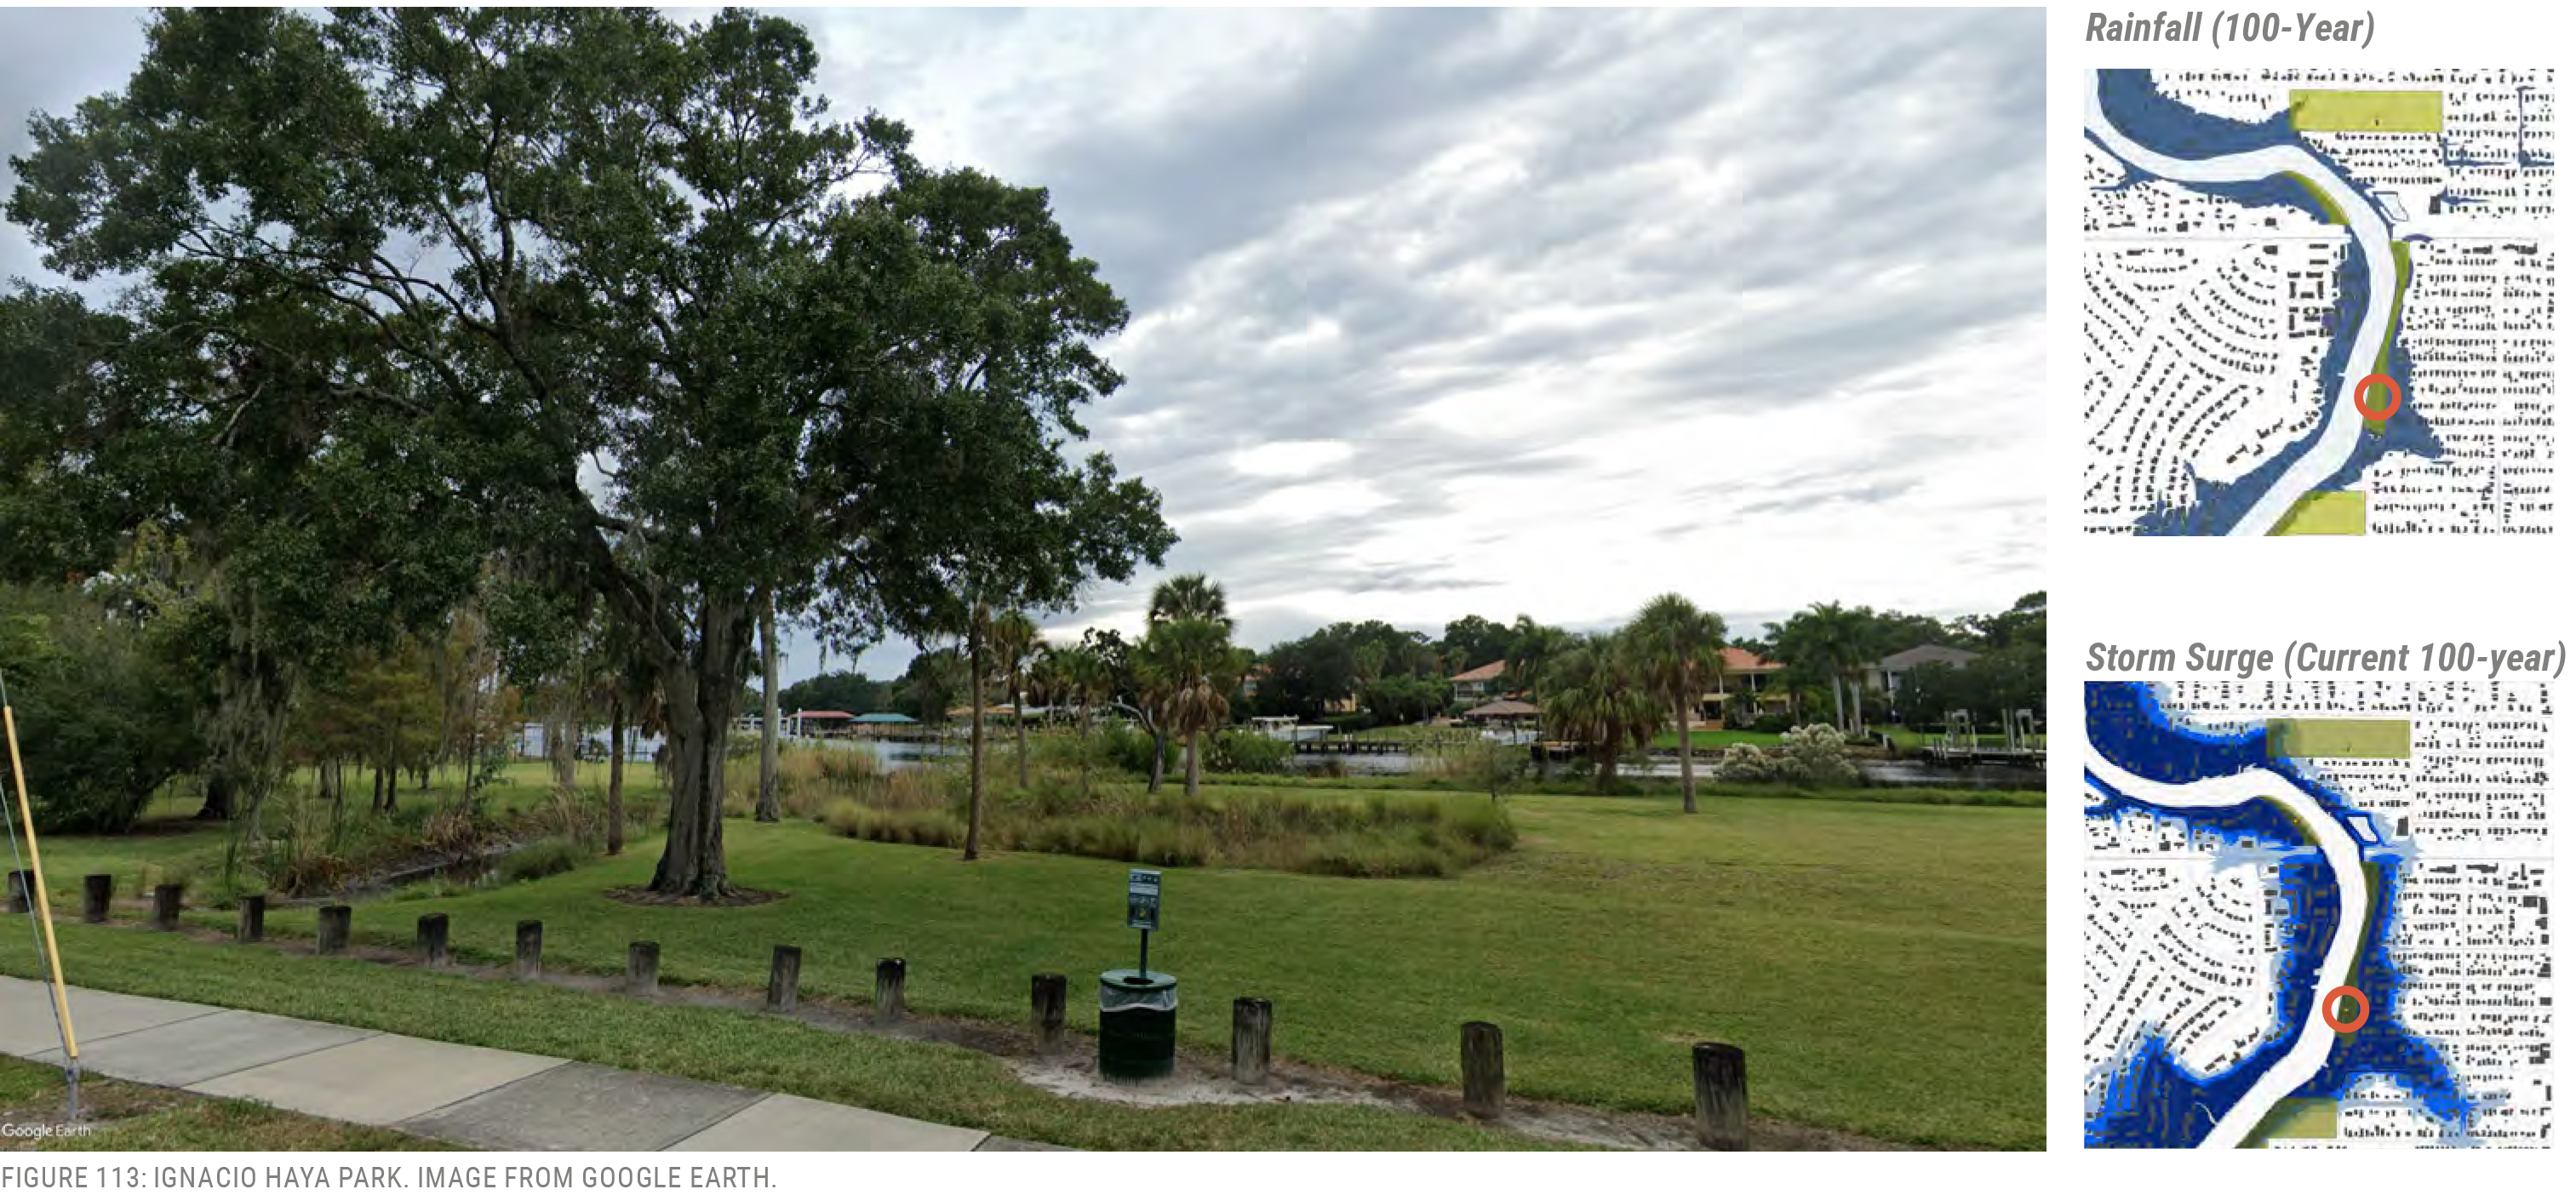
Riverside Park
North River Shore Drive and West Hillsborough Ave
Vulnerabilities:
- Sea Level Rise
- Storm Surge
Location
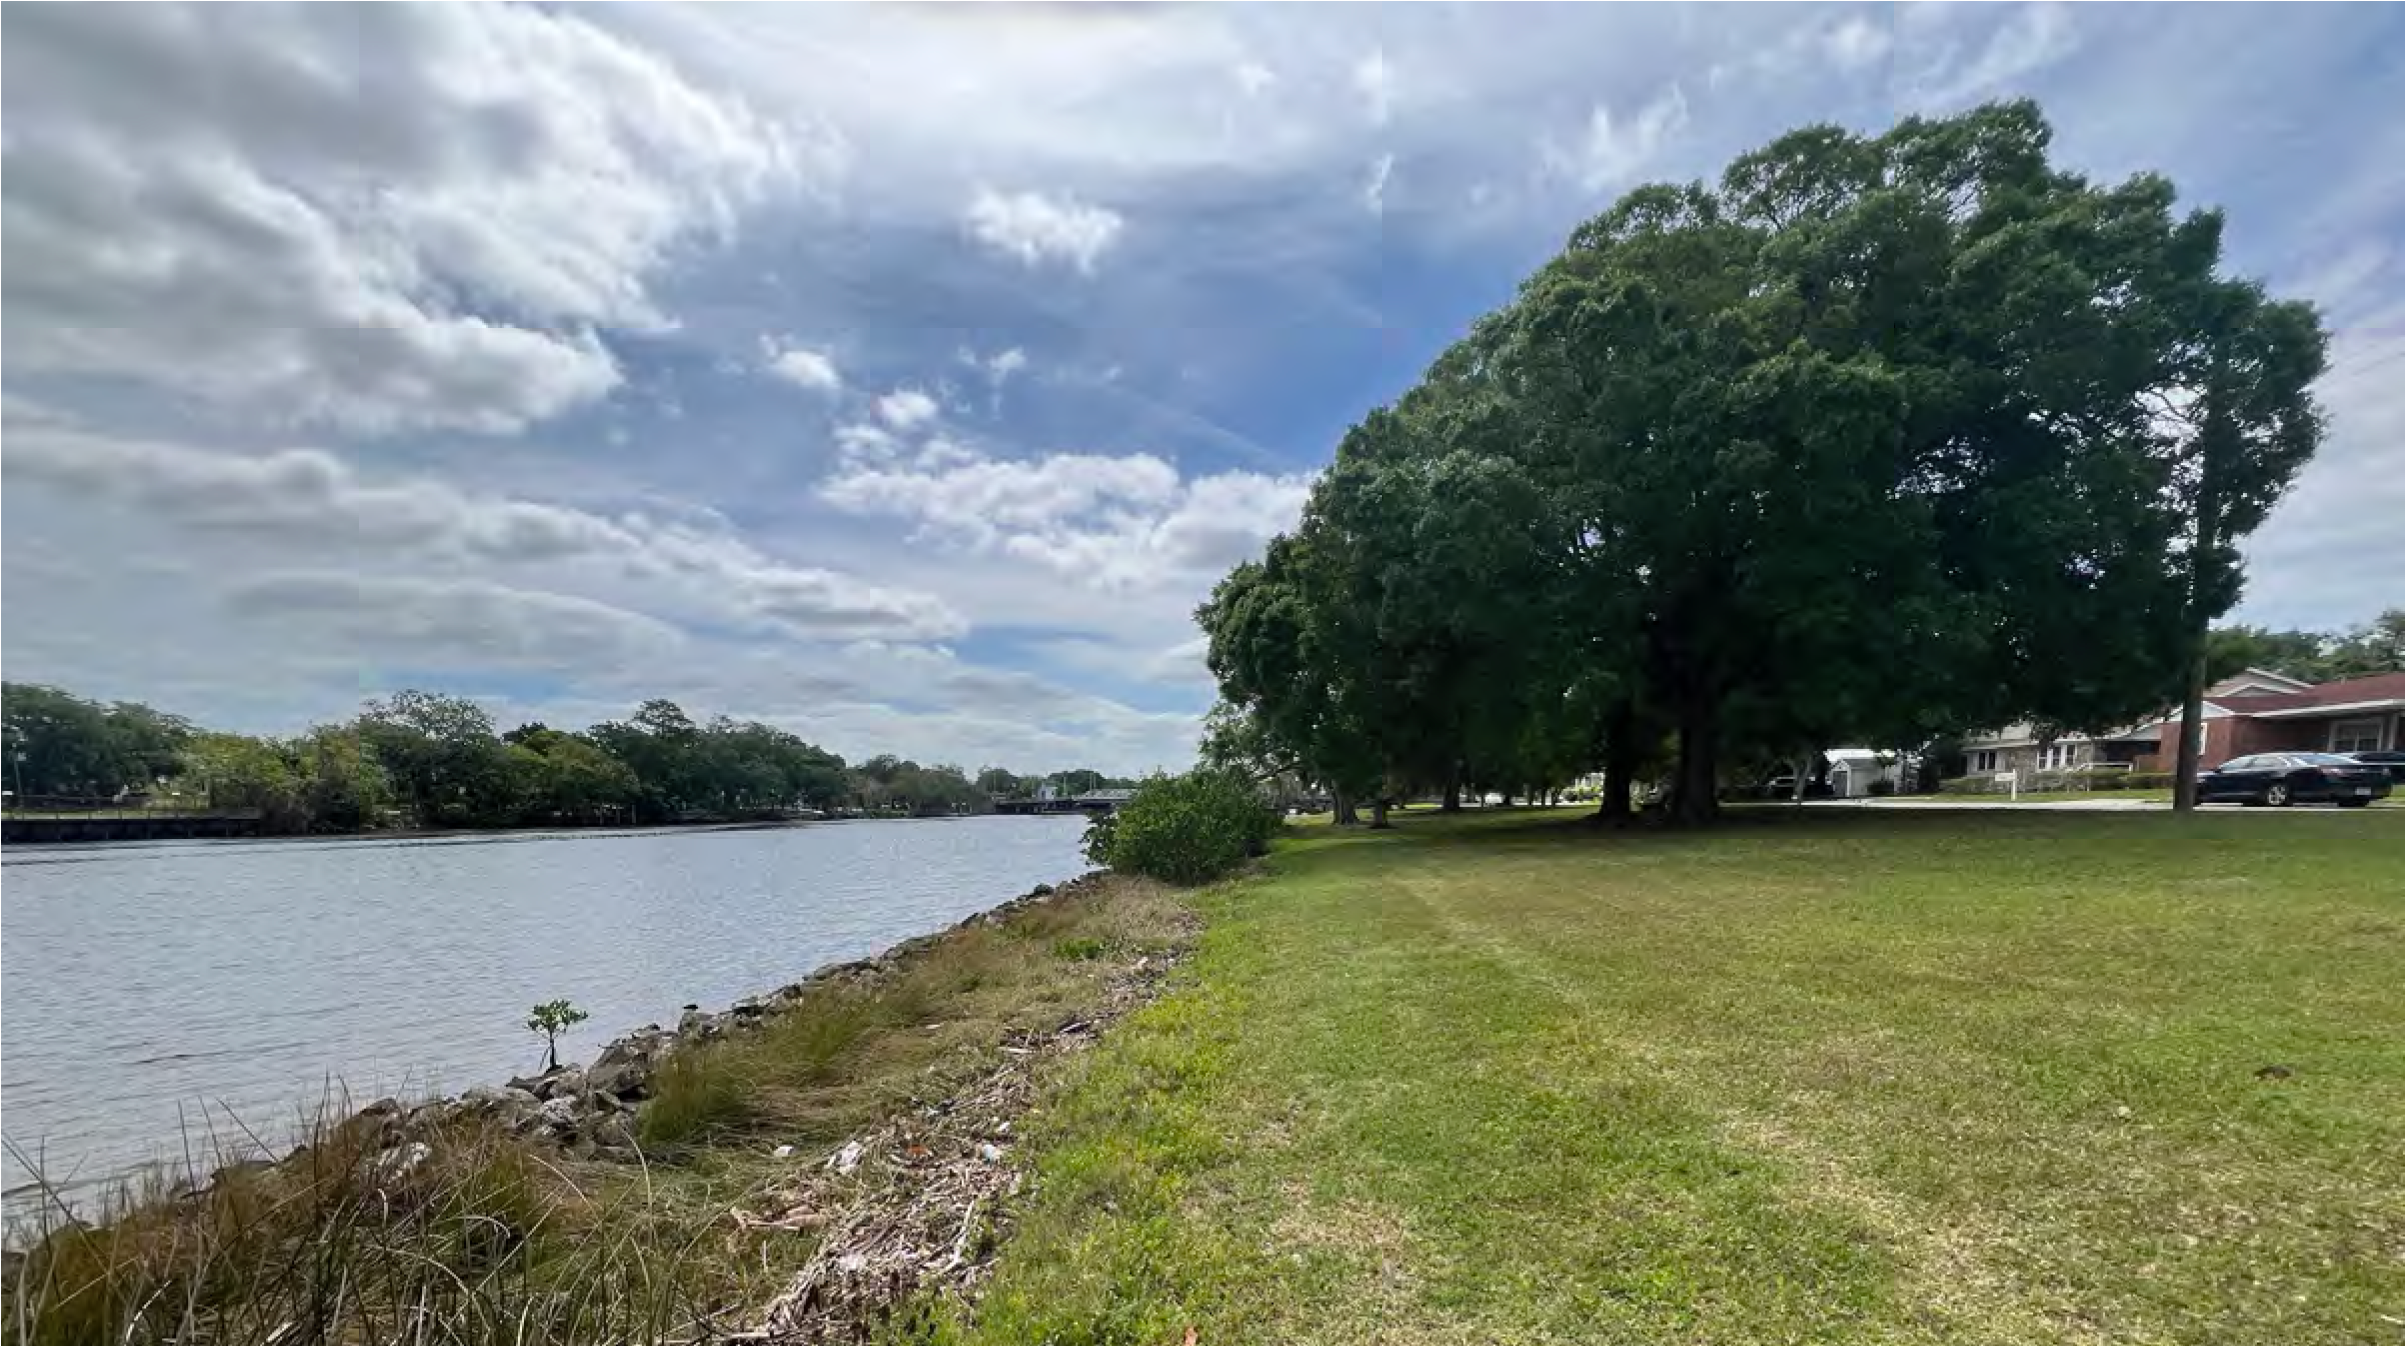
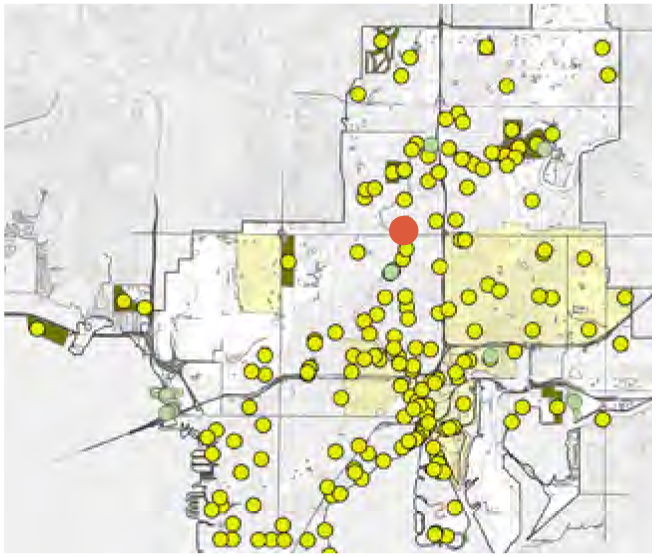
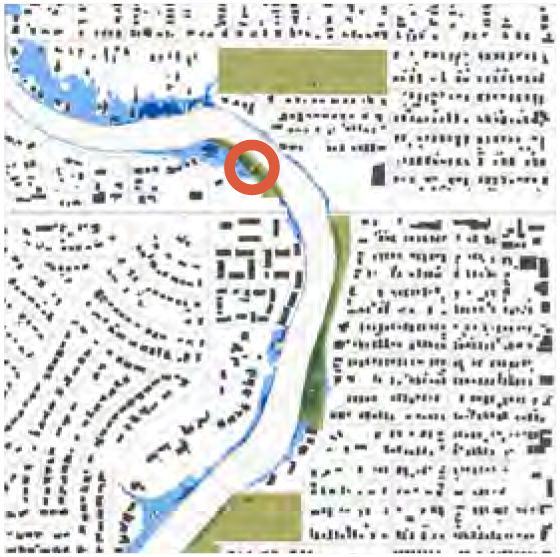
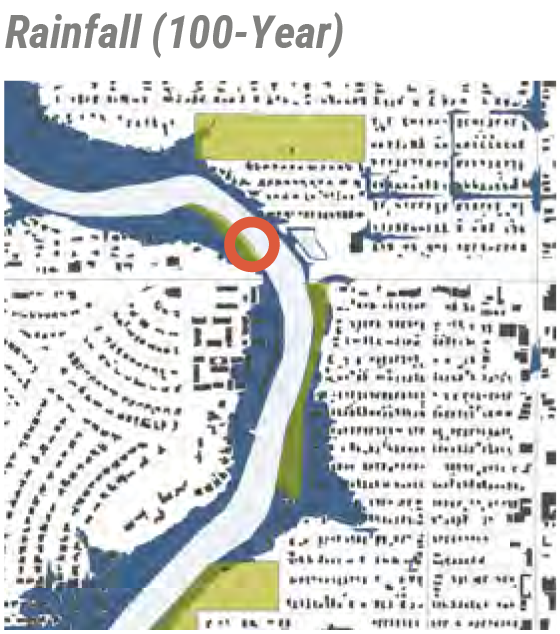
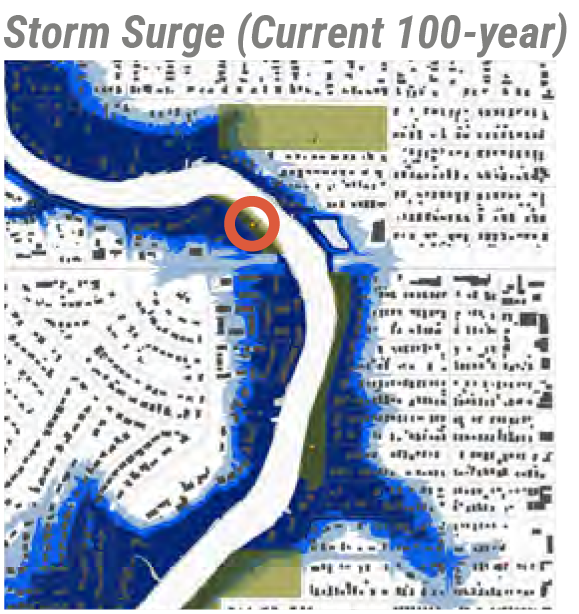
Epps Park
350 West Fern Street
Vulnerabilities:
- Sea Level Rise
- Rainfall
- Storm Surge
Location
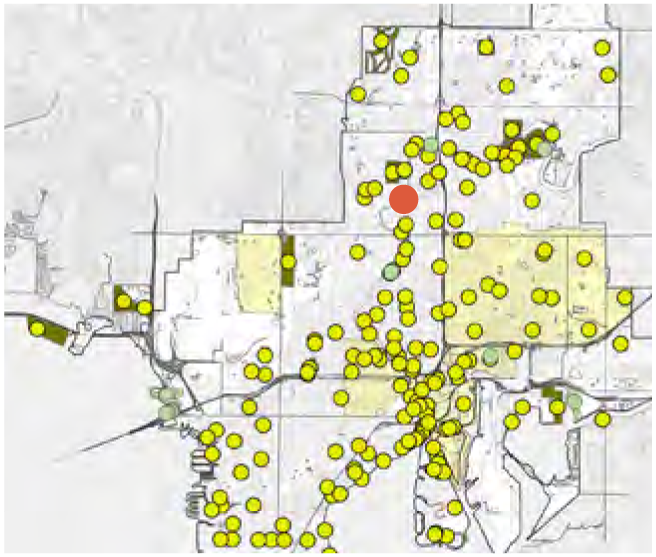
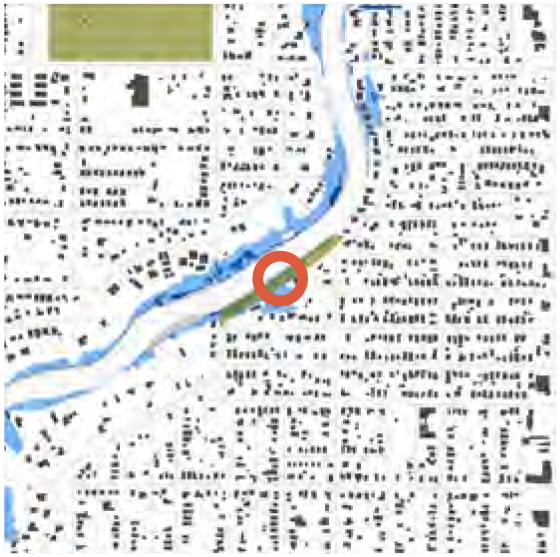
Rainfall (100-Year)
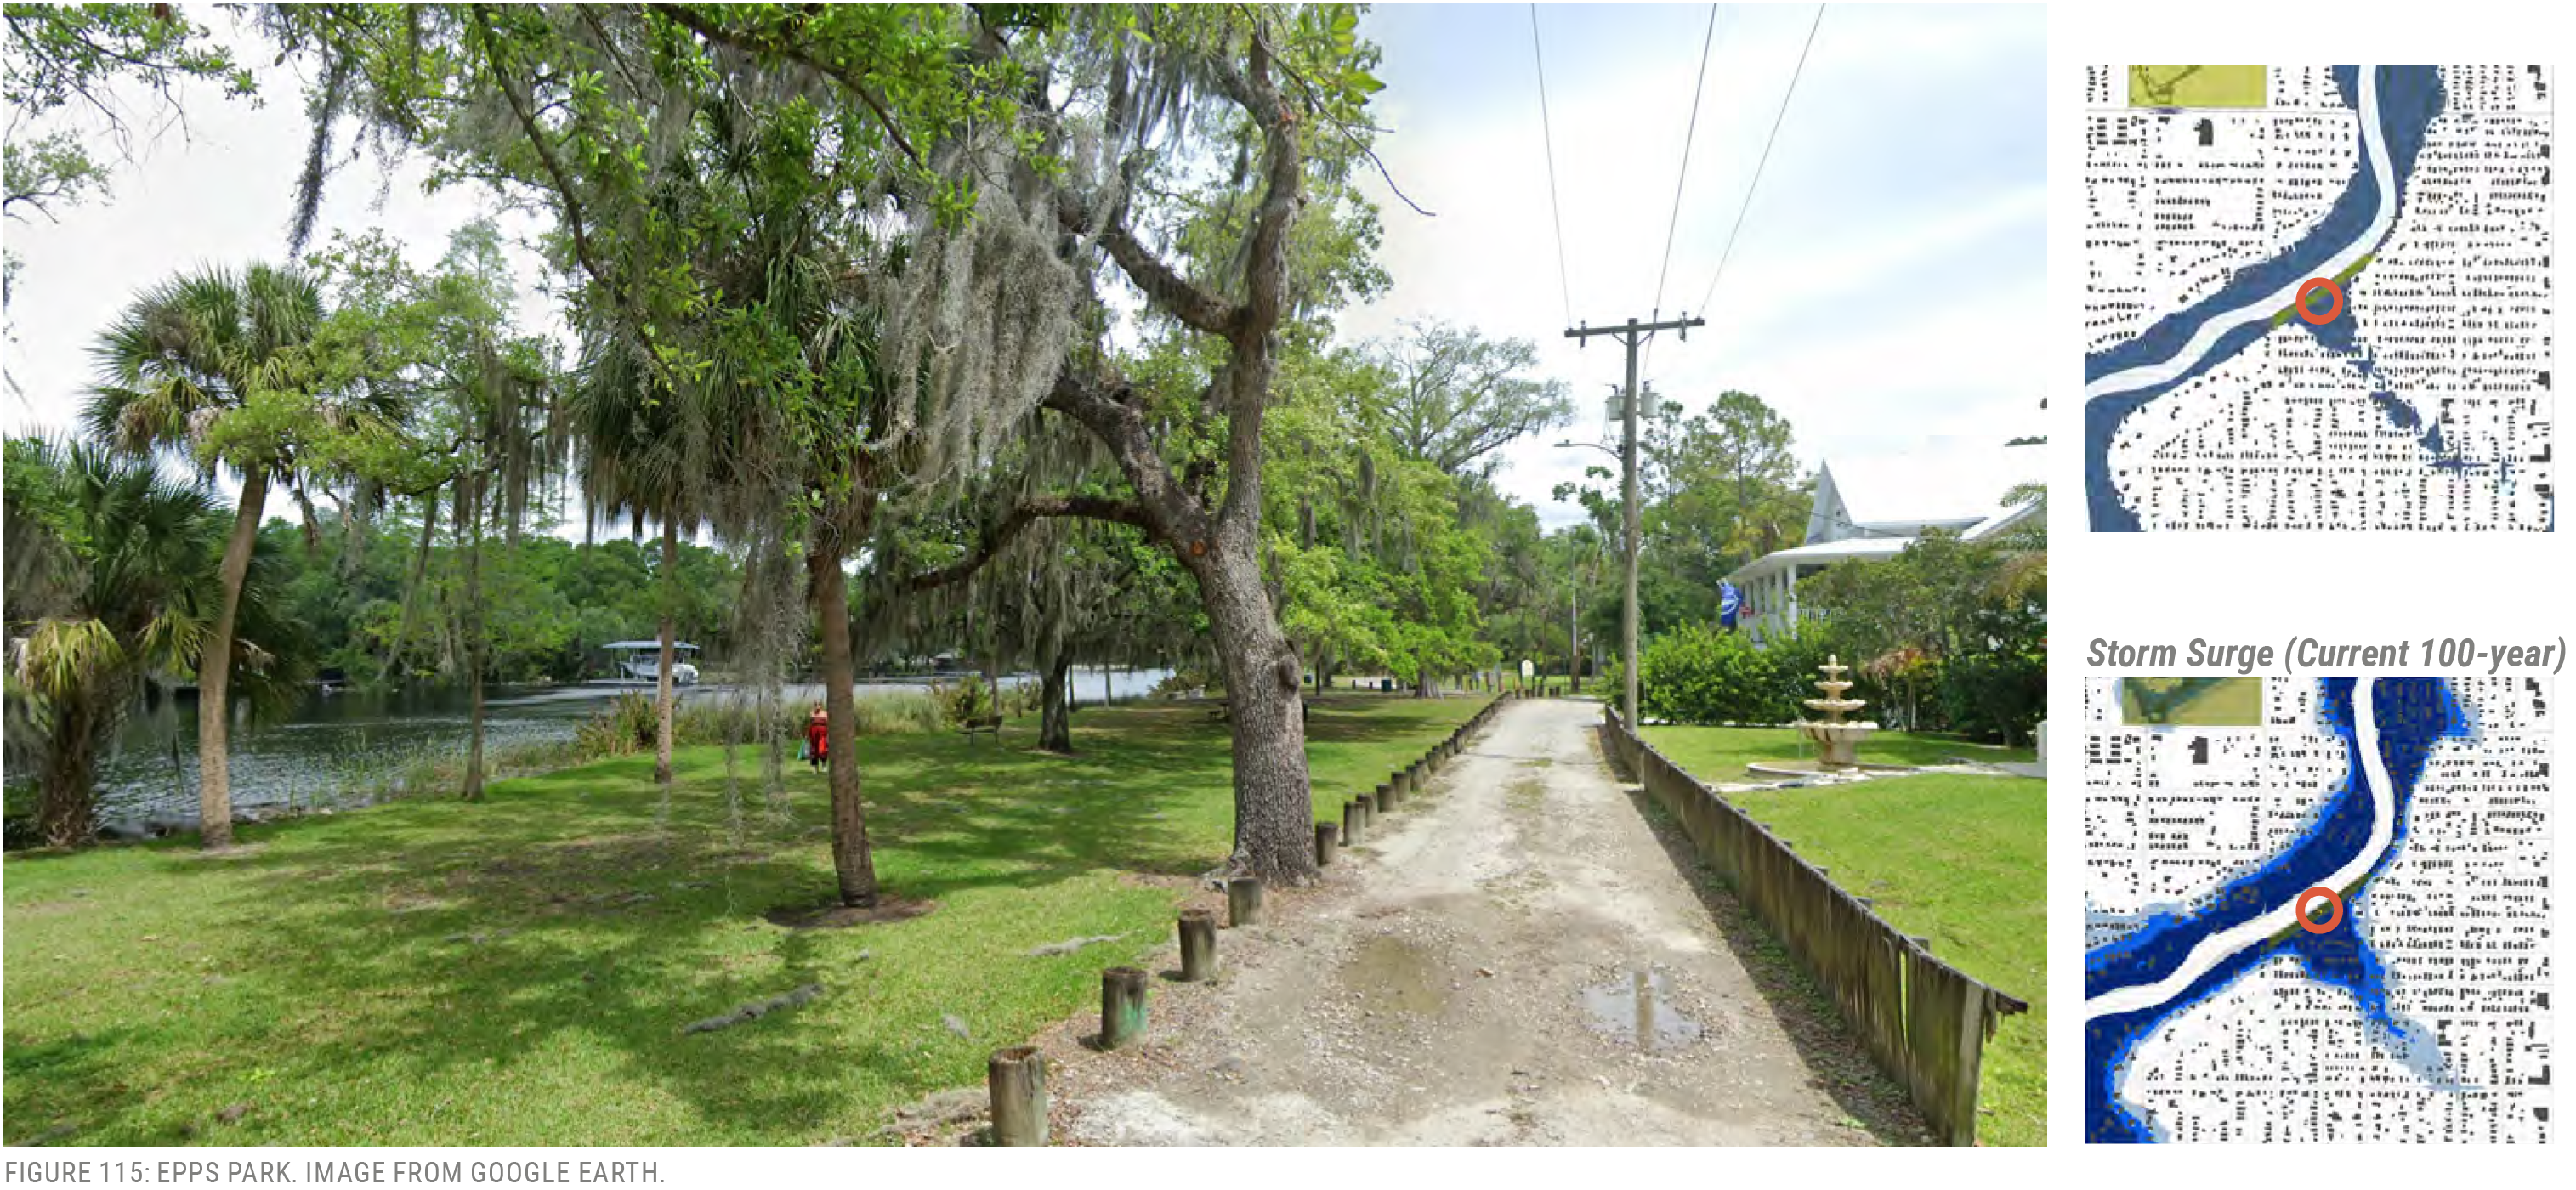
Sulphur Springs Park
701 East Bird Street
Vulnerabilities:
- Sea Level Rise
- Storm Surge
Location
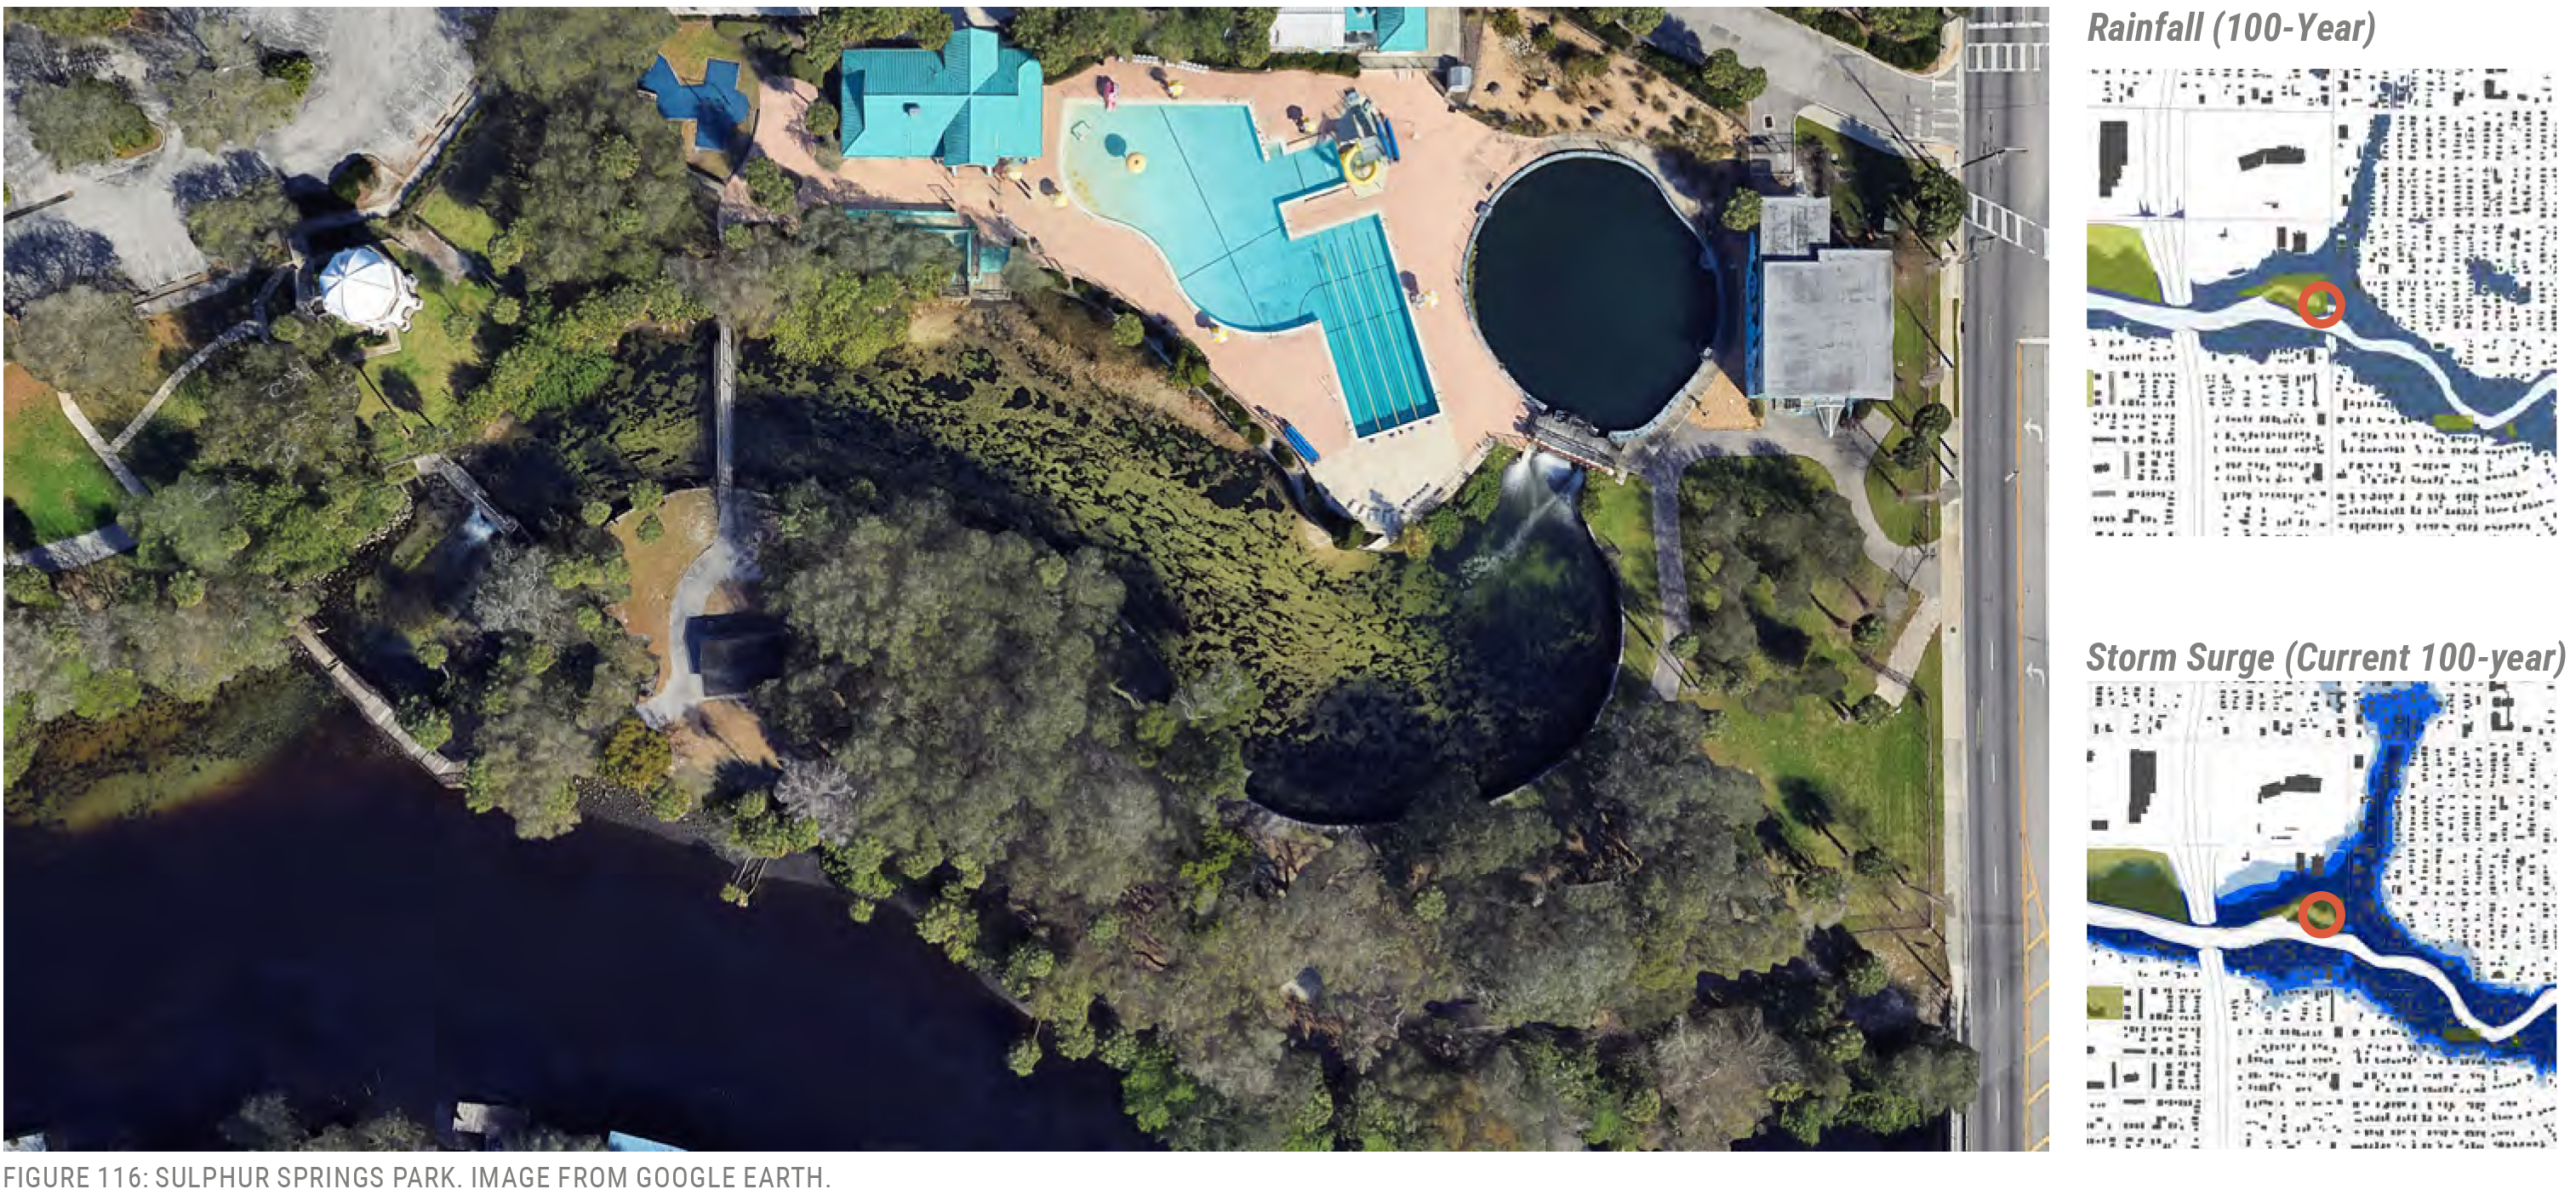
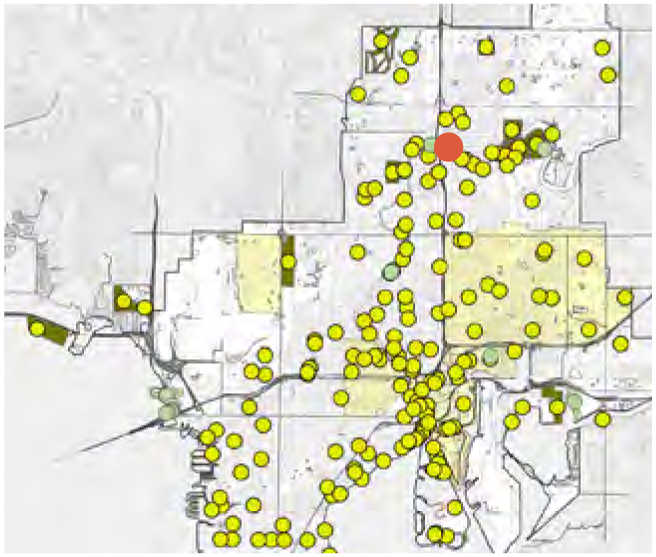
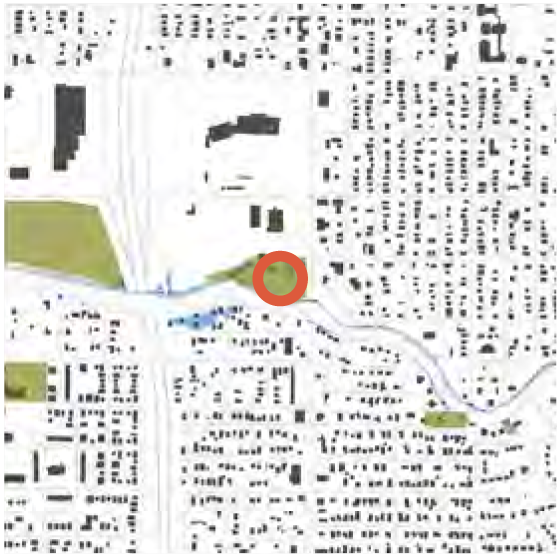
FIRST RESPONDERS
First responder facilities include fire stations, law enforcement buildings, supply buildings, training facilities, coop facilities (where personnel reside while waiting for emergency events to pass), dispatch centers, and emergency response centers. These facilities are distributed throughout the city. Exact first floor elevations were not included in the data provided – sites would need to be evaluated for their actual risk. Water intrusion into the first floor could cause damage and render the facility compromised and non-occupiable. For fire and police stations, each location is responsible for coverage of a specific geographic area. If impacted, the consequences ripple throughout emergency response services. After a storm, the emergency management team reviews conditions for potential access using a drone.
FINDINGS
Sea Level Rise
No facilities are within 1-year stillwater floodplain projections.
Rainfall
Current rainfall projections show the following exposure to flooding:
- Fire Station 19, which includes boat storage – This facility has adjacent flooding, which may possibly impact the building and structure.
Storm Surge
For storm surge, with the 2070 intermediate high scenario, the list of potentially impacted facilities includes:
FIRE STATIONS
FINDINGS
- Fire Station 17 (with boat storage, in Davis Islands) – This facility is near 5.5 feet below the upper limit of the 2070 100-year storm surge. Boats are evacuated to COOP locations outside of evacuation zones prior to landfall of hurricanes. This facility would need substantial renovation to mitigate potential flood impacts. The surrounding transportation system would also be greatly impacted by a 100-year (1%) storm surge event.
- Fire Station 6 (Palmetto Beach) – This facility is near 2.1 feet below the upper limit of the 2070 100-year storm surge. This facility was built in the 1920’s. Hardening and flood-proofing could potentially resolve
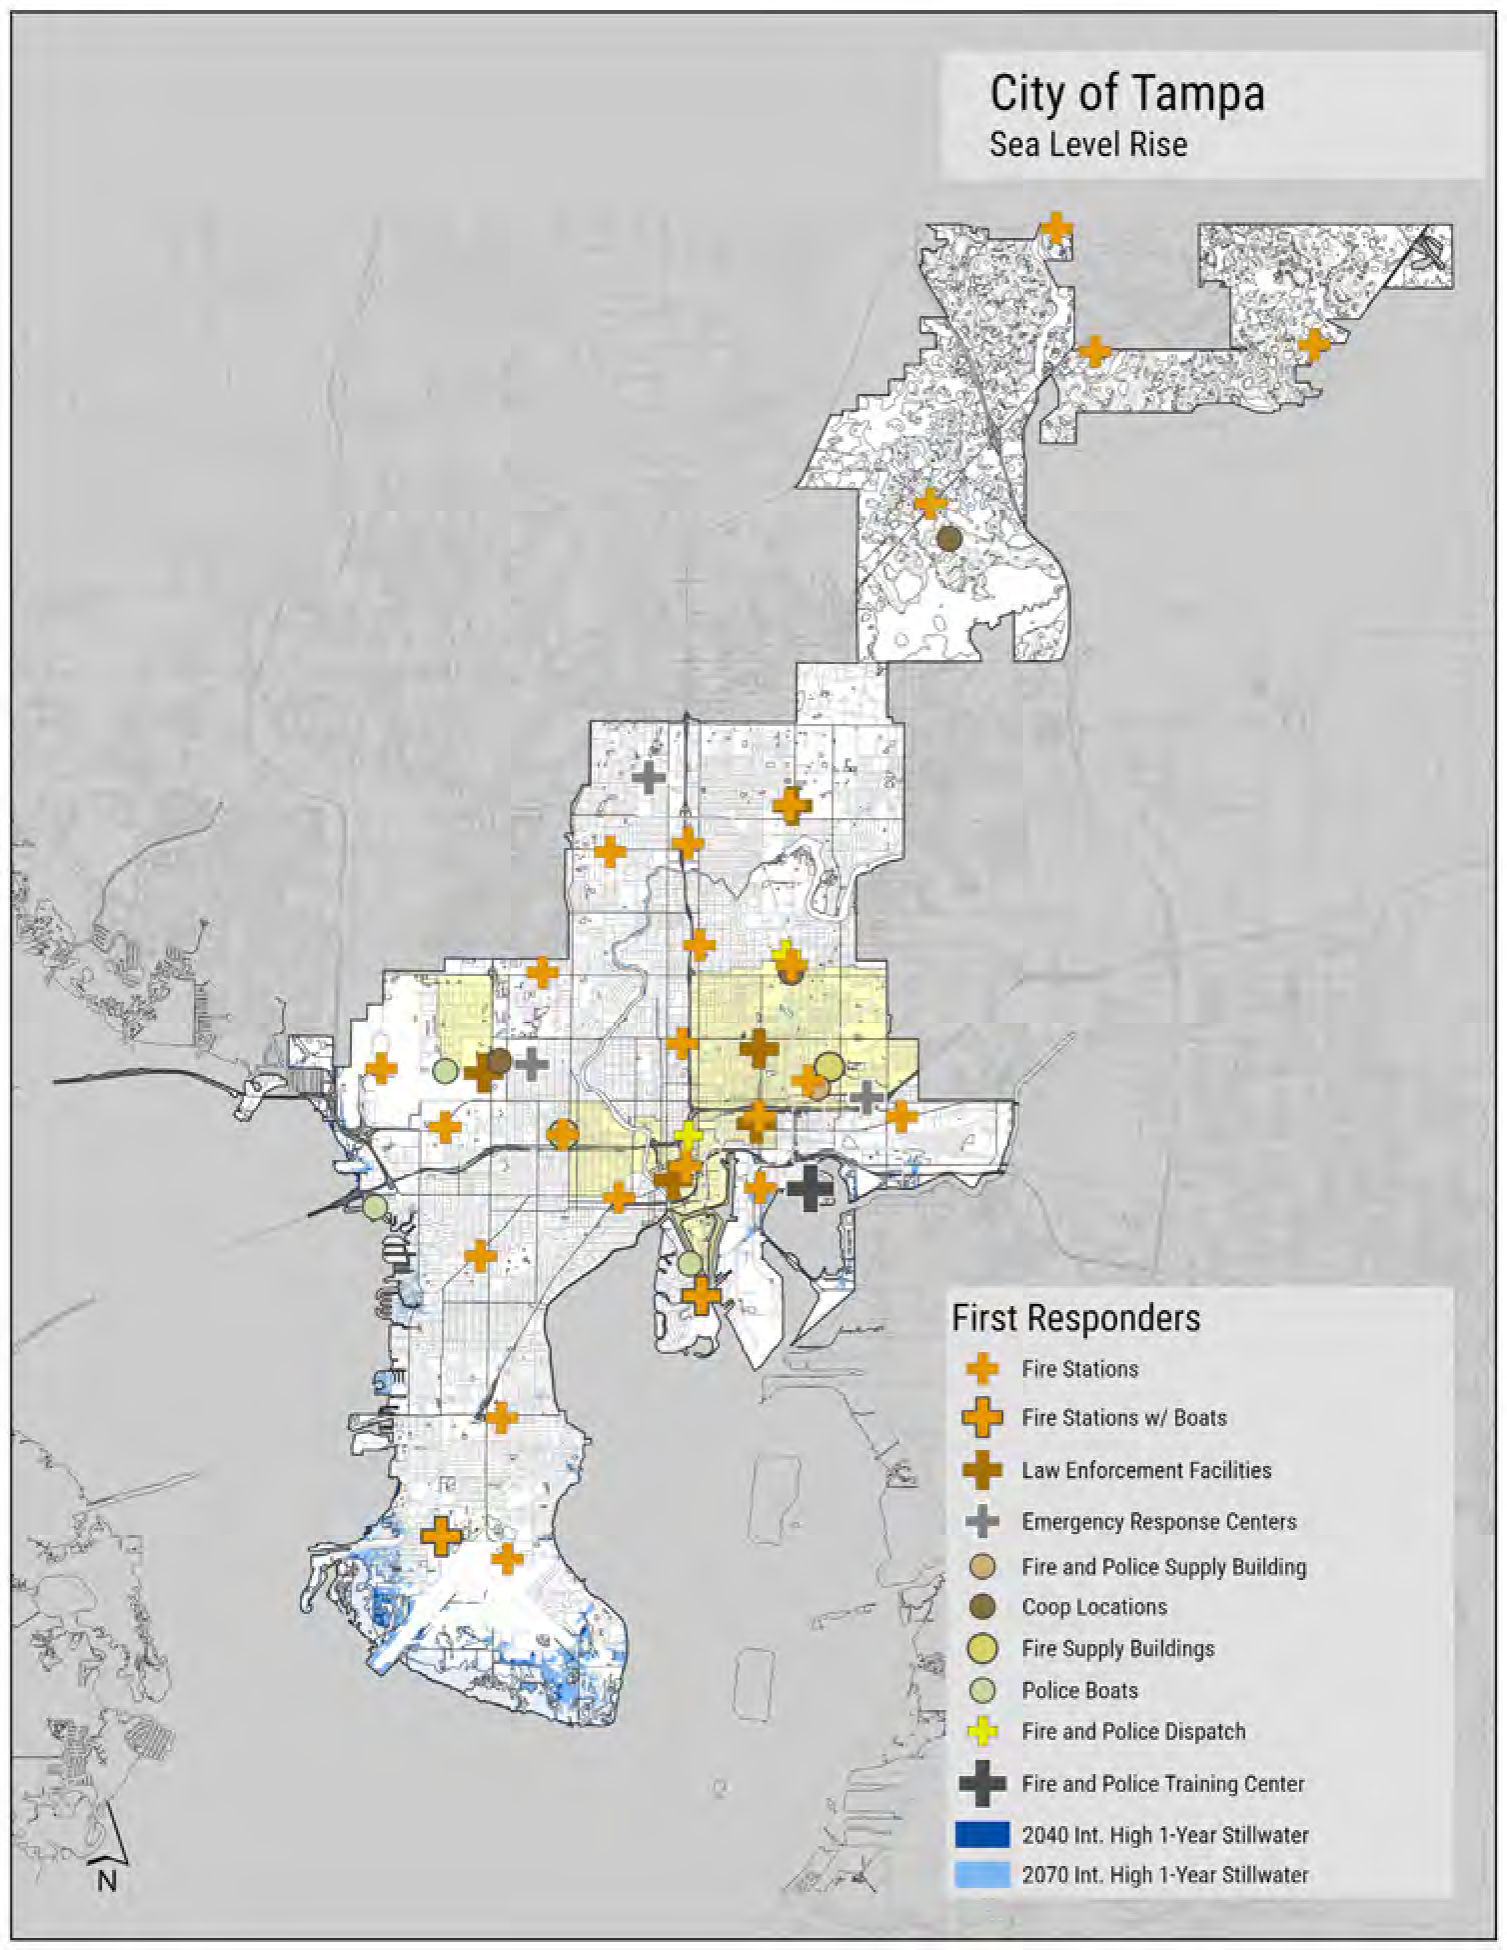
- Fire Station 19 (with boat storage, in Port Tampa City) – Minimally impacted, however the area would be difficult to access because of impacts to the transportation system. Emergency management personnel voiced that this facility “is the most vulnerable by far.”
- Fire Station 53 (MacDill Air Force Base) – Minimally impacted.
- Fire Station 15 (Gandy Boulevard) – Minimally impacted.
POLICE BOAT STORAGE
FINDINGS
- 205 South Hoover Boulevard – Near 8 feet below the upper limit of the 2070 100-year storm surge.
- 115 Columbia Drive – Near 6.25 feet below the upper limit of the 2070 100-year storm surge.
FIRE AND POLICE TRAINING CENTER
FINDINGS
- At the McKay Bay Peninsula – Near 1 foot below the upper limit of the 2070 100-year storm surge.
Fire stations should consider being built to Class IV standards.
It was noted that the main emergency response facility at the GTE Building is not constructed to meet category 5 hurricane wind speeds. Although not related to flooding, this represents a significant consequence of impact should that facility incur damages.
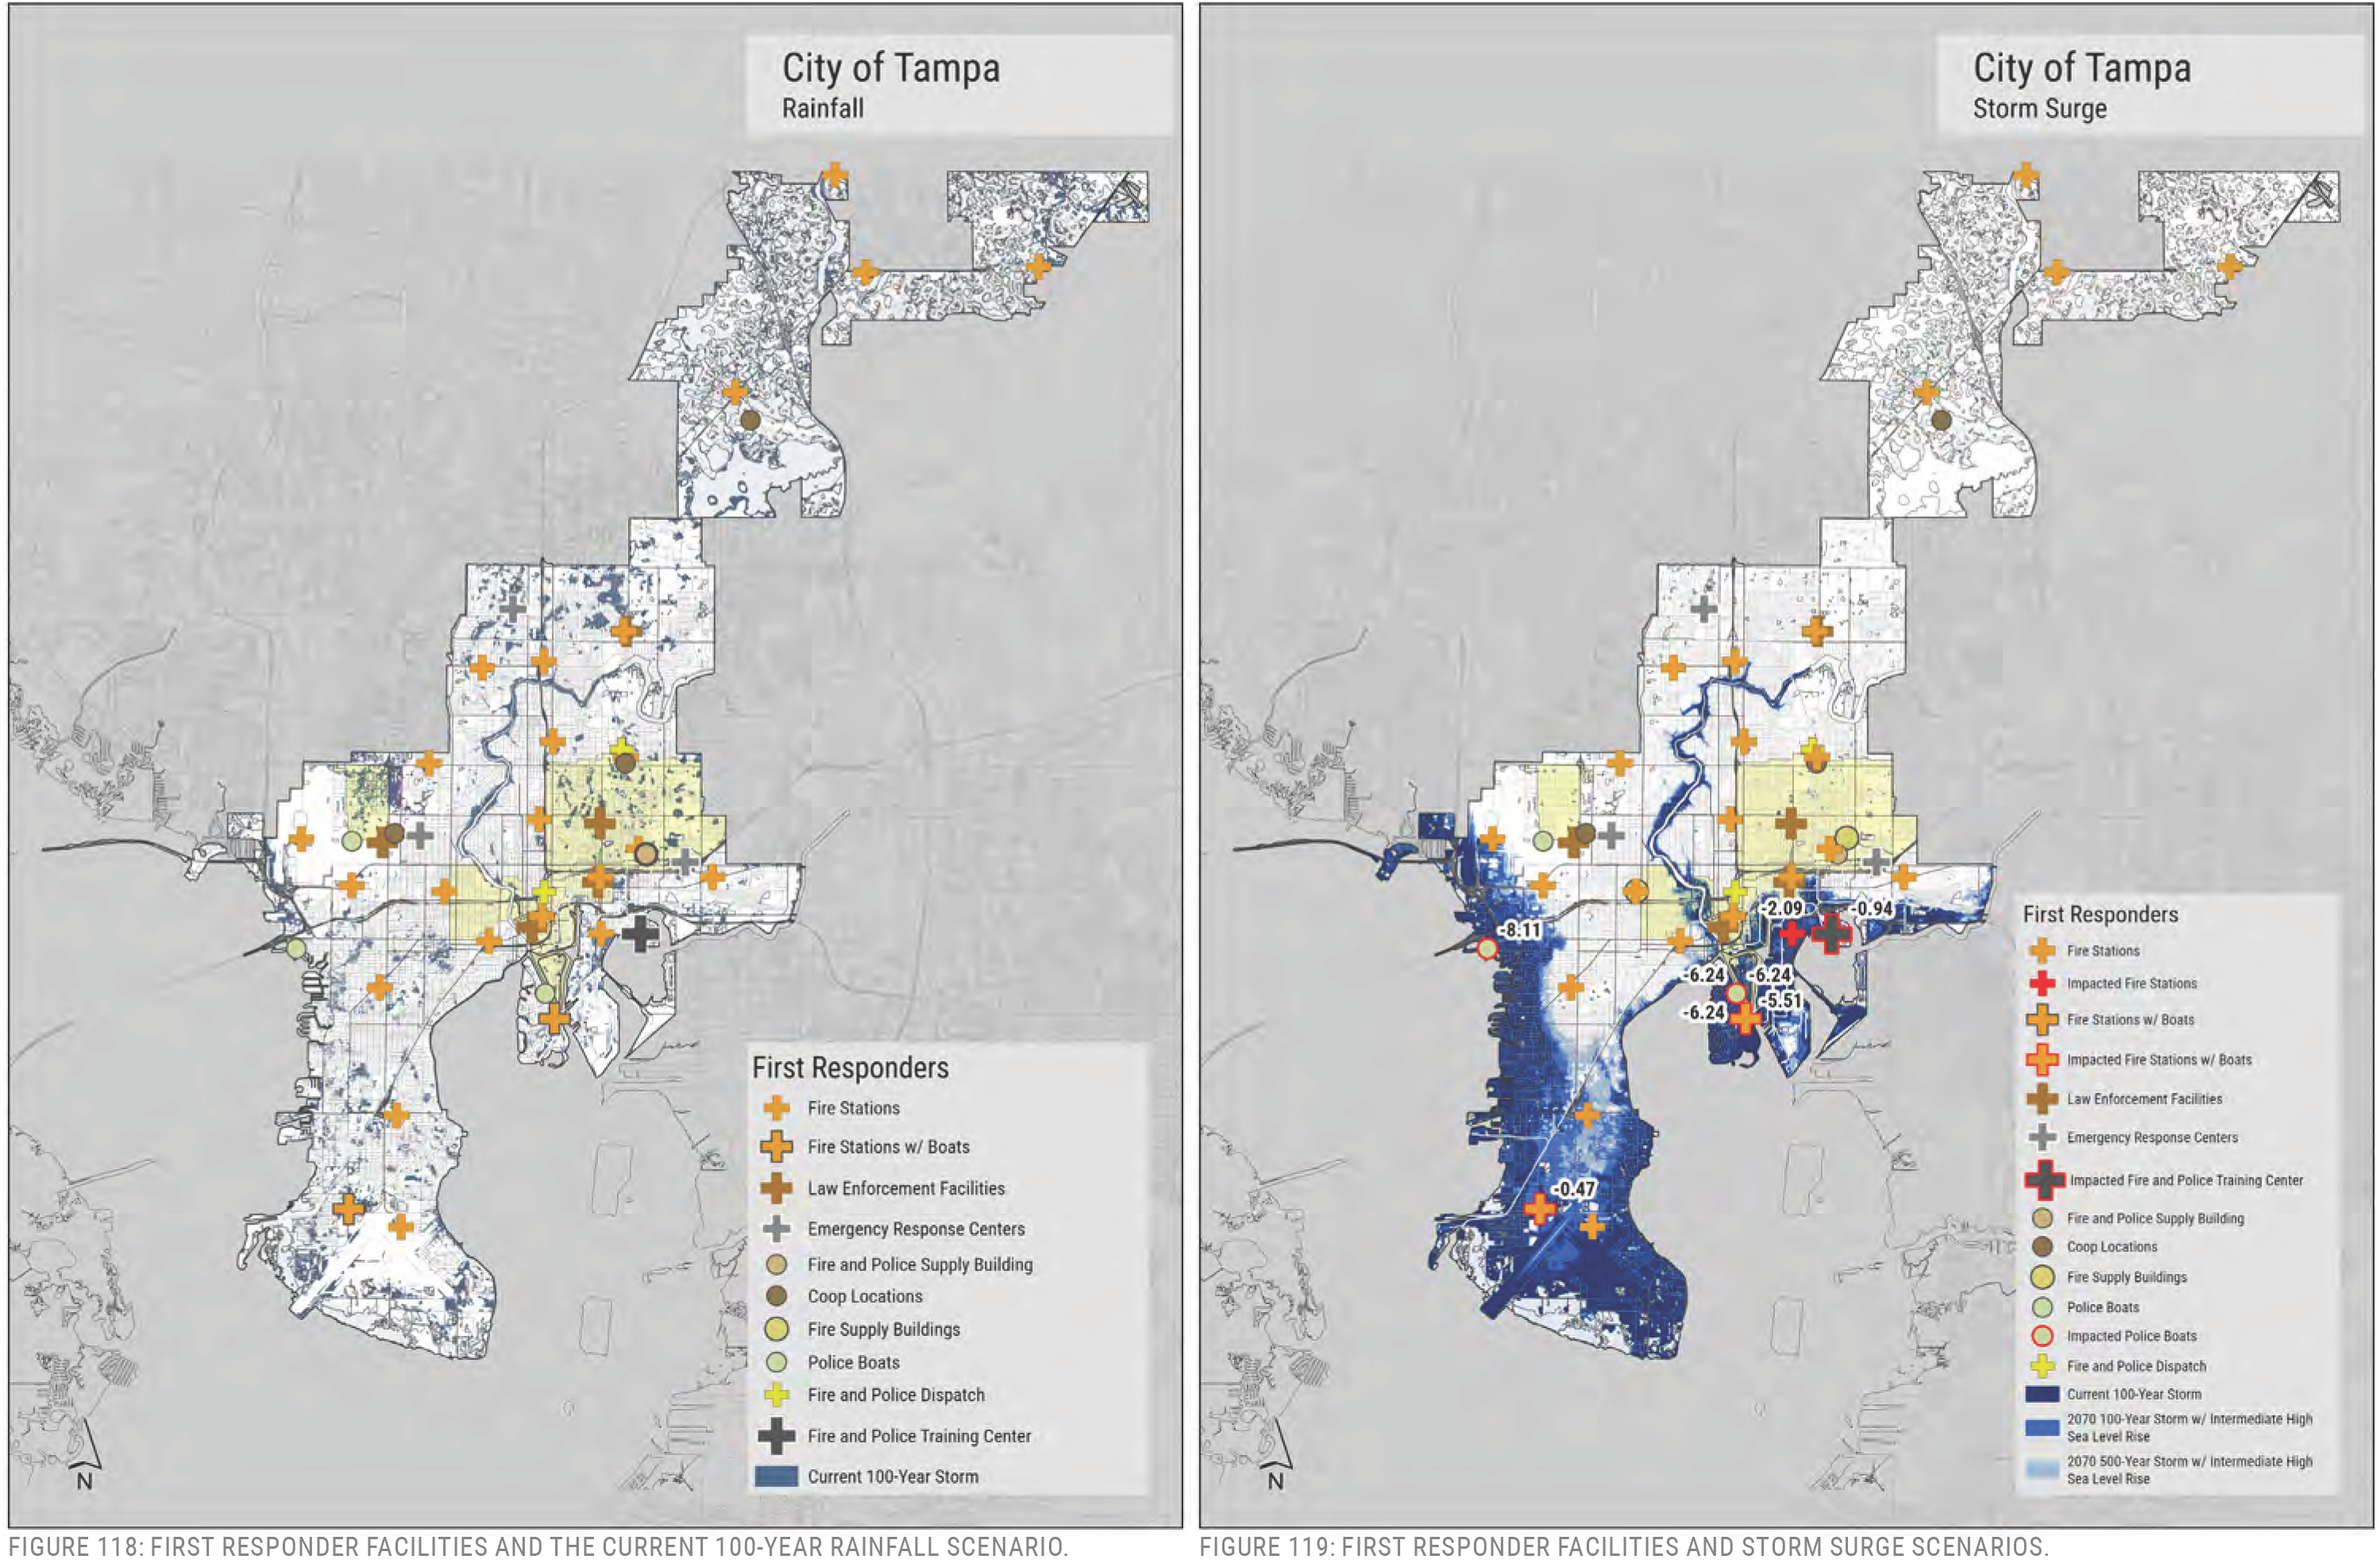
A few facilities were evaluated in closer detail.
Fire Station 6
311 South 22nd StreetFire Station / EMS Station
Vehicles: Engine 6; Hazardous Incident Team (HIT) 6
Vulnerabilities:
Location
| Elevation Scenario | Elevation (ft) |
|---|---|
| Current Elevation | 12.23’ |
| Base Flood Elevation (BFE) | 11’ |
| BFE + 2 | 13’ |
| Sea Level Rise | |
| BFE + 2, + 2040 IH (0.79’) | 13.79’ |
| BFE + 2, + 2070 IH (2.76’) | 15.76’ |
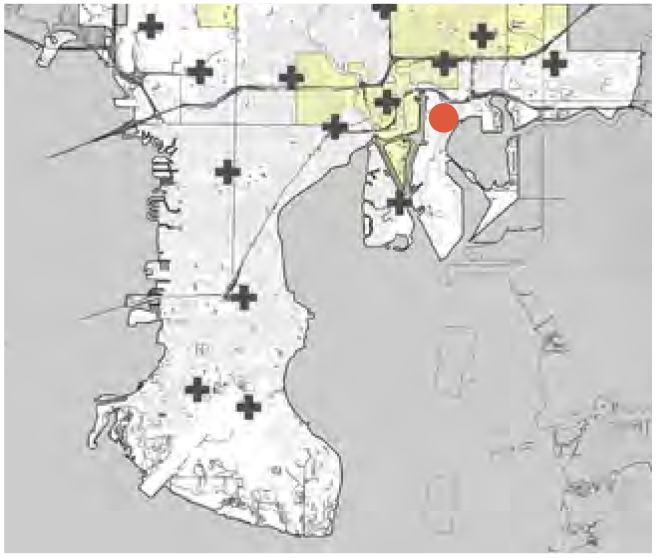
- Storm Surge
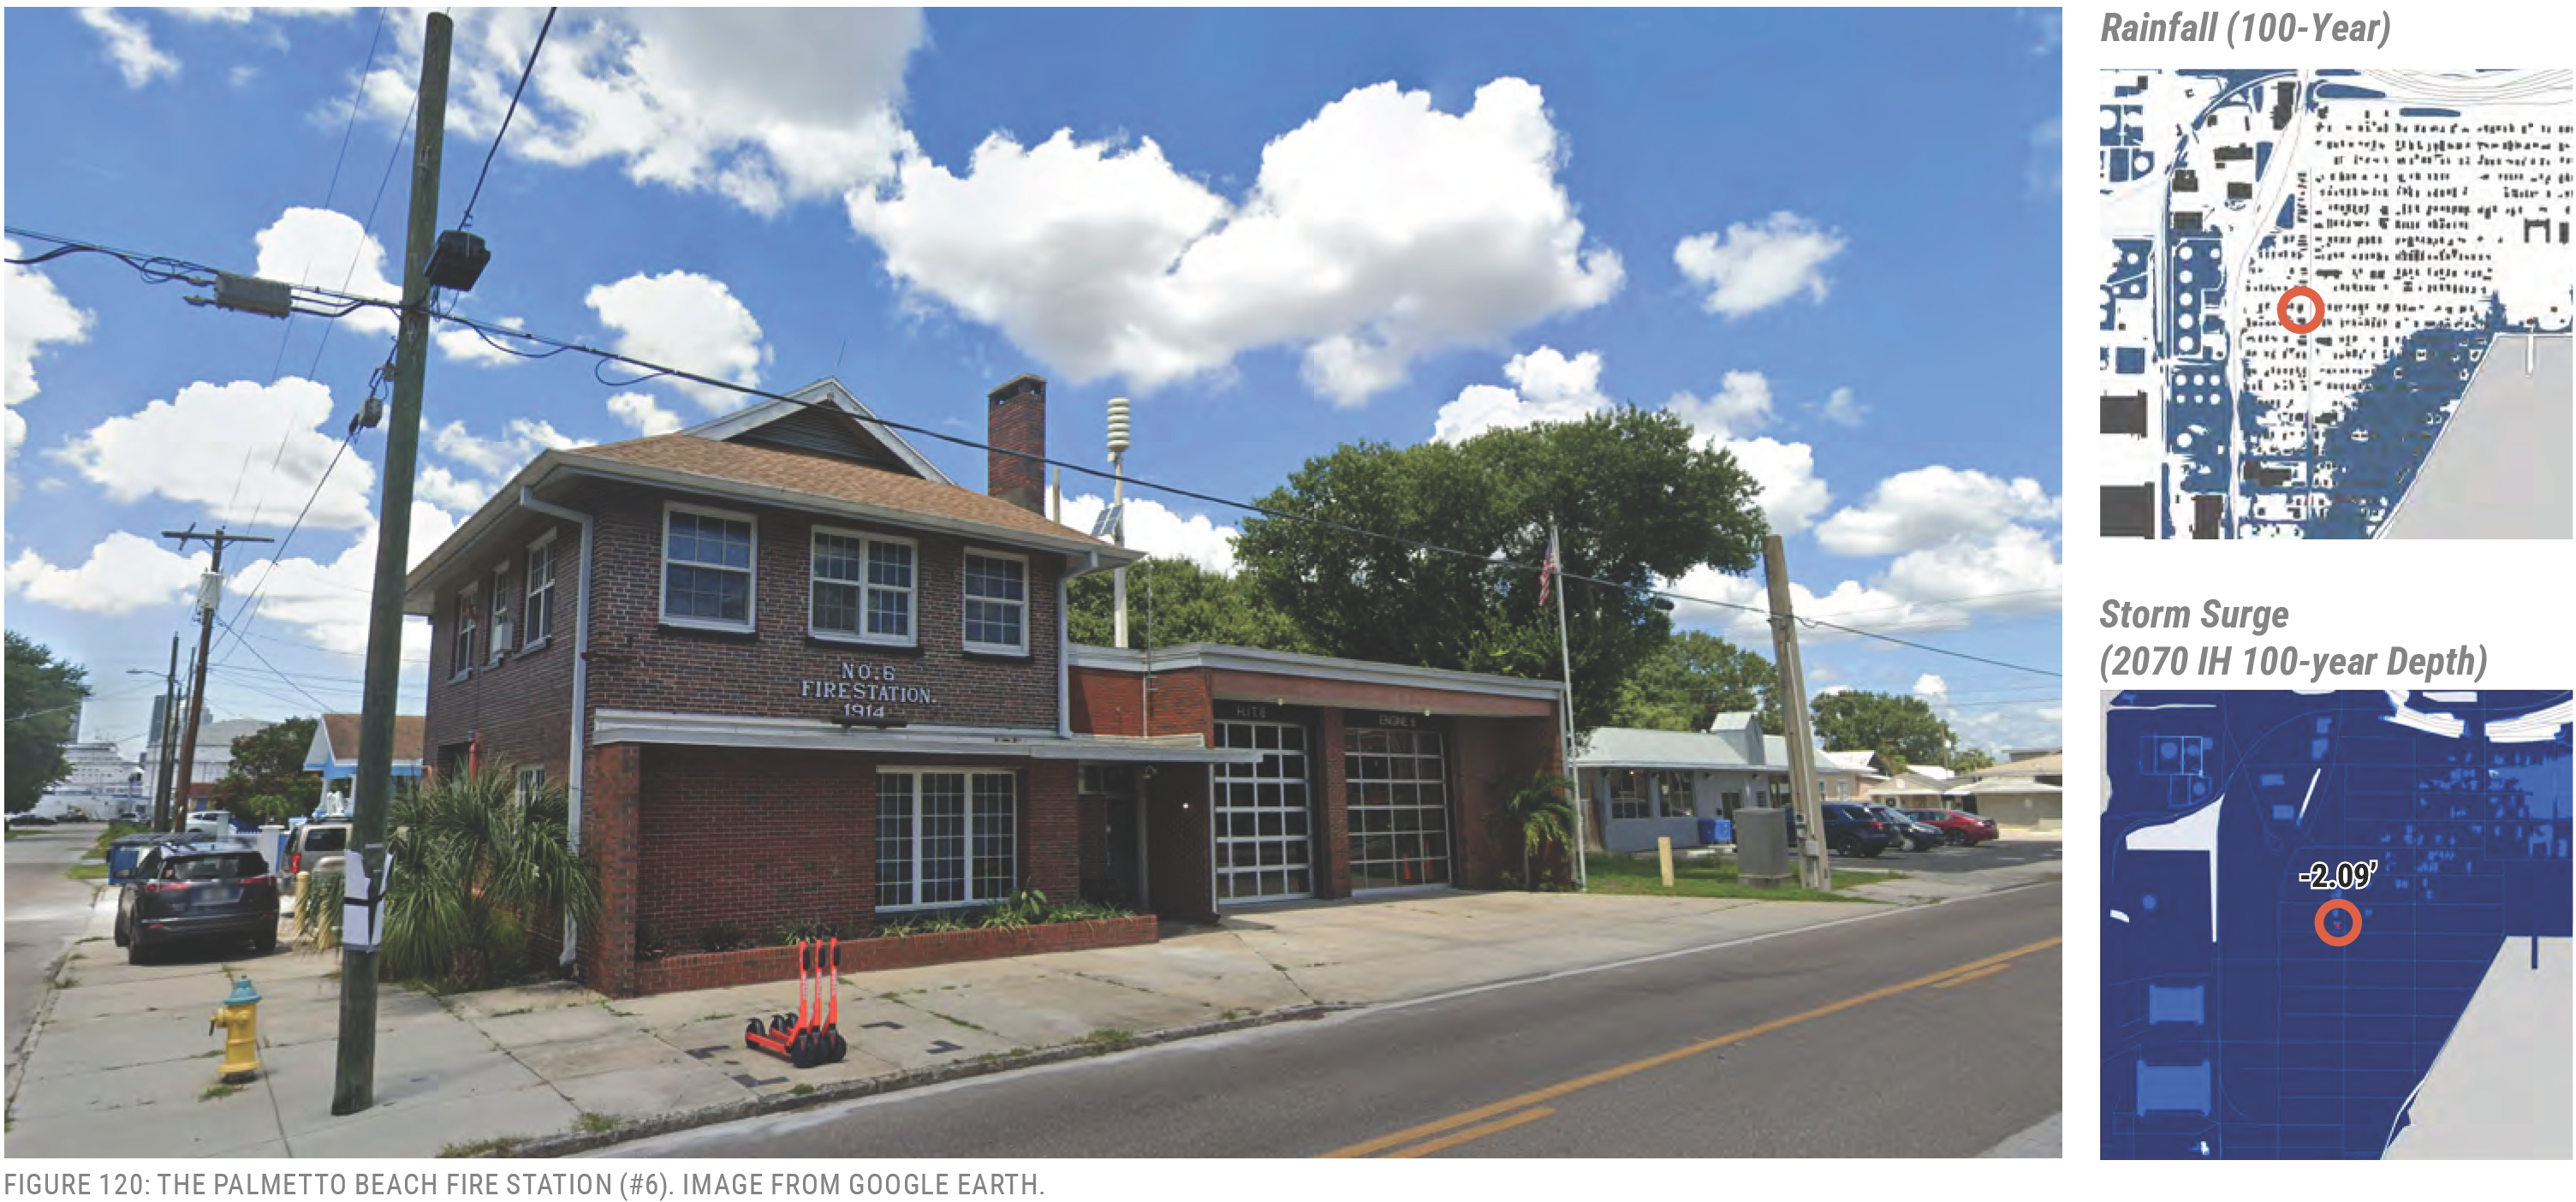
Sea Level Rise (2040 and 2070 IH)
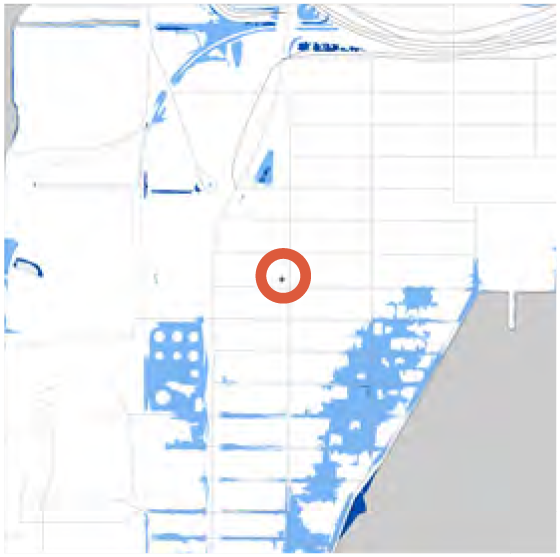
Fire Station 17
601 East Davis Boulevard
Fire Station / EMS Station
Vehicles: Engine 17; Fireboat 1, 17; Brush 17
Vulnerabilities:
- Potential SLR (Road Access)
- Storm Surge
| Elevation Scenario | Elevation (ft) |
|---|---|
| Current Elevation | 8.16’ |
| Base Flood Elevation (BFE) | 11’ |
| BFE + 2 | 13’ |
| Sea Level Rise | |
| BFE + 2, + 2040 IH (0.79’) | 13.79’ |
| BFE + 2, + 2070 IH (2.76’) | 15.76’ |
Location
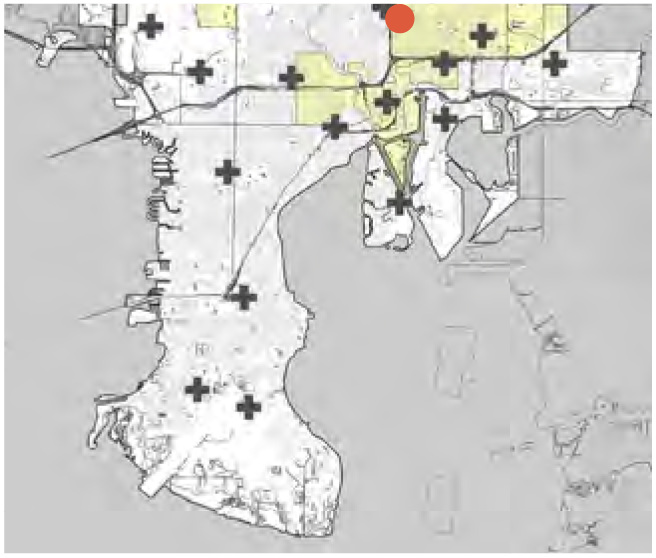
Sea Level Rise (2040 and 2070 IH)
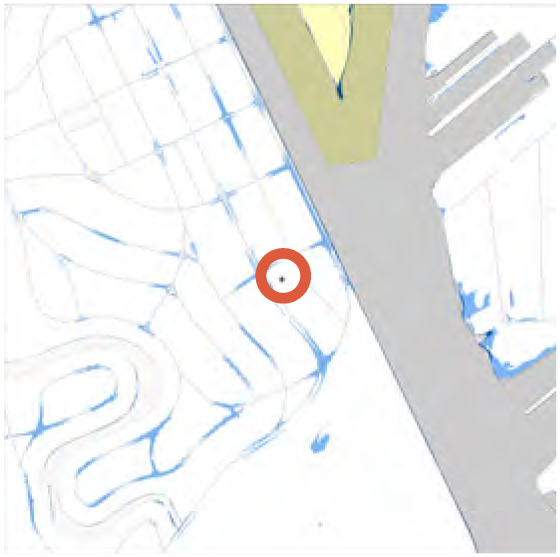
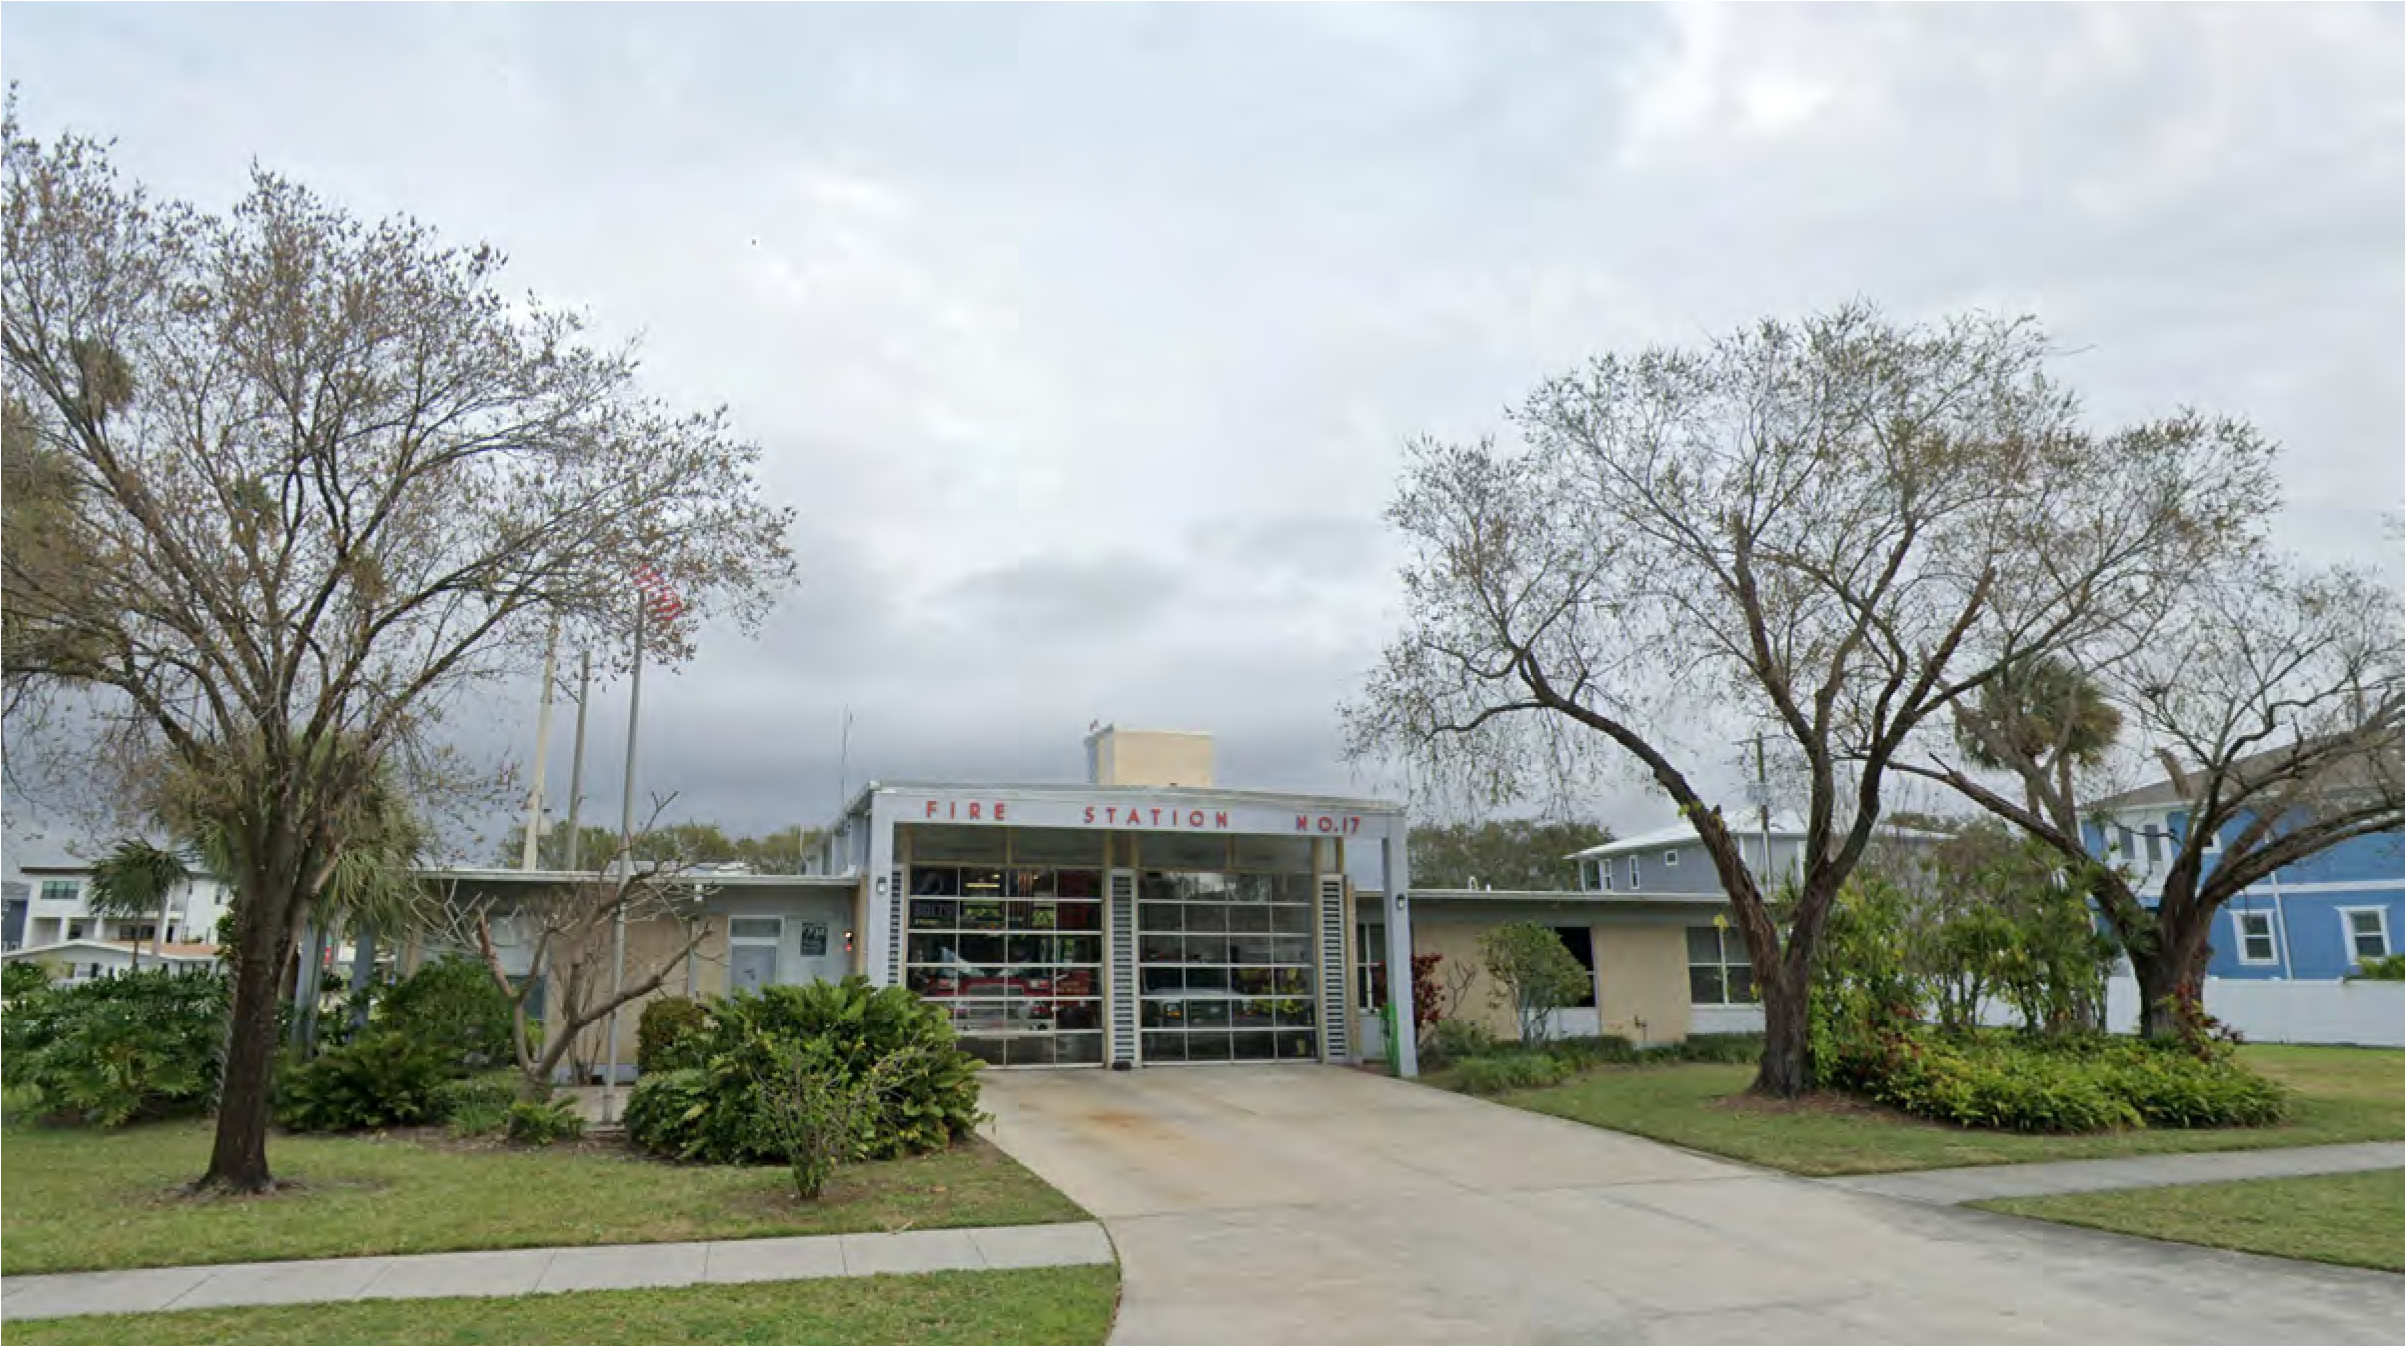
Rainfall (100-Year)
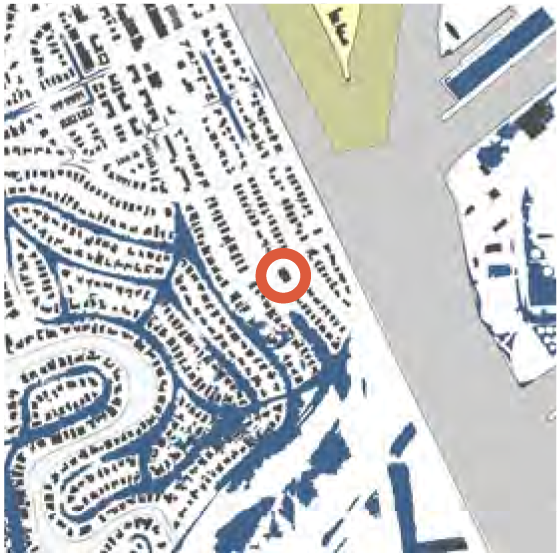
Storm Surge (Current 100-year)
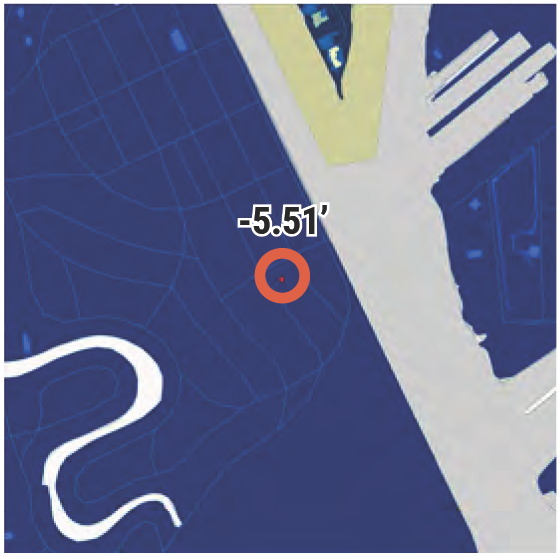
Fire Station 19
- Rainfall
- Storm Surge
| Elevation Scenario | Elevation (feet) |
|---|---|
| Current Elevation | 12.0’ |
| Base Flood Elevation (BFE) | 10’ |
| BFE + 2 | 12’ |
| Sea Level Rise | |
| BFE + 2, + 2040 IH (0.79’) | 12.79’ |
| BFE + 2, + 2070 IH (2.76’) | 14.76’ |
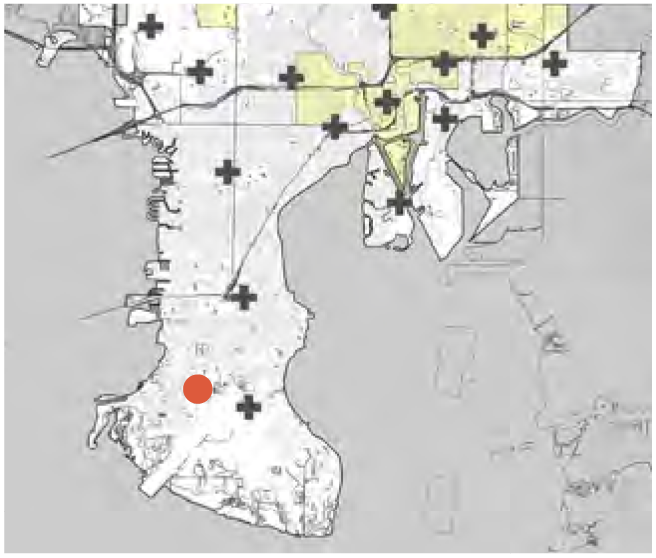
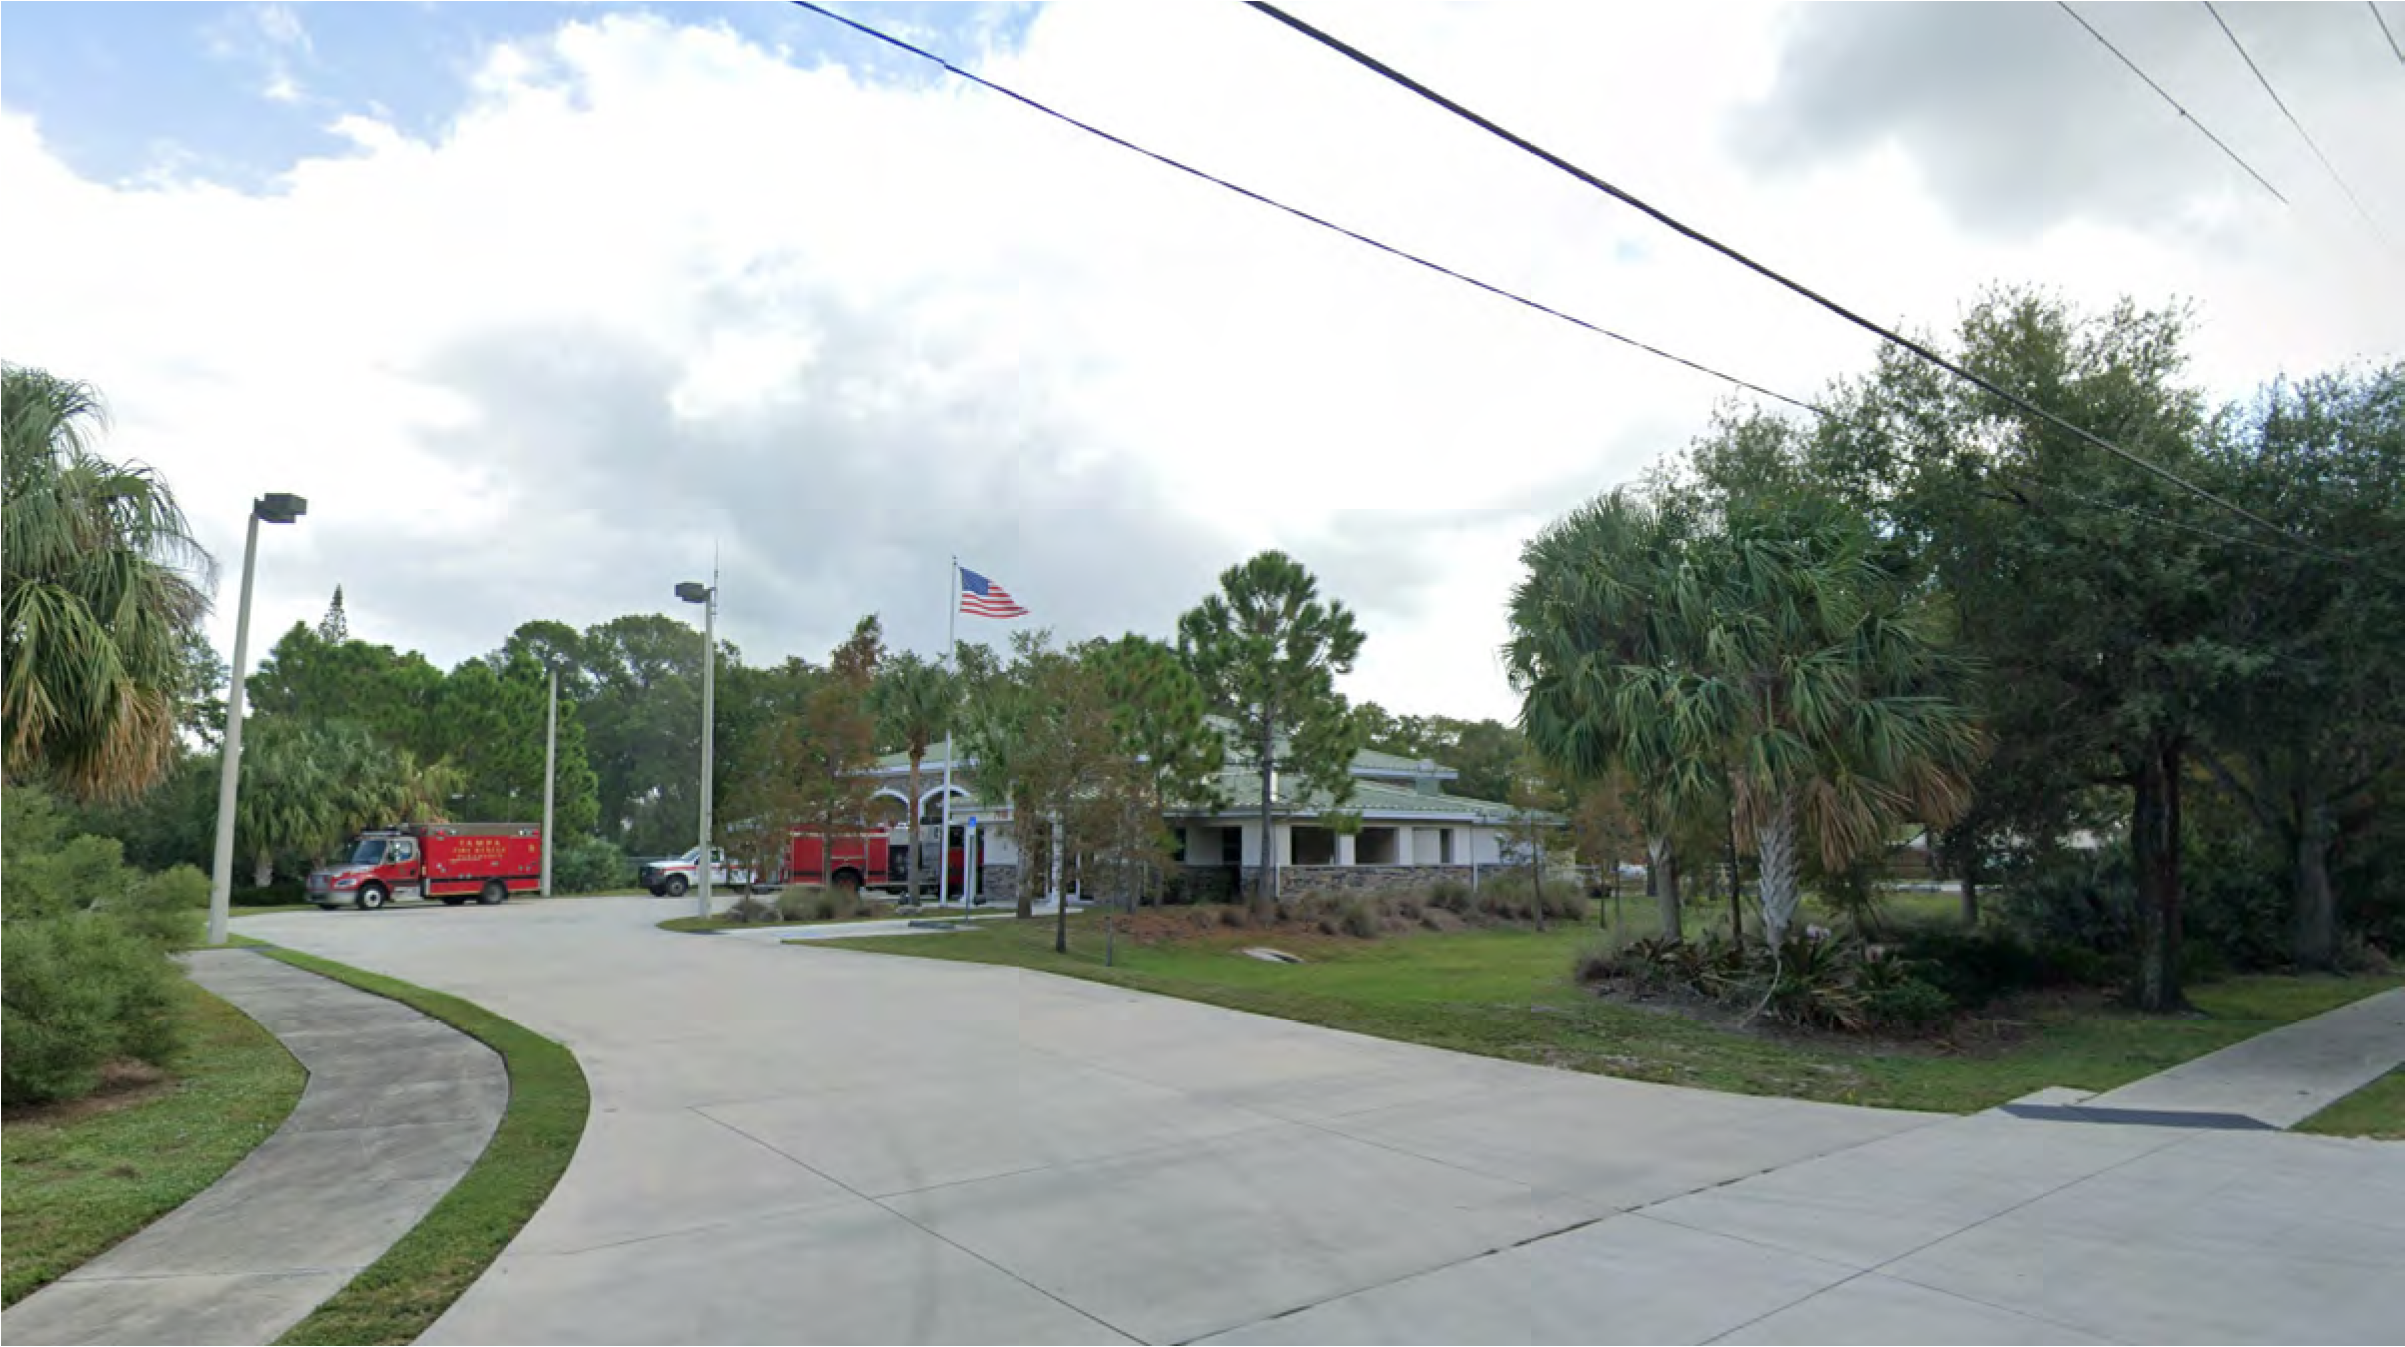
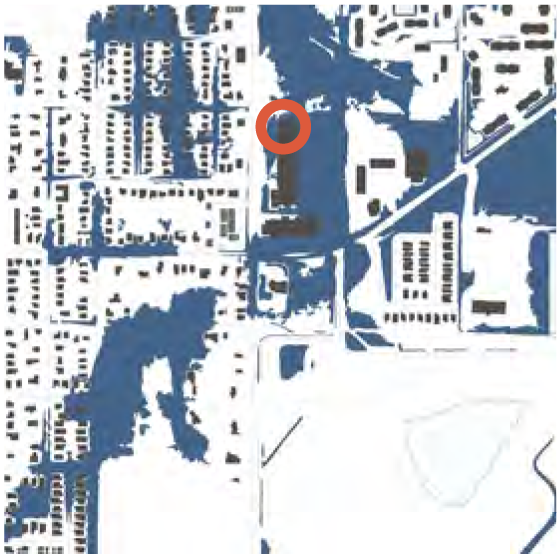
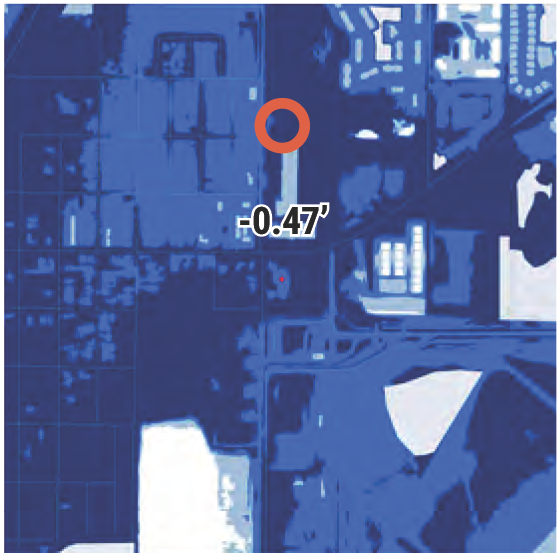
EMERGENCY LOGISTICS
During hazardous events there are facilities and procedures that become operational. Within the City of Tampa this includes evacuation shelters, disaster recovery centers, disaster debris management sites, emergency operation centers, and logistical staging areas. These facilities are managed and coordinated between Hillsborough County and the City of Tampa.
Critical equipment and first responders retreat to COOP location in the event of a surge event. These areas are of primary concern and should be evaluated for access and security during surge and heavy rainfall situations. Push routes are the first corridors cleared after a major weather event. These roads connect important critical facilities. Although this data was not included as part of this study, it would be important to reconcile push routes with flood scenarios to ensure that they are accessible during heavy rains.
Most of the evacuation shelters are located in East Tampa and at the University of South Florida – there are none west of the Hillsborough River, in the Tampa Peninsula or in West Tampa. Debris sites and communication towers are dispersed evenly throughout the city. A primary hub for debris management is at the McKay Bay Peninsula, where there is a solid waste transfer center and the waste to energy plant.
FINDINGS
The only facilities vulnerable to flood scenarios studied by this project are disaster debris management sites, which would be at risk during a 100-year storm surge event. This includes:
- Gadsden Park
- McKay Bay Waste Transfer and Waste-to-Energy Site
- The Rome Avenue Site
- The River Tower Park Site
Access to the Tampa Brush site may be very difficult during hazardous weather events, especially considering that many of the surrounding roadways are vulnerable in the 100-year rainfall scenario, and that the South Tampa Peninsula is highly exposed to the 100-year storm surge event. Considering an elevated location with reasonable flood-proof access may be something to consider for debris management in South Tampa (South of Gandy).
Access may also be a problem near major logistical areas along Dale Mabry. Some locations, such as near Drew Park, are especially vulnerable to rainfall. In 2024, Hurricane Debby brought approximately six inches of rain to Tampa in 24 hours. The 100-year event is currently 11.4 inches, projected to increase to near 15 inches by 2070. During that storm roads flooded in Drew Park and the northbound ramp from Dale Mabry to Hillsborough Avenue was closed. Roads along Tampa Bay Boulevard, adjacent to HCC, were flooded but passable. In June 29, 2024, the city received 2.5 inches of rain in two hours causing a flood closure on Tampa Bay Boulevard. A HART bus was reported stuck according to the city’s stormwater complaints records (from the City of Tampa live stormwater map, June 29 2024).
Rainfall may also impede access to some evacuation shelters. This includes Lockhart Elementary and Heritage Elementary.
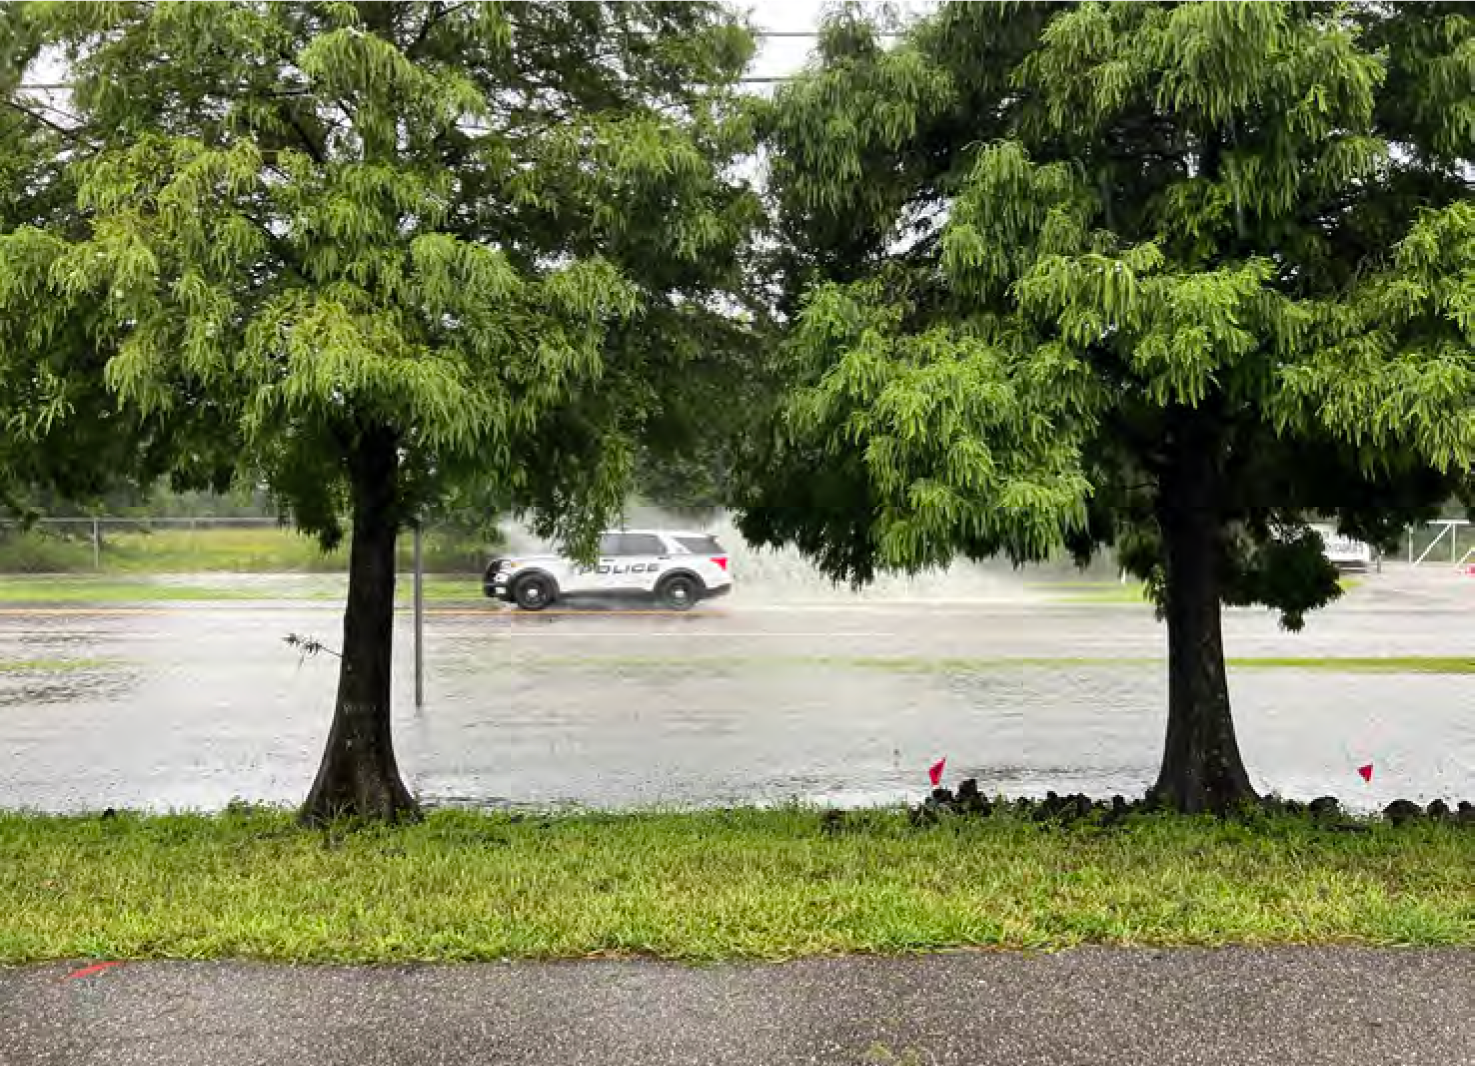
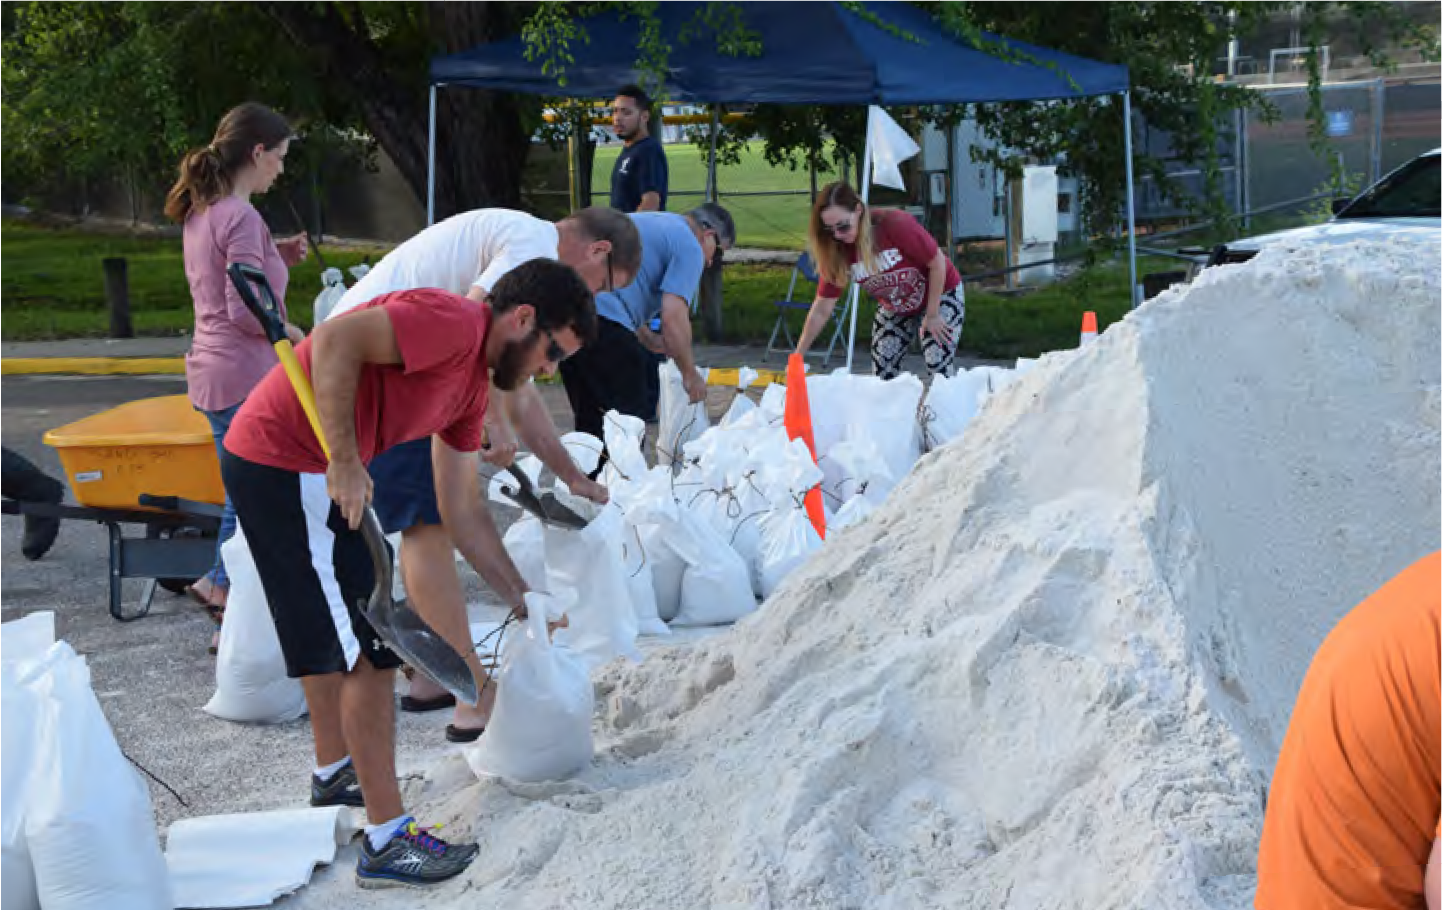
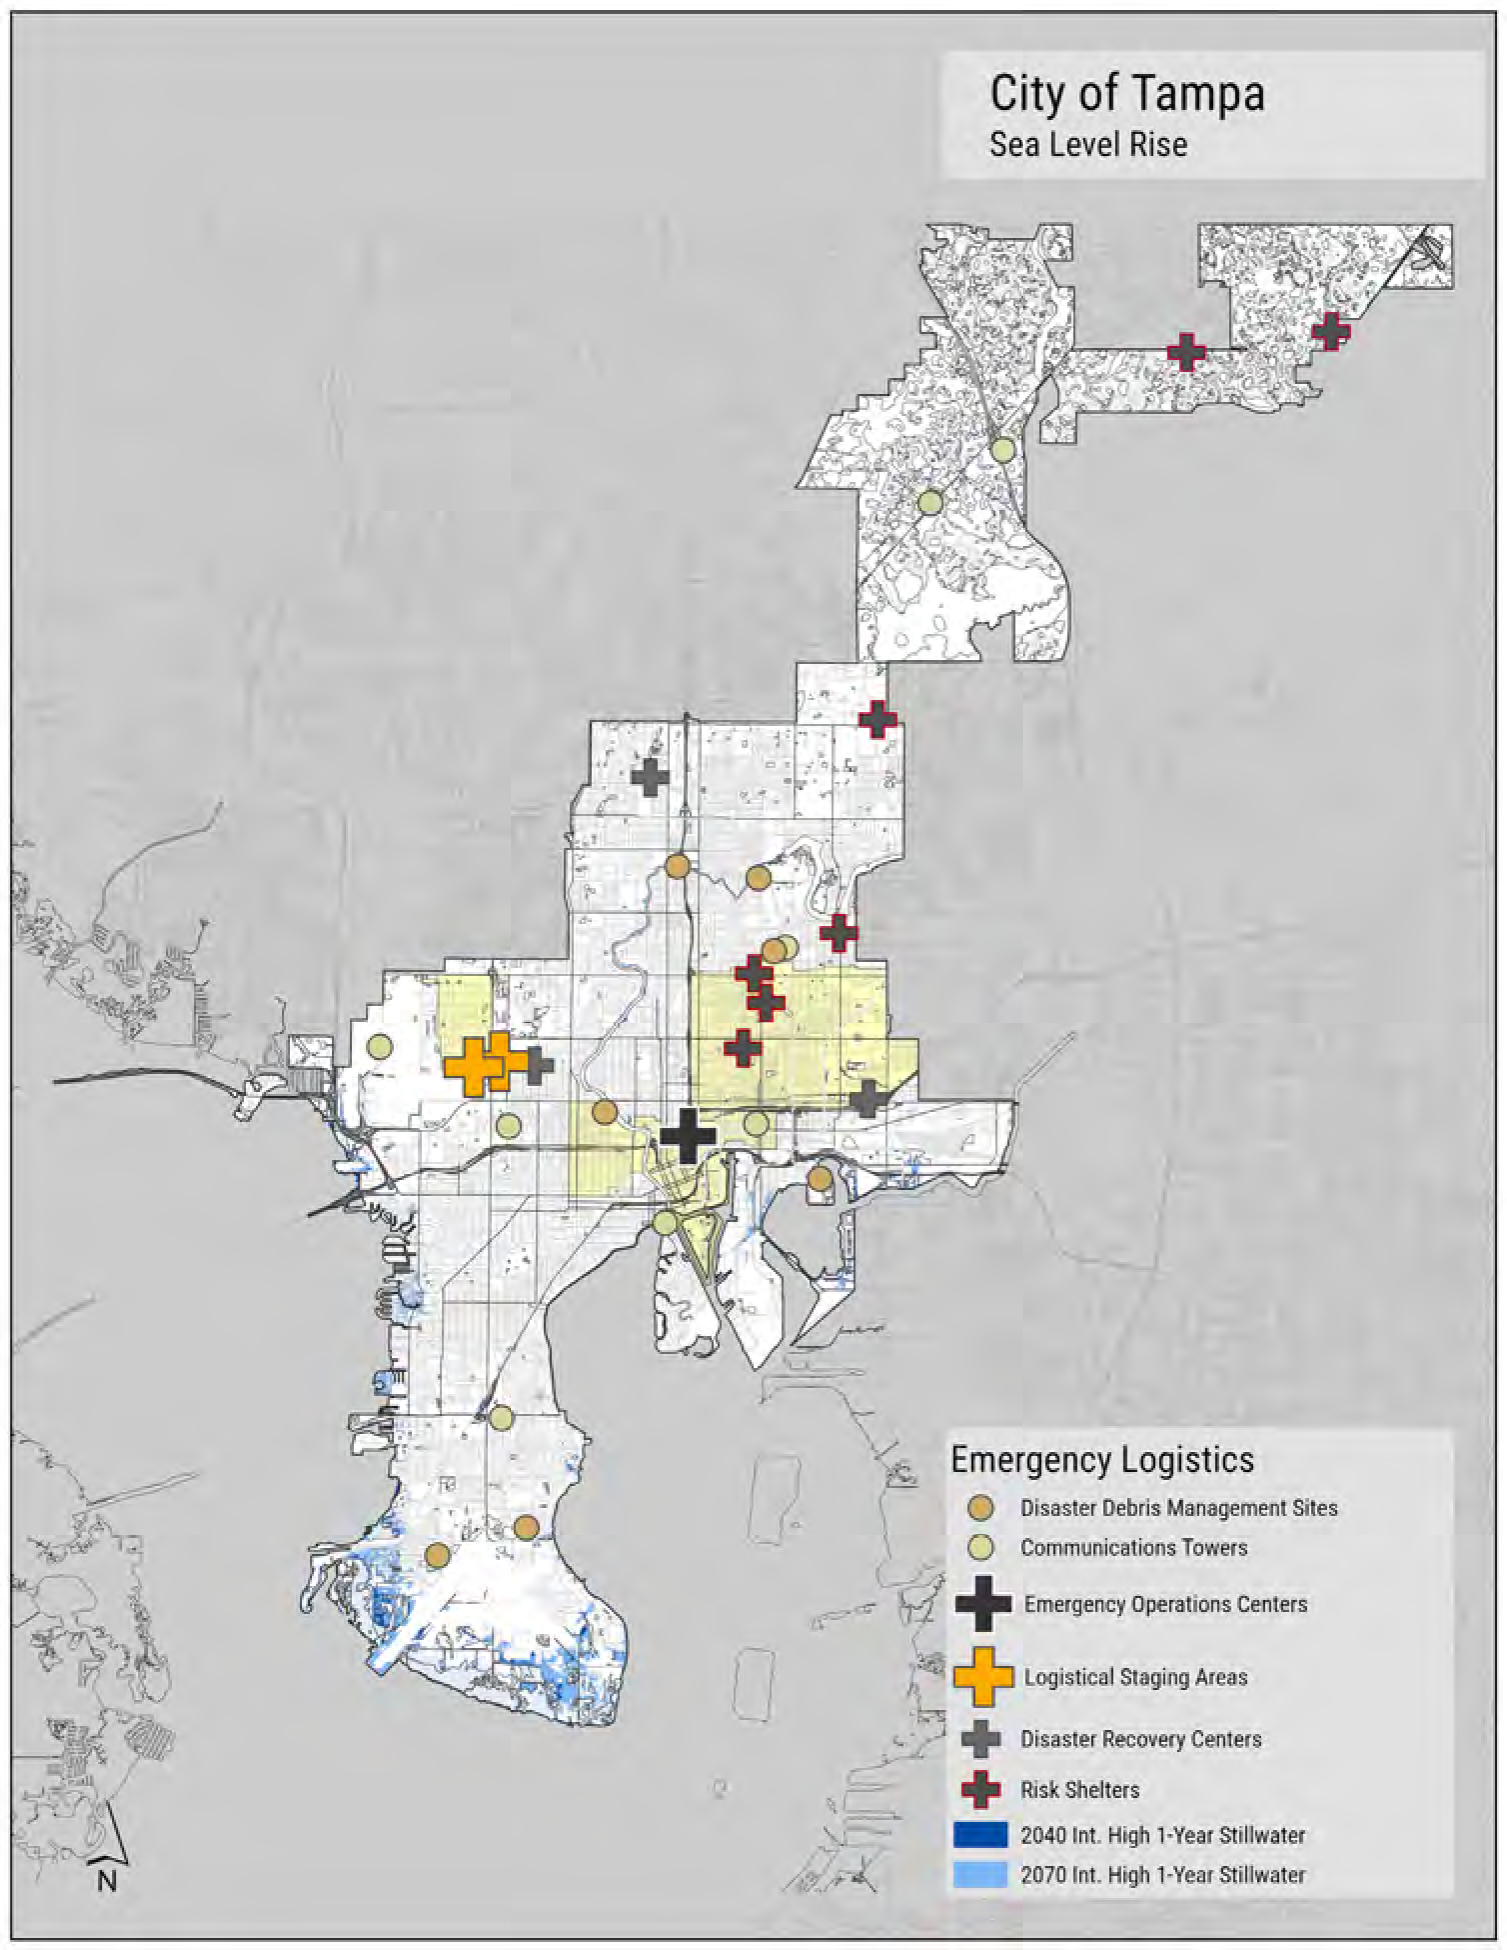
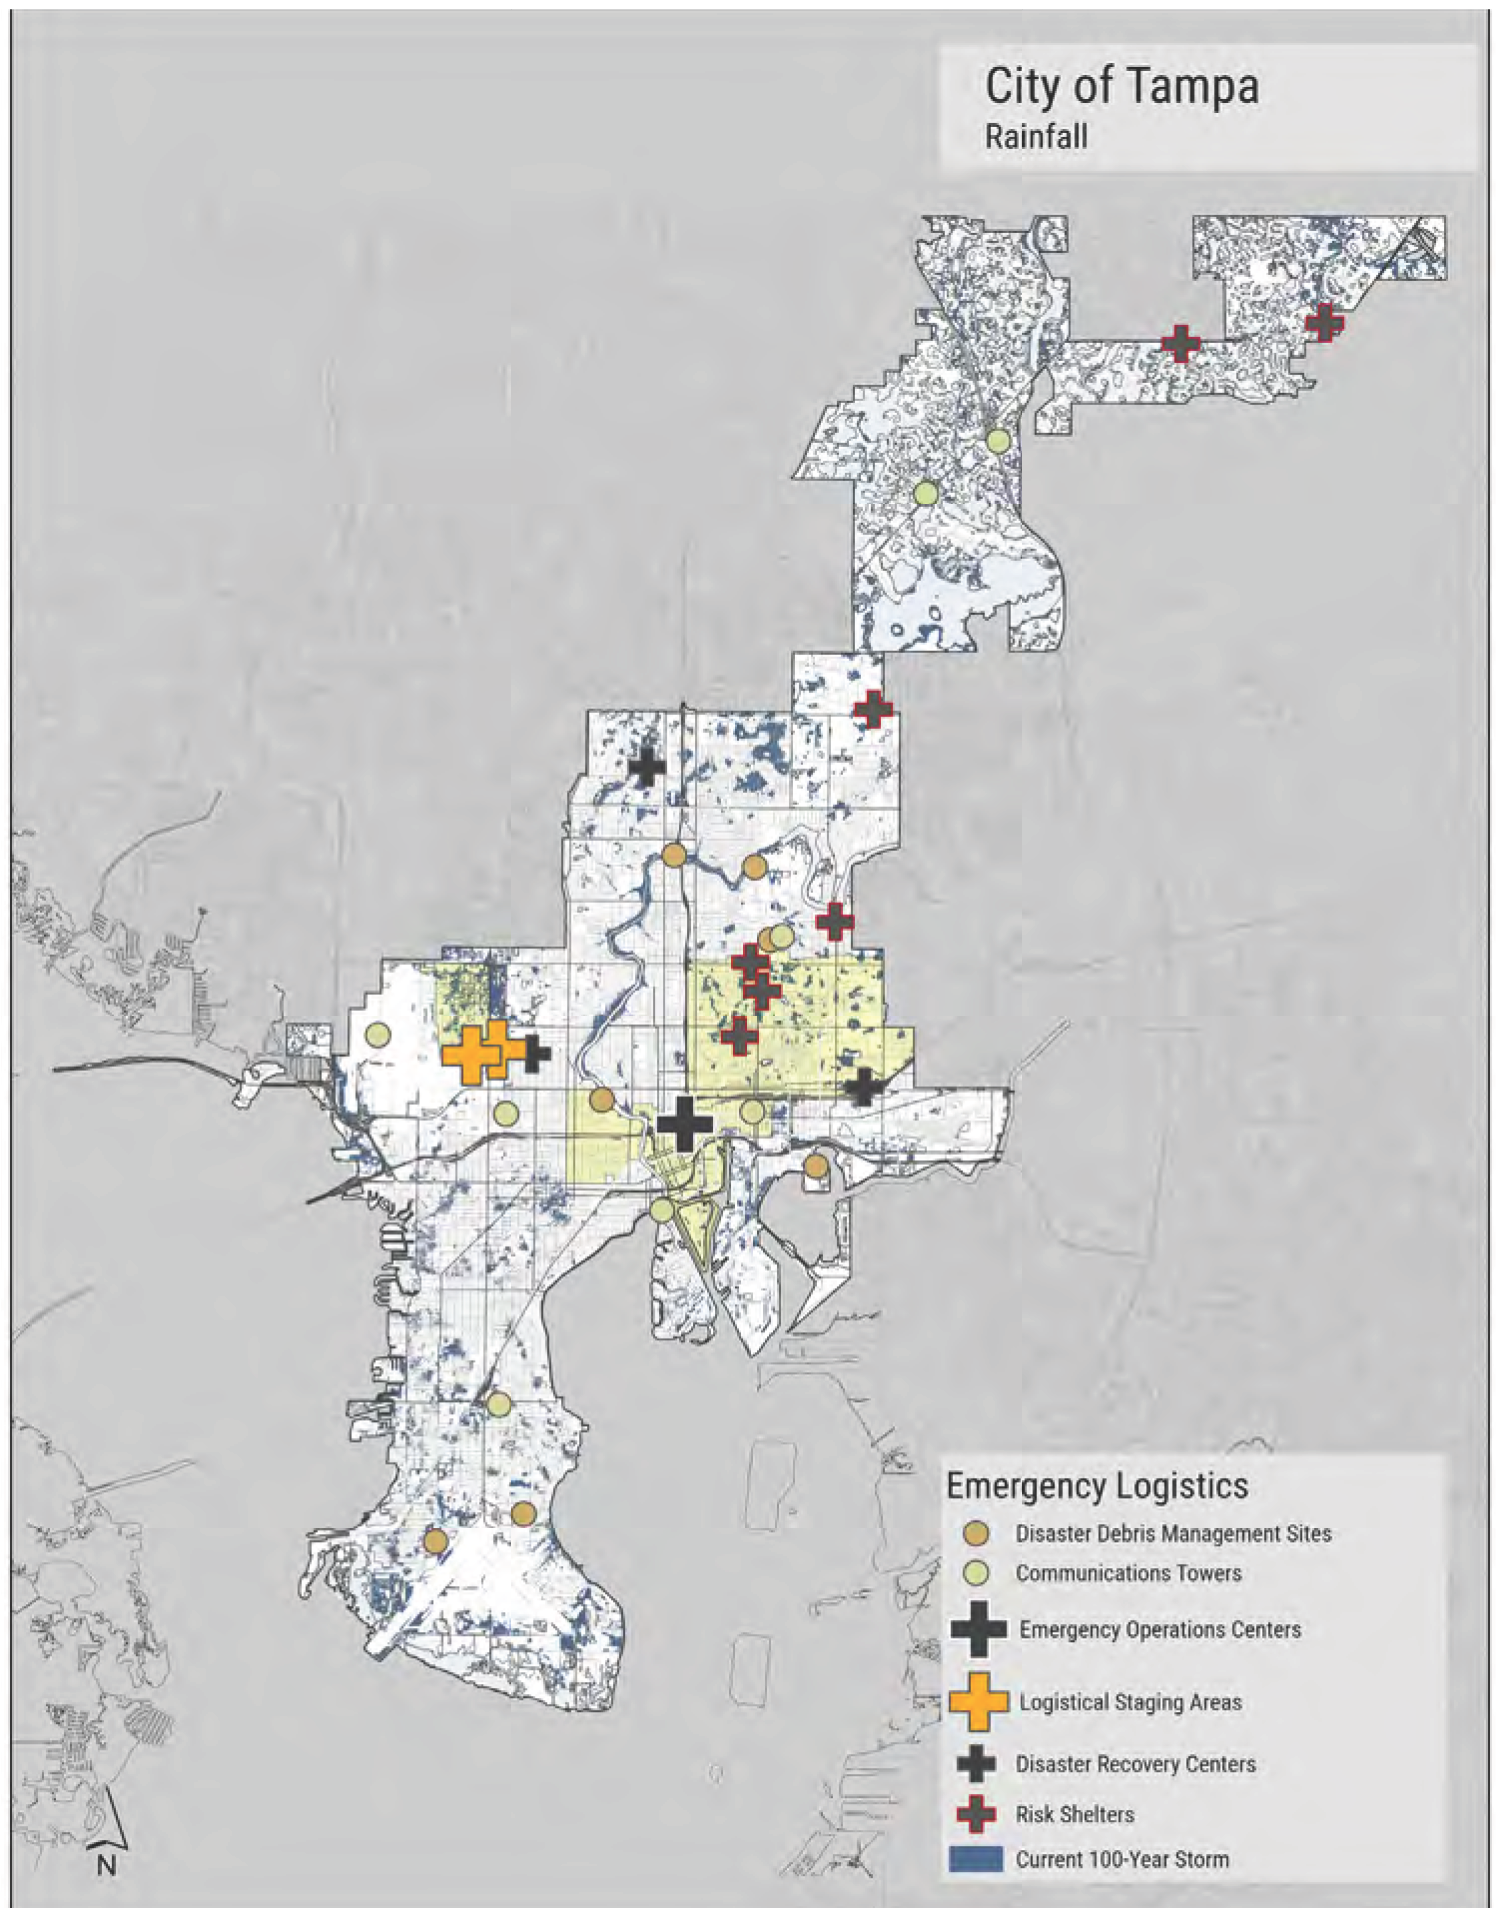
- City of Tampa Rainfall
- Emergency Logistics
- Disaster Debris Management Sites
- Communications Towers
- Emergency Operations Centers
- Logistical Staging Areas
- Disaster Recovery Centers
- Risk Shelters
- Current 100-Year Storm
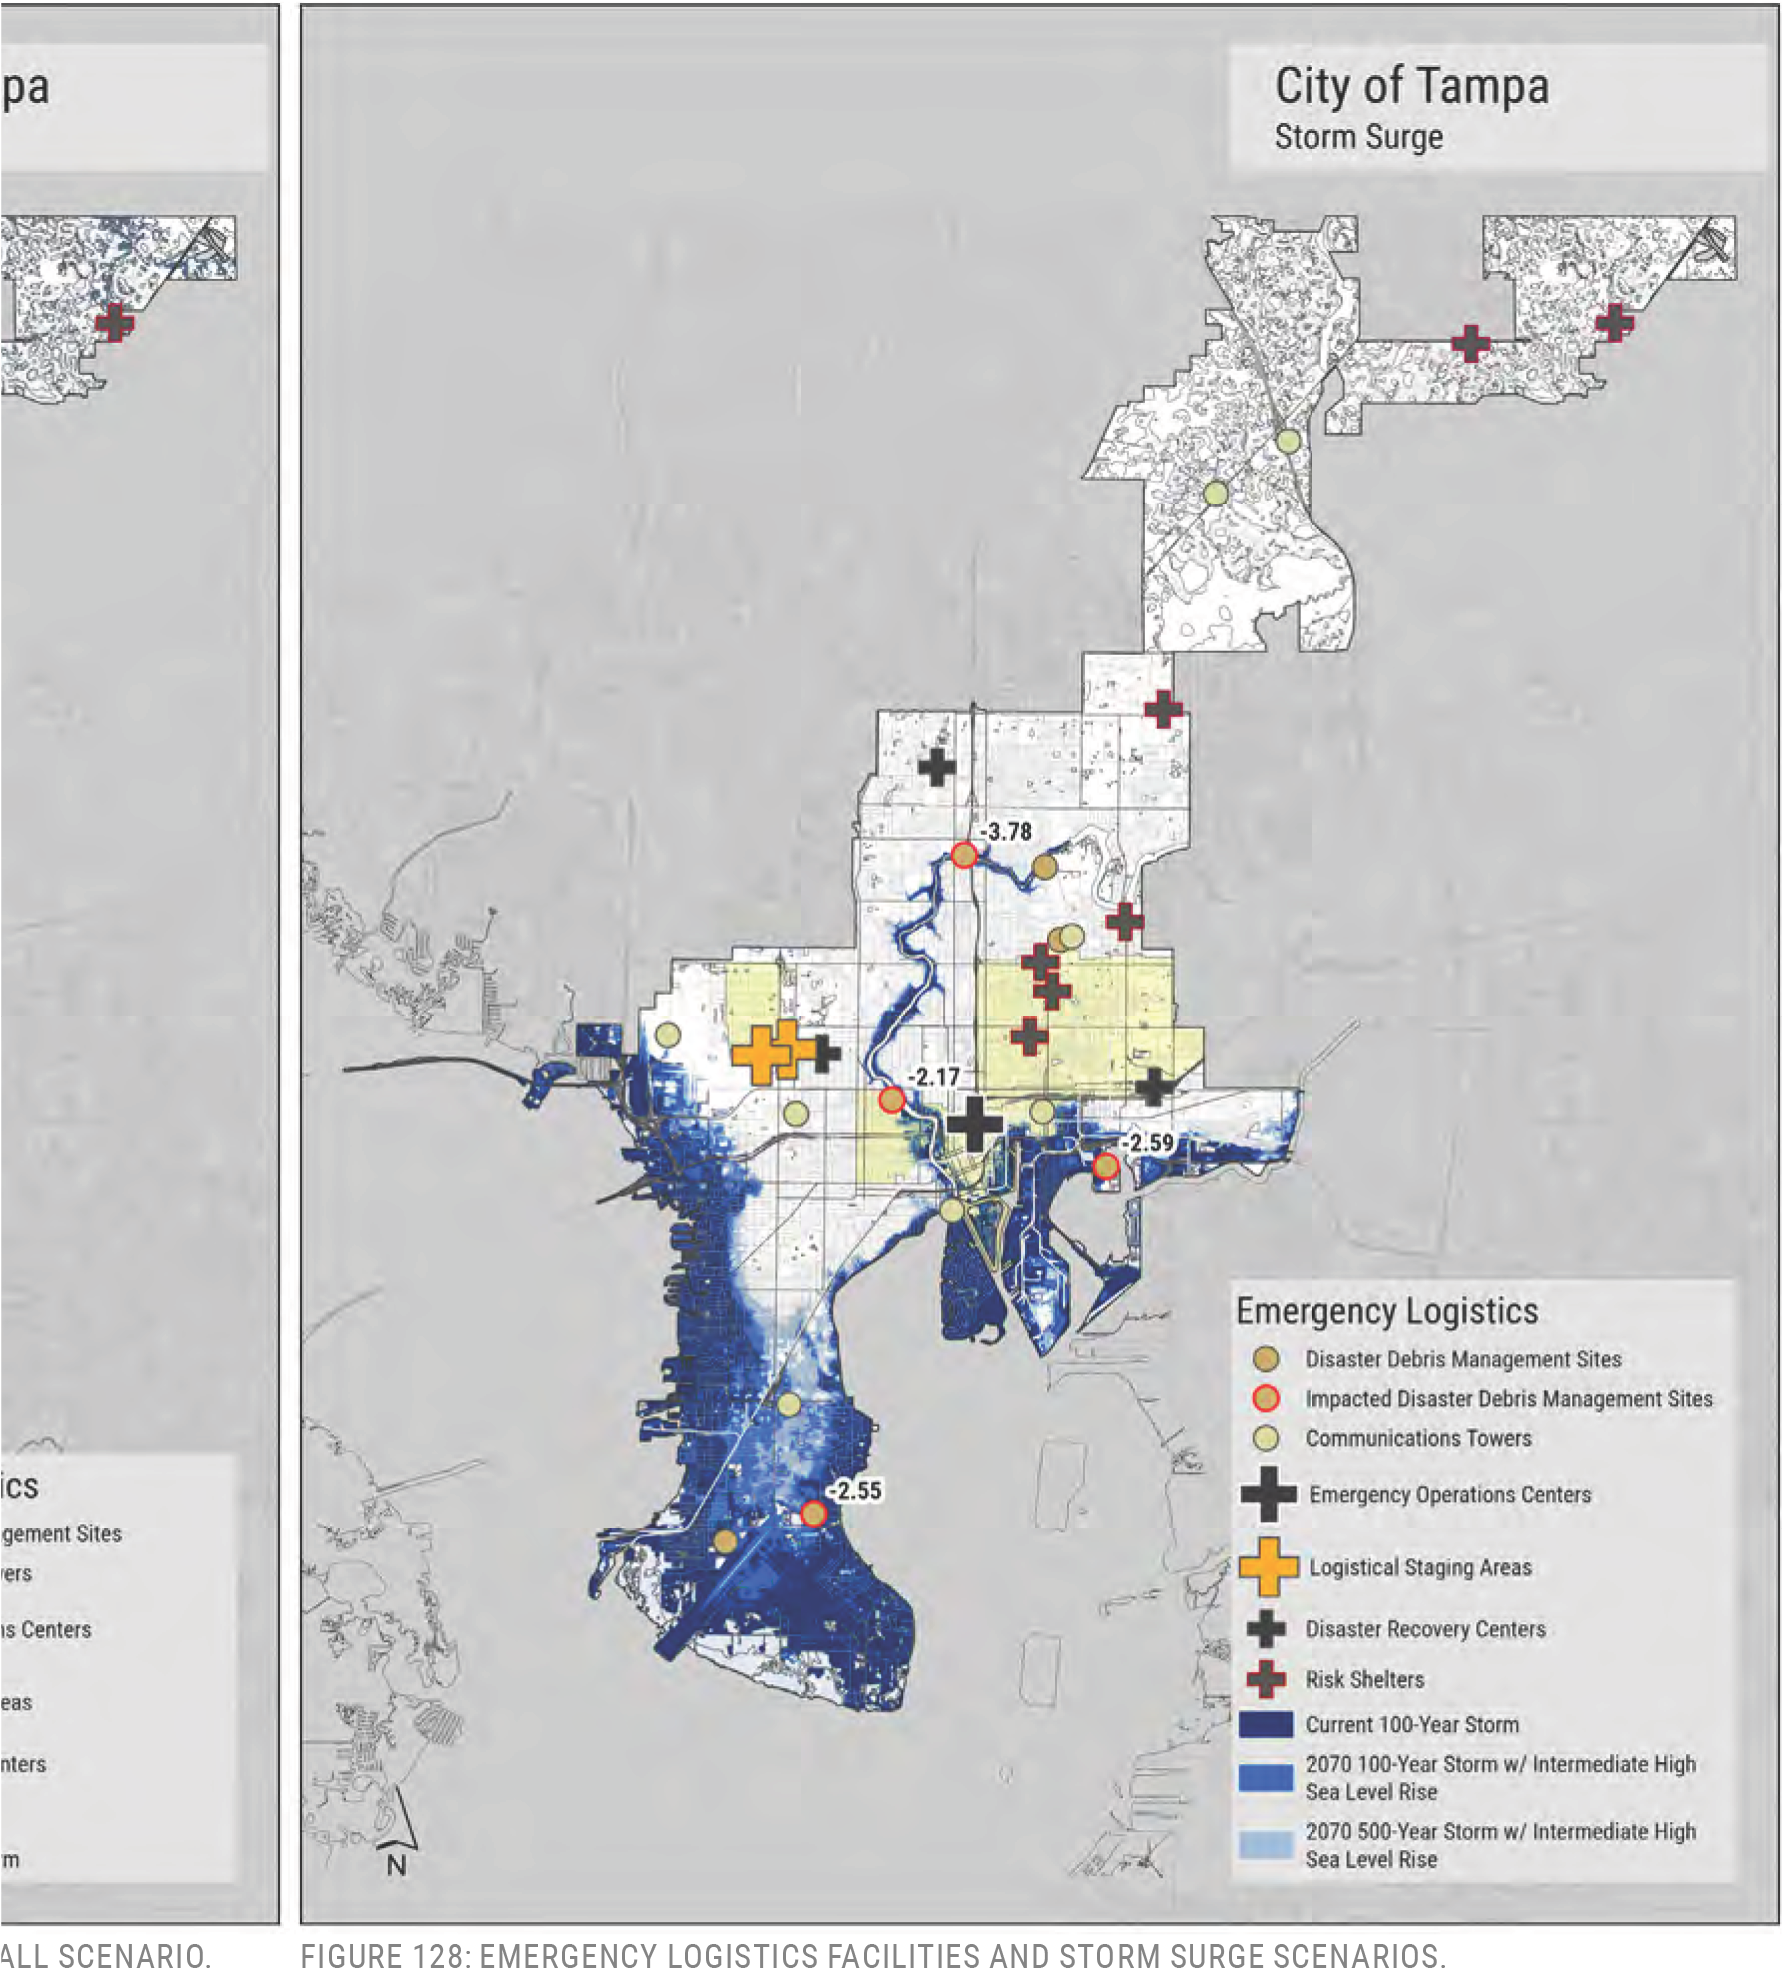
- City of Tampa Storm Surge
- Emergency Logistics
- Disaster Debris Management Sites
- Impacted Disaster Debris Management Sites
- Communications Towers
- Emergency Operations Centers
- Logistical Staging Areas
- Disaster Recovery Centers
- Risk Shelters
- Current 100-Year Storm
- 2070 500-Year Storm w/ Intermediate High Sea Level Rise
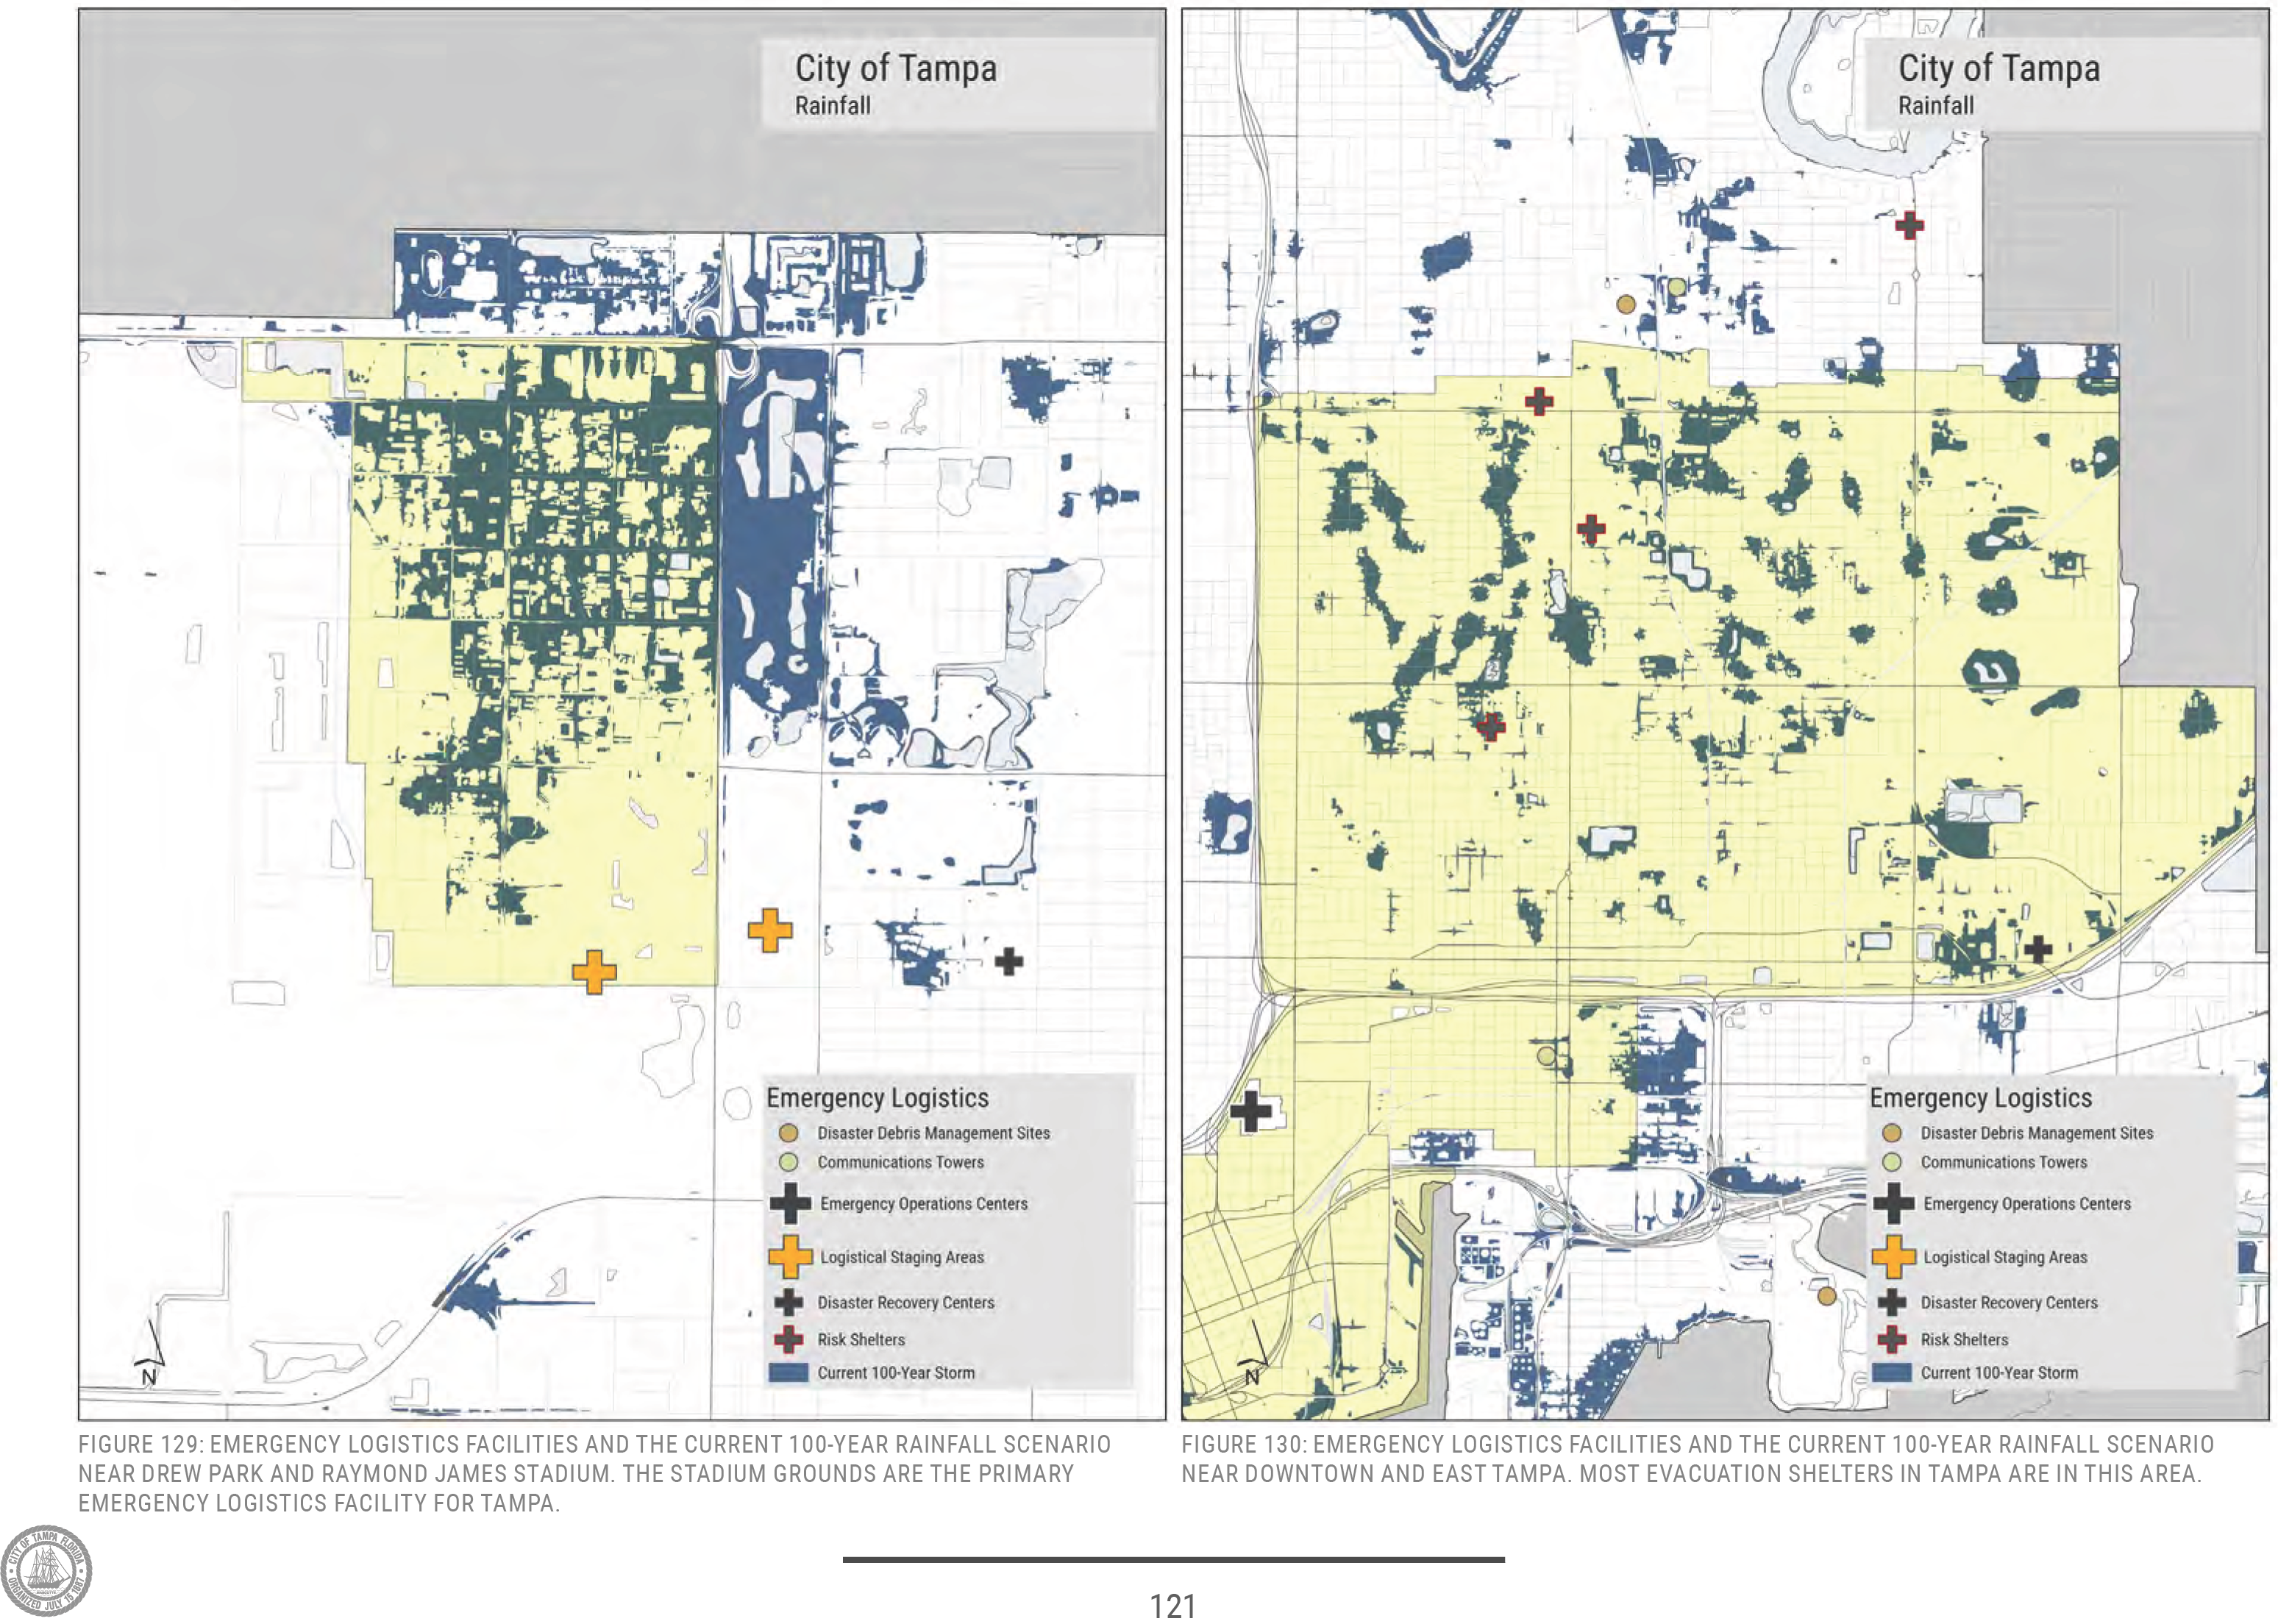
FIGURE 130: EMERGENCY LOGISTICS FACILITIES AND THE CURRENT 100-YEAR RAINFALL SCENARIO NEAR DOWNTOWN AND EASTTAMPA. MOST EVACUATION SHELTERS IN TAMPA ARE IN THIS AREA.
EDUCATIONAL FACILITIES
Elementary schools house students during the day, allowing parents to work. They may also provide meals through the school food program. They also serve as shelters during emergencies. Their multipurpose roles make them critical to students under typical conditions and a lifeline to the public in need of shelter from a storm. The age, location, and history of school buildings may factor into the individual sensitivity of each facility.
Monroe Middle School in South of Gandy area is slated to be repurposed in the 2024-2025 school year. Tinker K-8 is located on the MacDill Air Force Base.
FINDINGS
There are no public primary schools directly on the coastline. There are a few, though, that are within reach of a major storm surge event.
Sea Level Rise
None are impacted by sea level rise.
Rainfall
One may be affected by a major rainfall event:
- Witter Elementary near the University Area
Storm Surge
The following may be impacted by a 100-year event (those with an asterisk are not impacted by the current 100-year storm surge scenario):
- DeSoto Elementary
- *Coleman Middle
- Lanier Elementary
- Madison Middle
- Monroe Middle
- *Robinson High School
- Tinker K-8
- West Shore Elementary
- Hillsborough Community College Administration Center on Davis Islands
Collectively, these schools served nearly 4,000 students during the 2023-2024 school year. While none of these schools currently serve as shelters, flood damage would impact when they could return to normal operations.
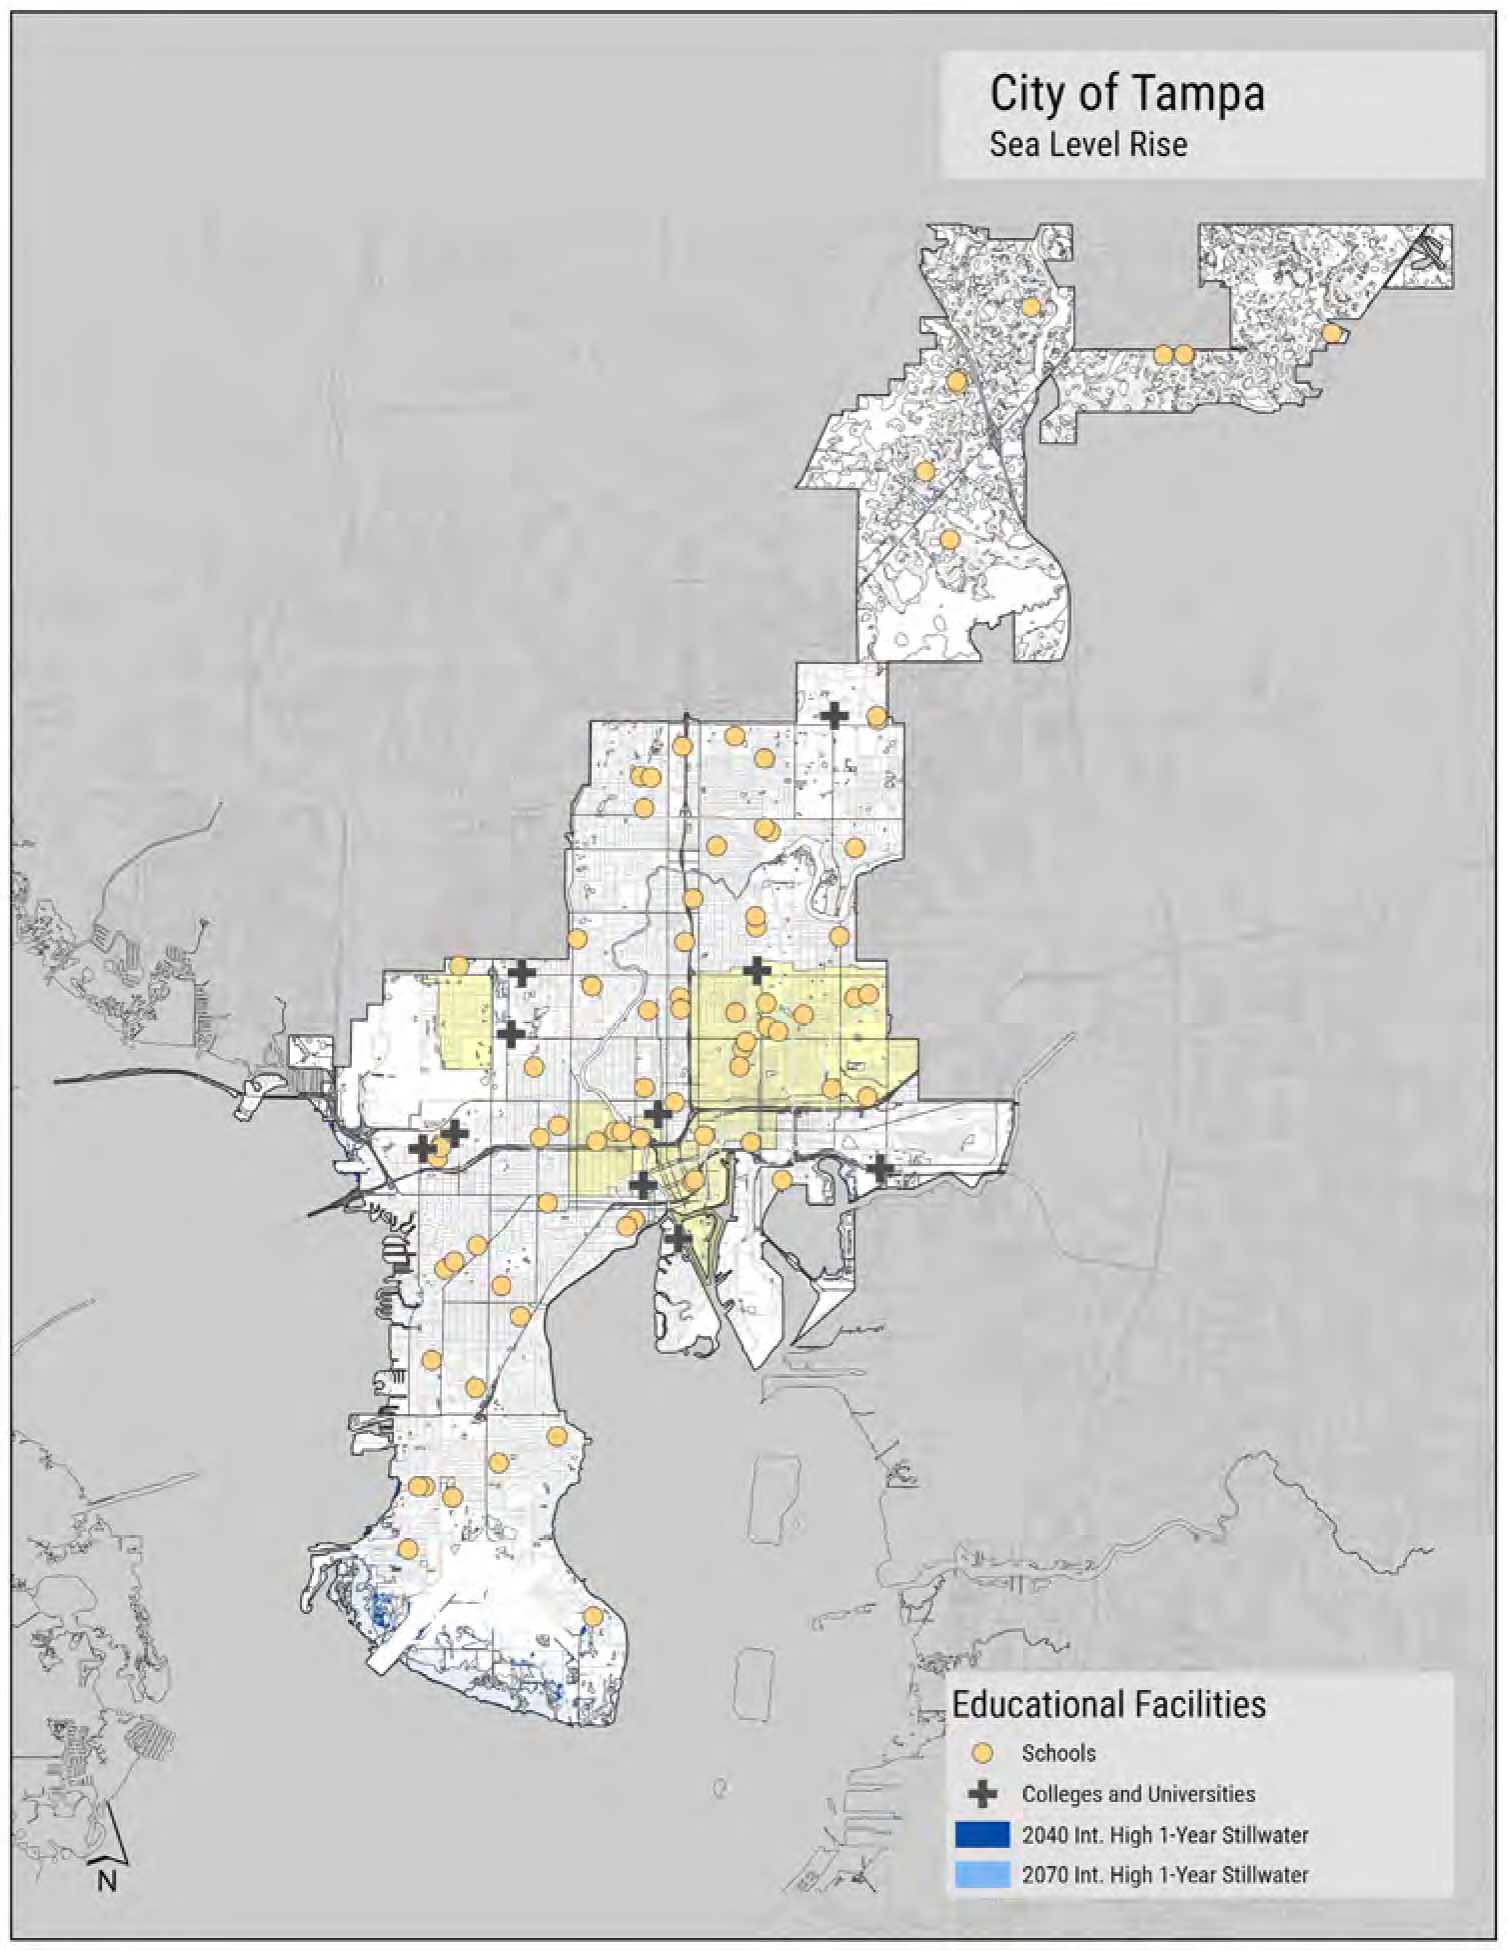
Impacted Schools and Colleges are labeled by name. City of Tampa Rainfall Educational Facilities schools • Impacted Schools Colleges and Universities ■ Current 100-Year Storm
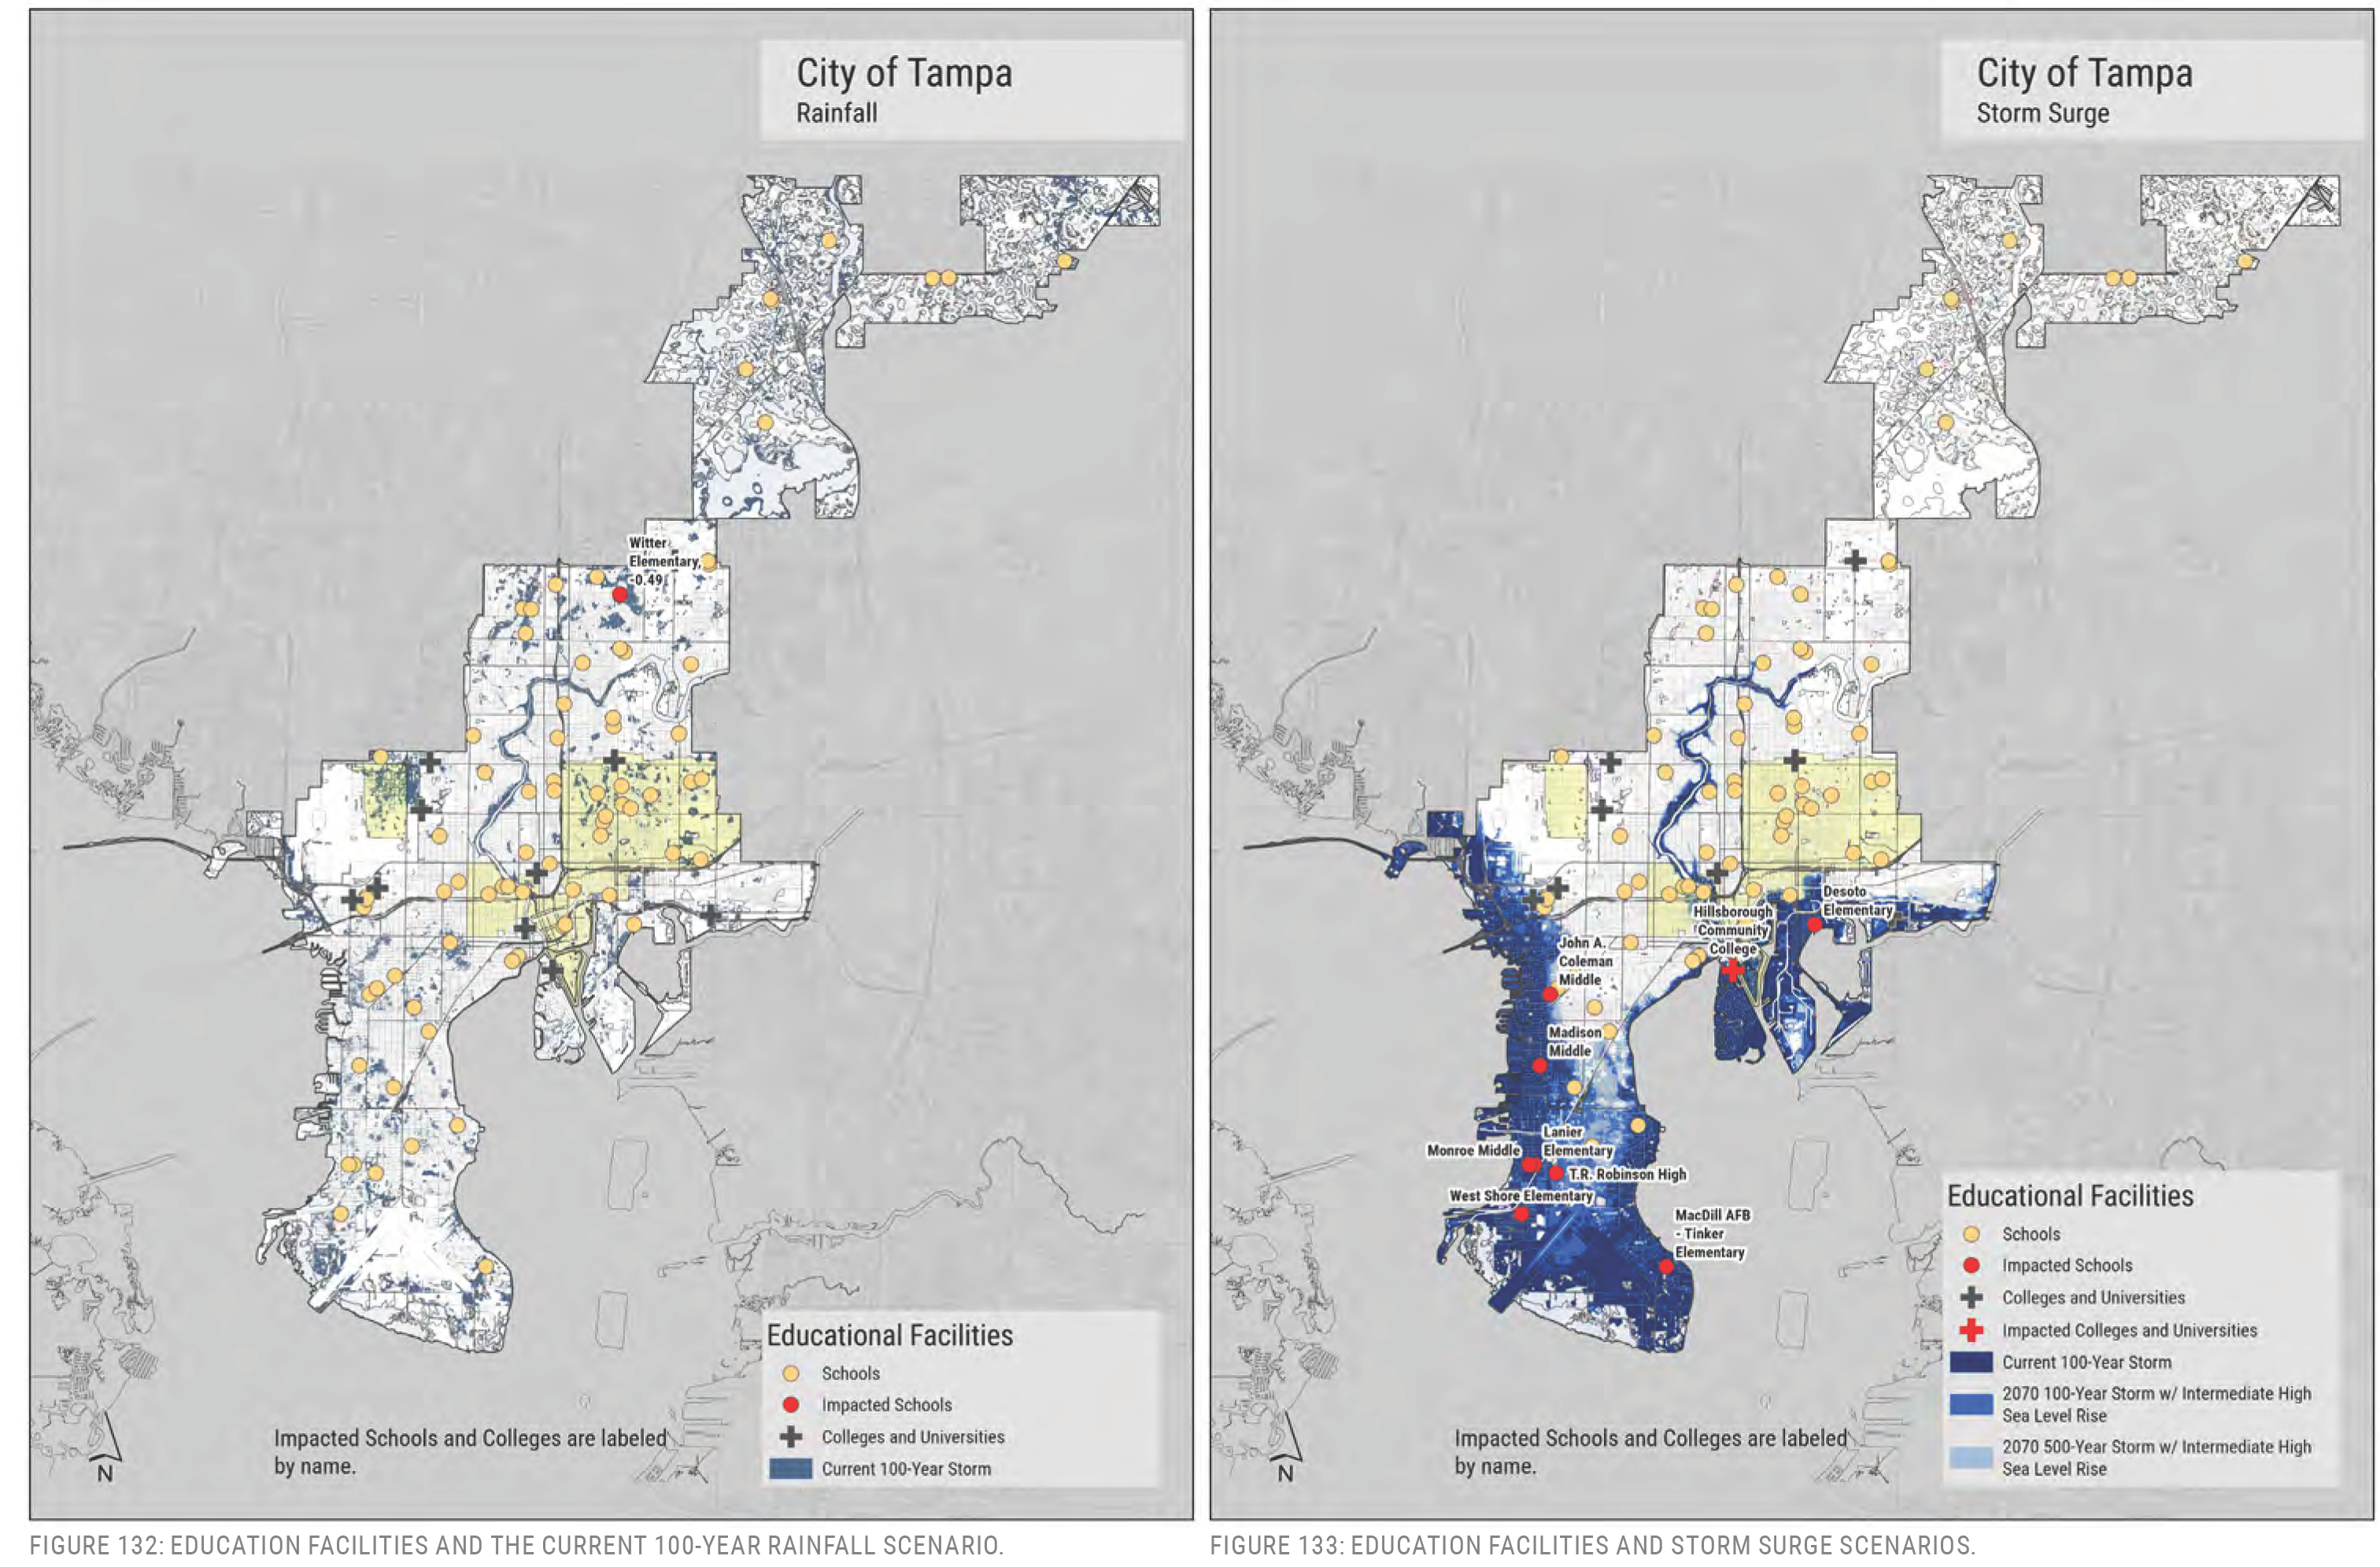
FIGURE 132: EDUCATION FACILITIES AND THE CURRENT 100-YEAR RAINFALL SCENARIO.
City of Tampa Storm Surge Educational Facilities schools -• Impacted Schools Impacted Schools and Colleges are labeled by name. Colleges and Universities Impacted Colleges and Universities current 100-Year Storm 2070 500-Year Storm w/ Intermediate High Sea Level Rise
FIGURE 133: EDUCATION FACILITIES AND STORM SURGE SCENARIOS.
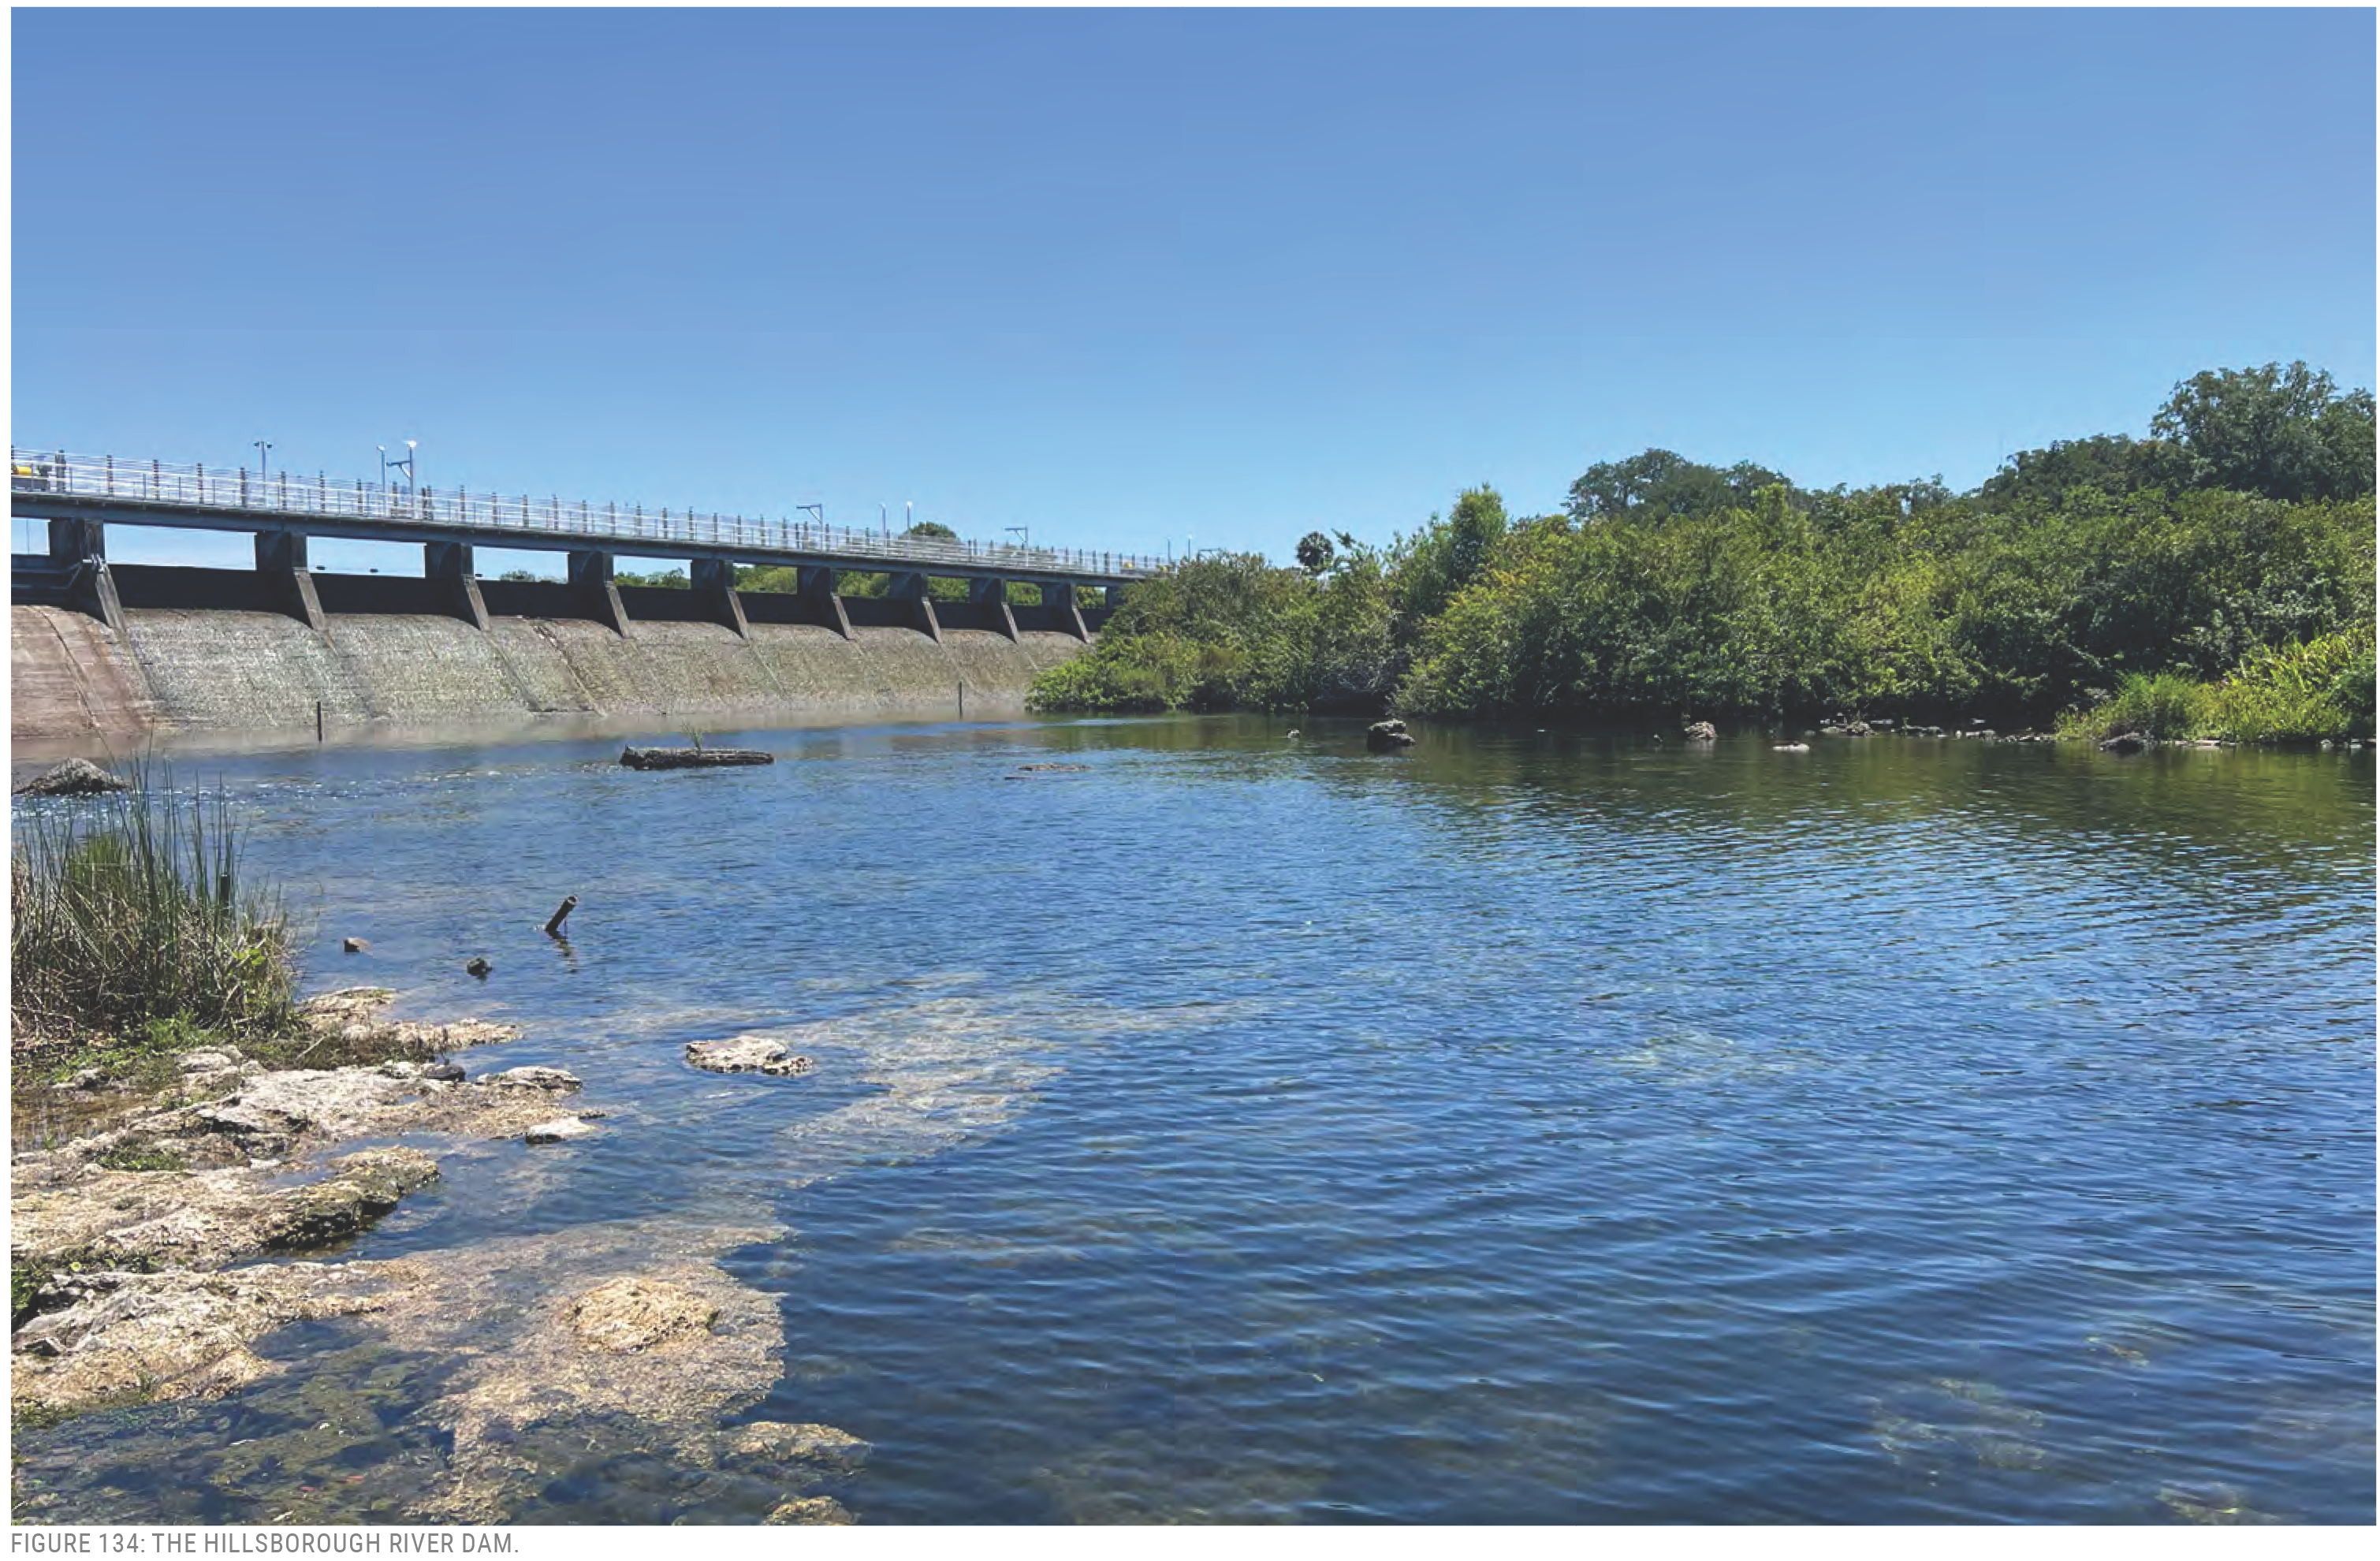
WATER
The City of Tampa is unique in that it supplies its own potable water. Tampa’s Water Department is responsible for delivering approximately 82 million gallons each day. The main source is the Hillsborough River. The system relies on a central processing plant, the David L. Tippin Water Treatment Facility, located adjacent to the Hillsborough River Dam. There, it is screened for large debris removal; flocculated to remove sediments and solids; stabilized for taste, odor, color, and pH; disinfected with ozone; biofiltered through activated carbon; disinfected again with chlorine; and then stored in either water towers or clearwells. Water is distributed through more than 2,200 miles of water mains. Points of connection are metered, and lateral pipes bring water to the user.
Below-ground pipes are minimally sensitive to flooding. Above-ground elements, such as the water treatment plant and pumps, could potentially be impacted due to structural failure or problems in the electrical system. These facilities were evaluated in relation to the flood scenarios, but their point of vulnerability would need to be more closely surveyed and compared to flood elevations. Clearwell and elevated storage tanks (water towers) are also minimally impacted from flooding and so were not evaluated against flood scenarios.
The dam is another important structure within the water delivery system. It not only helps to capture the water from the Hillsborough River but protects downstream communities from flooding. This facility has been and should continue to be evaluated for vulnerabilities. It may be the single-most important utility structure in the City of Tampa.
Near the dam, water is released to support a minimum quantity of flow in the Hillsborough River. This water is drawn from the spring at the Sulphur Springs Pump Station, where it is extracted and pumped to the dam. The sensitivity of this facility is unknown.
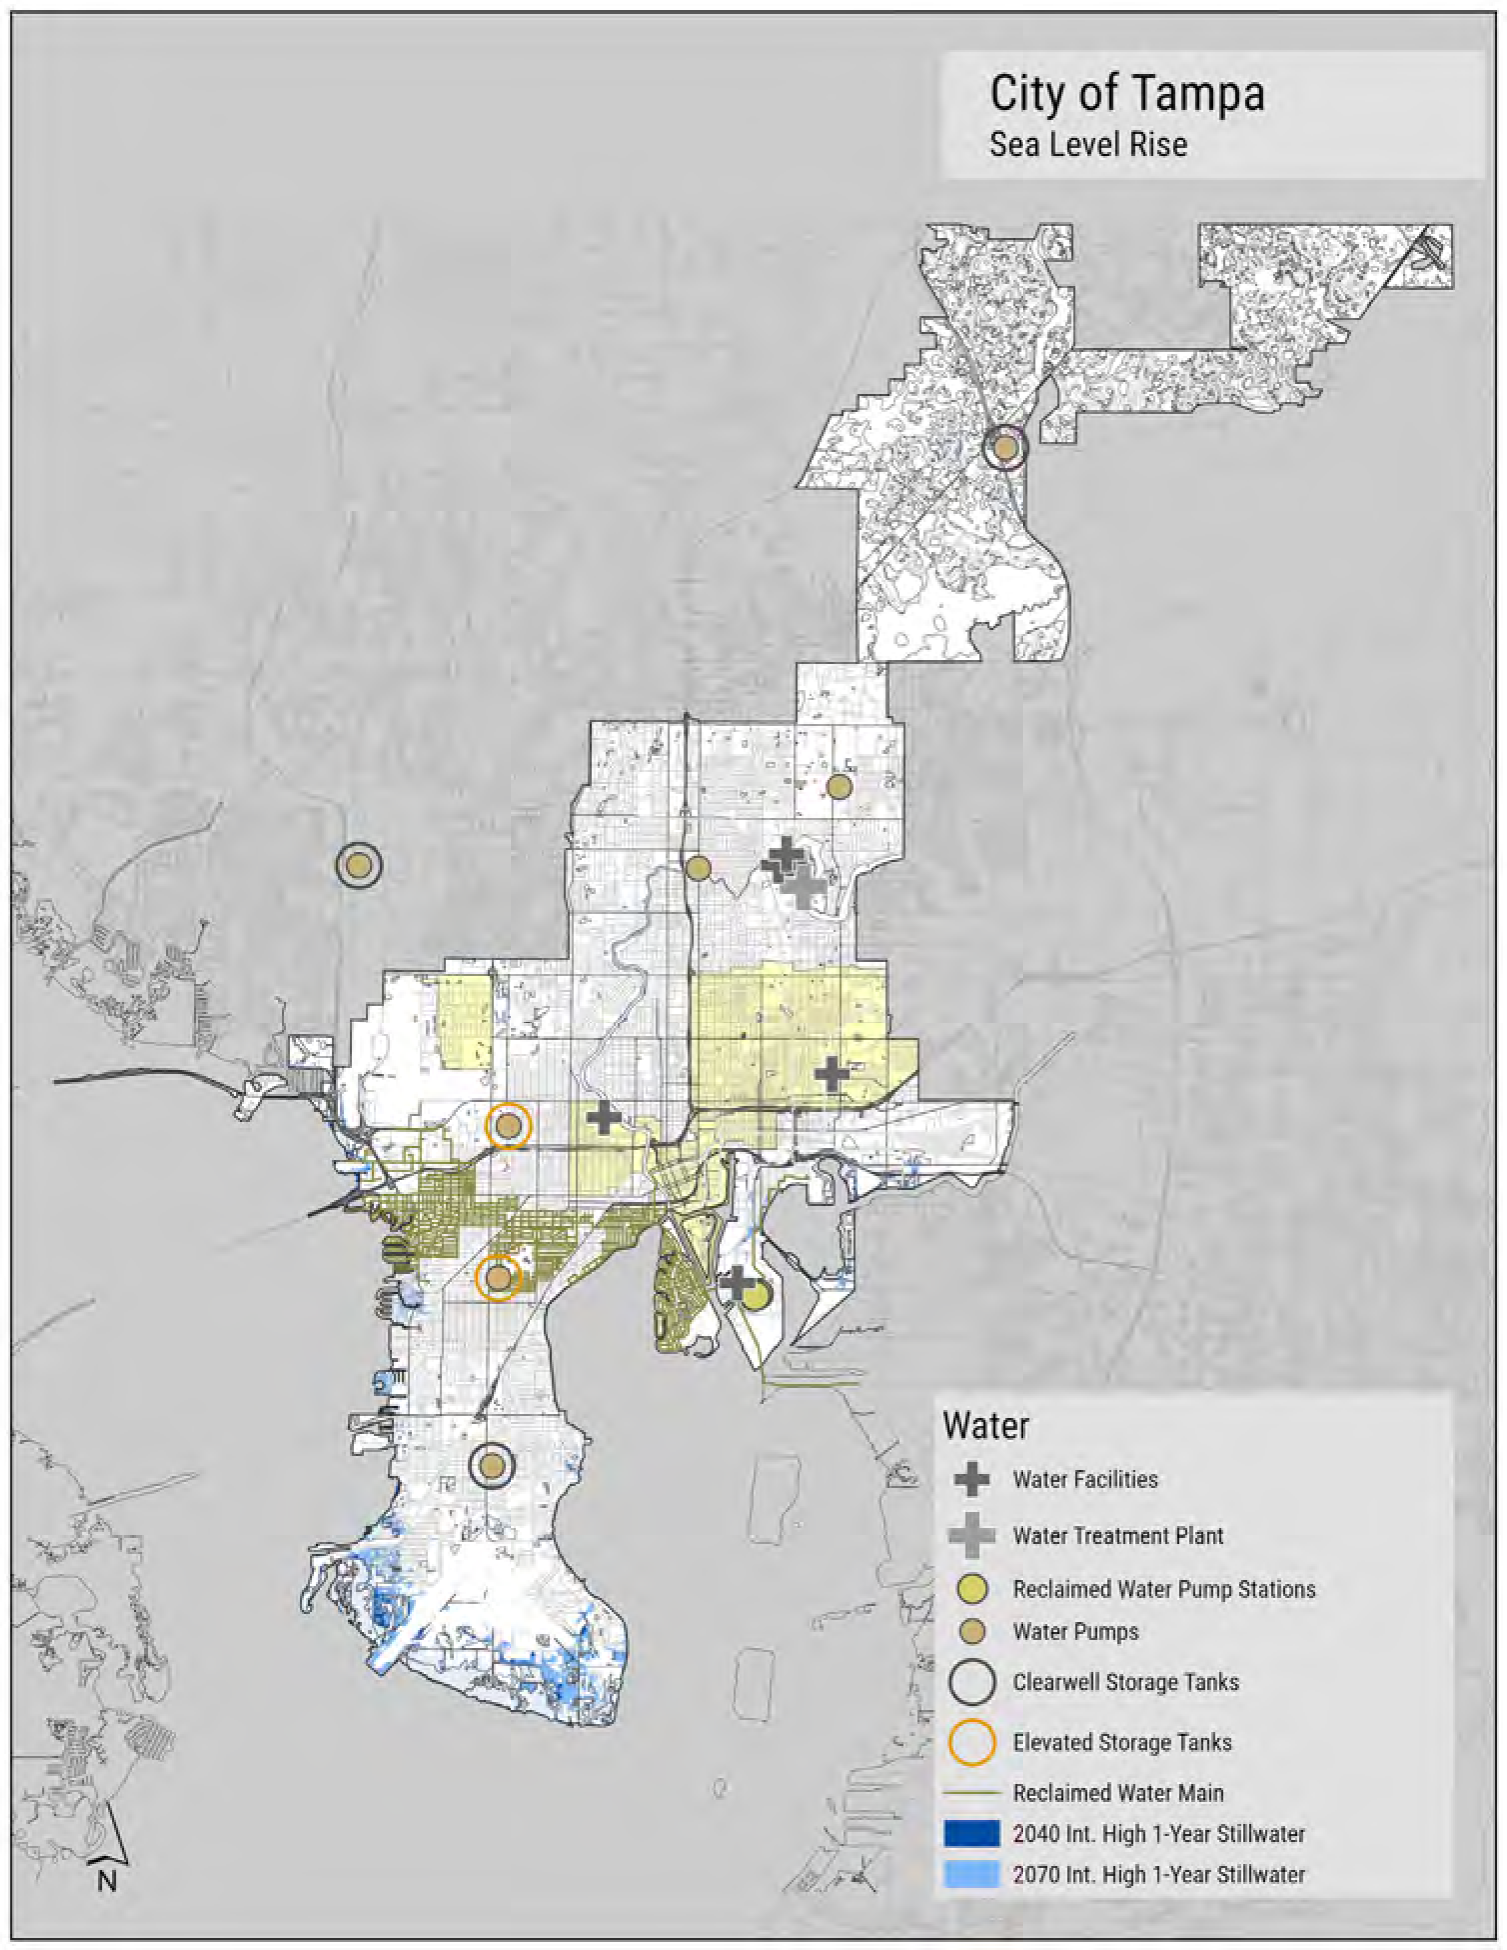
FIGURE 135: CITY OF TAMPA WATER FACILITIES AND FUTURE SEA LEVEL RISE SCENARIOS.
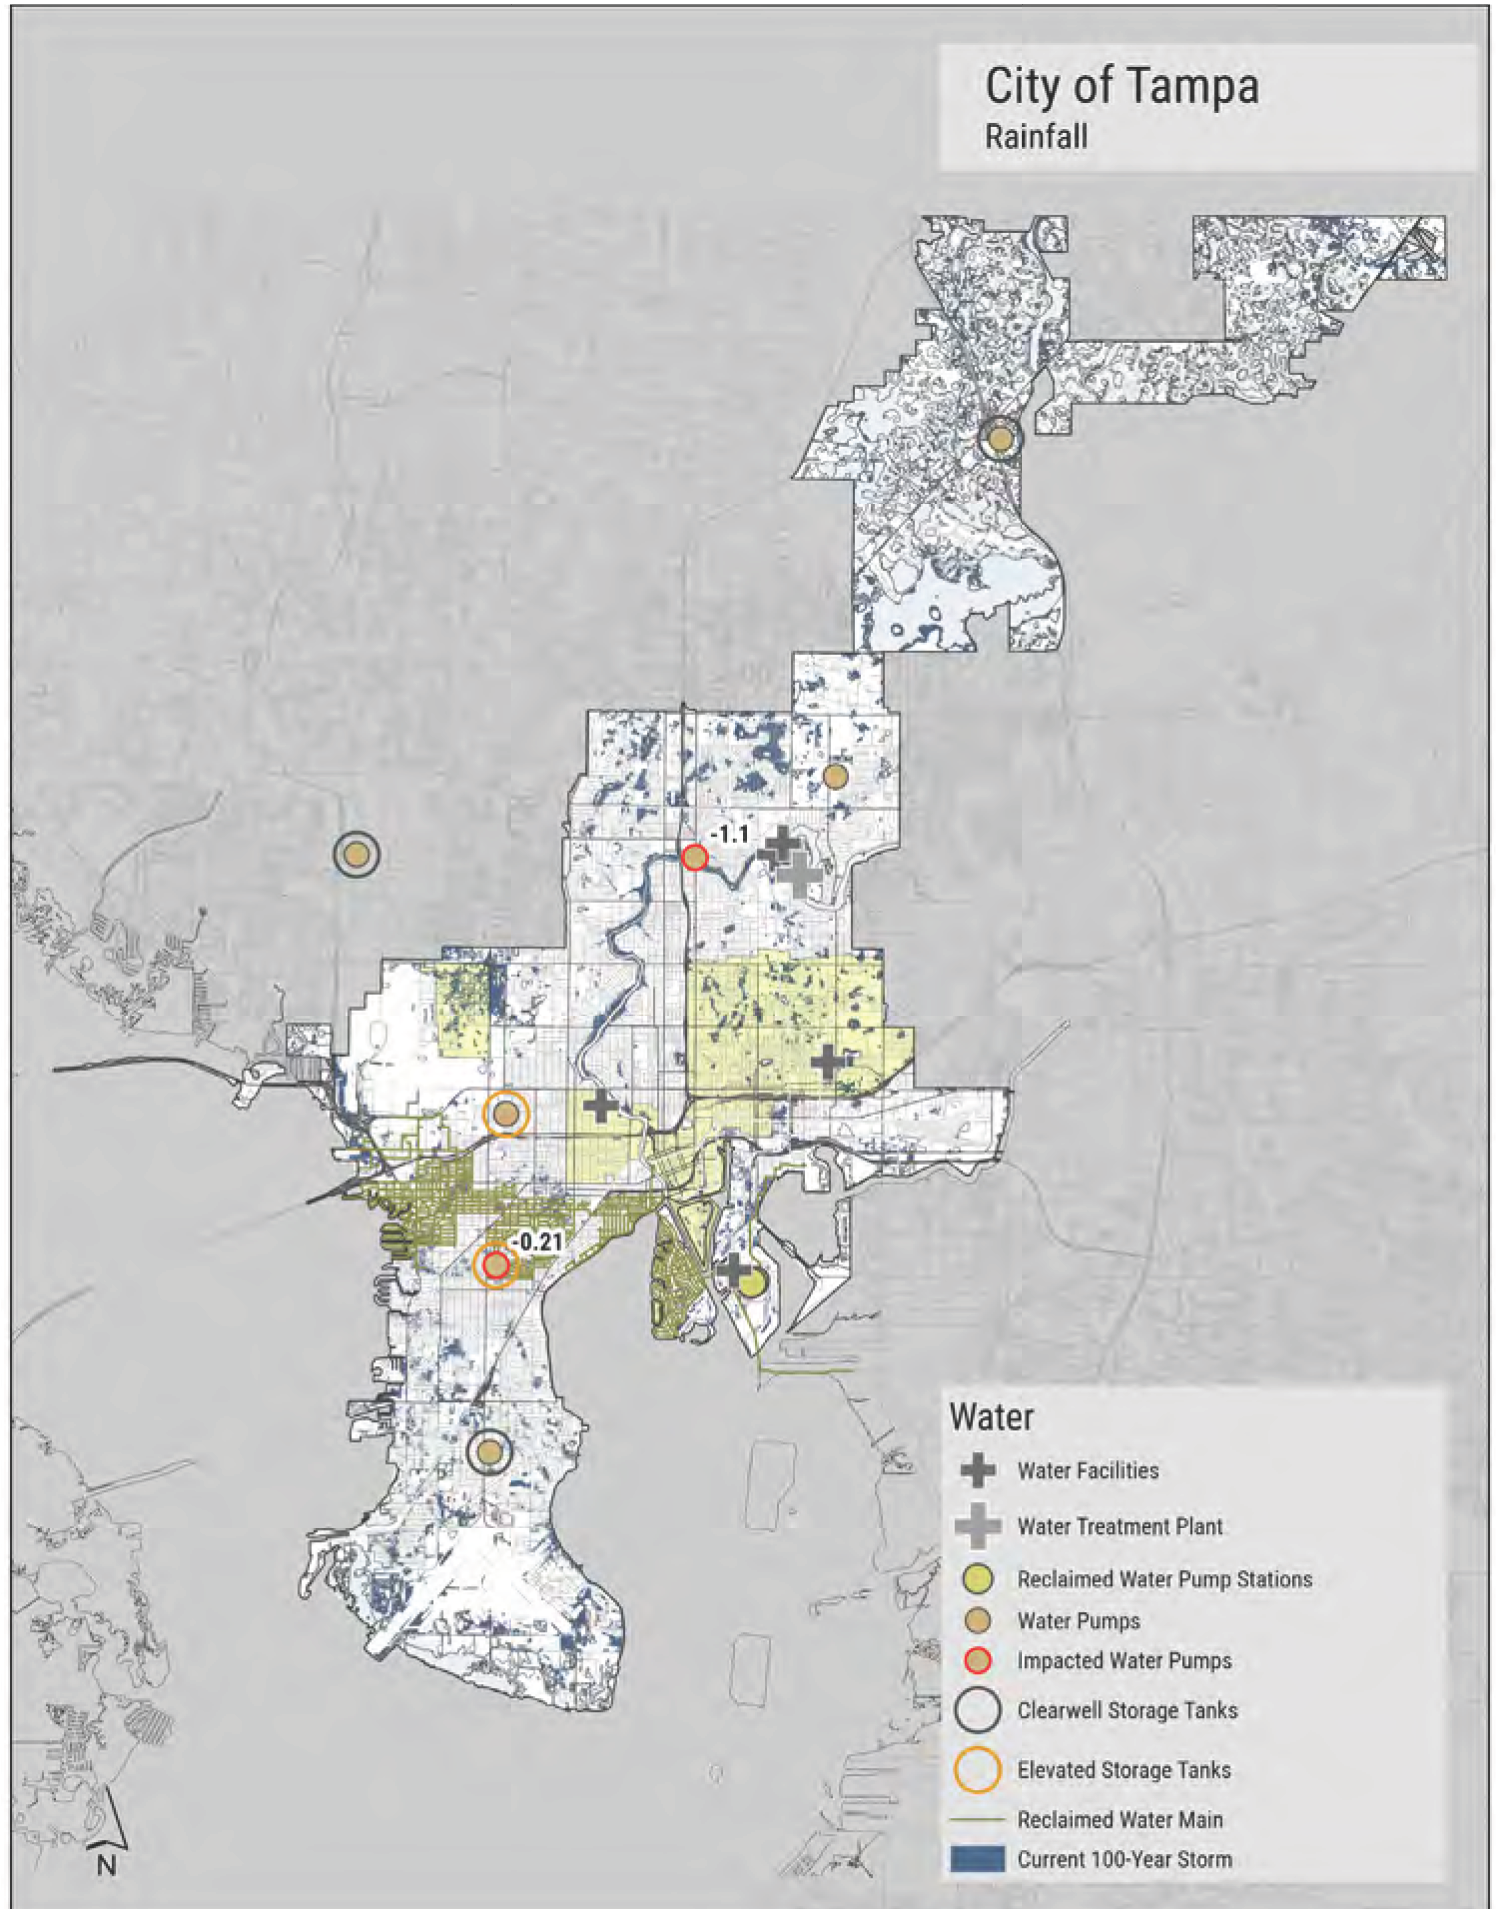
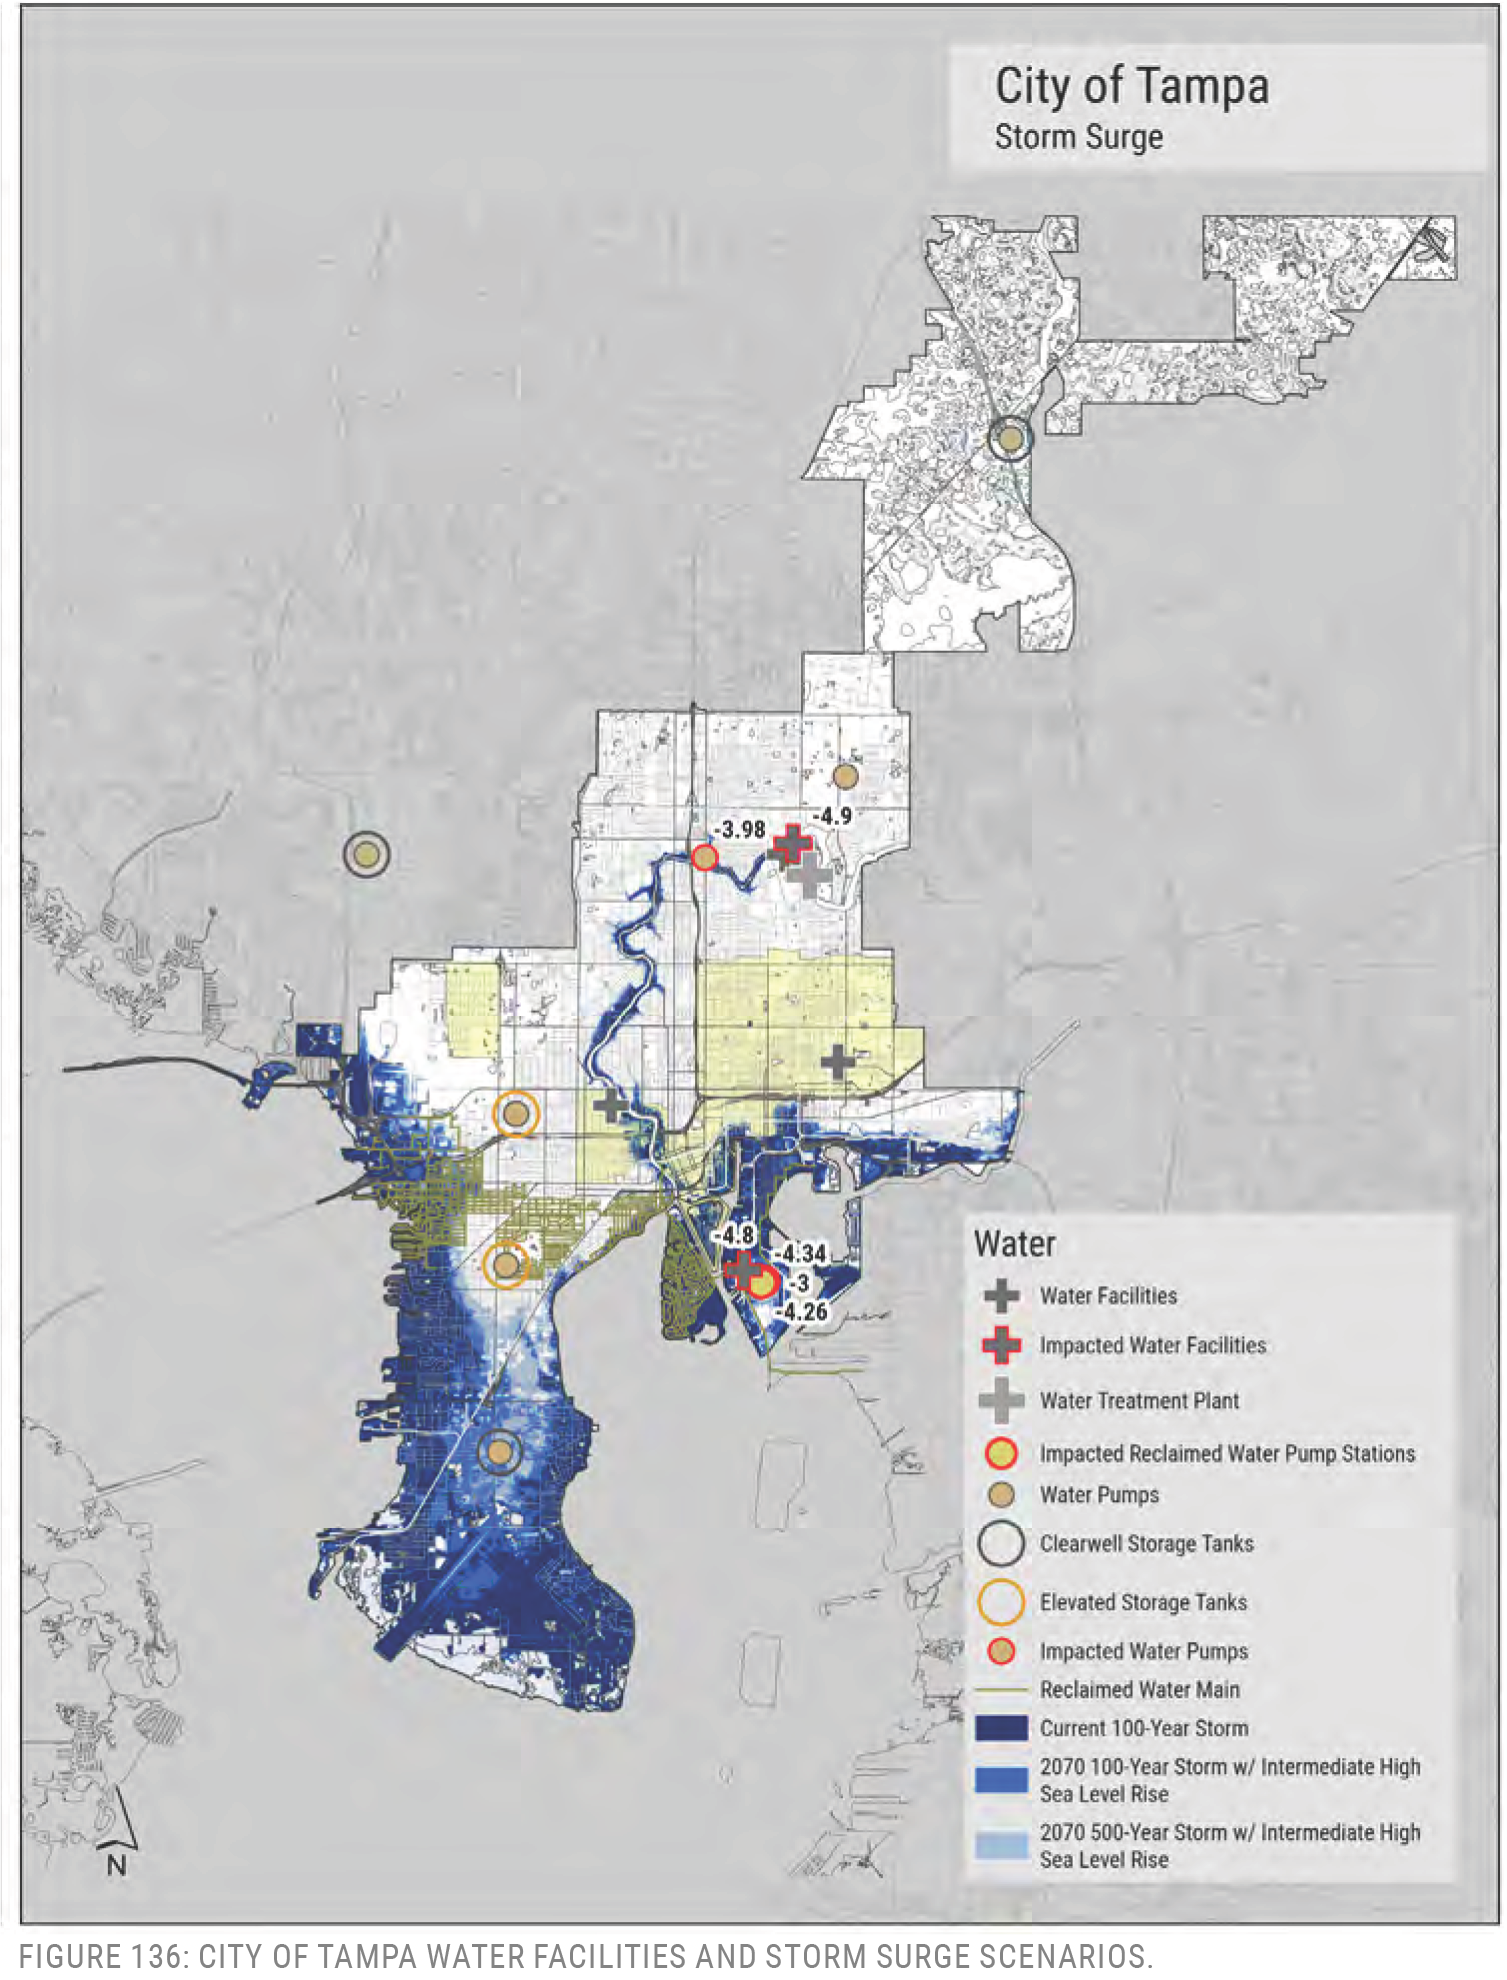
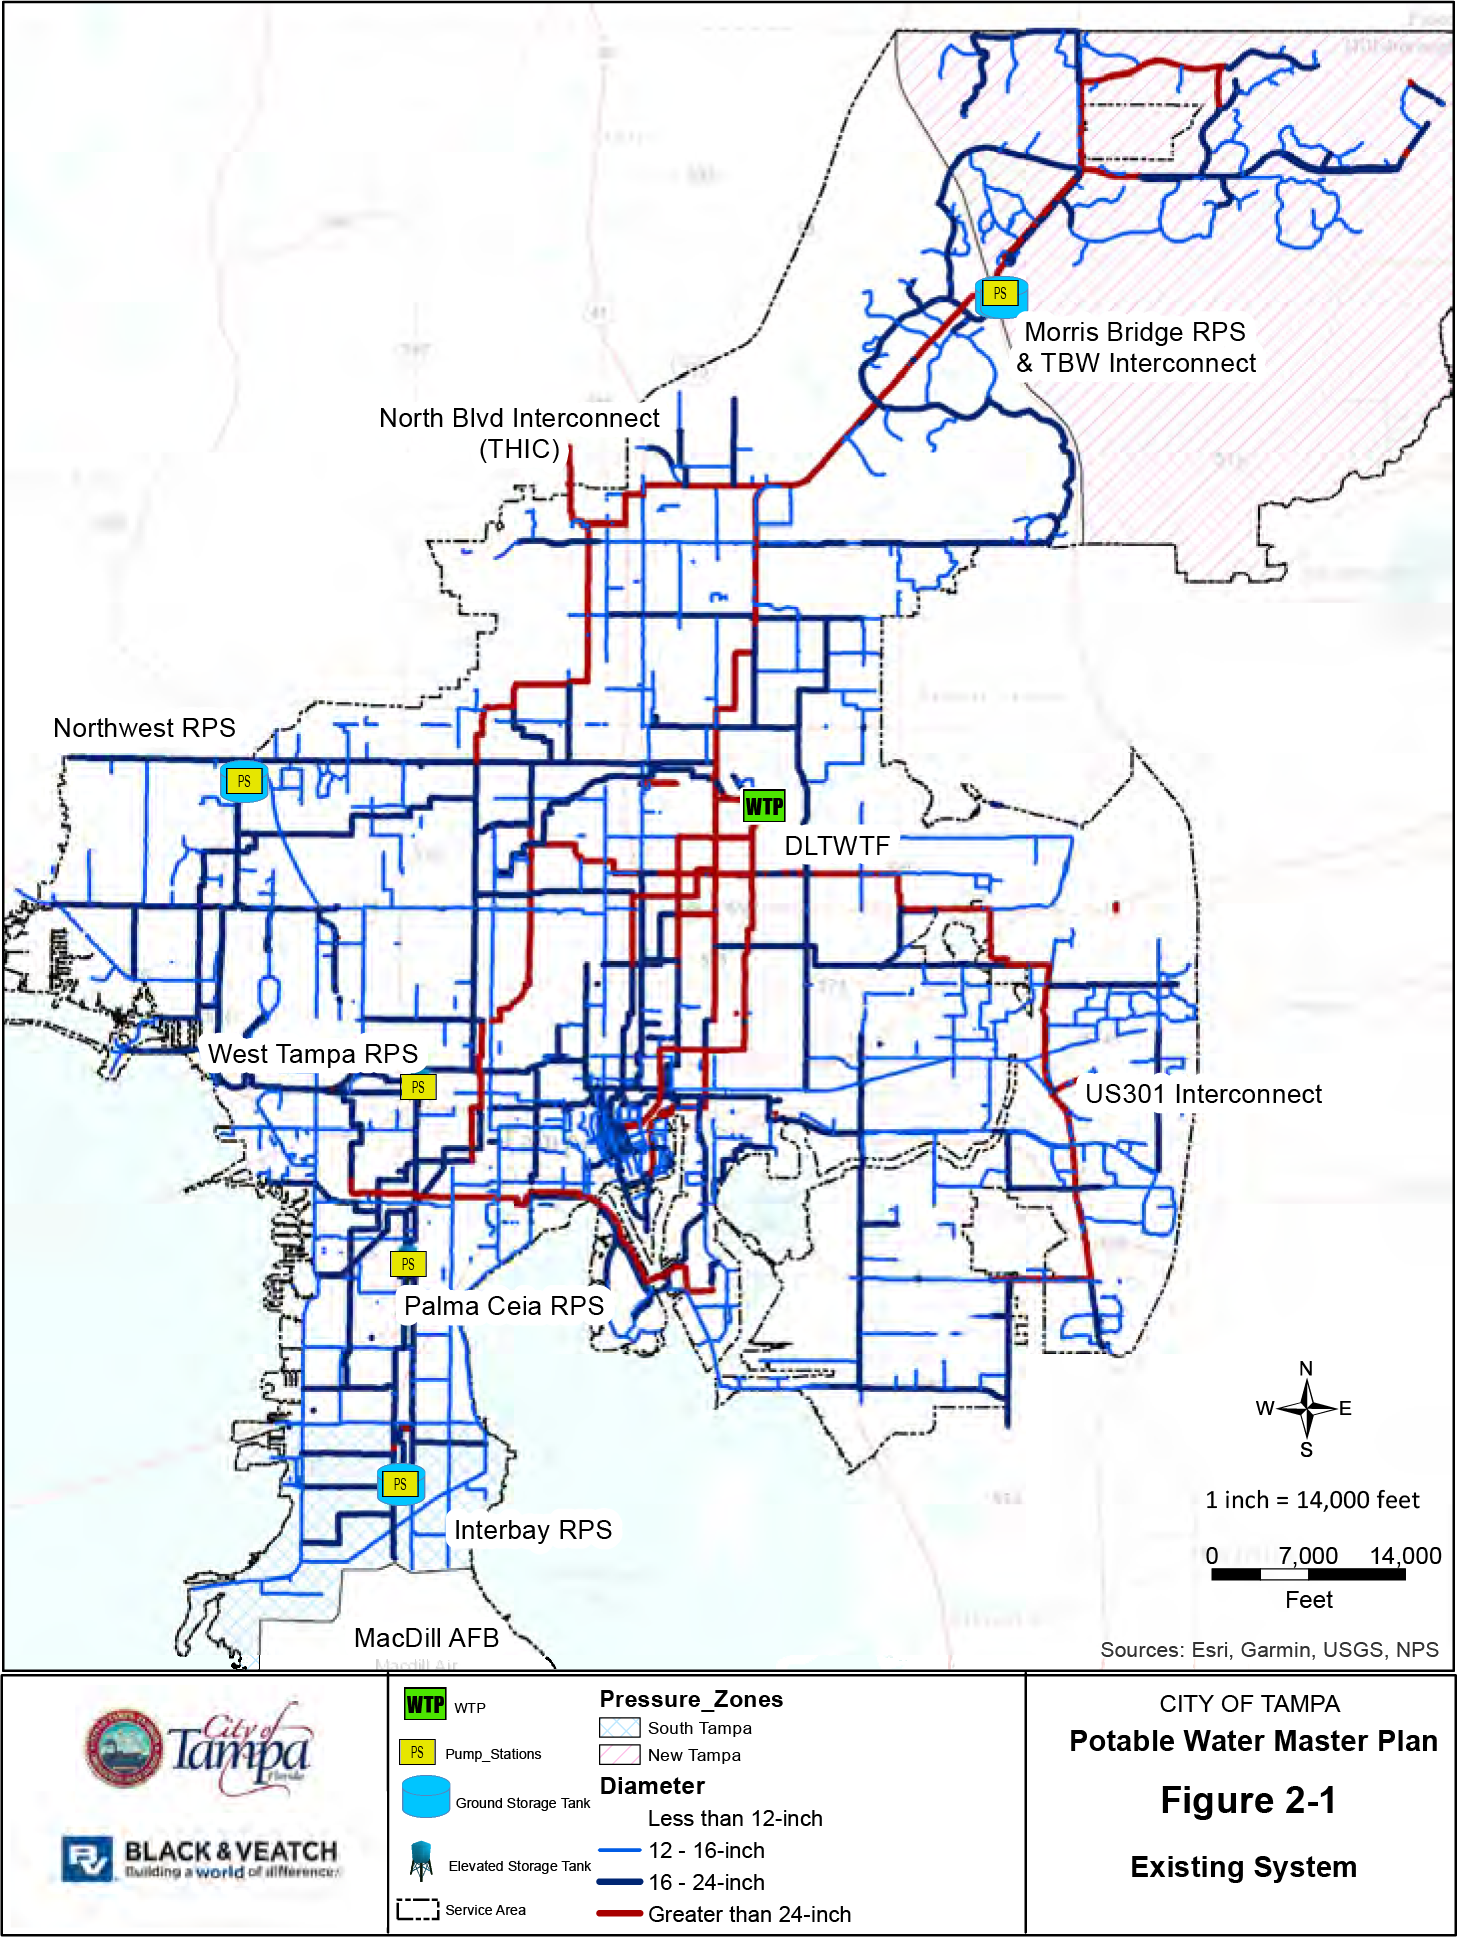
FINDINGS
The only relevant exposure during the flood scenarios provided by this study occurs at the Sulphur Springs Pump House. The floodplains associated with the 100-year rainfall and storm surge events intersect with this facility.
A few system components for reclaimed water, including the main pumps, are at the Howard F. Curren Wastewater Treatment Plant. That site experiences isolated flooding. Pumps in that location should be reviewed in closer detail. There is also minimal flooding during the 100-year rainfall event at the Palma Ceia elevated tank. Ground level controls and pumps should be surveyed and evaluated, but impacts are not expected.
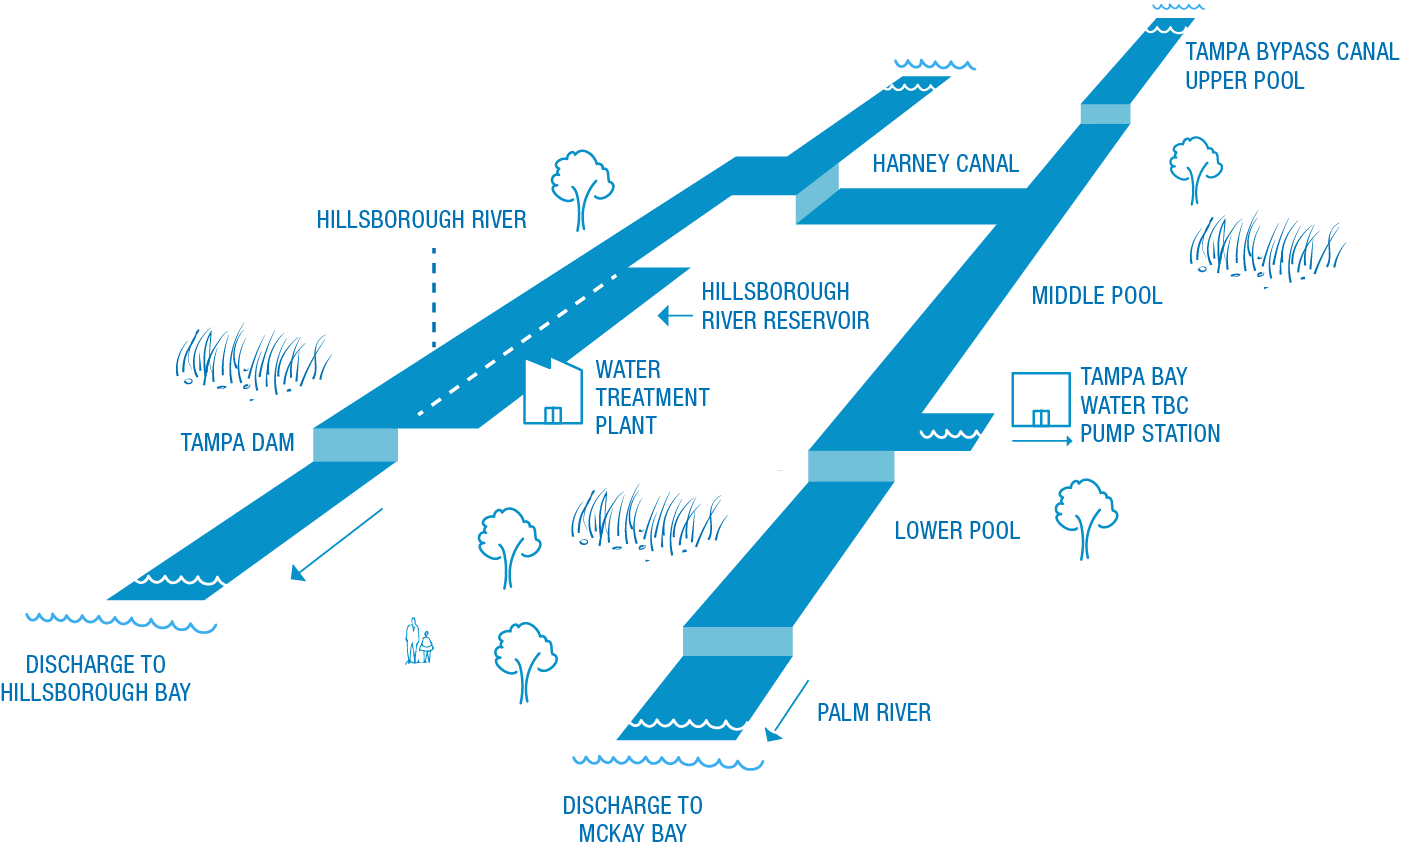
WASTEWATER
More than 50 million gallons of raw sewage are sent to the Howard F. Curren Advanced Wastewater Treatment Plant (AWTP) each day. The collection system includes 1,800 miles of gravity and force main sewer lines, 30,000 manholes, and 229 pump stations. There are more than 1,600 pump stations in total, including public and private facilities. The system also includes lateral pipes to individual properties. Some pumps move more material than others. These are separated for the purposes of the analysis. For example, the West River Interceptor and Service Area is a 60” pipe that goes to the Krause Street Pump Station near the mouth of the Hillsborough River. This system is responsible for one-fourth to one-third of the system’s volume. There is a 54” pressurized main under Bermuda Boulevard. A 48” pipe runs along Bayshore to the Bayshore Pump Station, where it is forced through additional pipes to the AWTP.
Pipes can be vulnerable to groundwater intrusion. Many of the sewer pipes in the City of Tampa are over 50 years old, with re-lining work ongoing. This technical analysis was not included as part of this study but presents a sensitivity within the system. The City of Tampa Climate Action and Equity Plan revealed that the sewer system delivers and processes up to 10% extra clean rainfall water that infiltrates into pipes. This roughly calculates to $800,000 per year (Applied Sciences, 2023). Large pipes can also be vulnerable during a significant storm surge event if located adjacent to the shoreline. Figure 145 shows these locations.
Each pump station is unique, which makes it impossible to define sensitivity for all of them in a standardized way. The most susceptible components of the pumps are their electrical systems. The wastewater treatment plant also includes pumps and controls that are sensitive to flooding. This includes a primary switchgear, which was noted as one of the most vulnerable components in the facility’s vulnerability assessment. Raw materials can also be vulnerable at the treatment plant.
If wastewater components are impacted, for example if a major pump station is non-functional, sewage is not able to be moved through the system. Materials would back up into the collection system. This can also occur when storage or processing capacities are exceeded. Rather than allow them to back up, tanks are sometimes discharged into open water bodies. The continued operation of the AWTP is considered extremely important with high consequences if failure occurs.
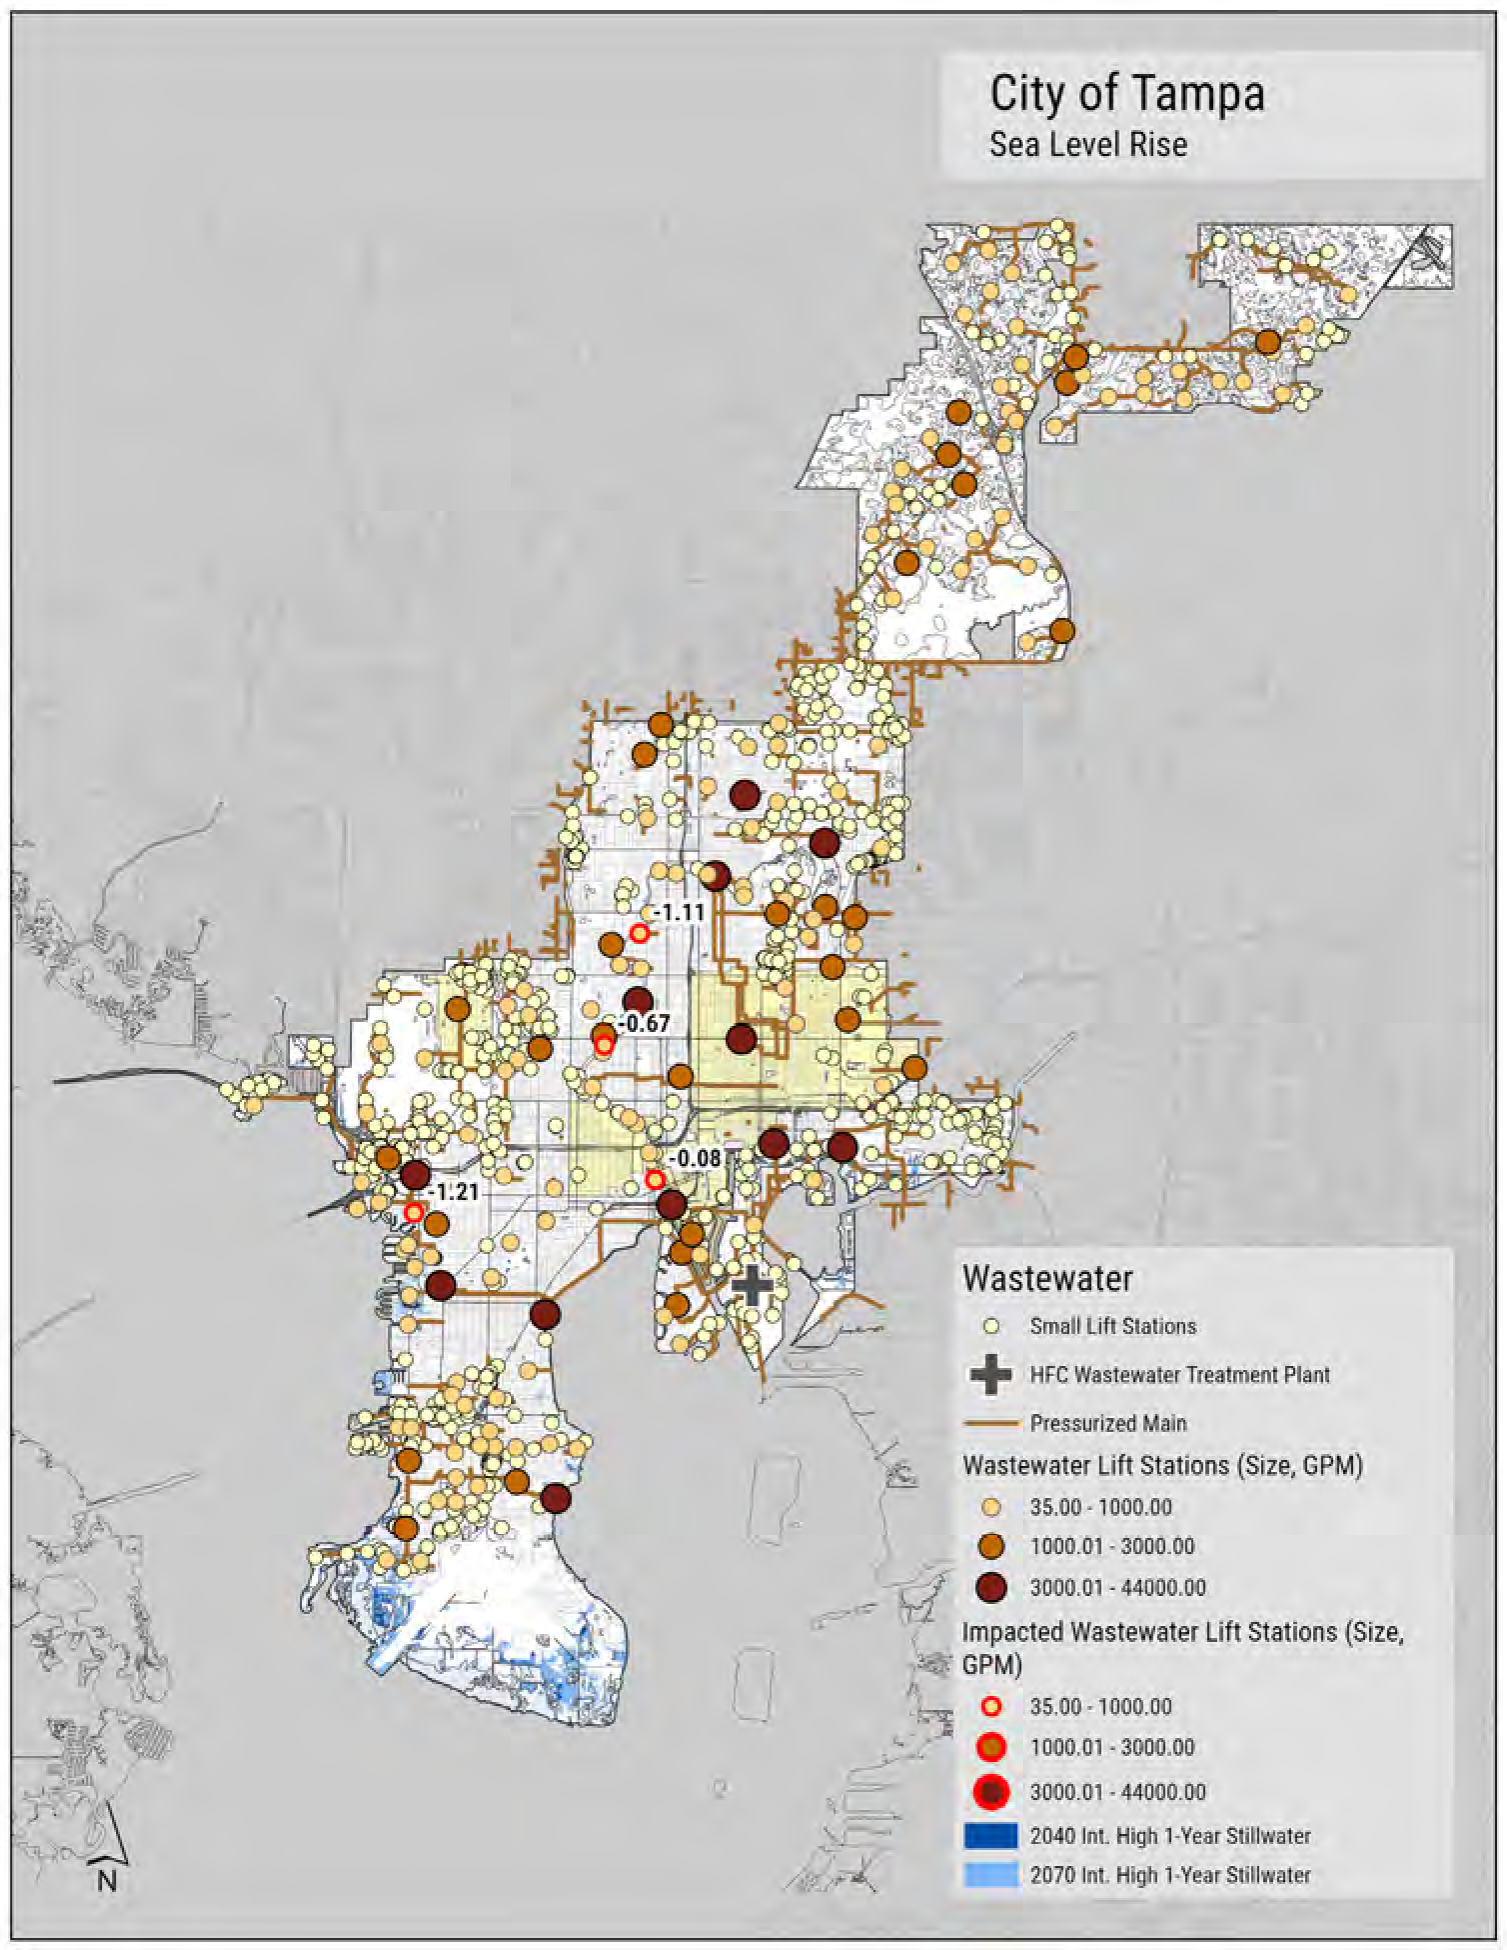
FINDINGS
Sea Level Rise
No major pump stations (above 1000 gallons per minute - gpm) are impacted by sea level rise scenarios. There are three smaller pump stations that could be impacted by 2070, with the intermediate high projection:
- Neptune Way (3.55 feet NAVD88, 320 gpm)
- Epps Park (3.65 feet NAVD88, 300 gpm)
- Virgina (4.09 feet NAVD88, 100 gpm)
Two of the lowest significant pump stations are:
- The Bayshore Pump Station – This facility pumps 5,800 gpm and is located with a ground surface elevation of 4.78 feet NAVD88.
- The Hanna Avenue Pump Station – This mid-tier facility pumps 3,000 gallons per minute is located with a ground surface elevation of 4.97 feet NAVD88.
Seven others, classified as ‘Minor Pump Stations,’ could also be within sea level rise floodplains.
Rainfall
Rainfall flooding is distributed across the City of Tampa. Areas where pump stations are exposed to this water includes (only pump stations pumping more than 1,000 gpm included – sorted from deepest level of flooding to shallowest):
- Hanna
- Rome
- 27th Street
- 18th Street
- Louisiana
- Fowler
- Krause
- Bayshore
- Buffalo
- 109th Avenue
- 55th Street
- Trilby
- East Tampa
- 42nd Street
There is localized rainfall flooding at the Howard F. Curren AWTP. Please see the vulnerability assessment conducted for that individual facility for more detail (Applied Sciences, 2022).
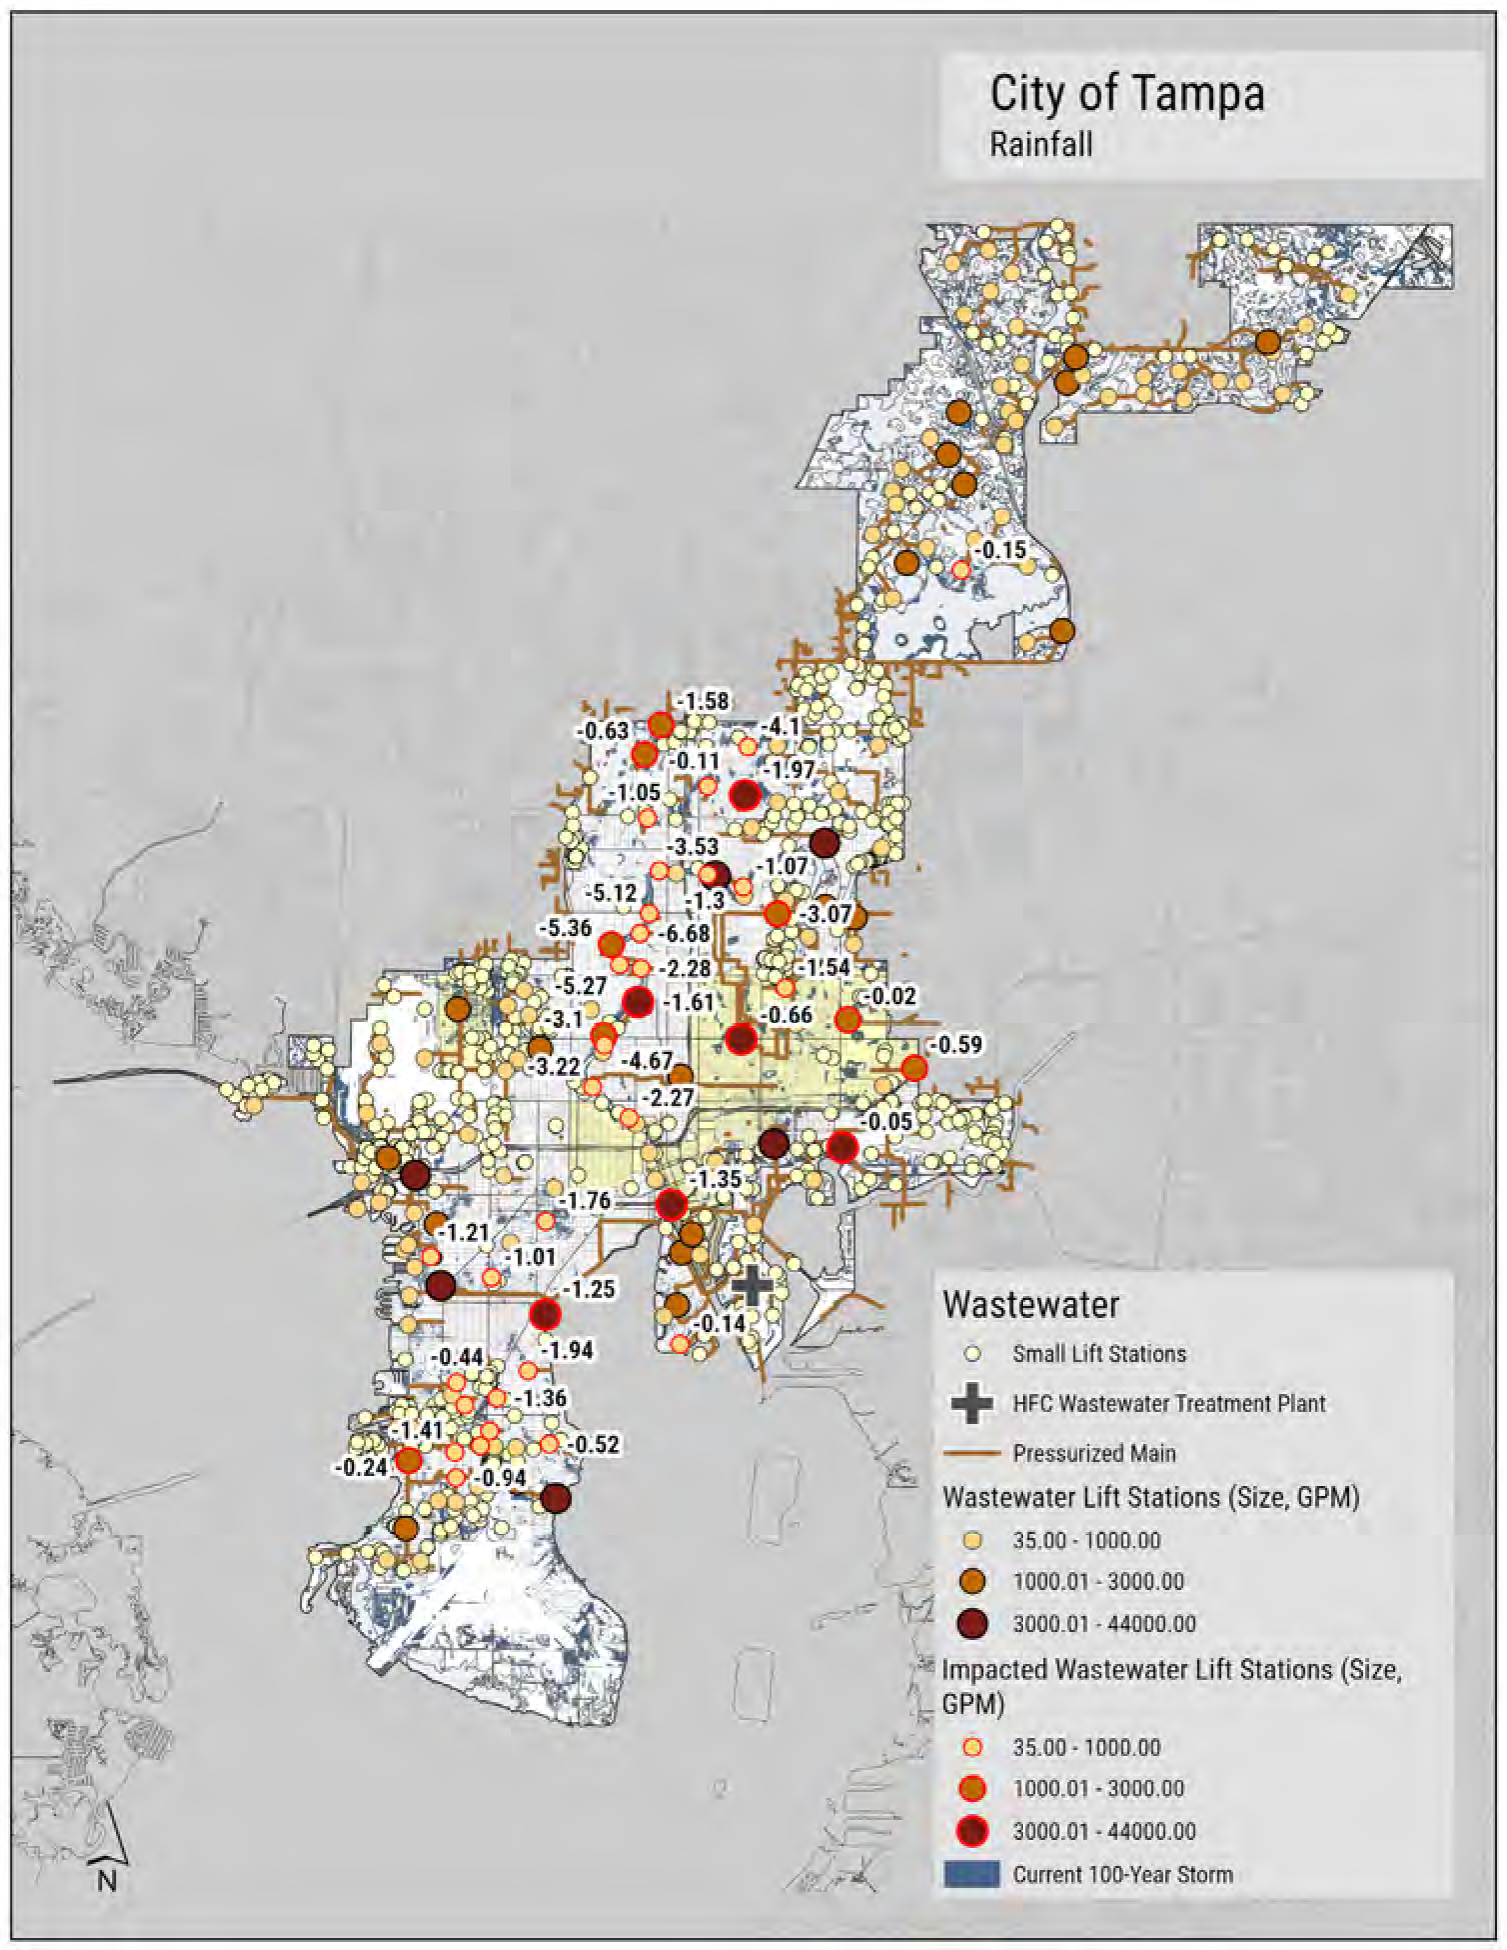
Storm Surge
Storm surge would impact a number of smaller facilities that are near the coastline, especially in the South Tampa and Westshore areas. Of the larger pump stations, with capacity of 3,000 gpm and above, the following would be impacted by a 100-year surge and the 2070 intermediate-high scenario (with depths for that scenario):
- Hanna (9.15’)
- Bayshore (8.60’)
- Krause (7.00’)
- Louisiana (6.36’)
- Westshore (5.53’)
- Averill (5.14’)
- East Tampa (4.50’)
- Ybor (2.11’)
- San Carlos (0.89’)
Smaller facilities (1,000 to 3,000 gpm) to evaluate for potential storm surge impacts includes:
- Rome (7.63’)
- Davis Islands (7.52’)
- Trilby (6.89’)
- Prescott (6.73’)
- Harbour Island (5.62’)
- Columbia (4.54’)
- Swann (4.23’)
- O’Brien (4.02’)
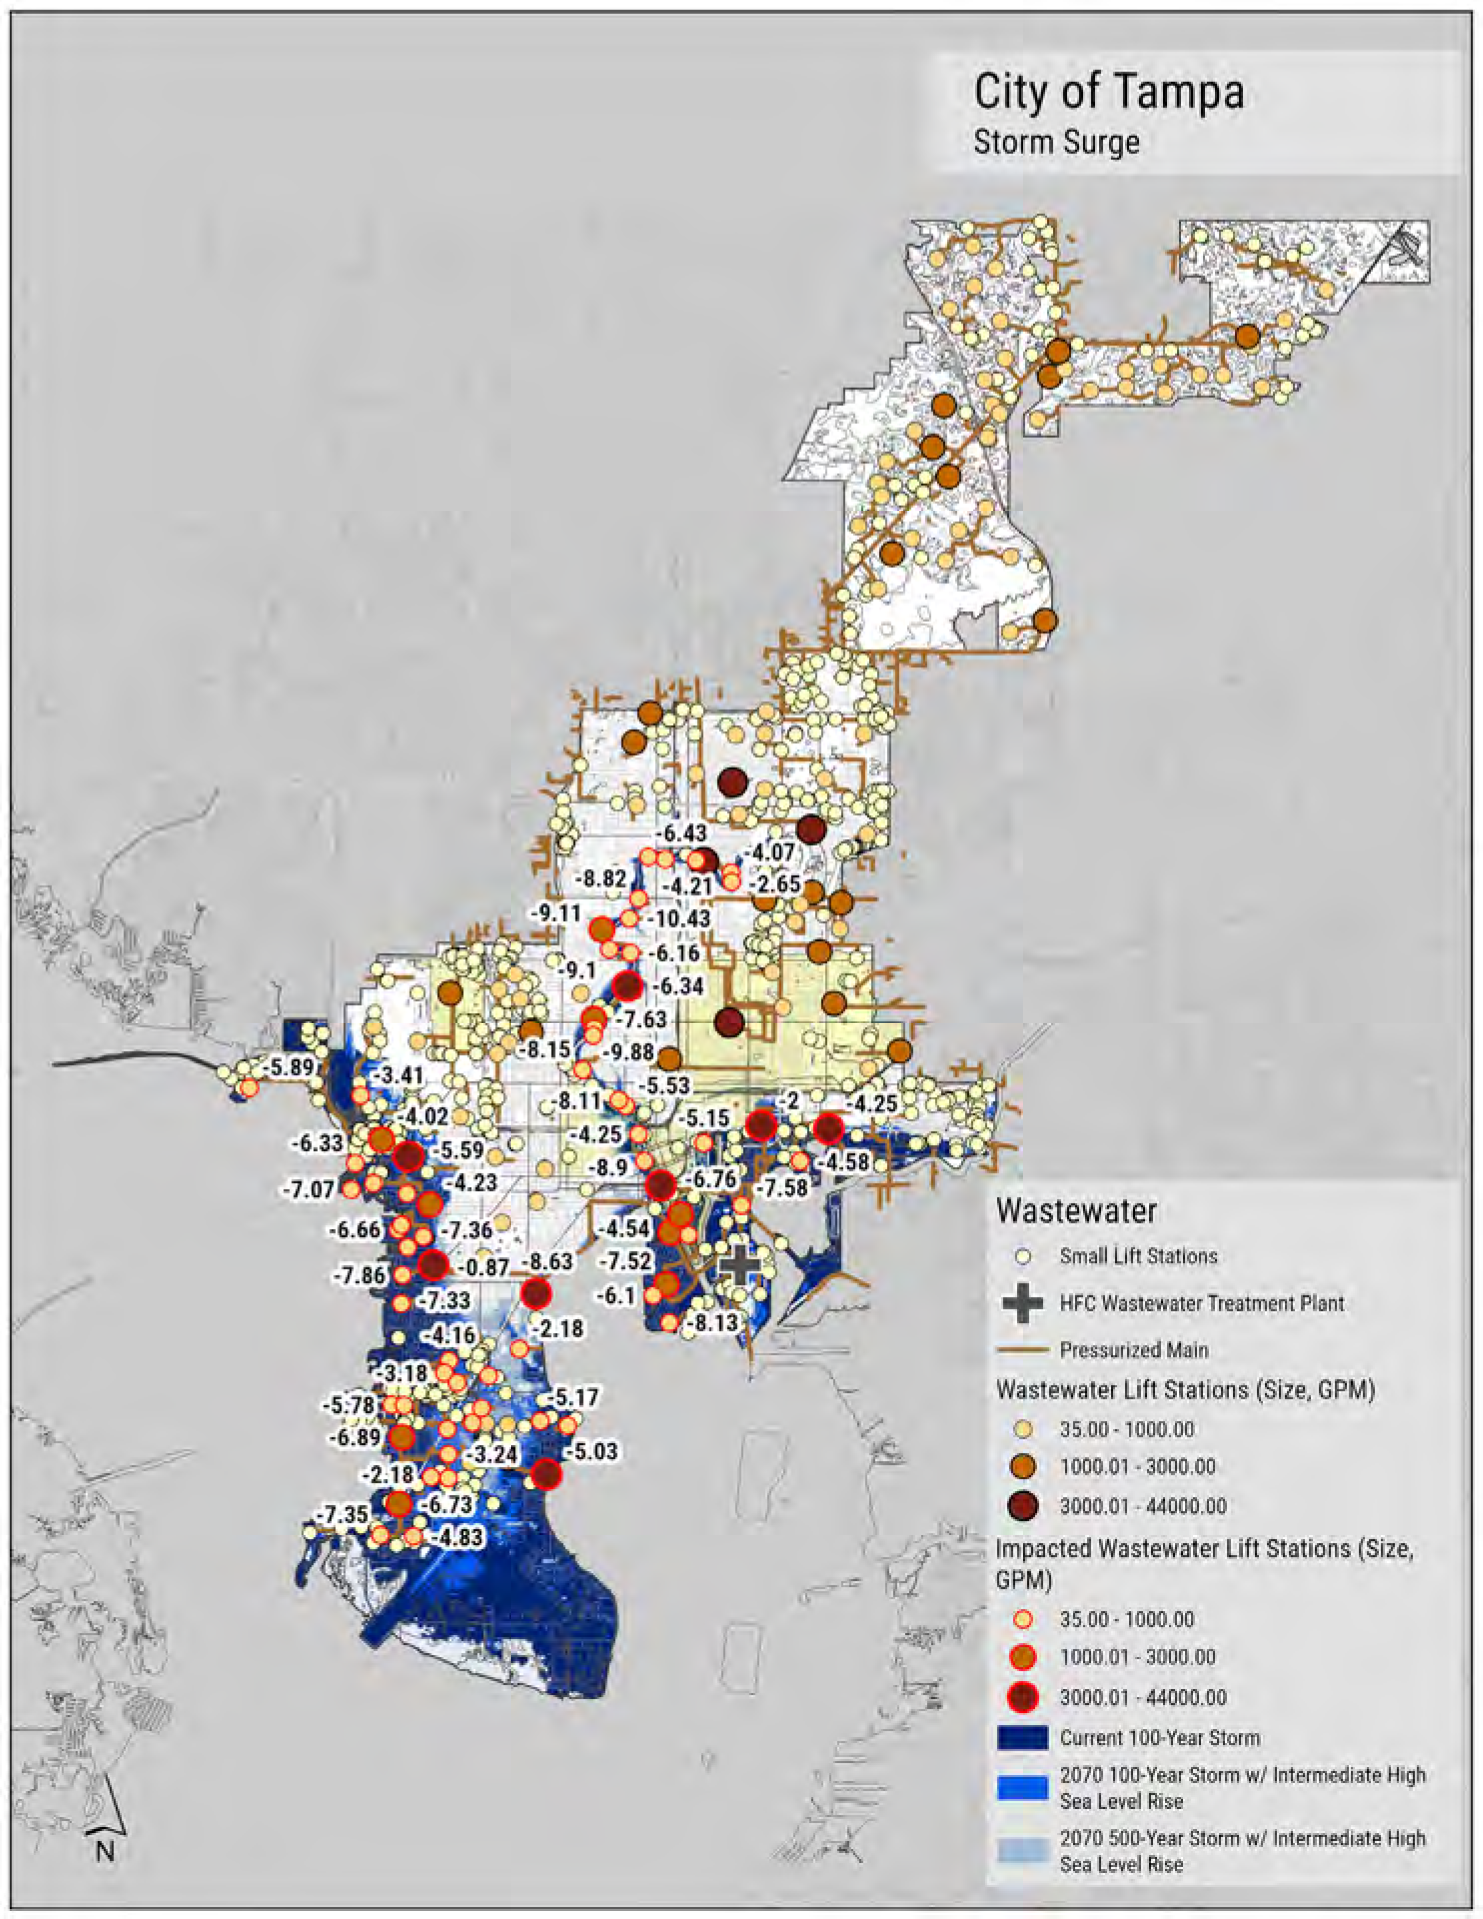
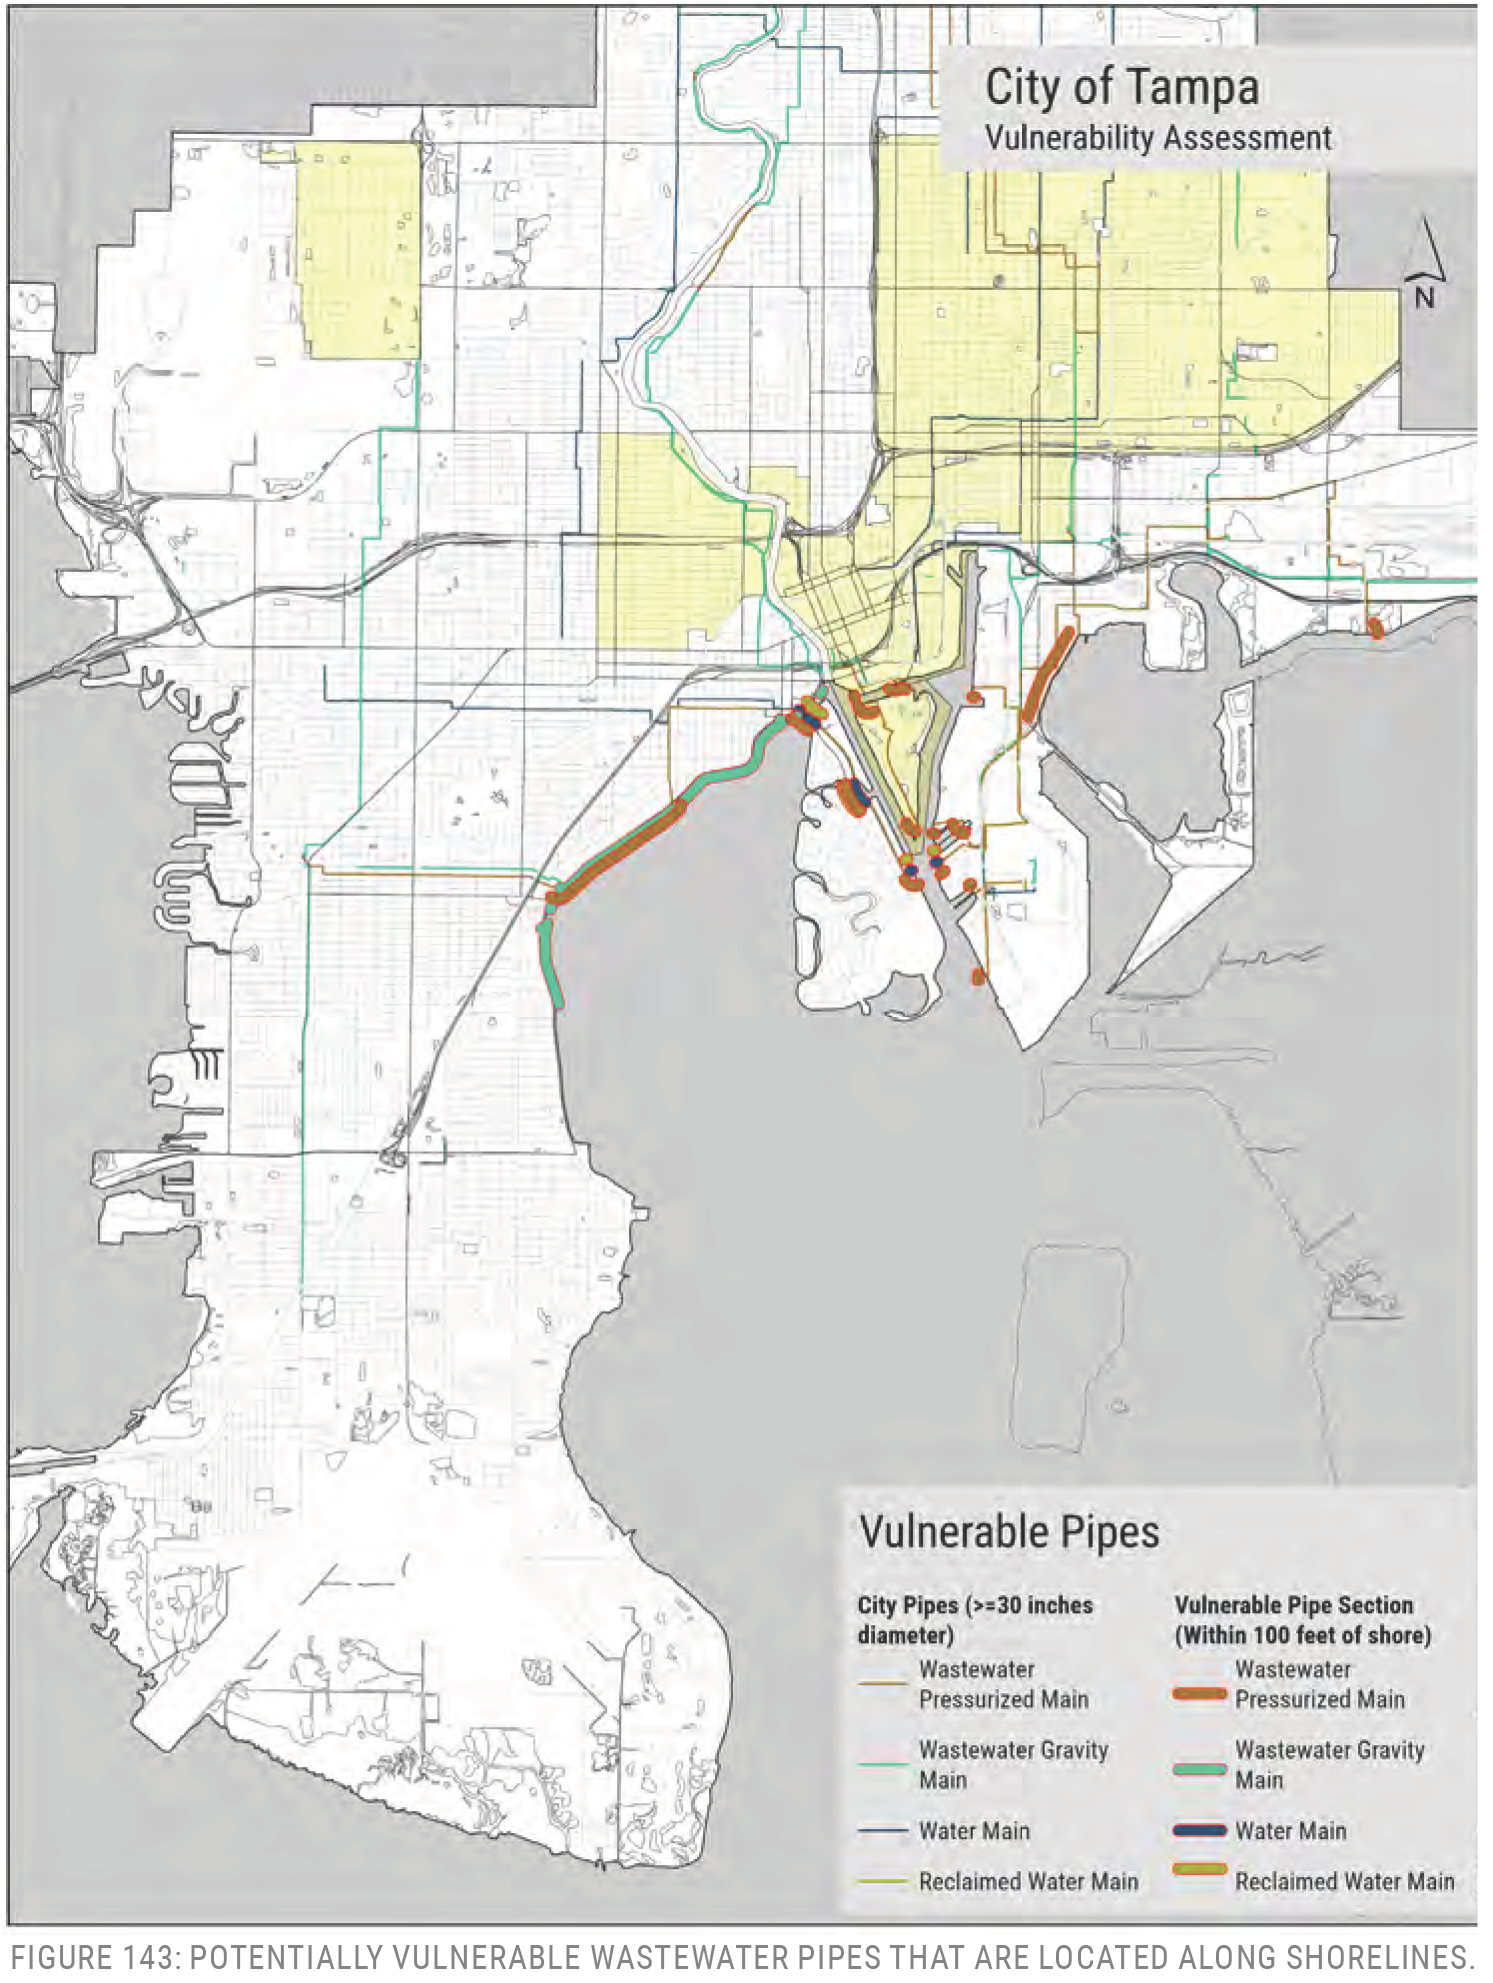
FIGURE 143: POTENTIALLY VULNERABLE WASTEWATER PIPES THAT ARE LOCATED ALONG SHORELINES.
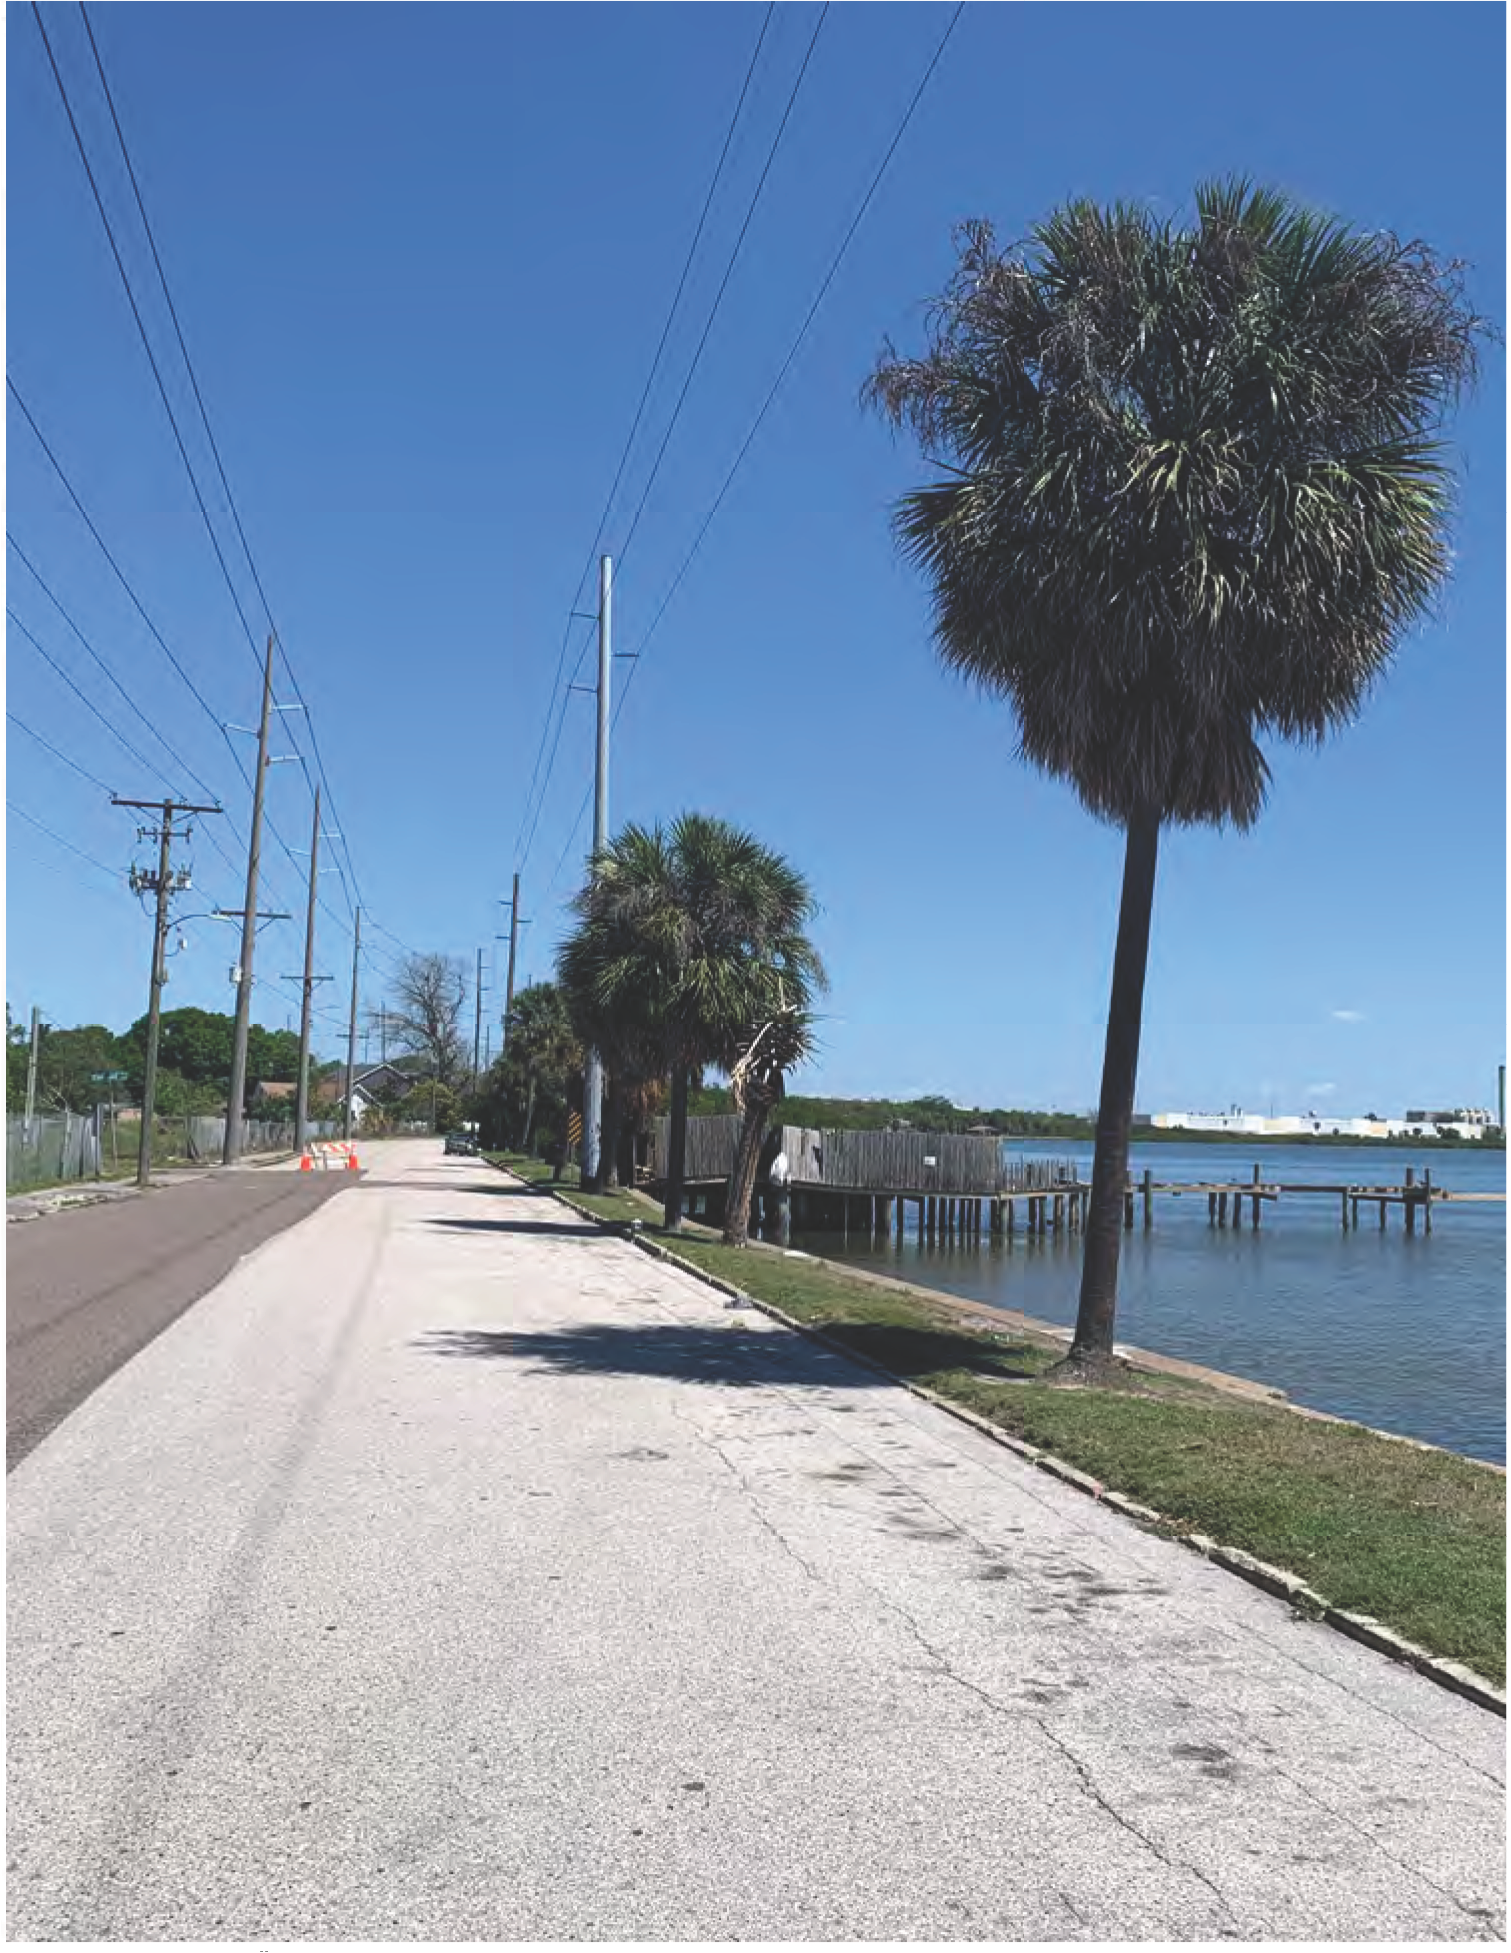
FIGURE 144: A 54" SANITARY CONCRETE FORCE MAIN IS BENEATH BERMUDA BOULEVARD IN PALMETTO BEACH, WHICH DELIVERS WASTEWATER TO THE HOWARD F. CURREN WASTEWATER TREATMENT PLANT ON THE ADJACENT HOOKER'S POINT PENINSULA. THE PIPE WAS CONSTRUCTED IN 1972.
A few facilities were evaluated in closer detail.
Howard F. Curren Advanced Wastewater Treatment Plant
2700 Maritime BoulevardVulnerabilities:
- Storm Surge
- Minimal Rainfall
- Sea Level Rise at outfalls
A separate vulnerability assessment has been conducted for the Howard F. Curren Wastewater Treatment Plant, which includes more detail for specific components of the facility and their vulnerabilities (Applied Sciences, 2022).
Location
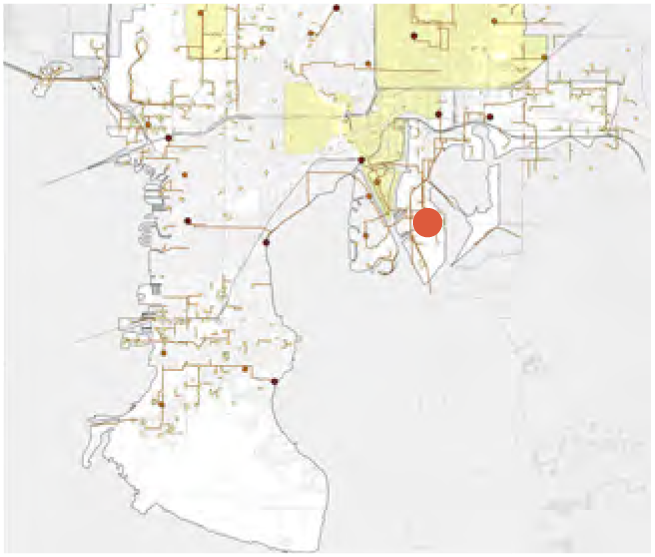
Rainfall (100-Year)
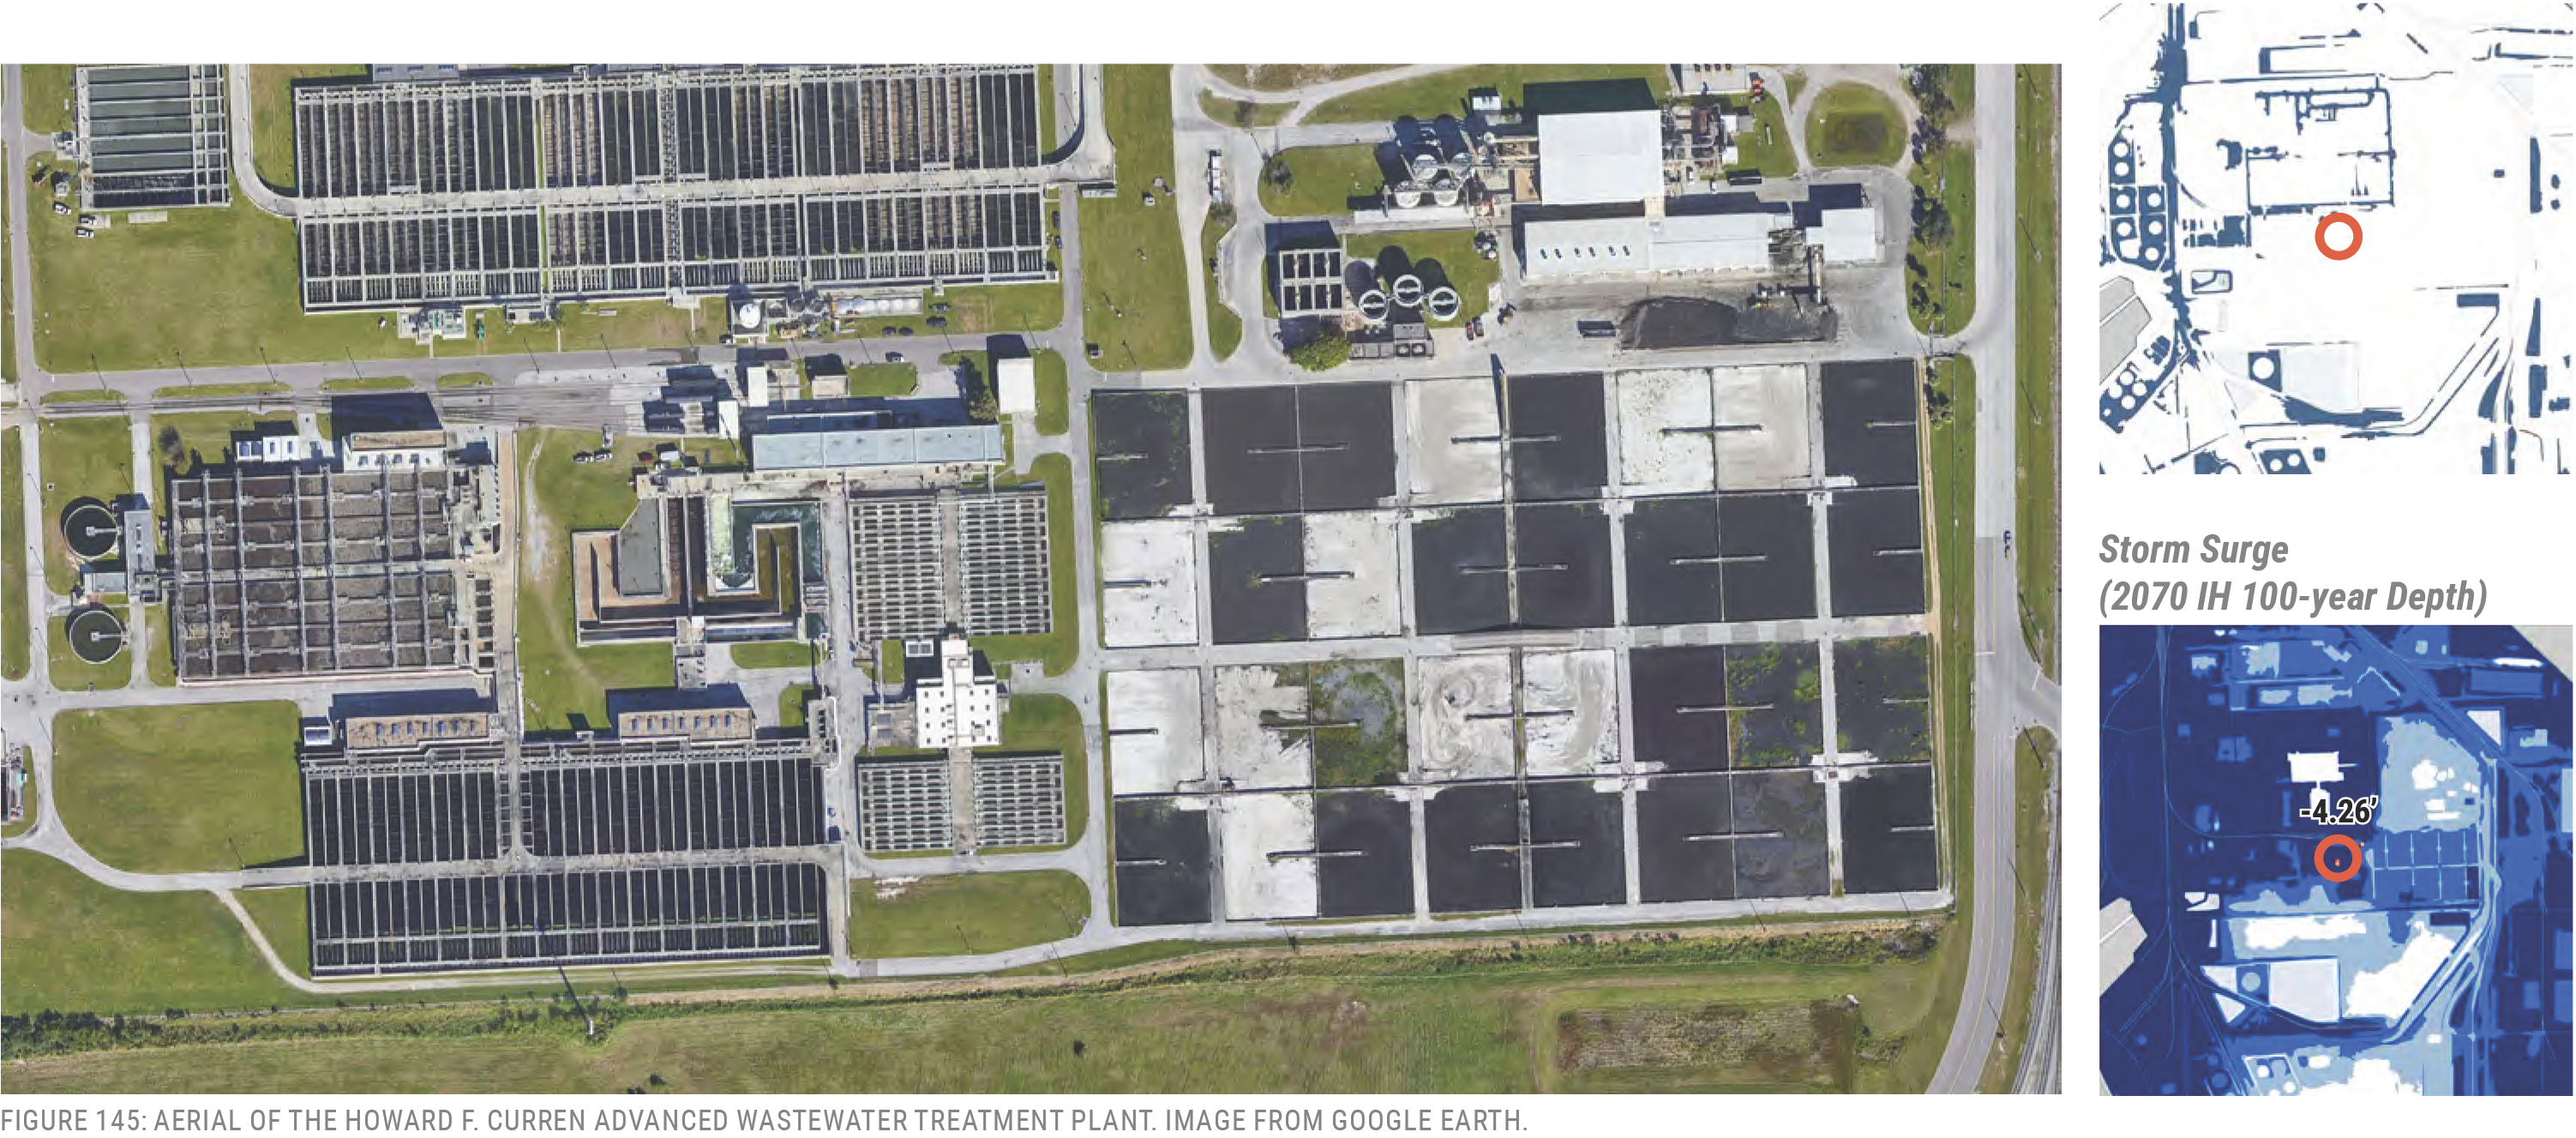
Location
Pump Facility: Ybor
1302 North 25th Street
Size: 44,000 GPM
History: 1982, Rehab 1996, w/ Well 2001, 2002
Vulnerabilities:
- Storm Surge
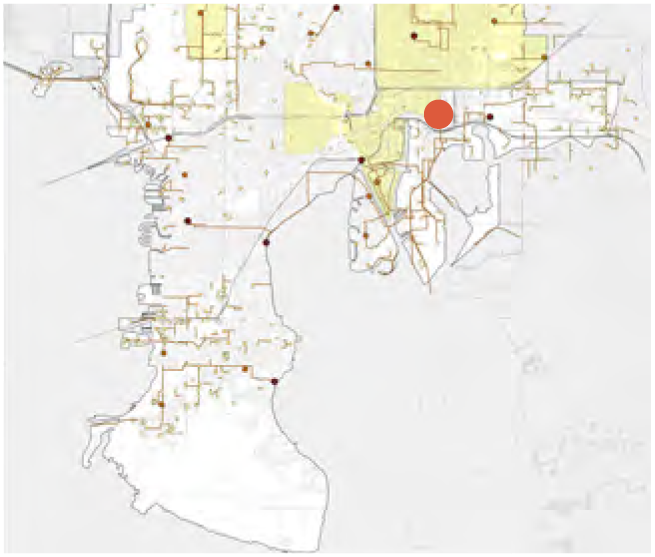
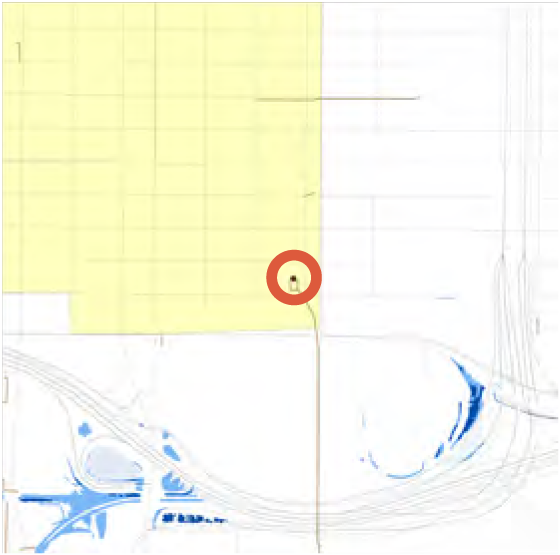
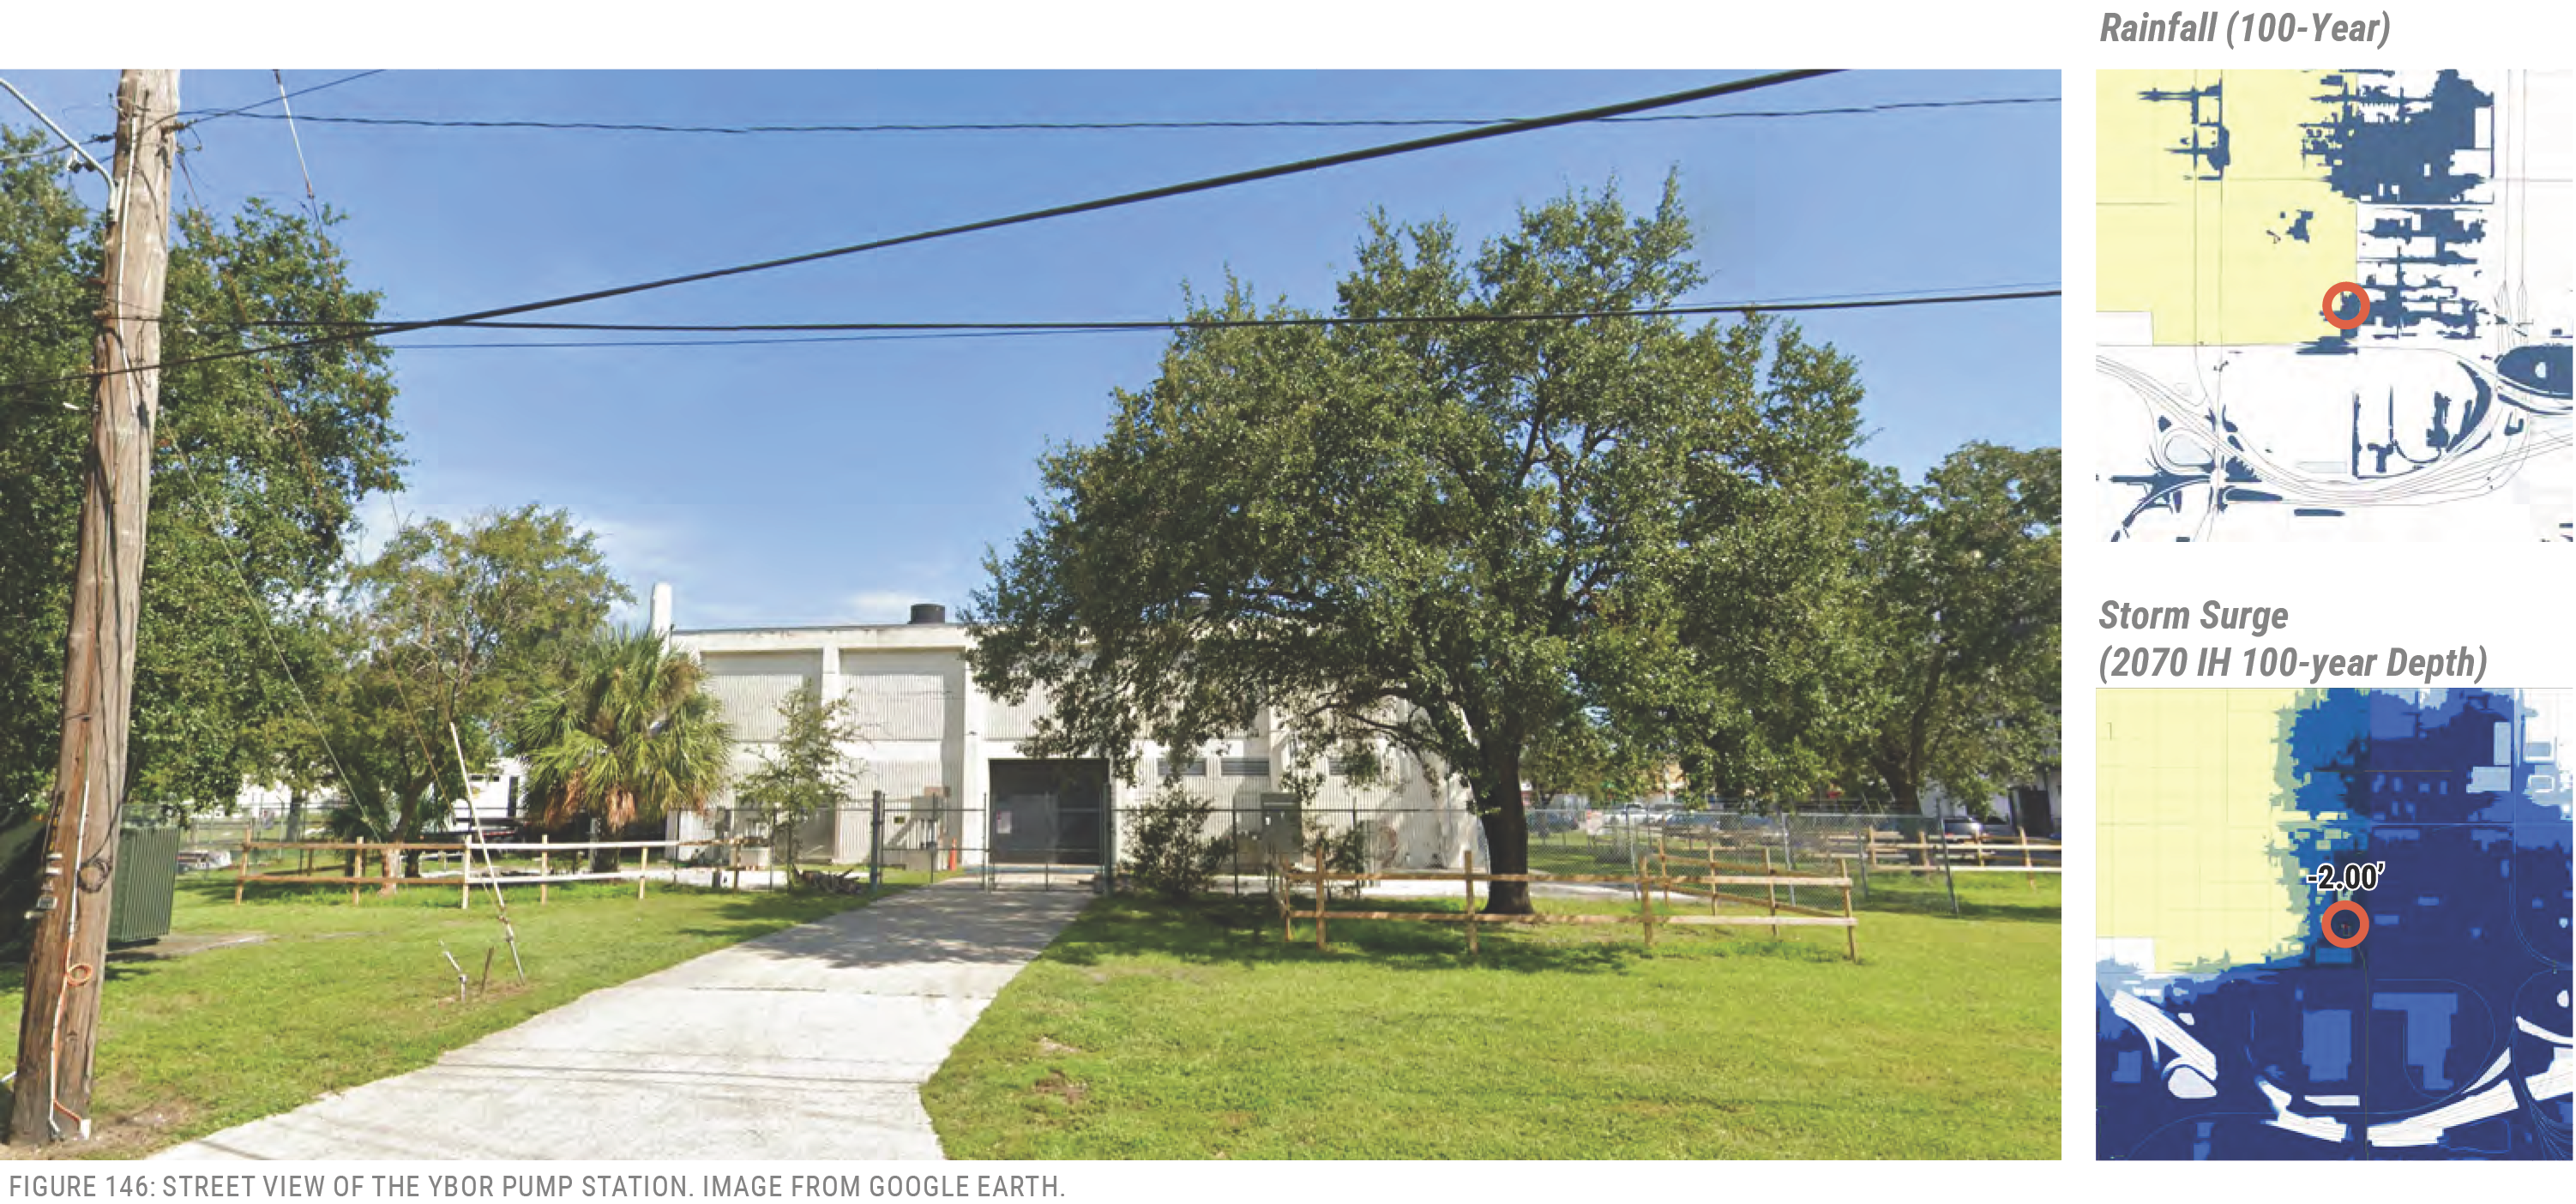
Pump Facility: Krause
225 Ashley Drive South
Size: 27,777 GPM
History: 1950, Rehab 1985. Elect. 1999
Vulnerabilities:
- Sea Level Rise
- Storm Surge
Location
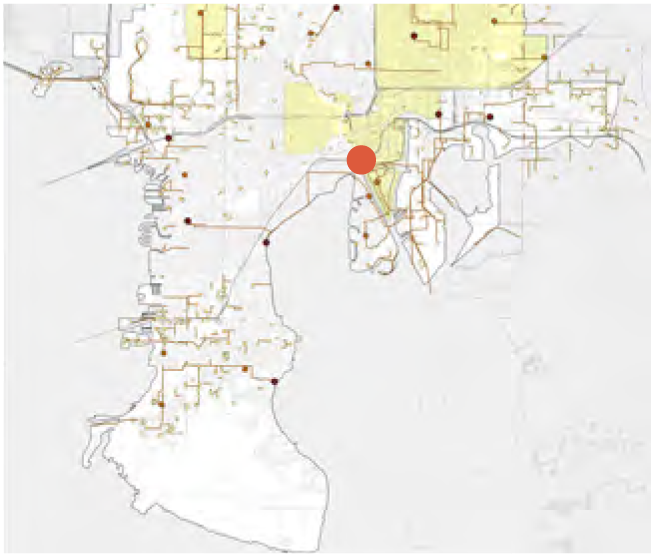
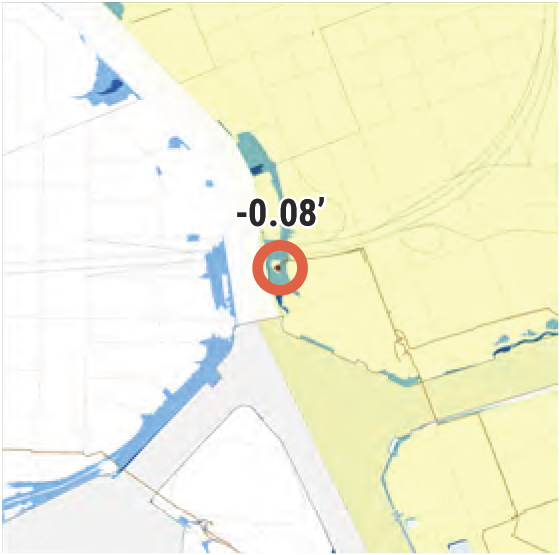 -0.08’-0.08’
Rainfall (100-Year)
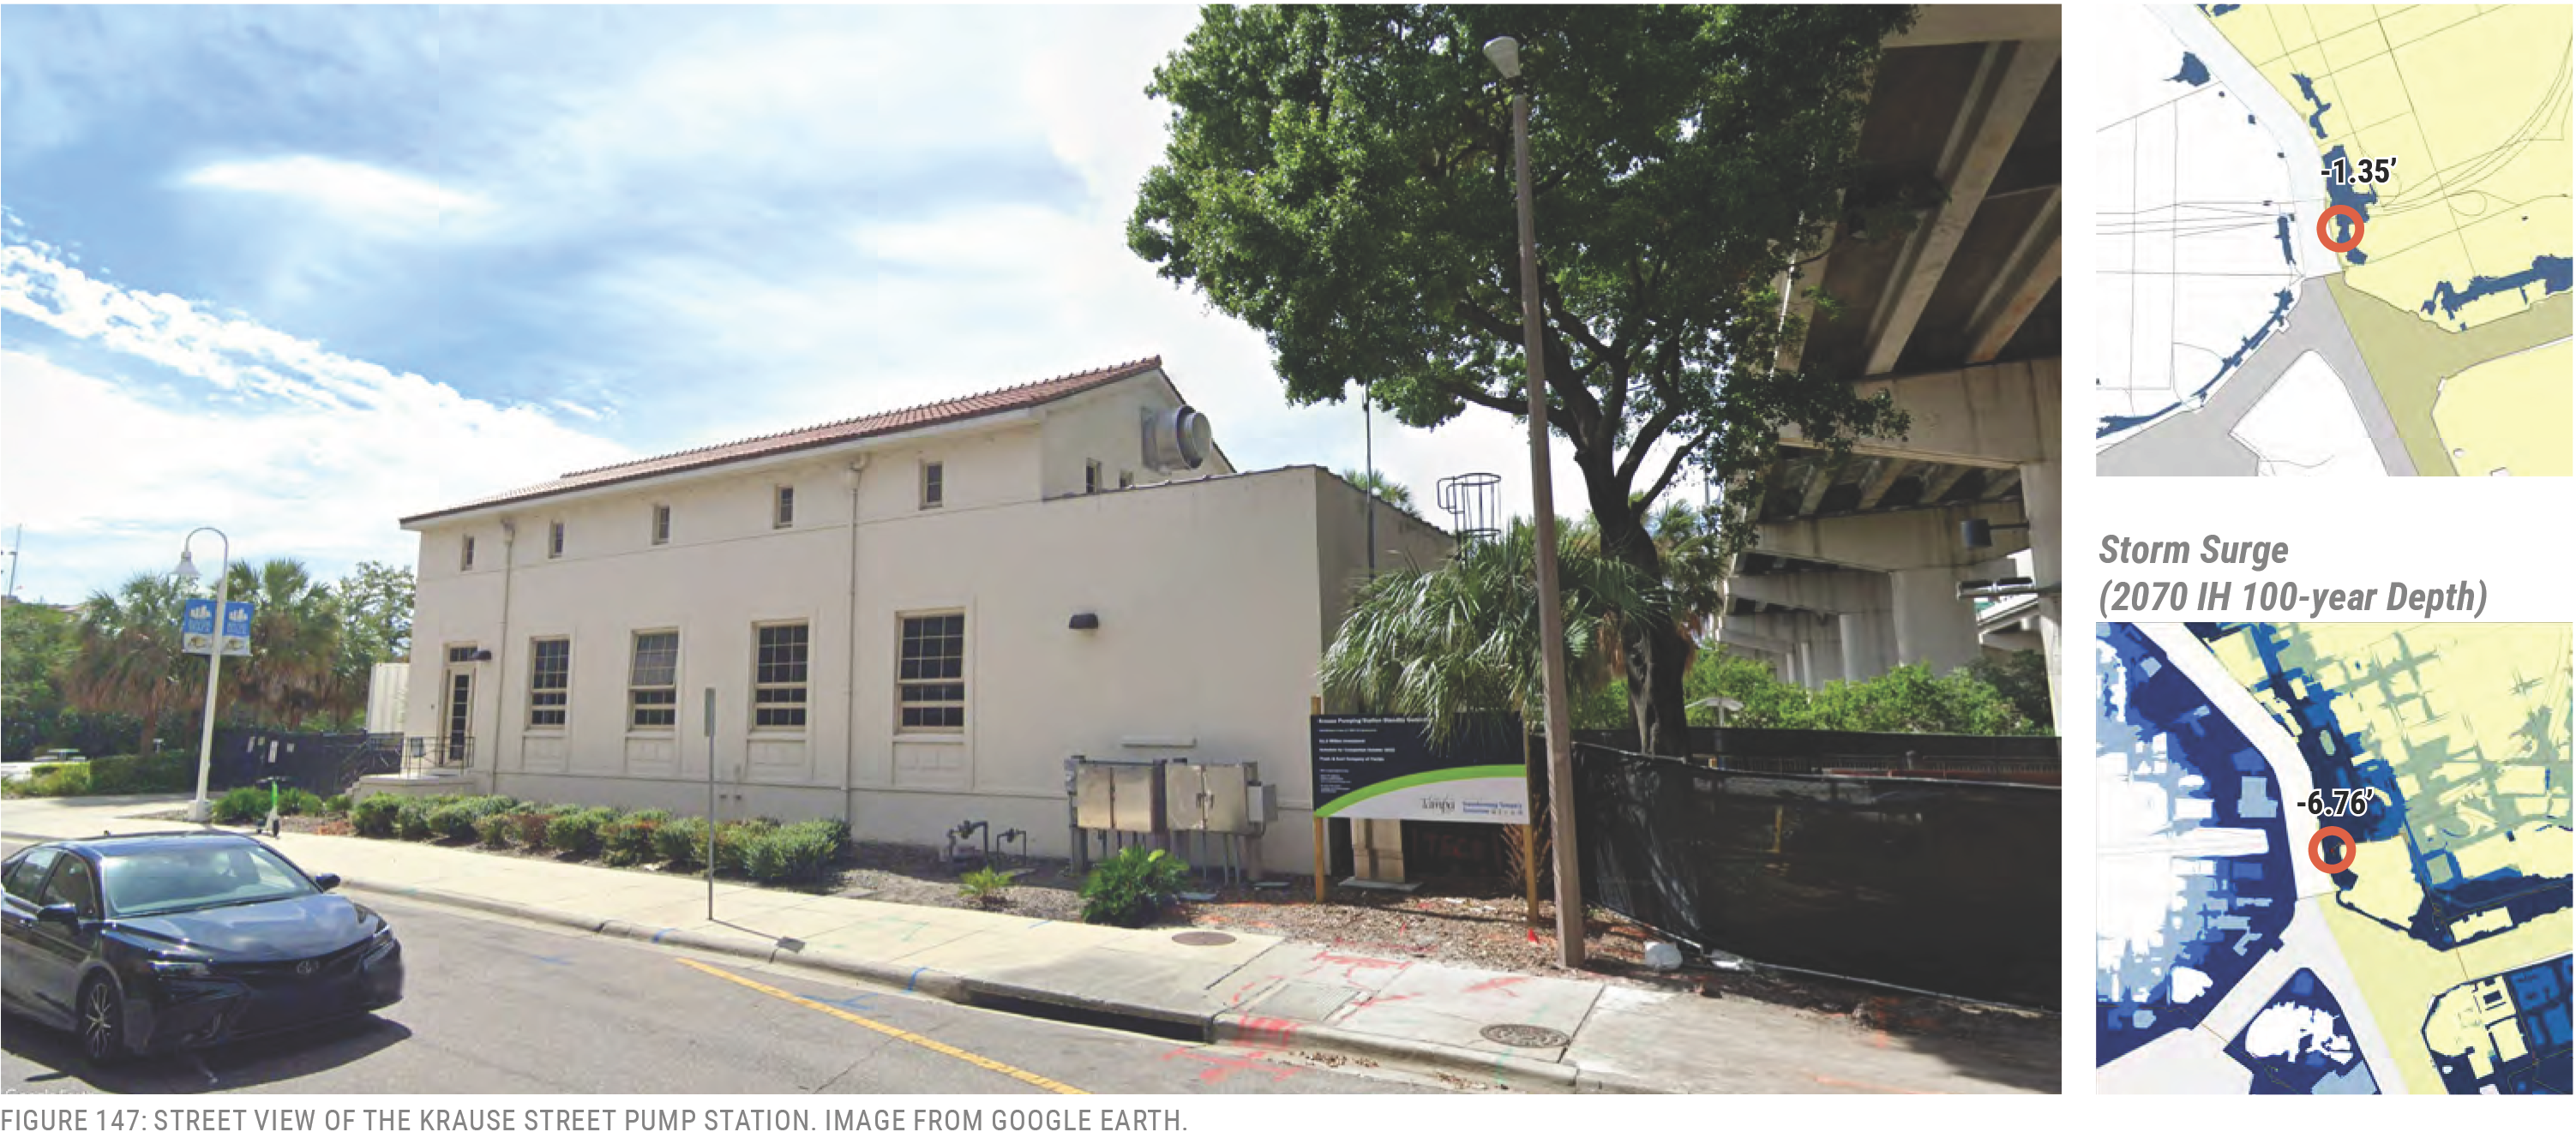 FIGURE 147: STREET VIEW OF THE KRAUSE STREET PUMP STATION. IMAGE FROM GOOGLE EARTH. -1.35’-1.35’ Storm Surge (2070 IH 100-year Depth) -6.76’-6.76’
Pump Facility: San Carlos
4406 West San Carlos Street
Size: 22,500 GPM
History: 1982, Rehab 1985, 1999; the latest occuring in 2021
Vulnerabilities:
- Storm Surge
Location
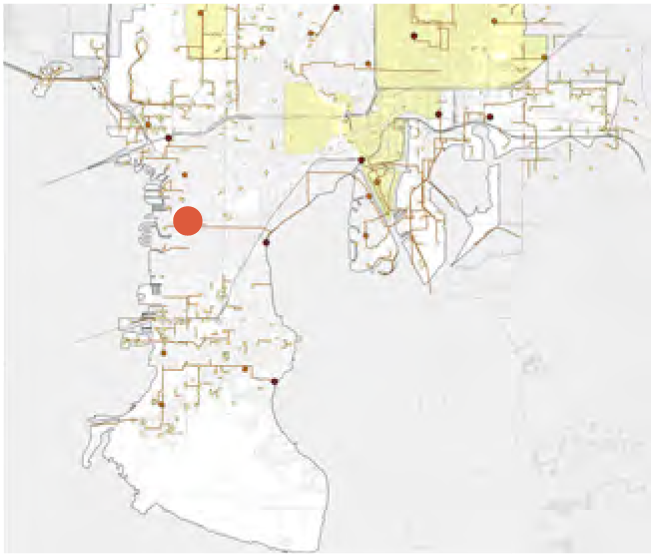
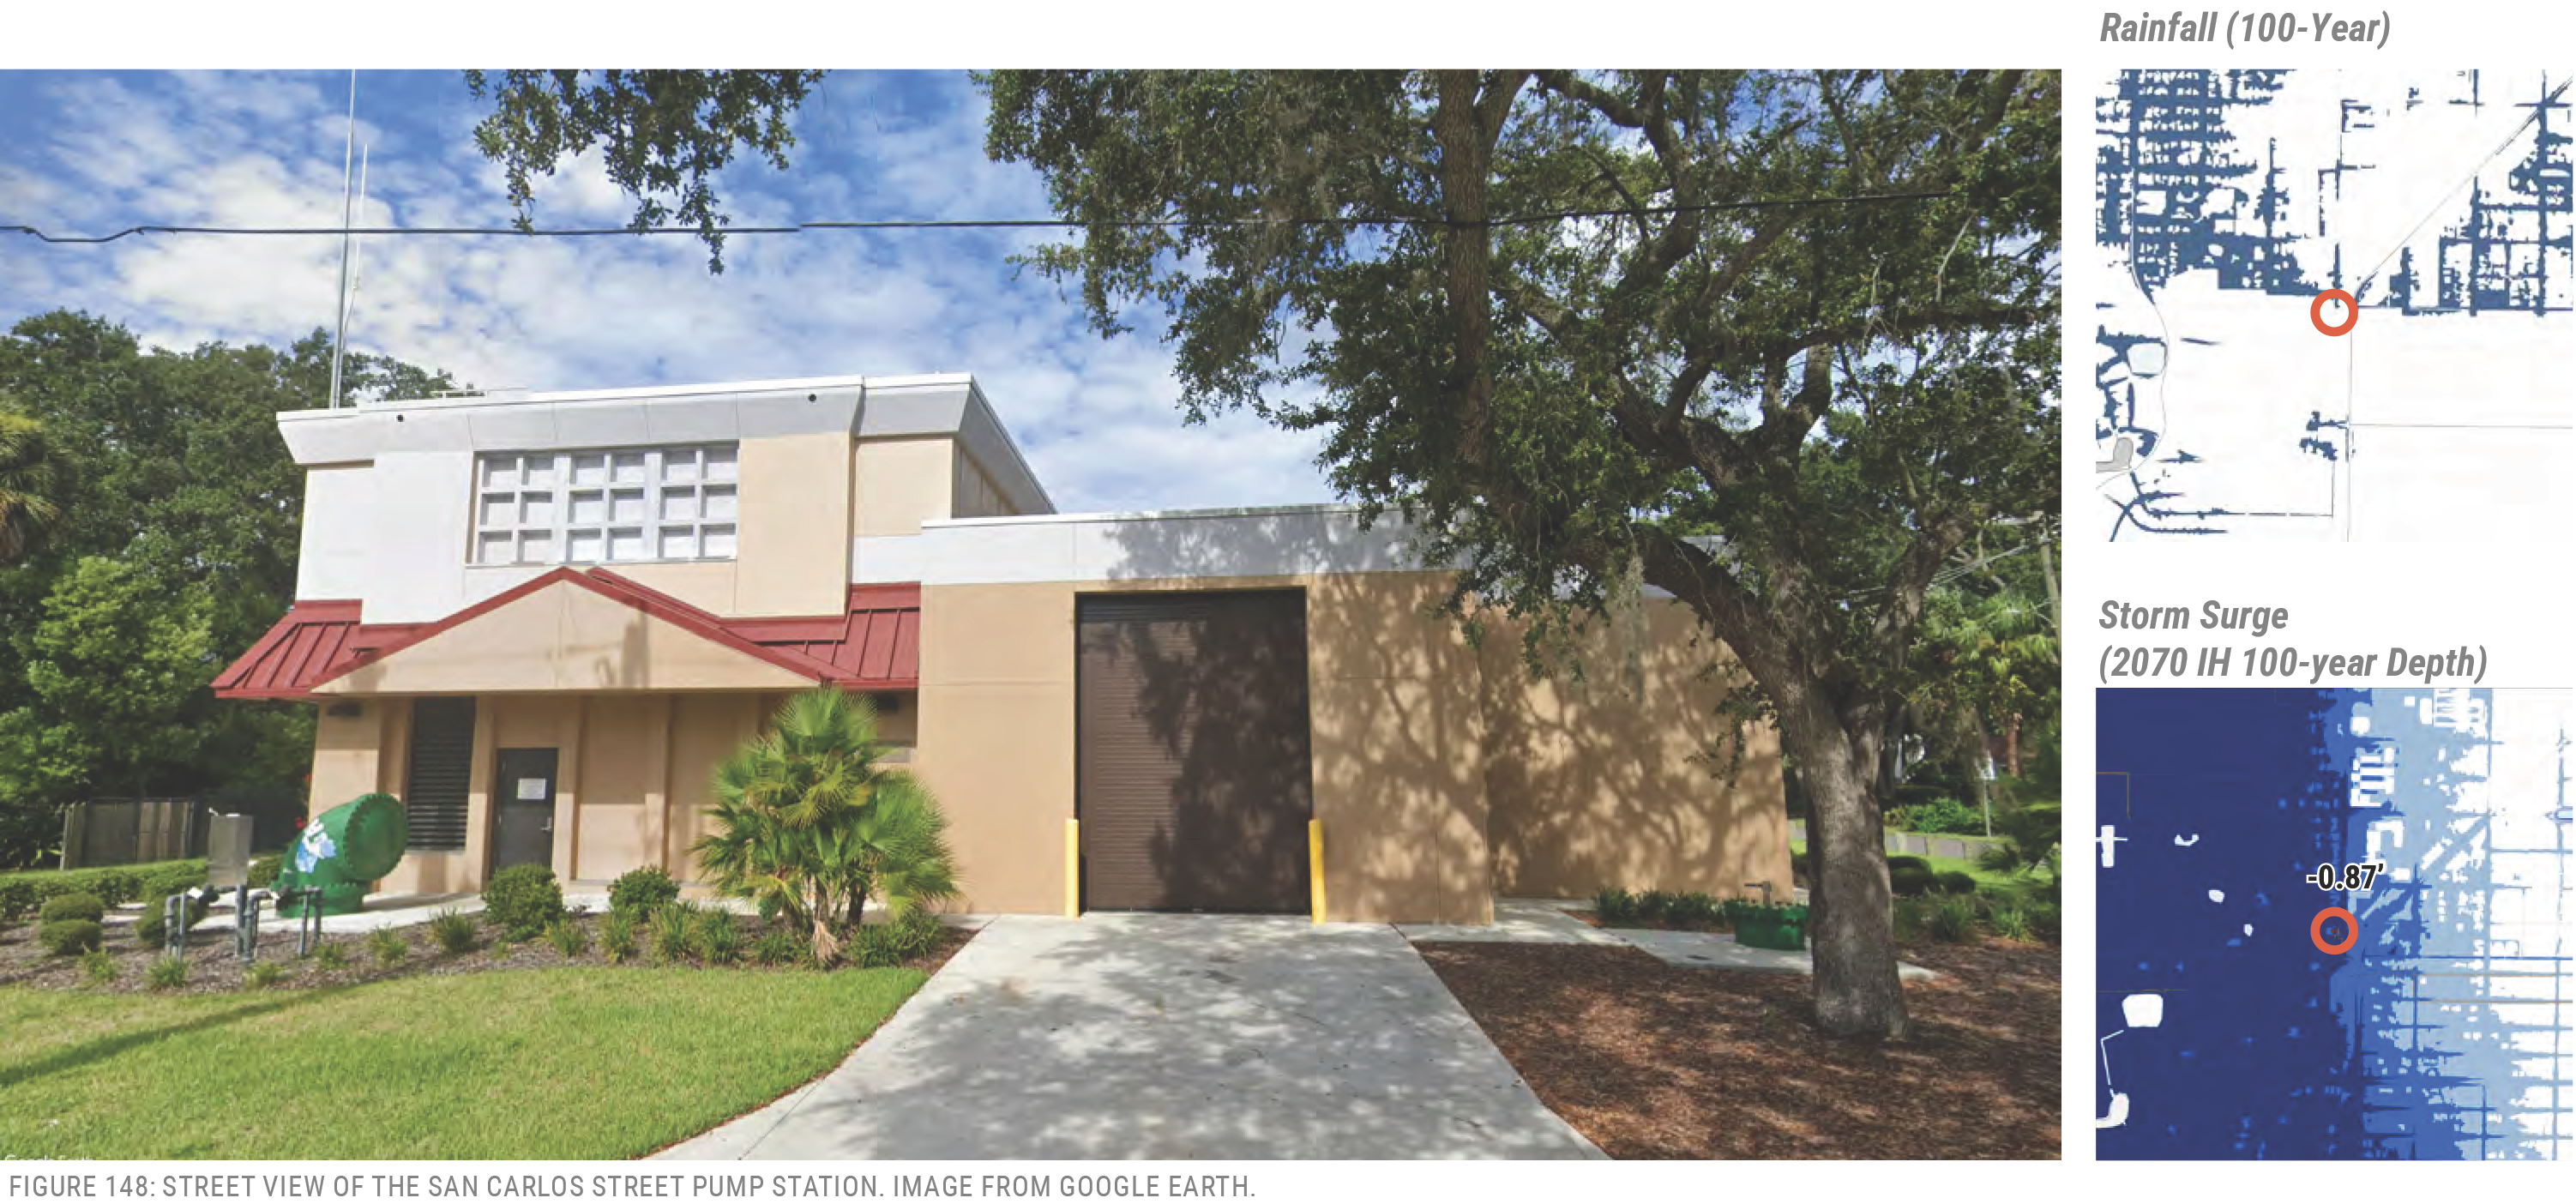
Pump Facility: Louisiana
606 West Louisiana Avenue
Size: 19,400 GPM
History: 1950, Rehab 1981
Vulnerabilities:
- Storm Surge
| Event | Depth (ft) |
|---|---|
| Rainfall (100-Year) | -6.34’ |
| Storm Surge (2070 IH 100-year Depth) | -1.61’ |
Location
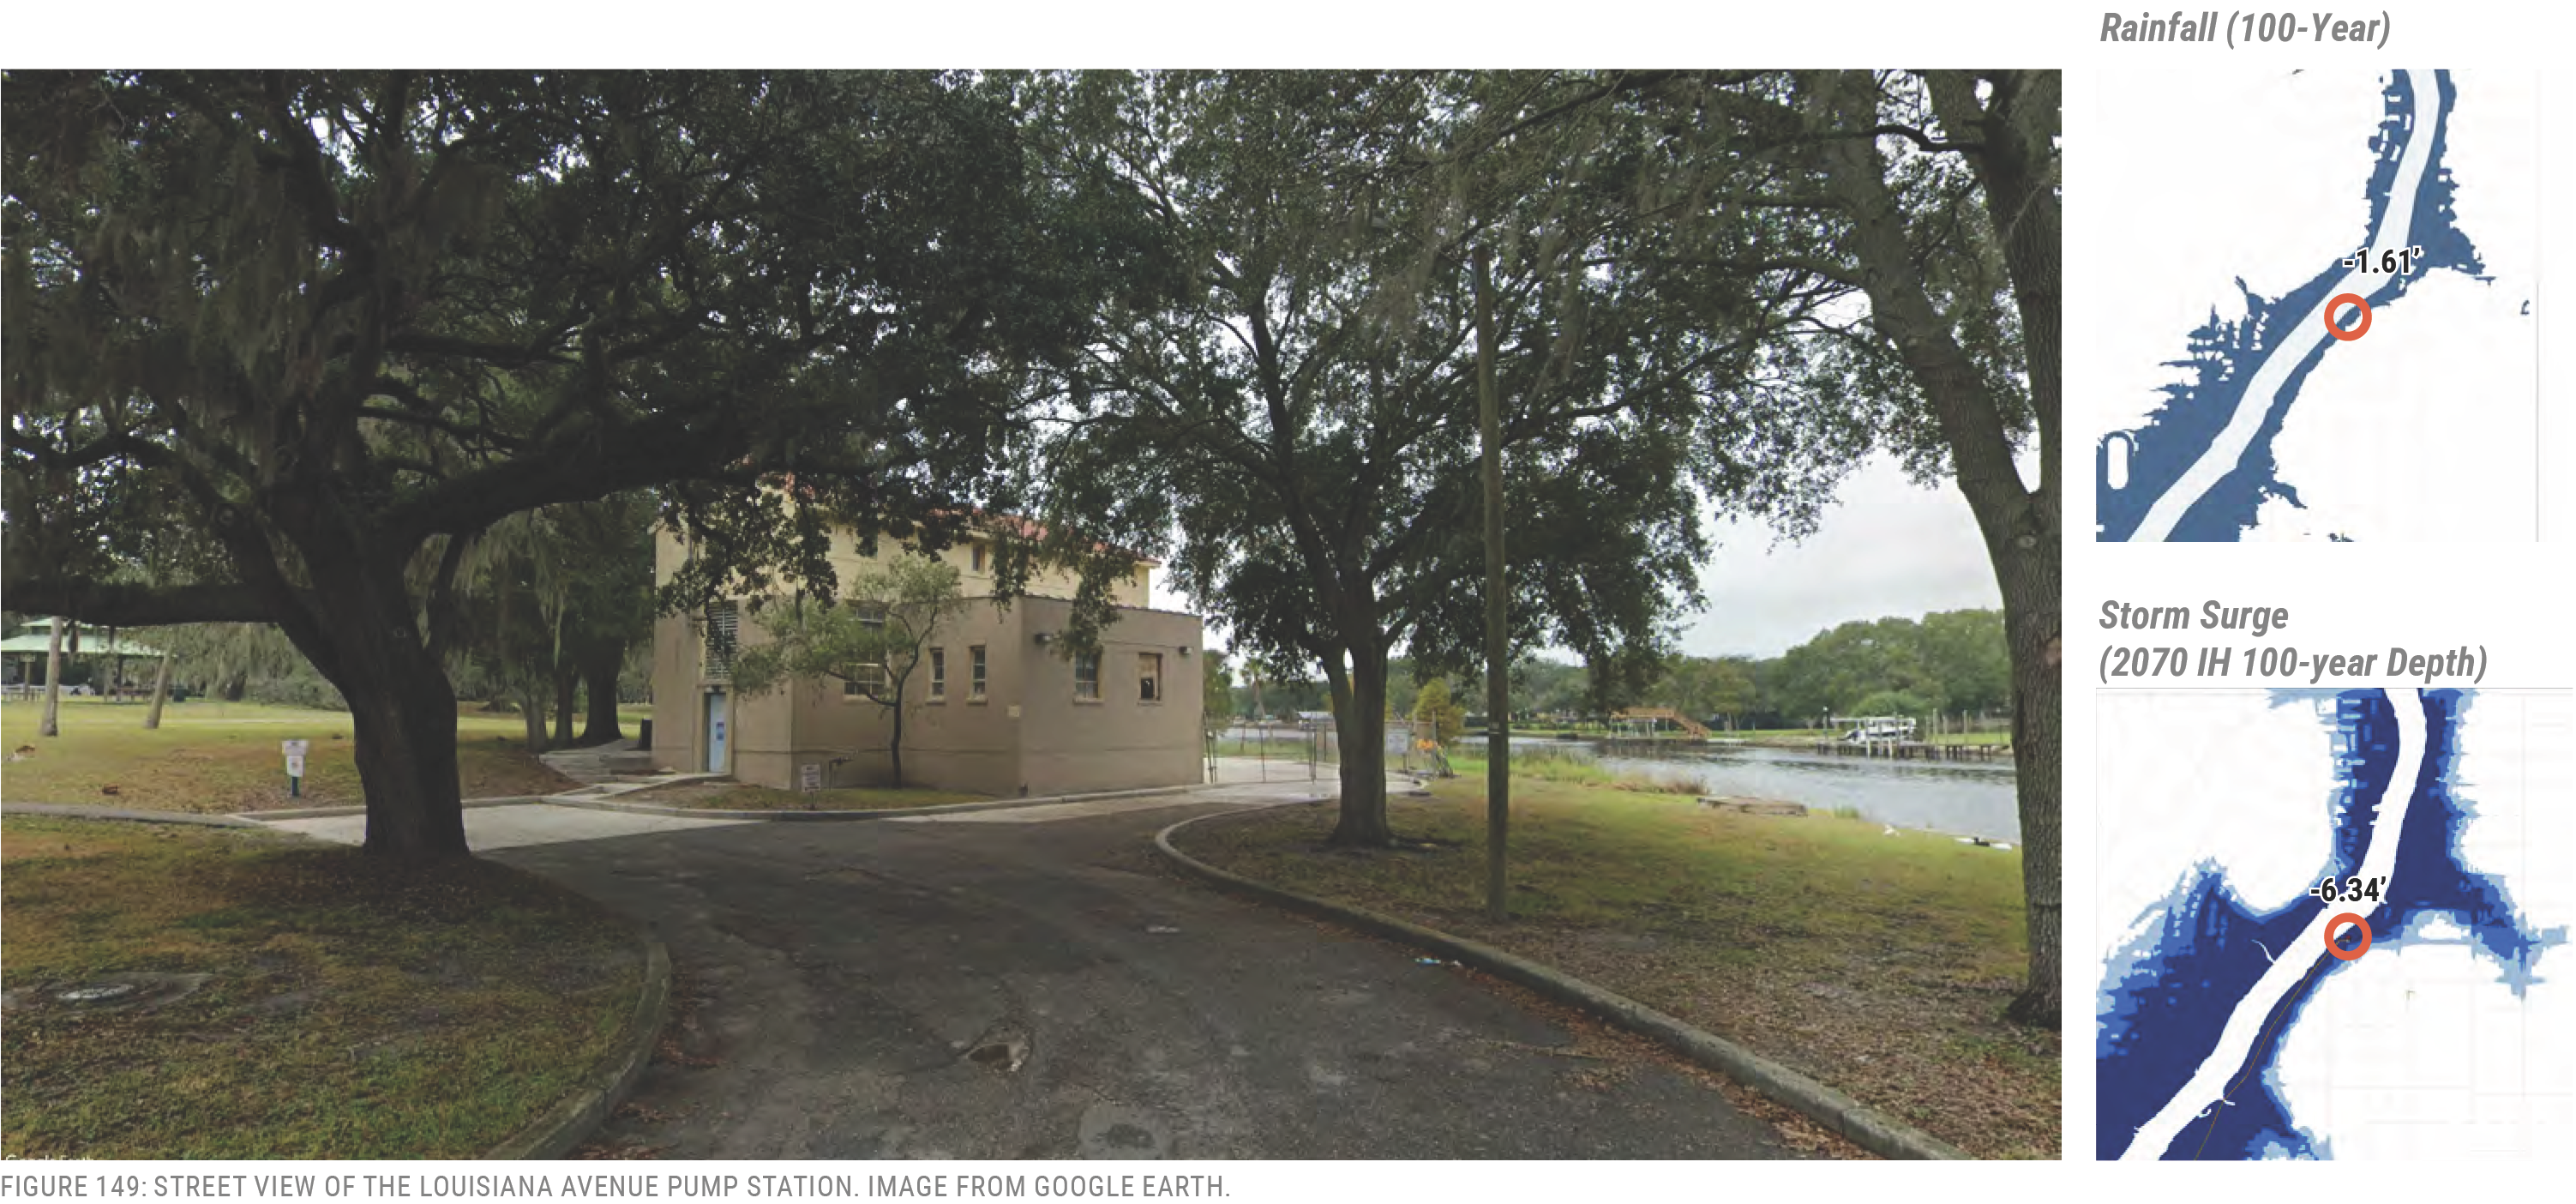
Pump Facility: East Tampa
1201 North 39th Street
Size: 7,700 GPM
History: 1996
Vulnerabilities:
- Rainfall
- Storm Surge
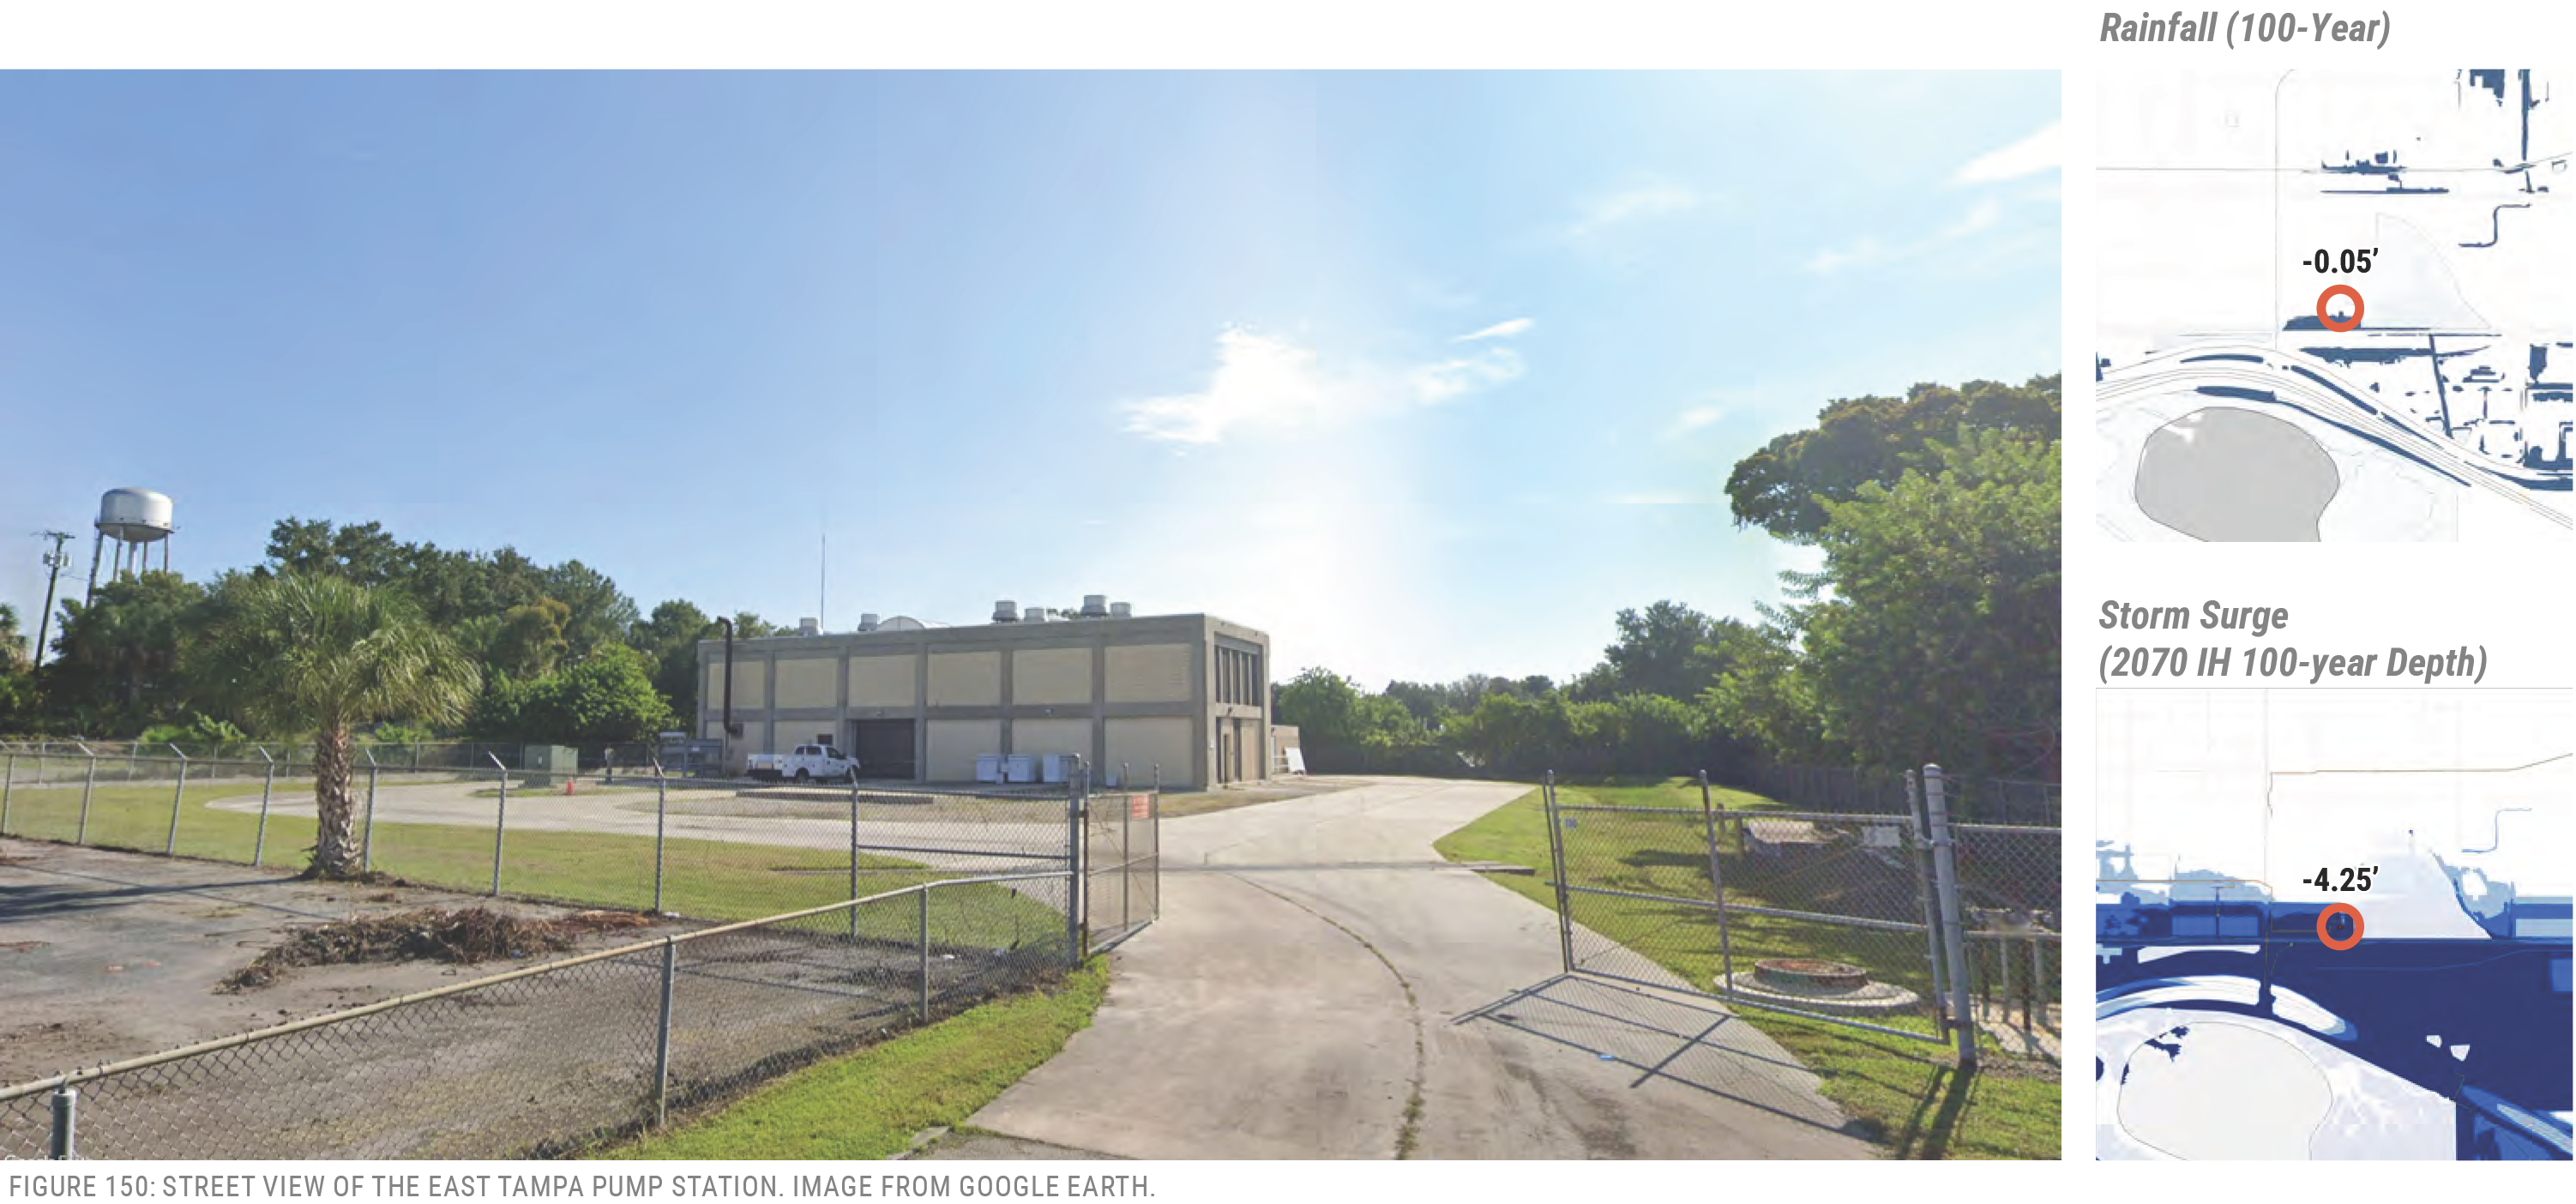
Location
Pump Facility: Bayshore
3300 Bayshore Boulevard
Size: 5,800 GPM
History: 1958, Rehab 1993
Vulnerabilities:
- Storm Surge
Rainfall (100-Year) -8.63’-8.63’ Storm Surge (2070 IH 100-year Depth) -1.25’-1.25’
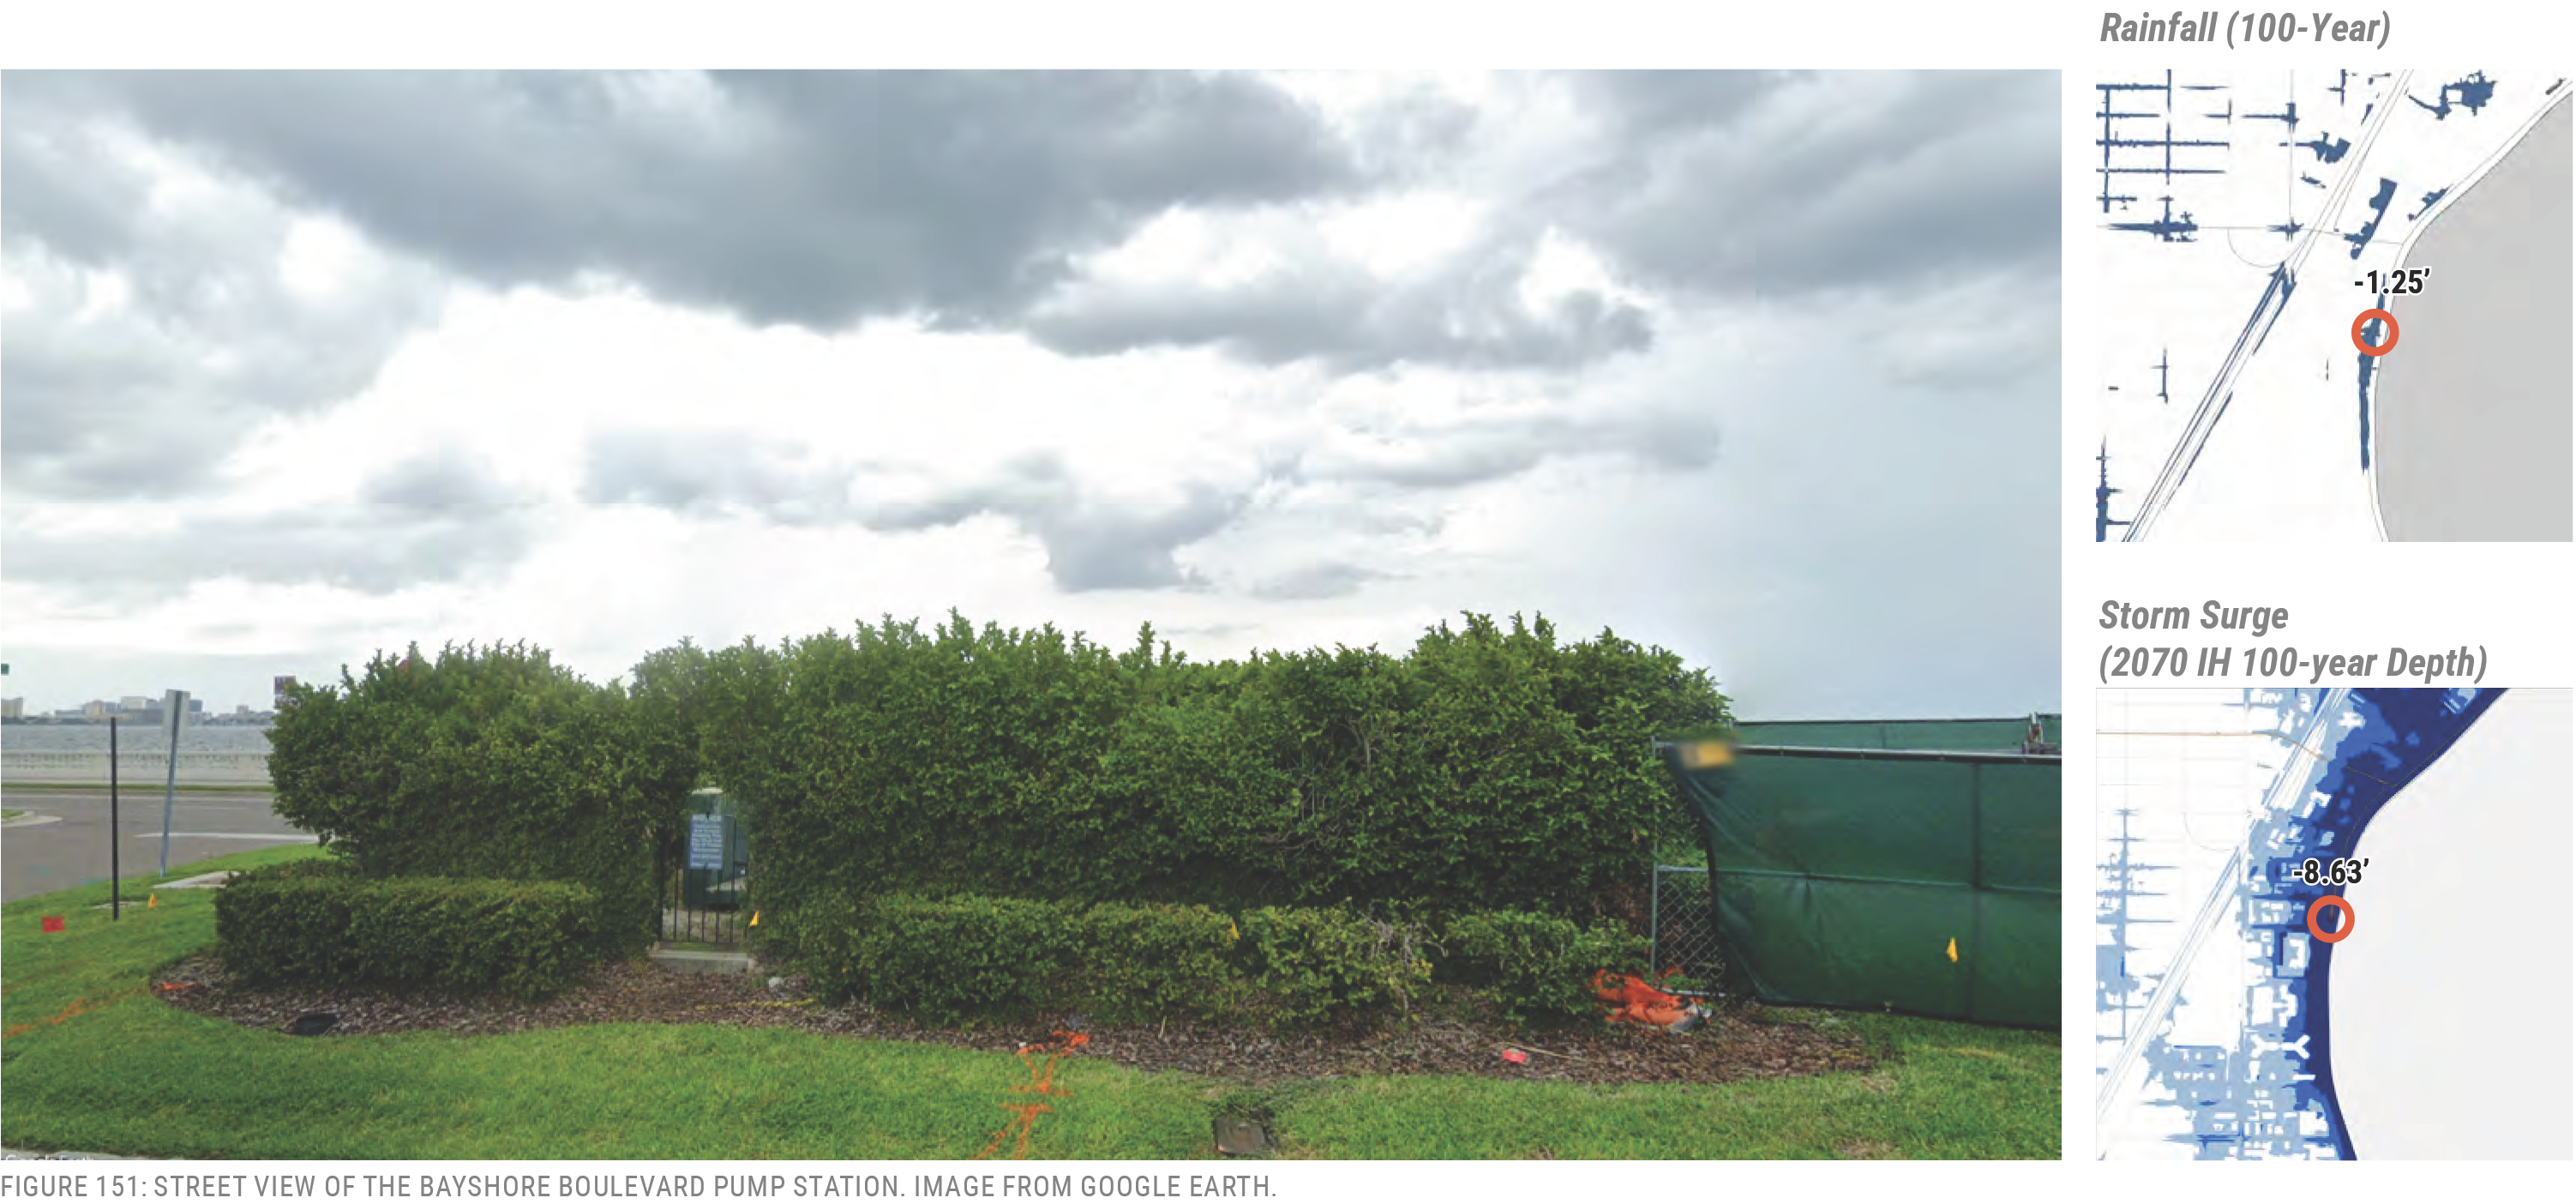
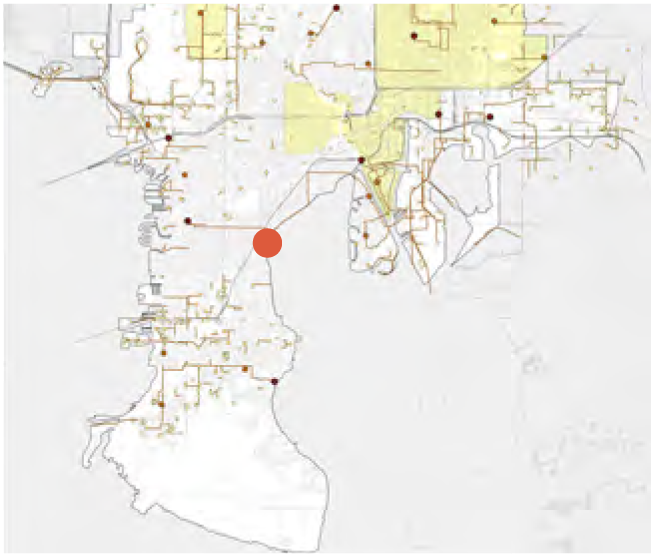
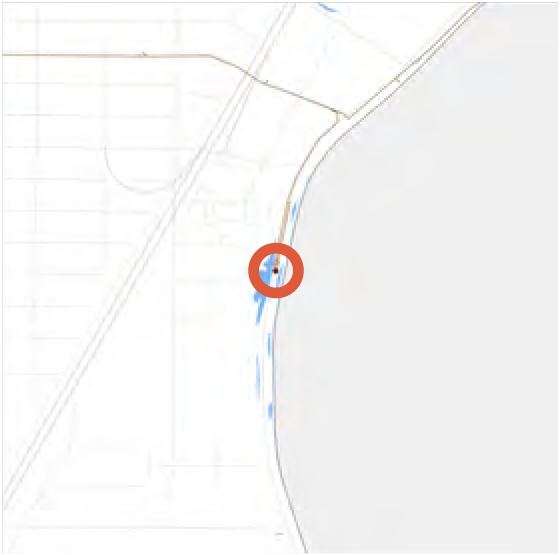
Pump Facility: Averill
2805 West Averill Avenue
Size: 3,540 GPM
History: 1985
Vulnerabilities:
- Storm Surge
Location
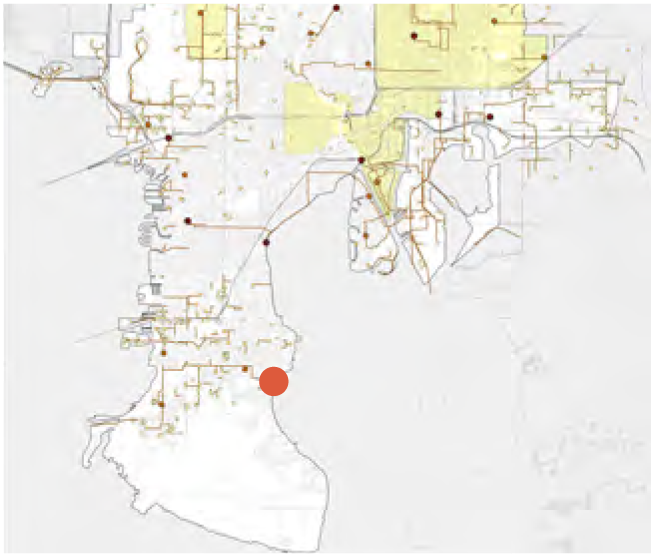
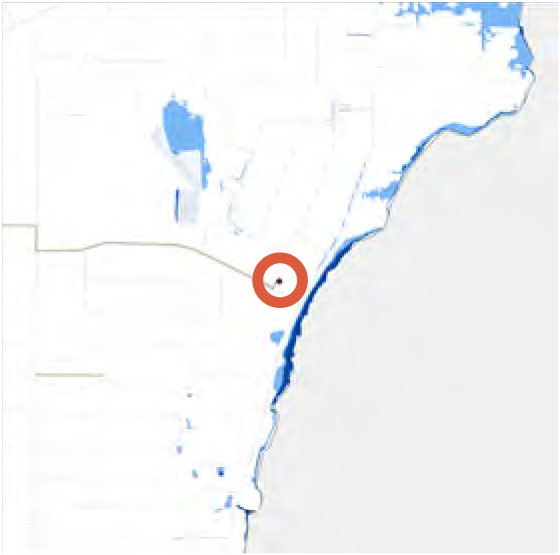
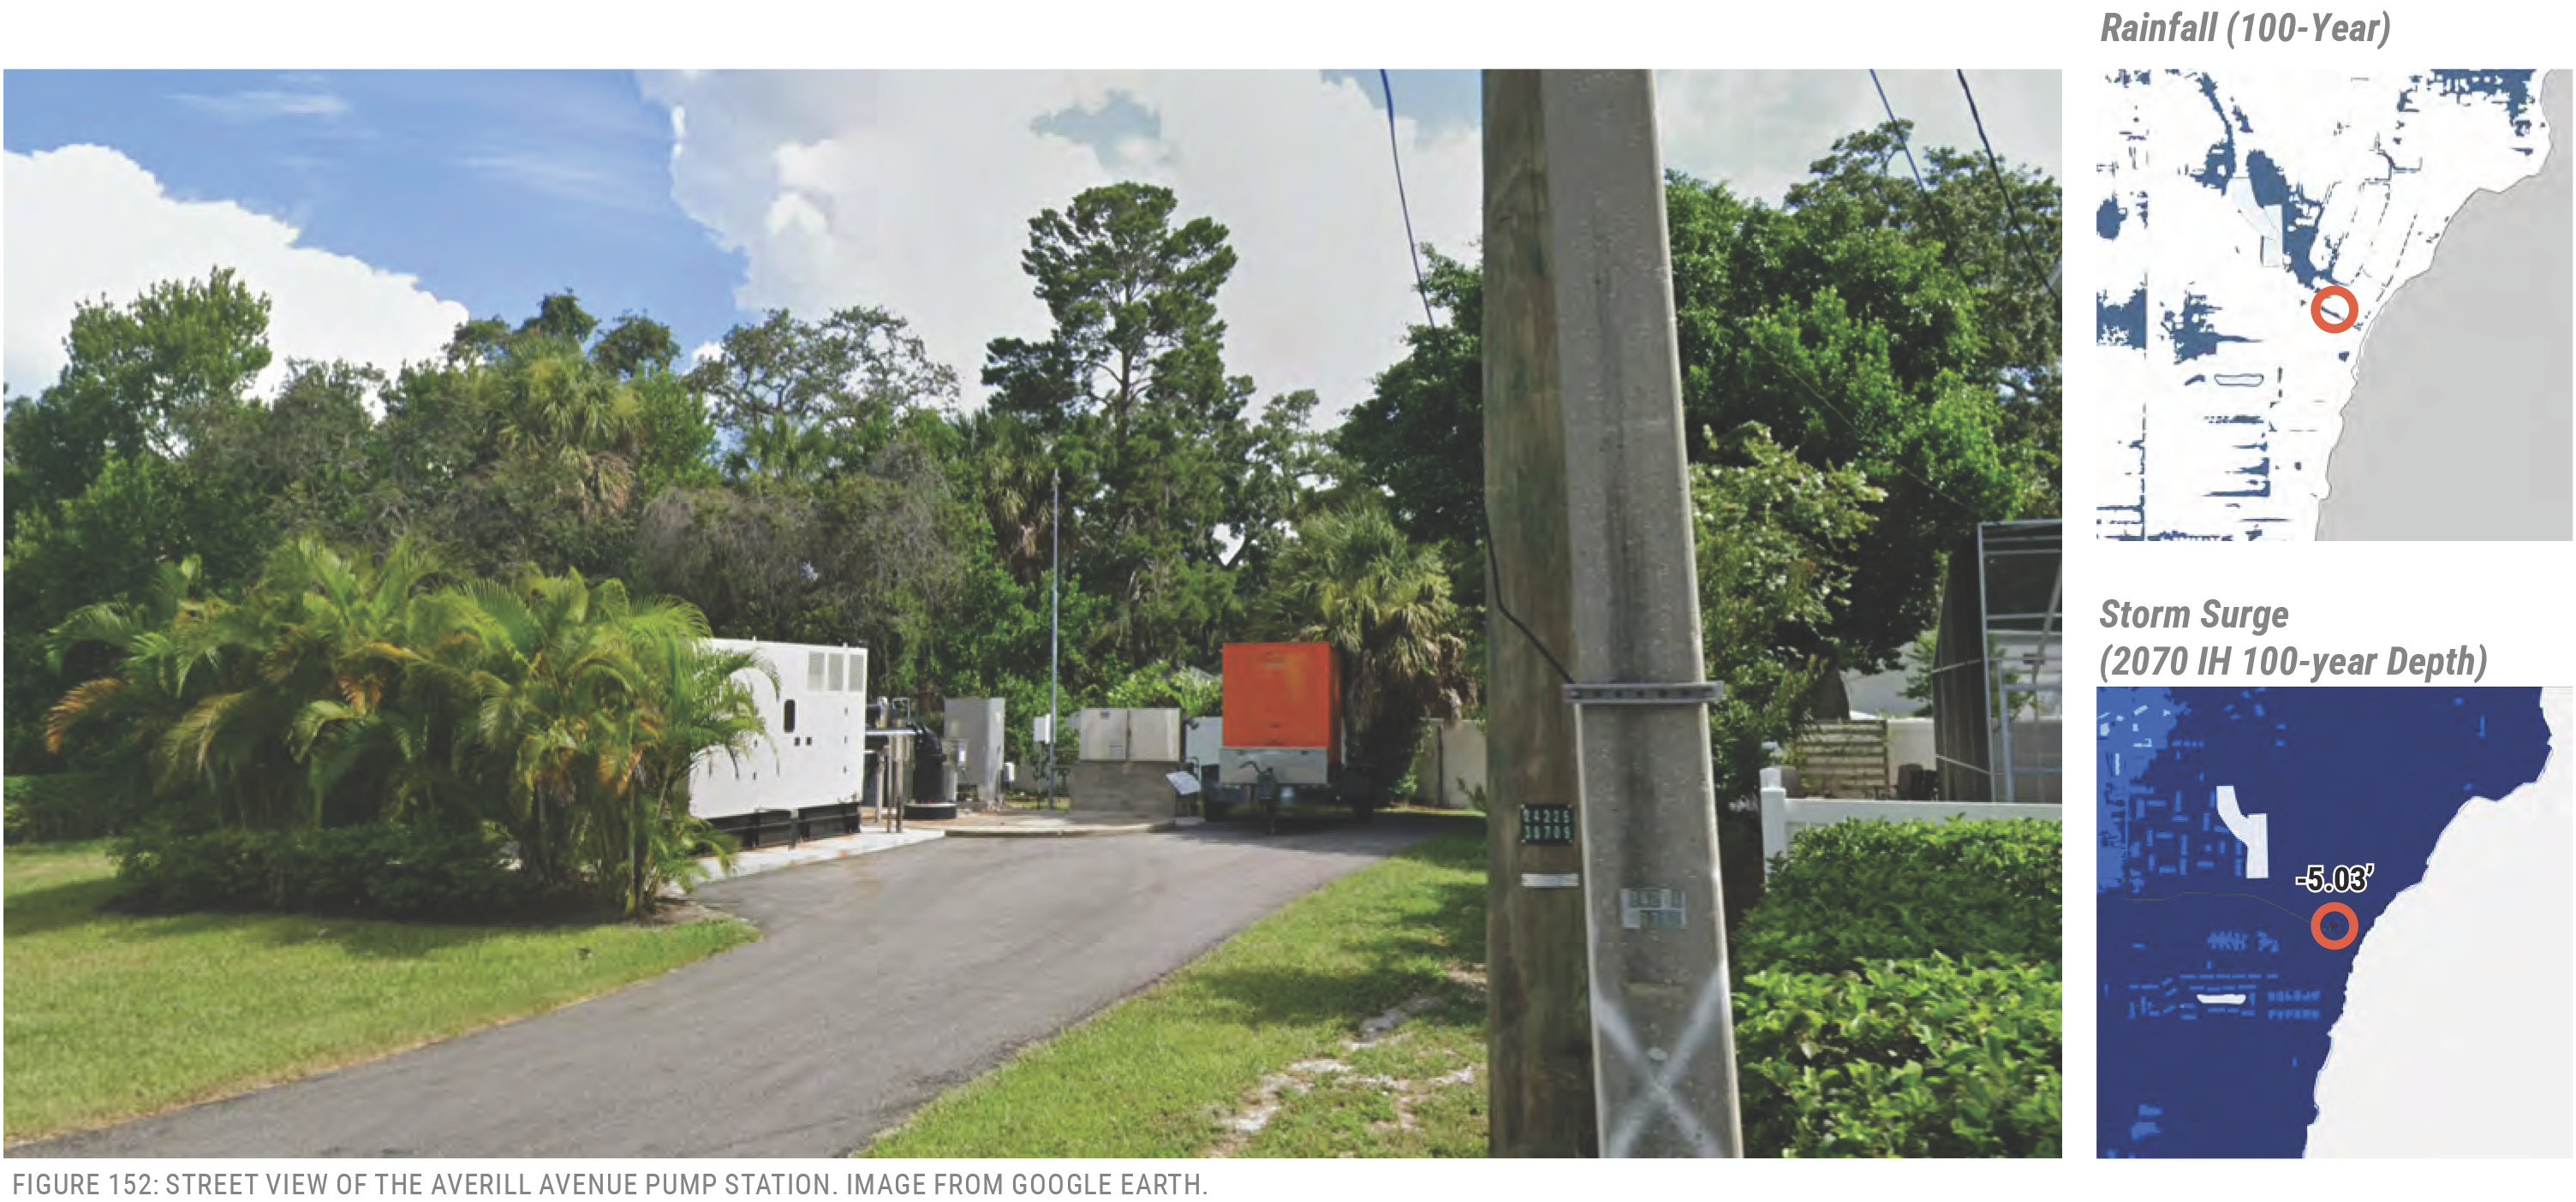
Pump Facility: Westshore Plaza
253 Westshore Boulevard
Size: 3,400 GPM
History: 1965, Rehab 1980, Replaced 2002
Vulnerabilities:
- Location
- Storm Surge
Rainfall (100-Year) -5.59’-5.59’ Storm Surge (2070 IH 100-year Depth)
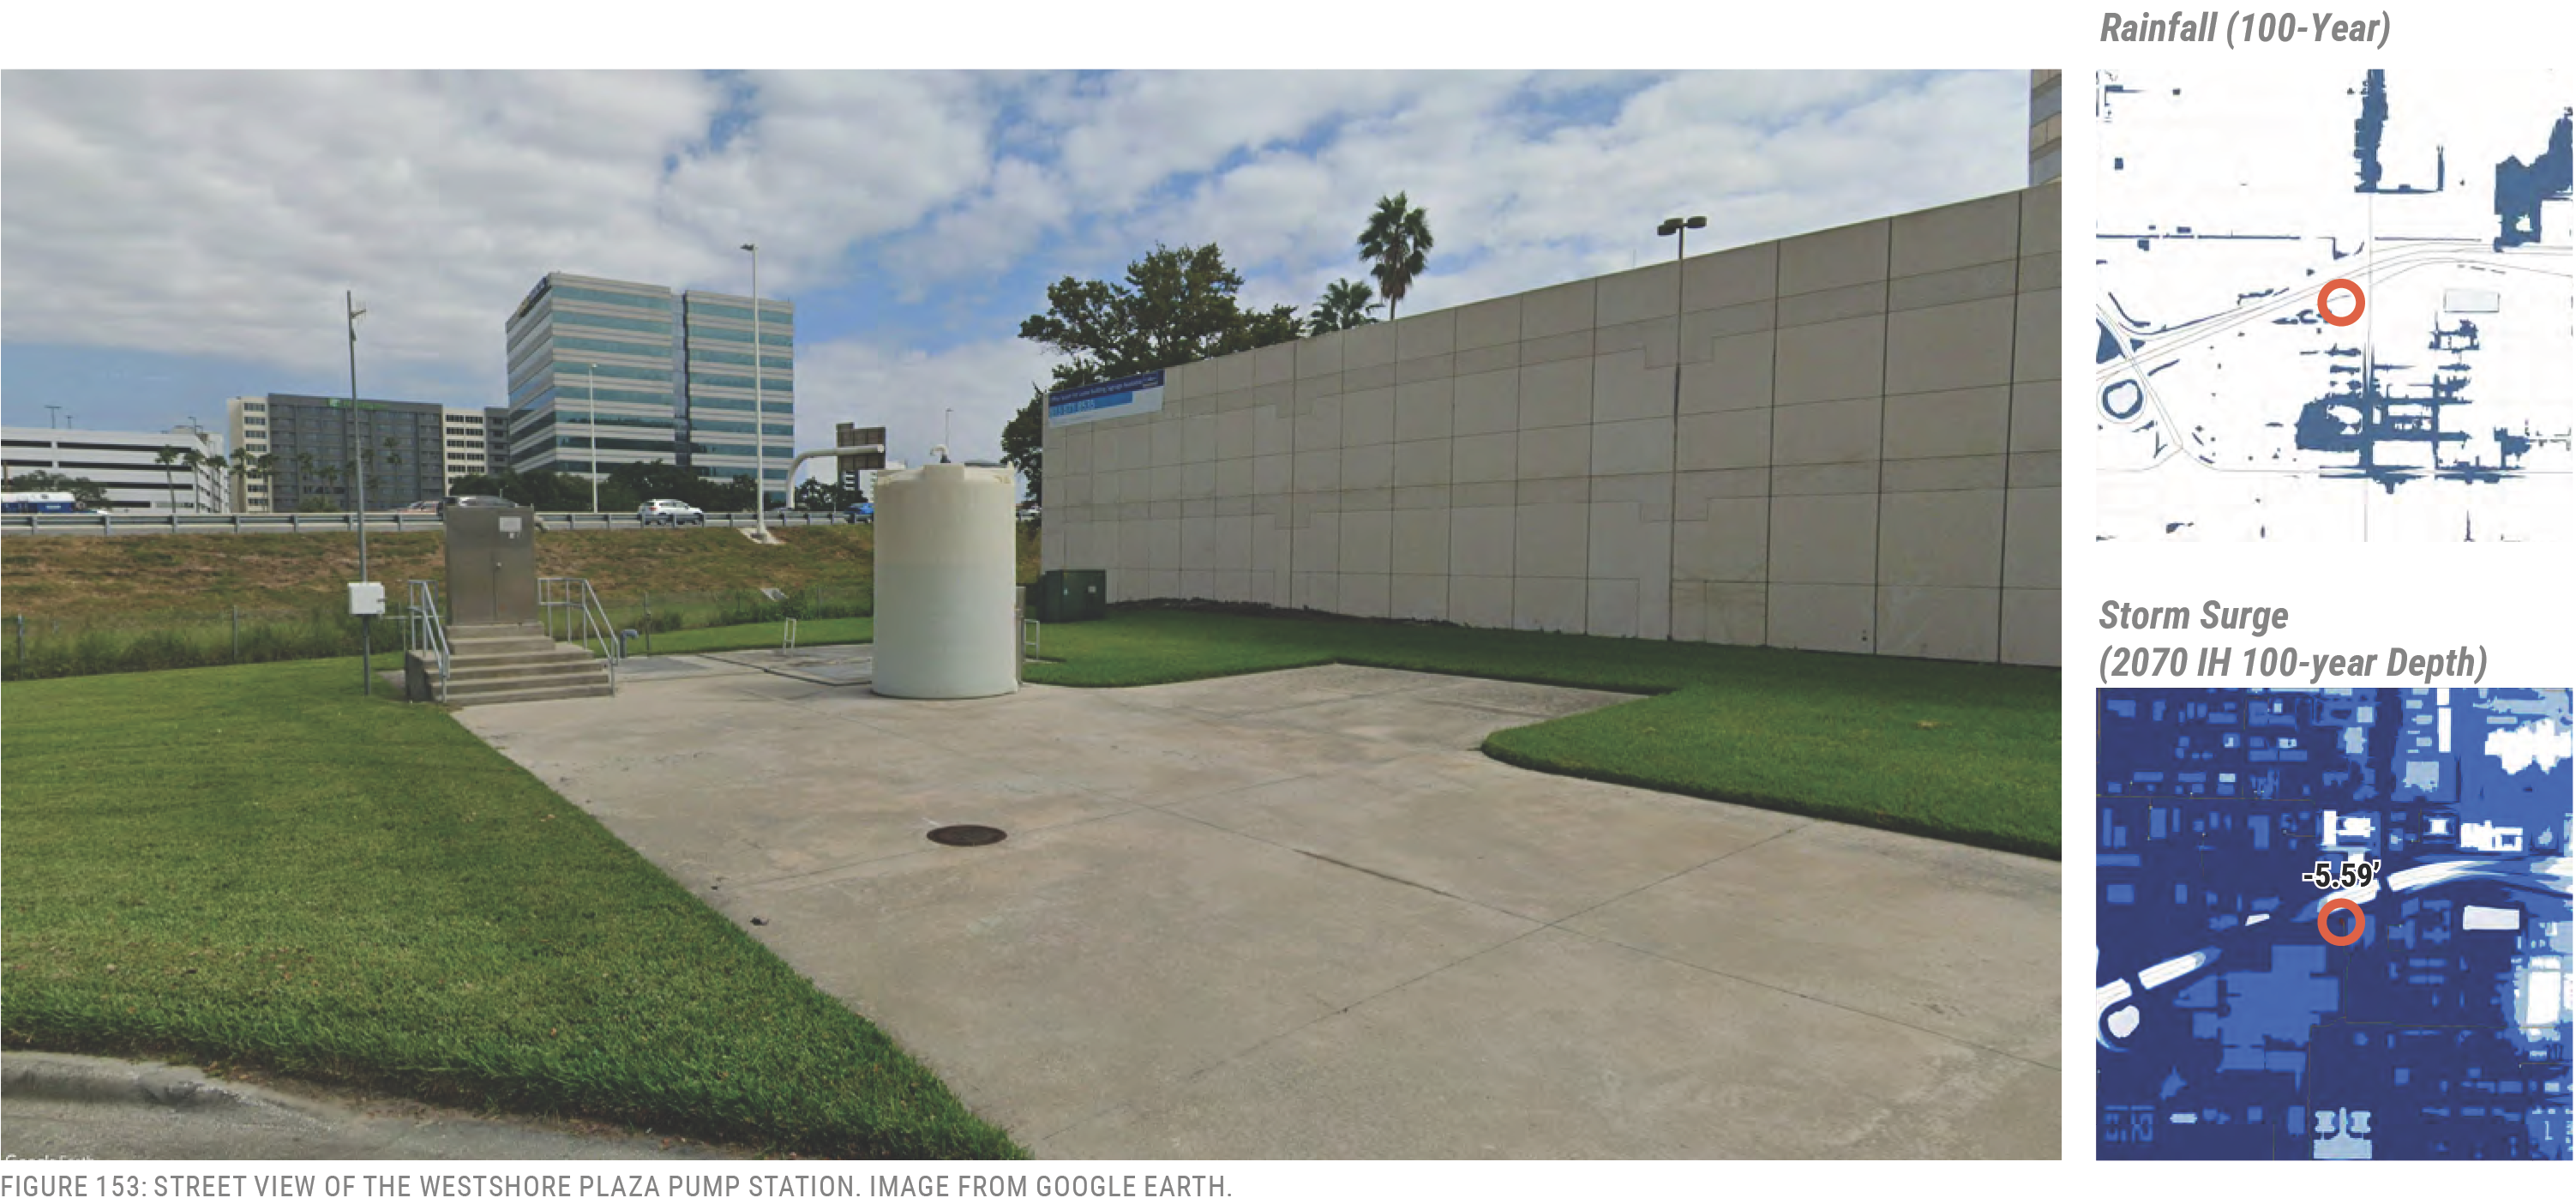
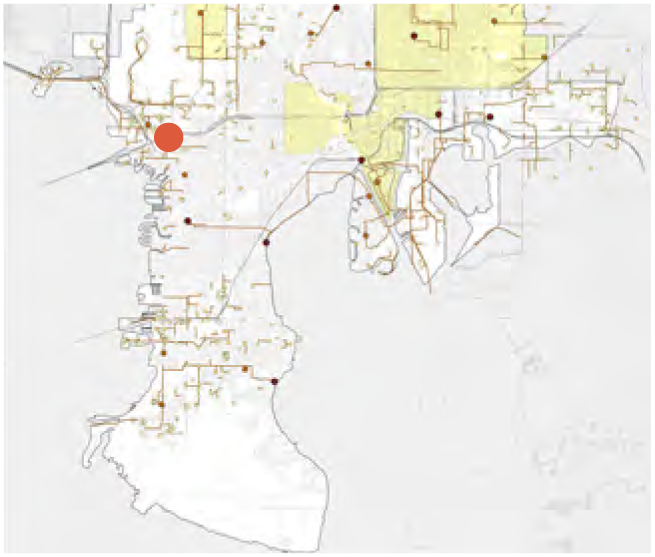
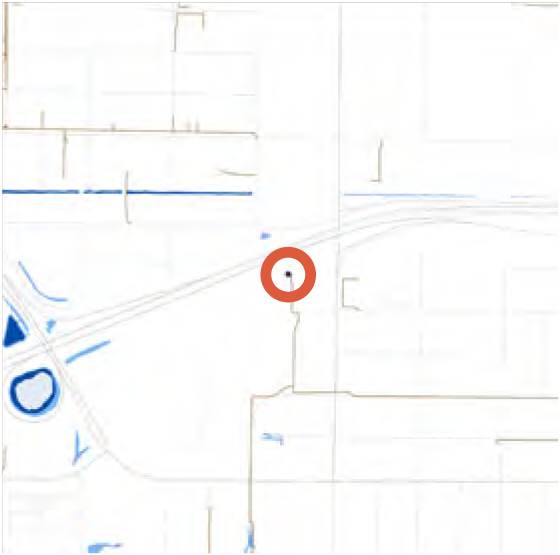
Pump Facility: Hanna
1501 West Hanna Avenue
Size: 3,000 GPM
History: 1962, Rehab 1983, 1998
Vulnerabilities:
- Sea Level Rise
- Storm Surge
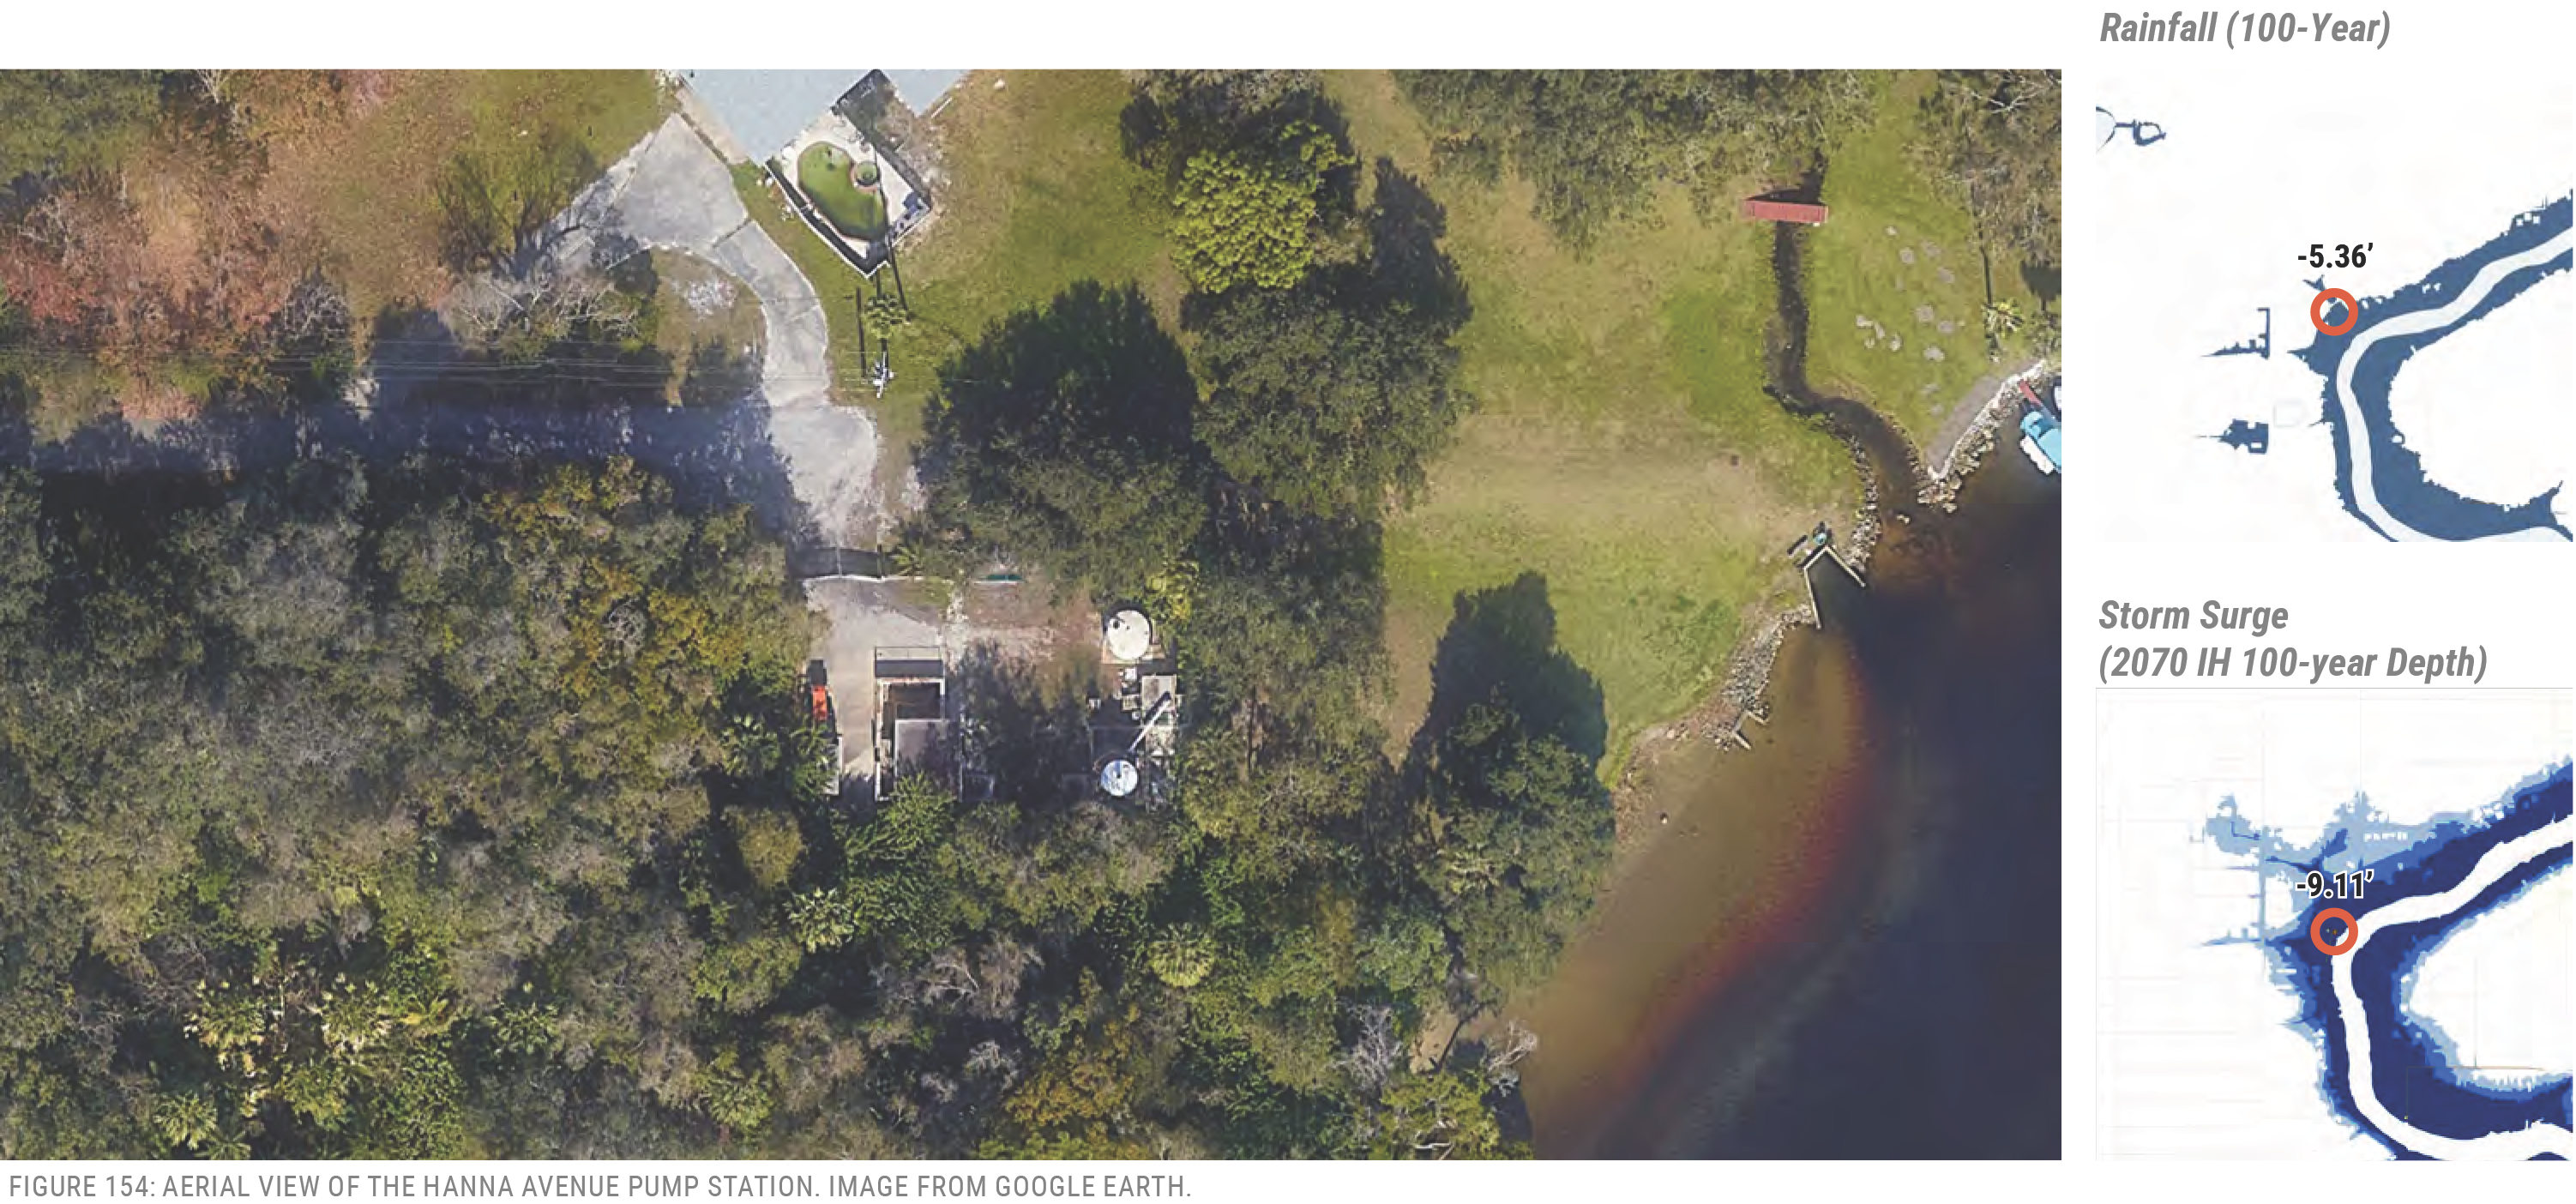
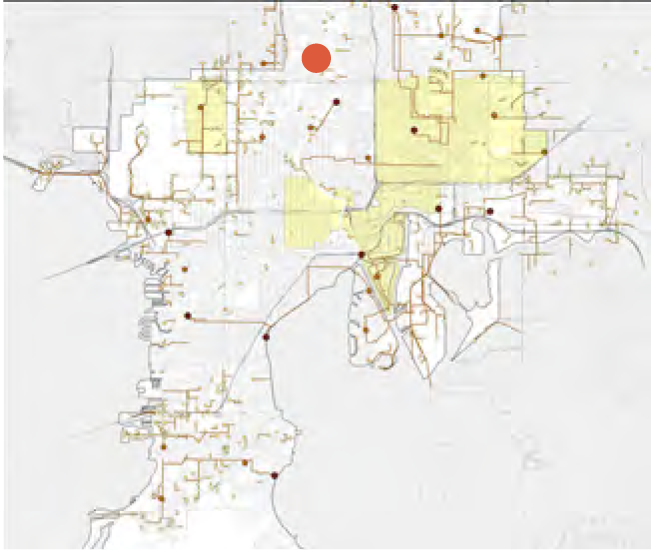
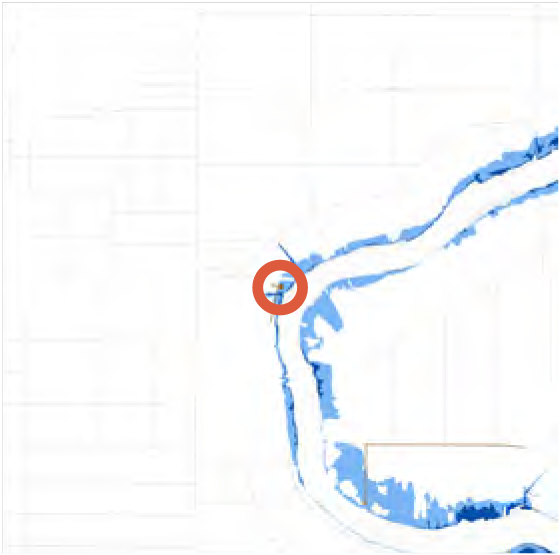
Pump Facility: O’Brien
1102 North O’Brien Street
Size: 2,600 GPM
History: 1987
Vulnerabilities:
- Storm Surge
Location
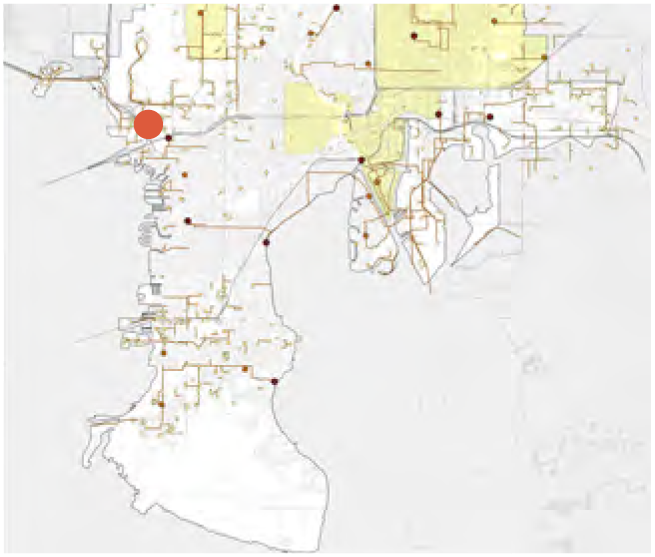
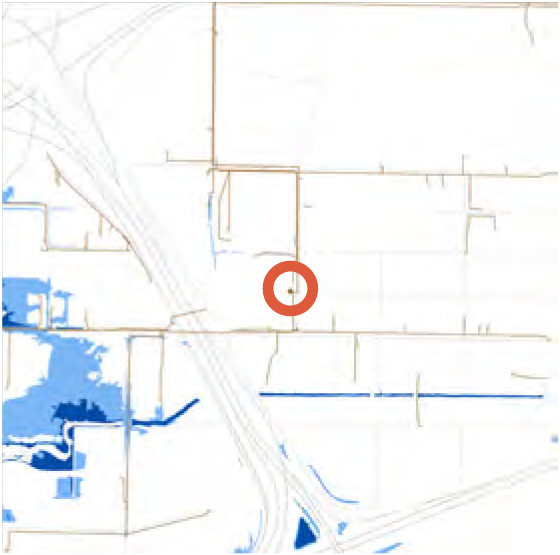
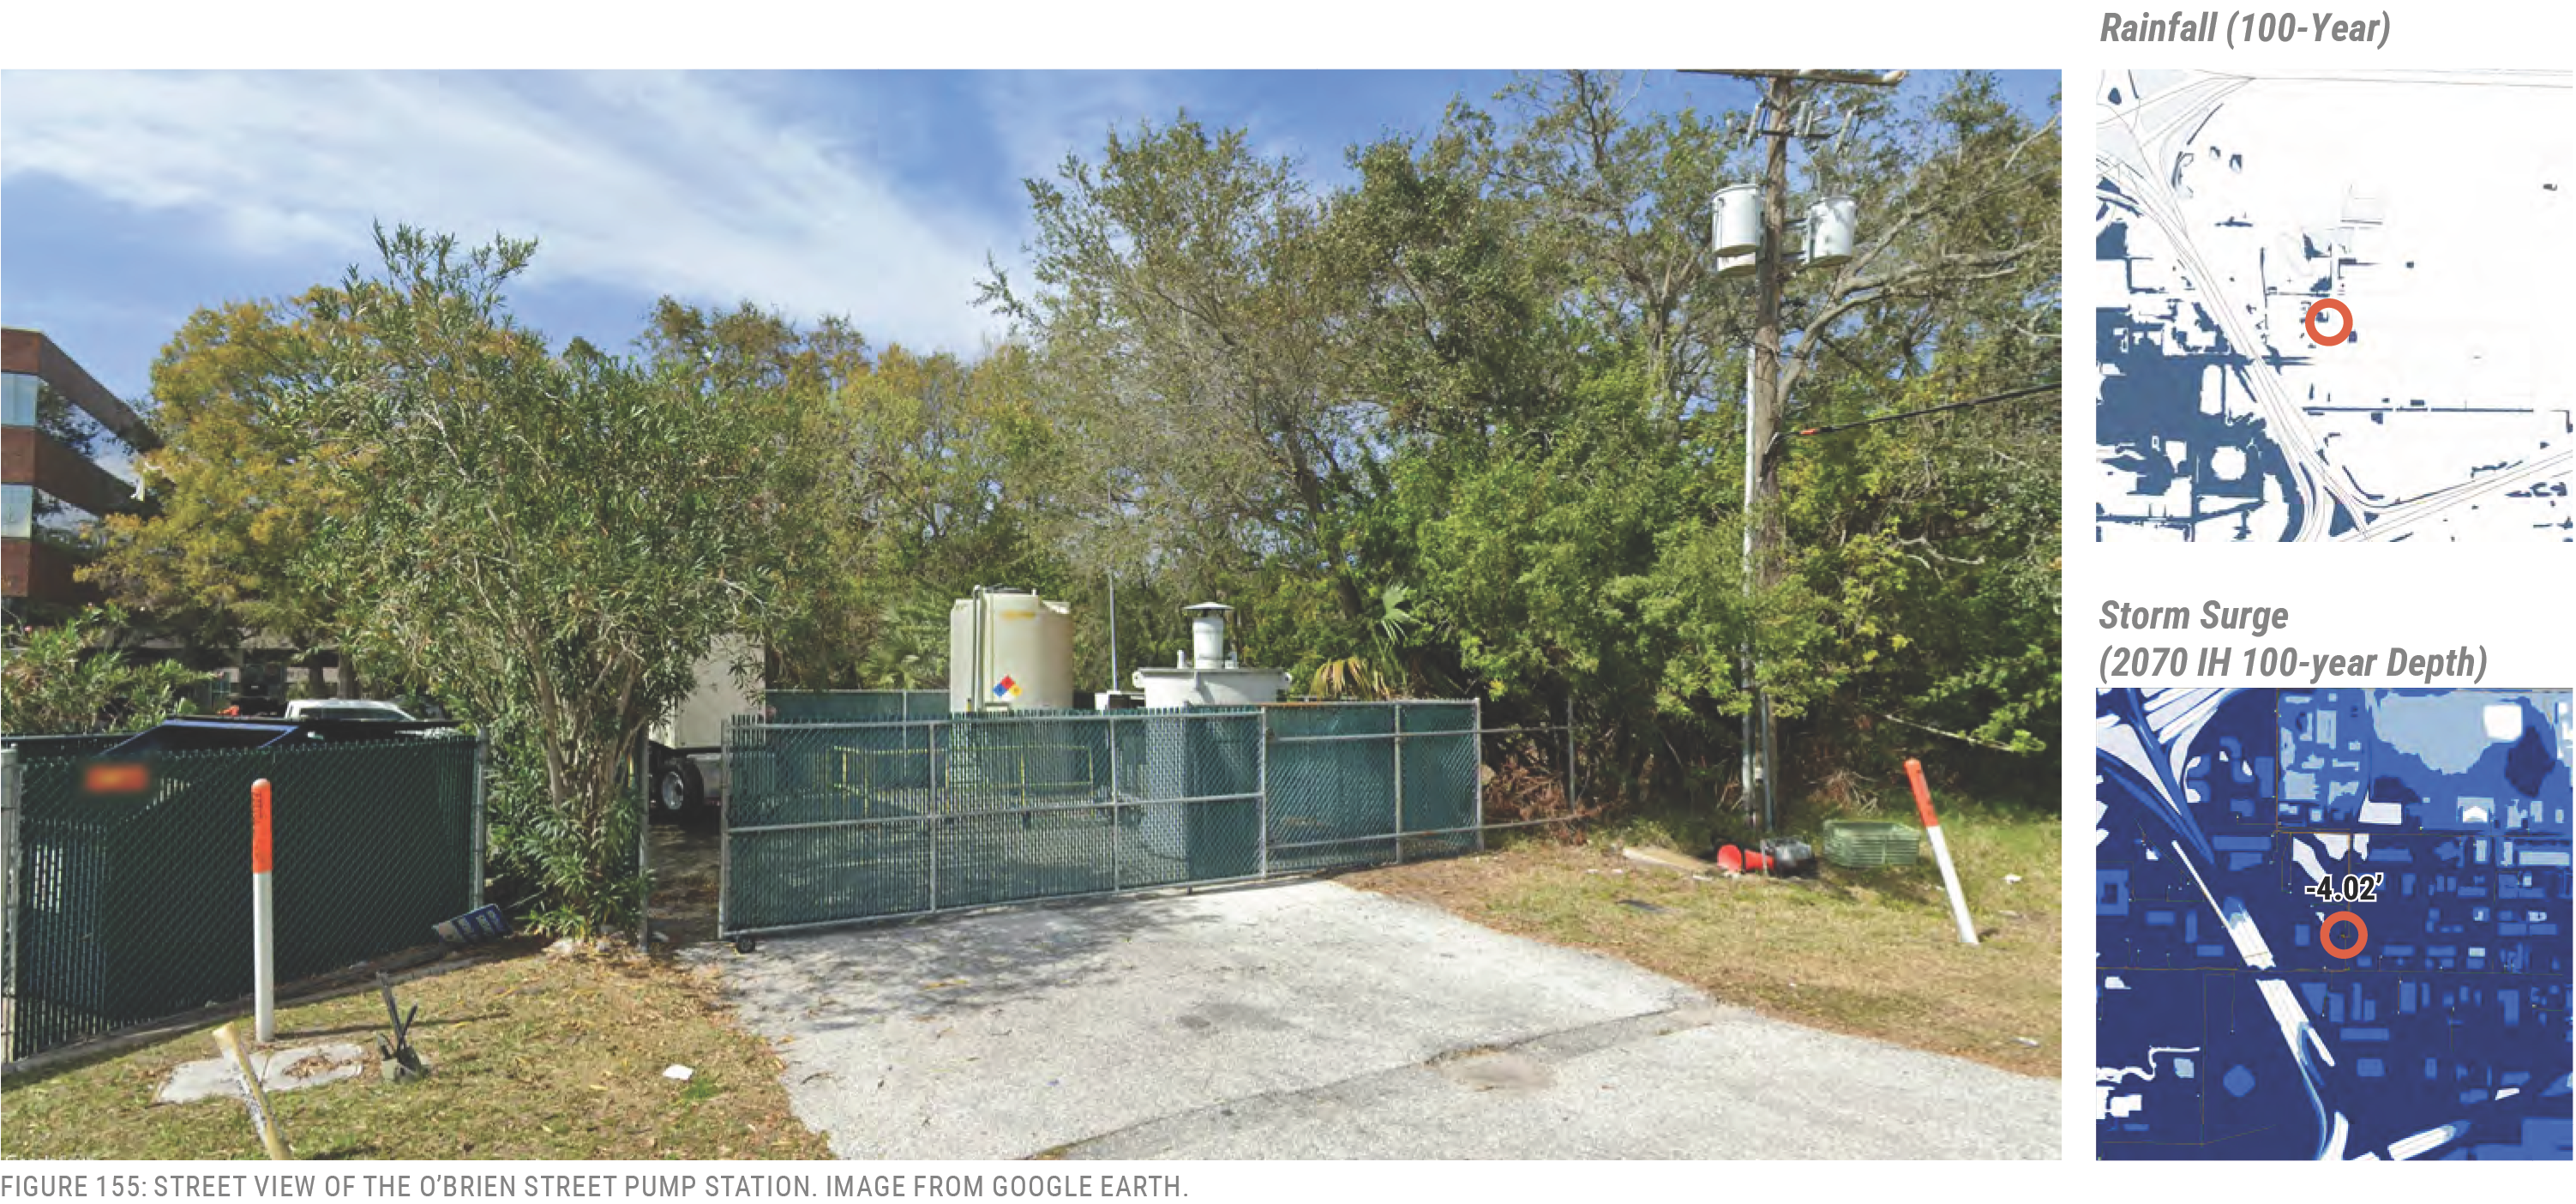
Pump Facility: Prescott
4806 West Prescott Street
Size: 2,100 GPM
History: 1963, Rehab 2002
Vulnerabilities:
- Storm Surge
- Potential Sea Level Rise
Location
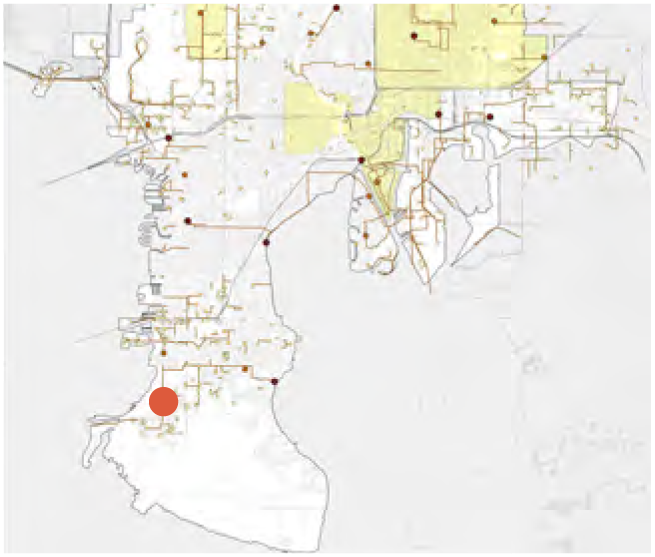
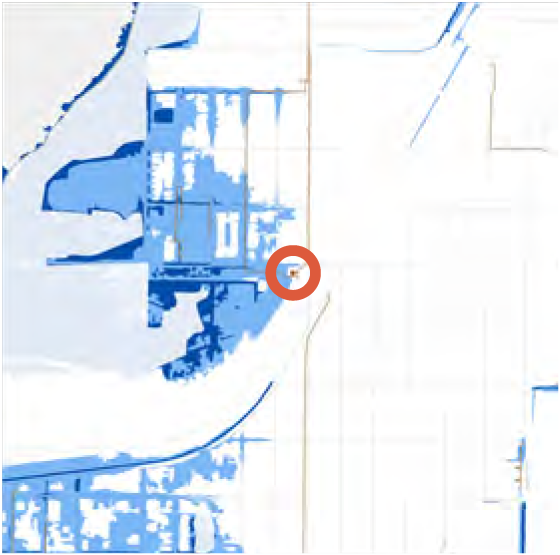
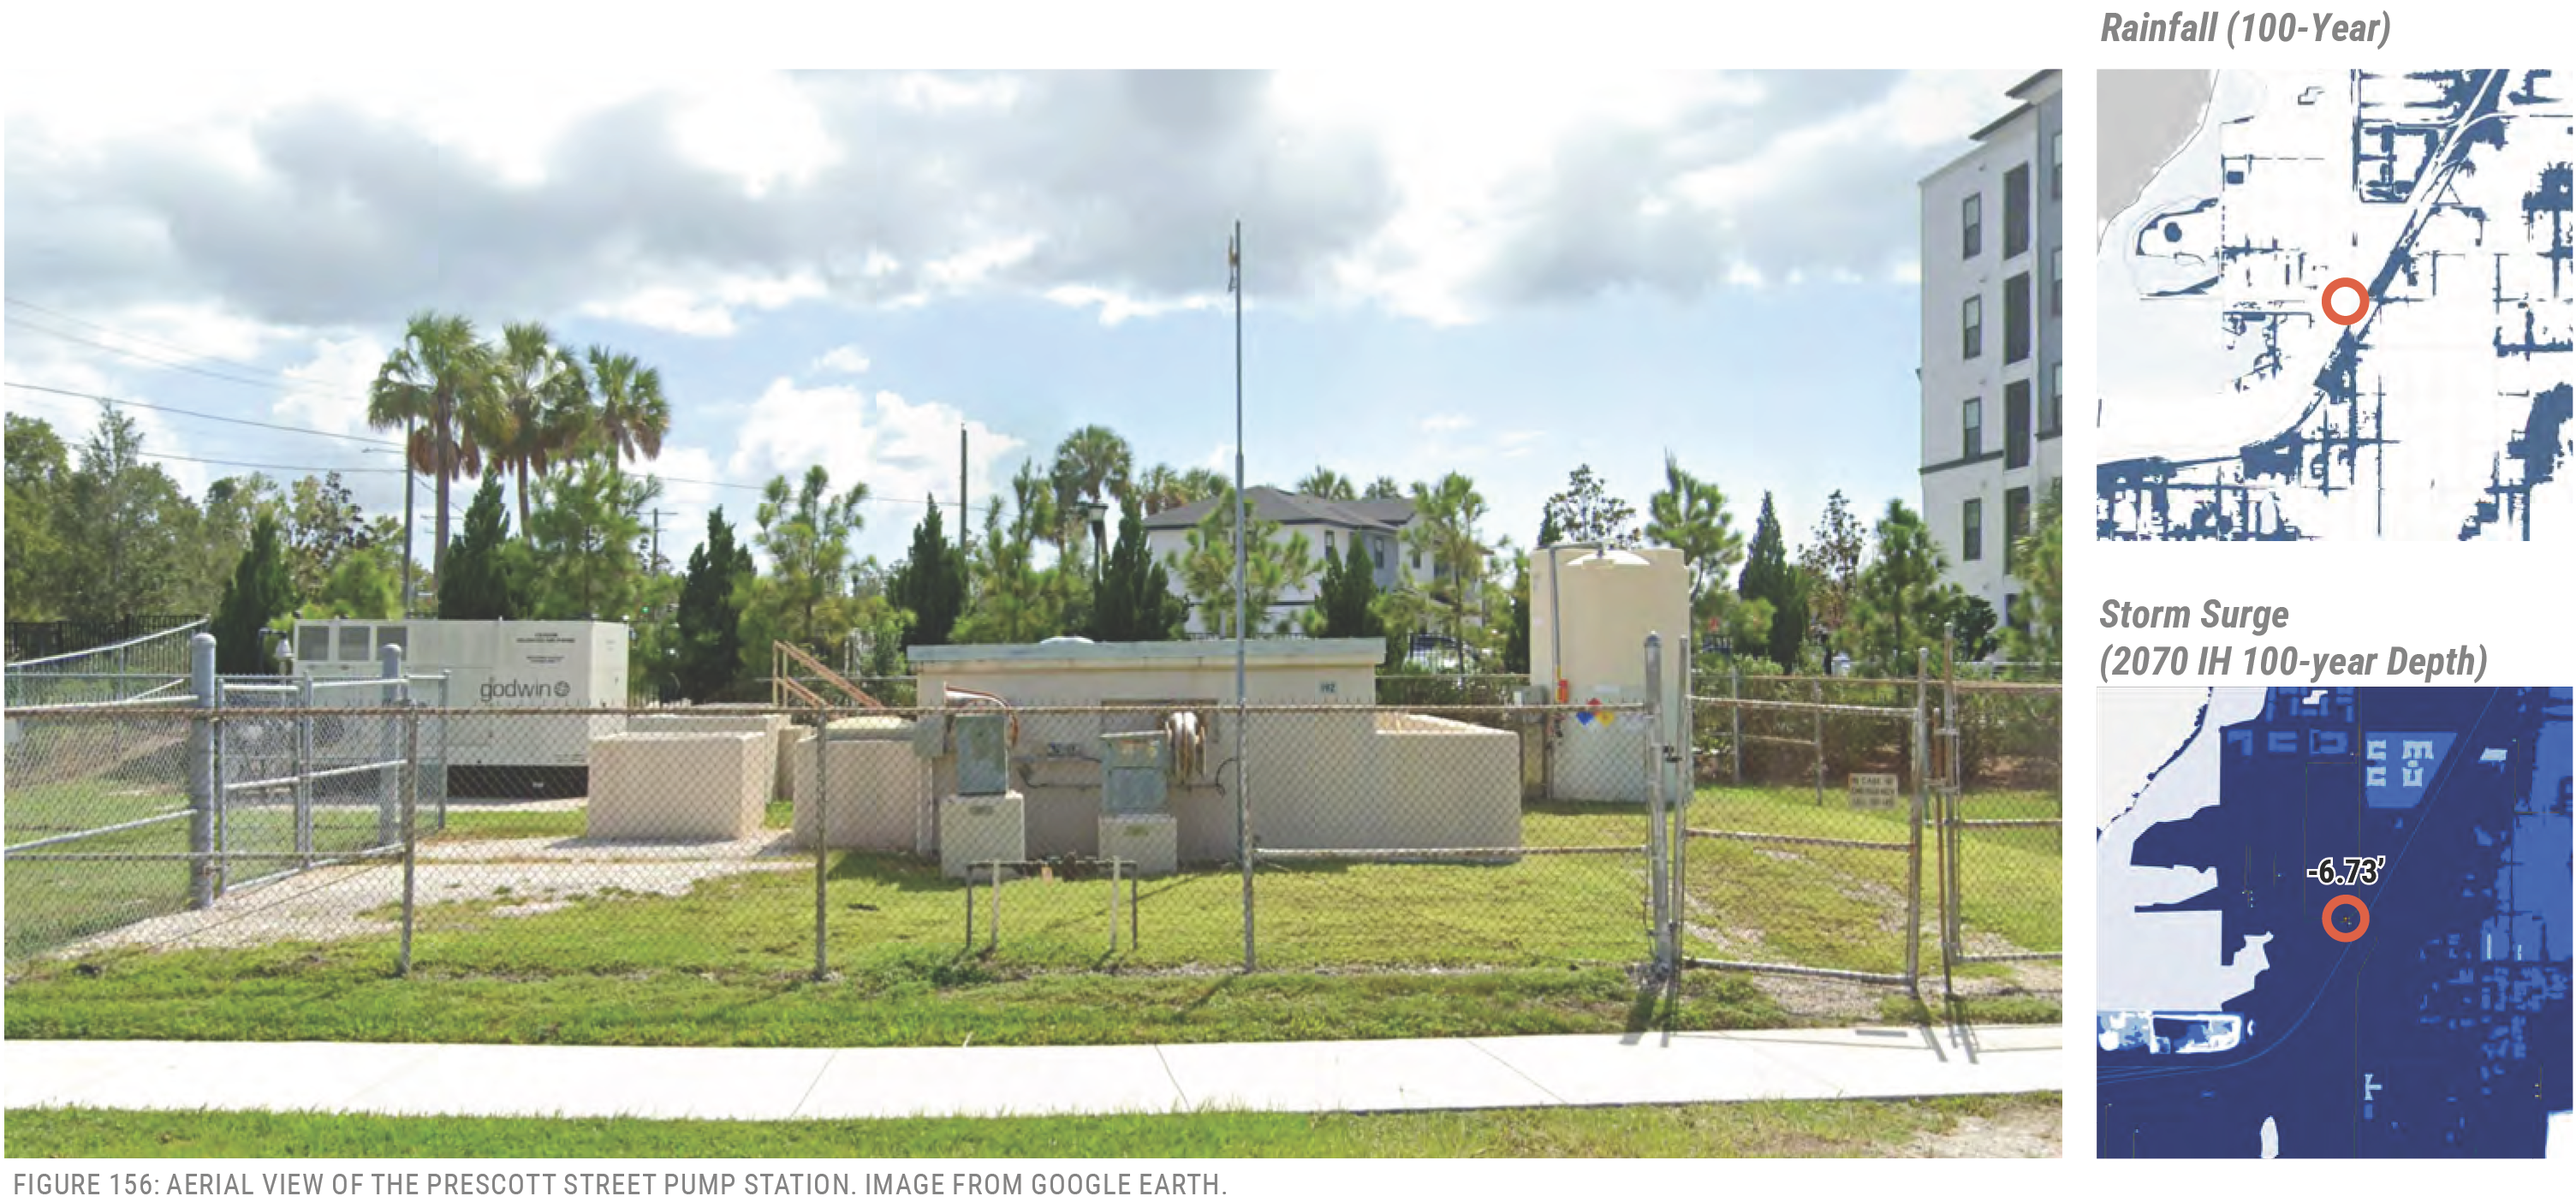
Pump Facility: Harbour Island
905 South Harbour Island Boulevard
Size: 1,529 GPM
History: 1985
Vulnerabilities:
- Storm Surge
Location
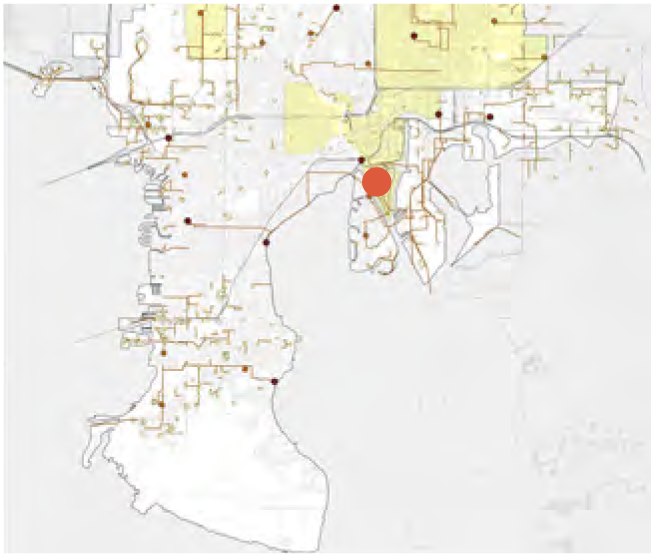
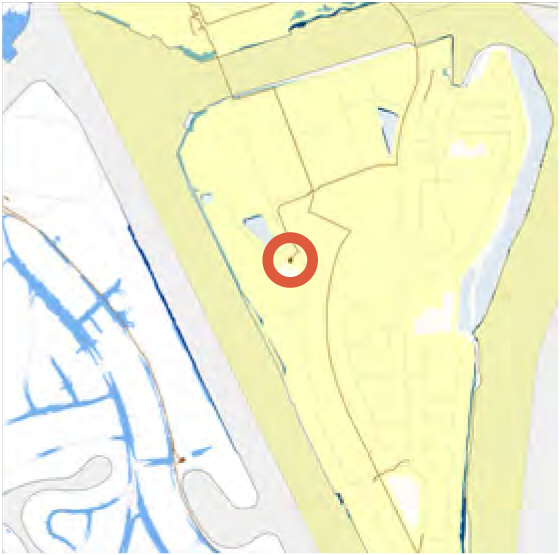
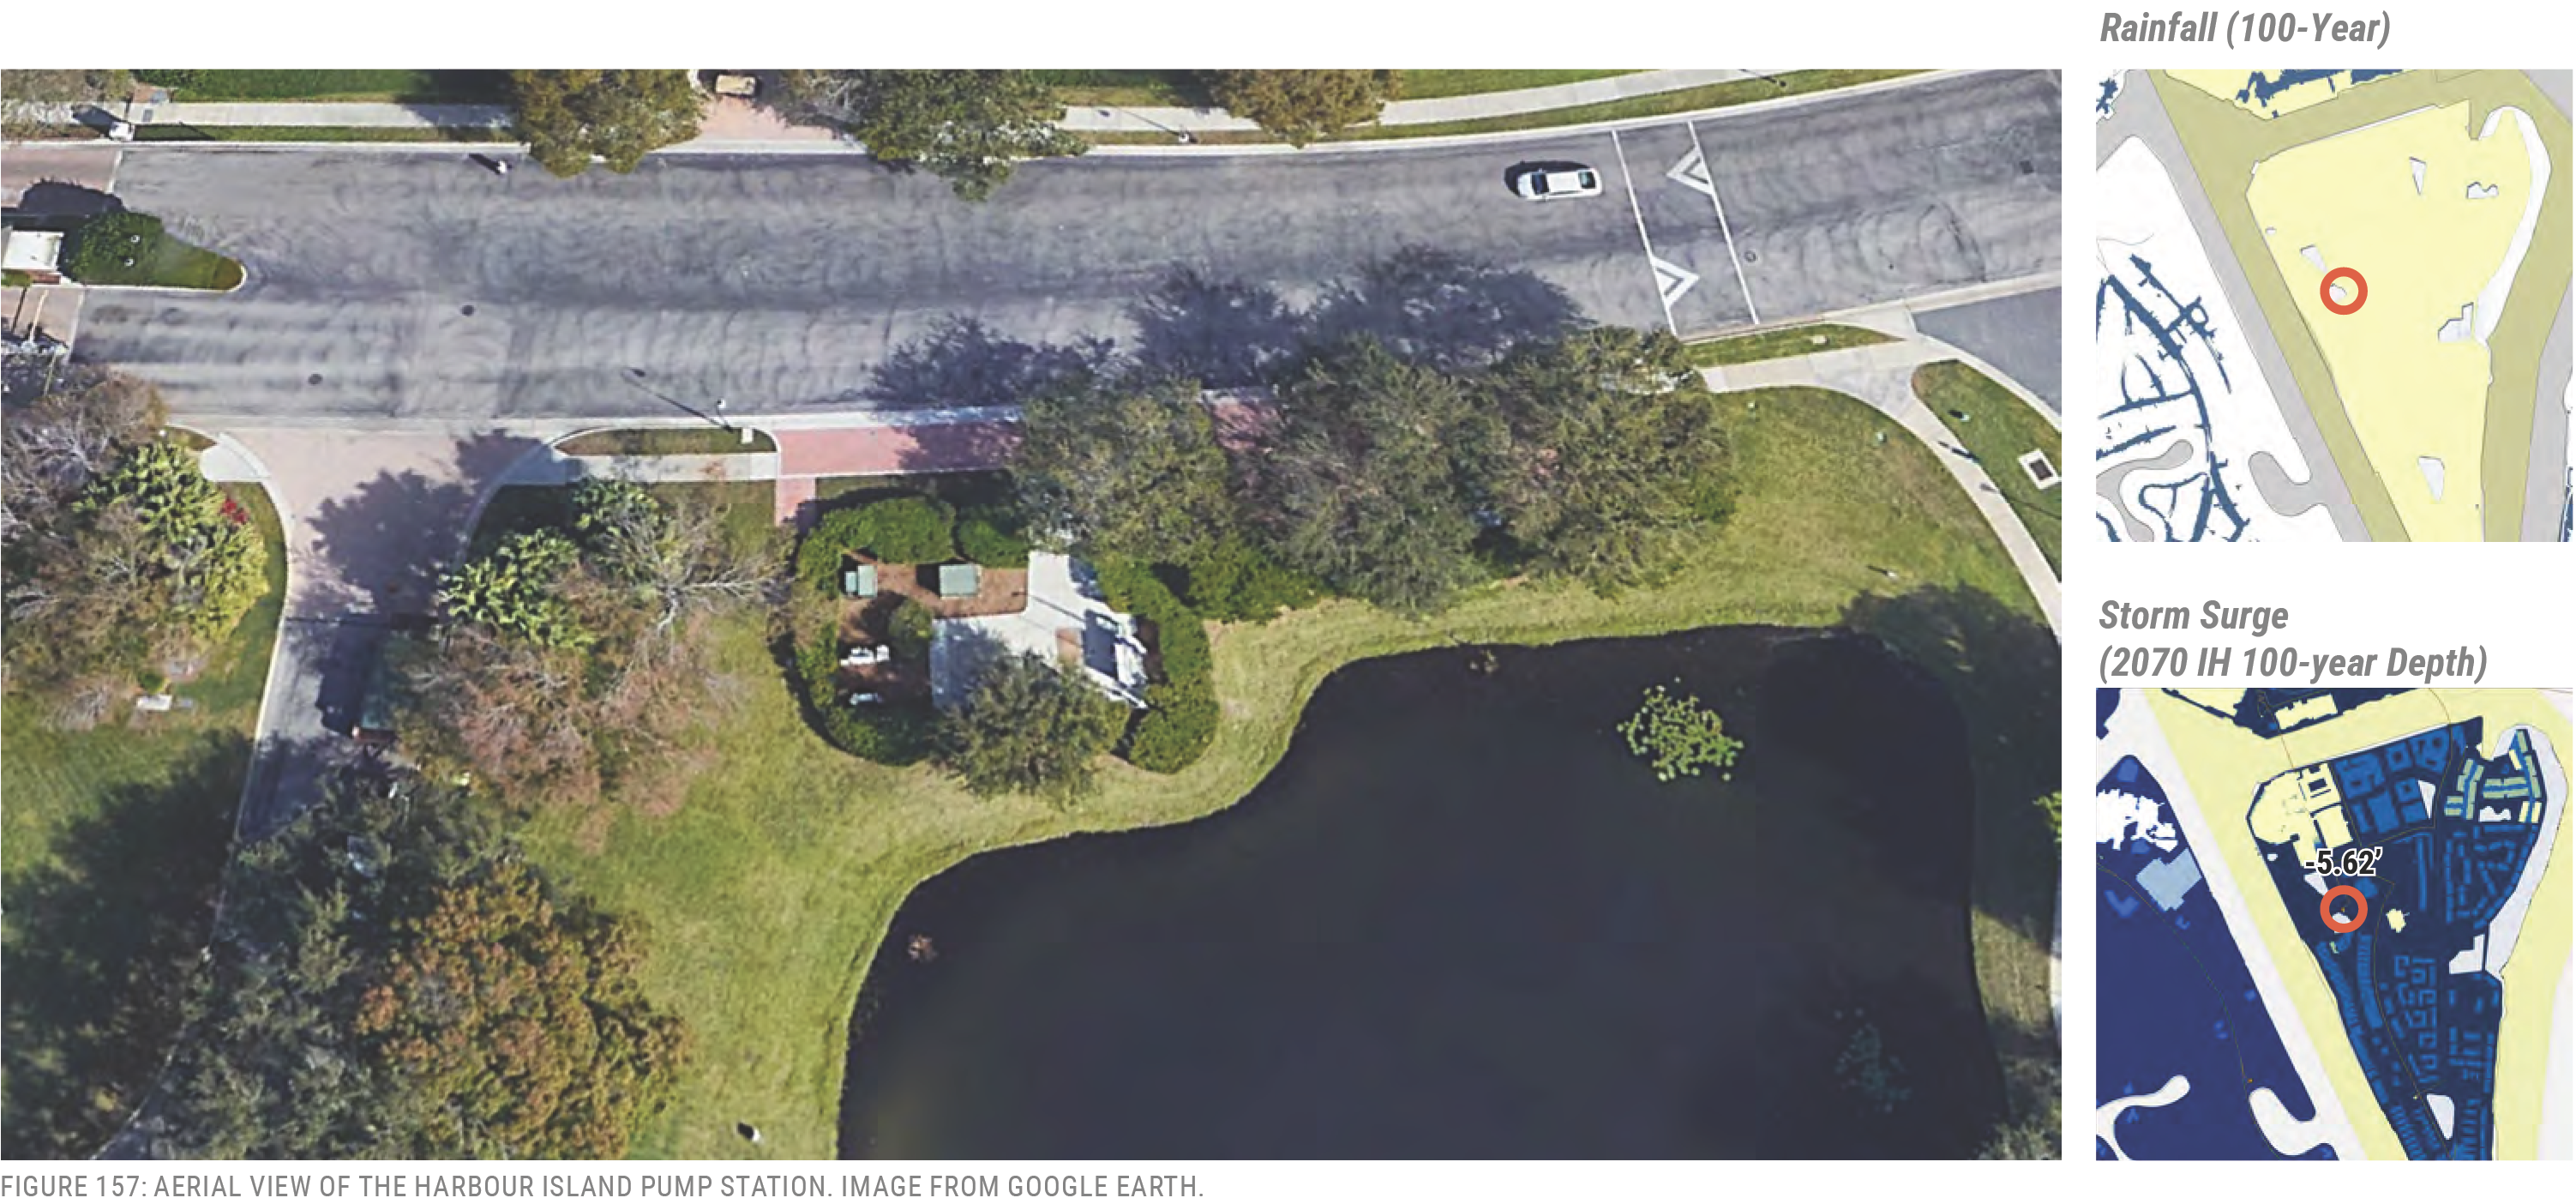
Pump Facility: Swann
4401 West Swann Avenue
Size: 1,500 GPM
History: 1955, Rehab 1980
Vulnerabilities:
- Storm Surge
Location
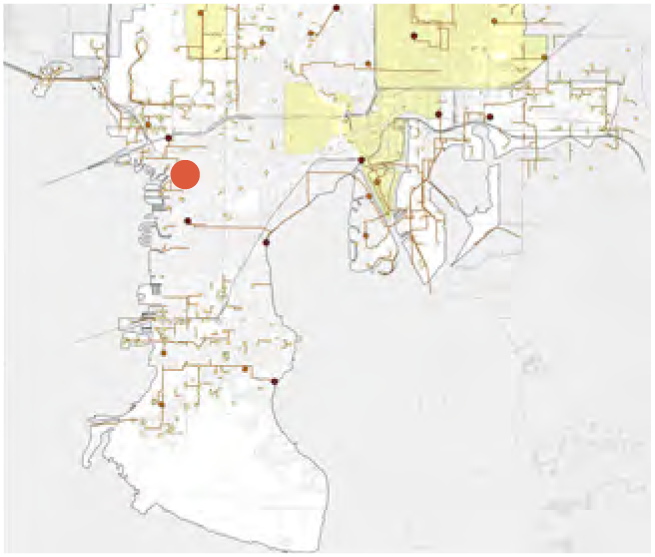
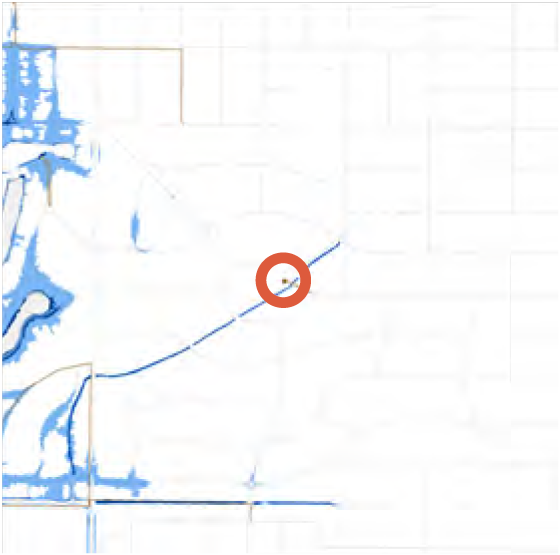
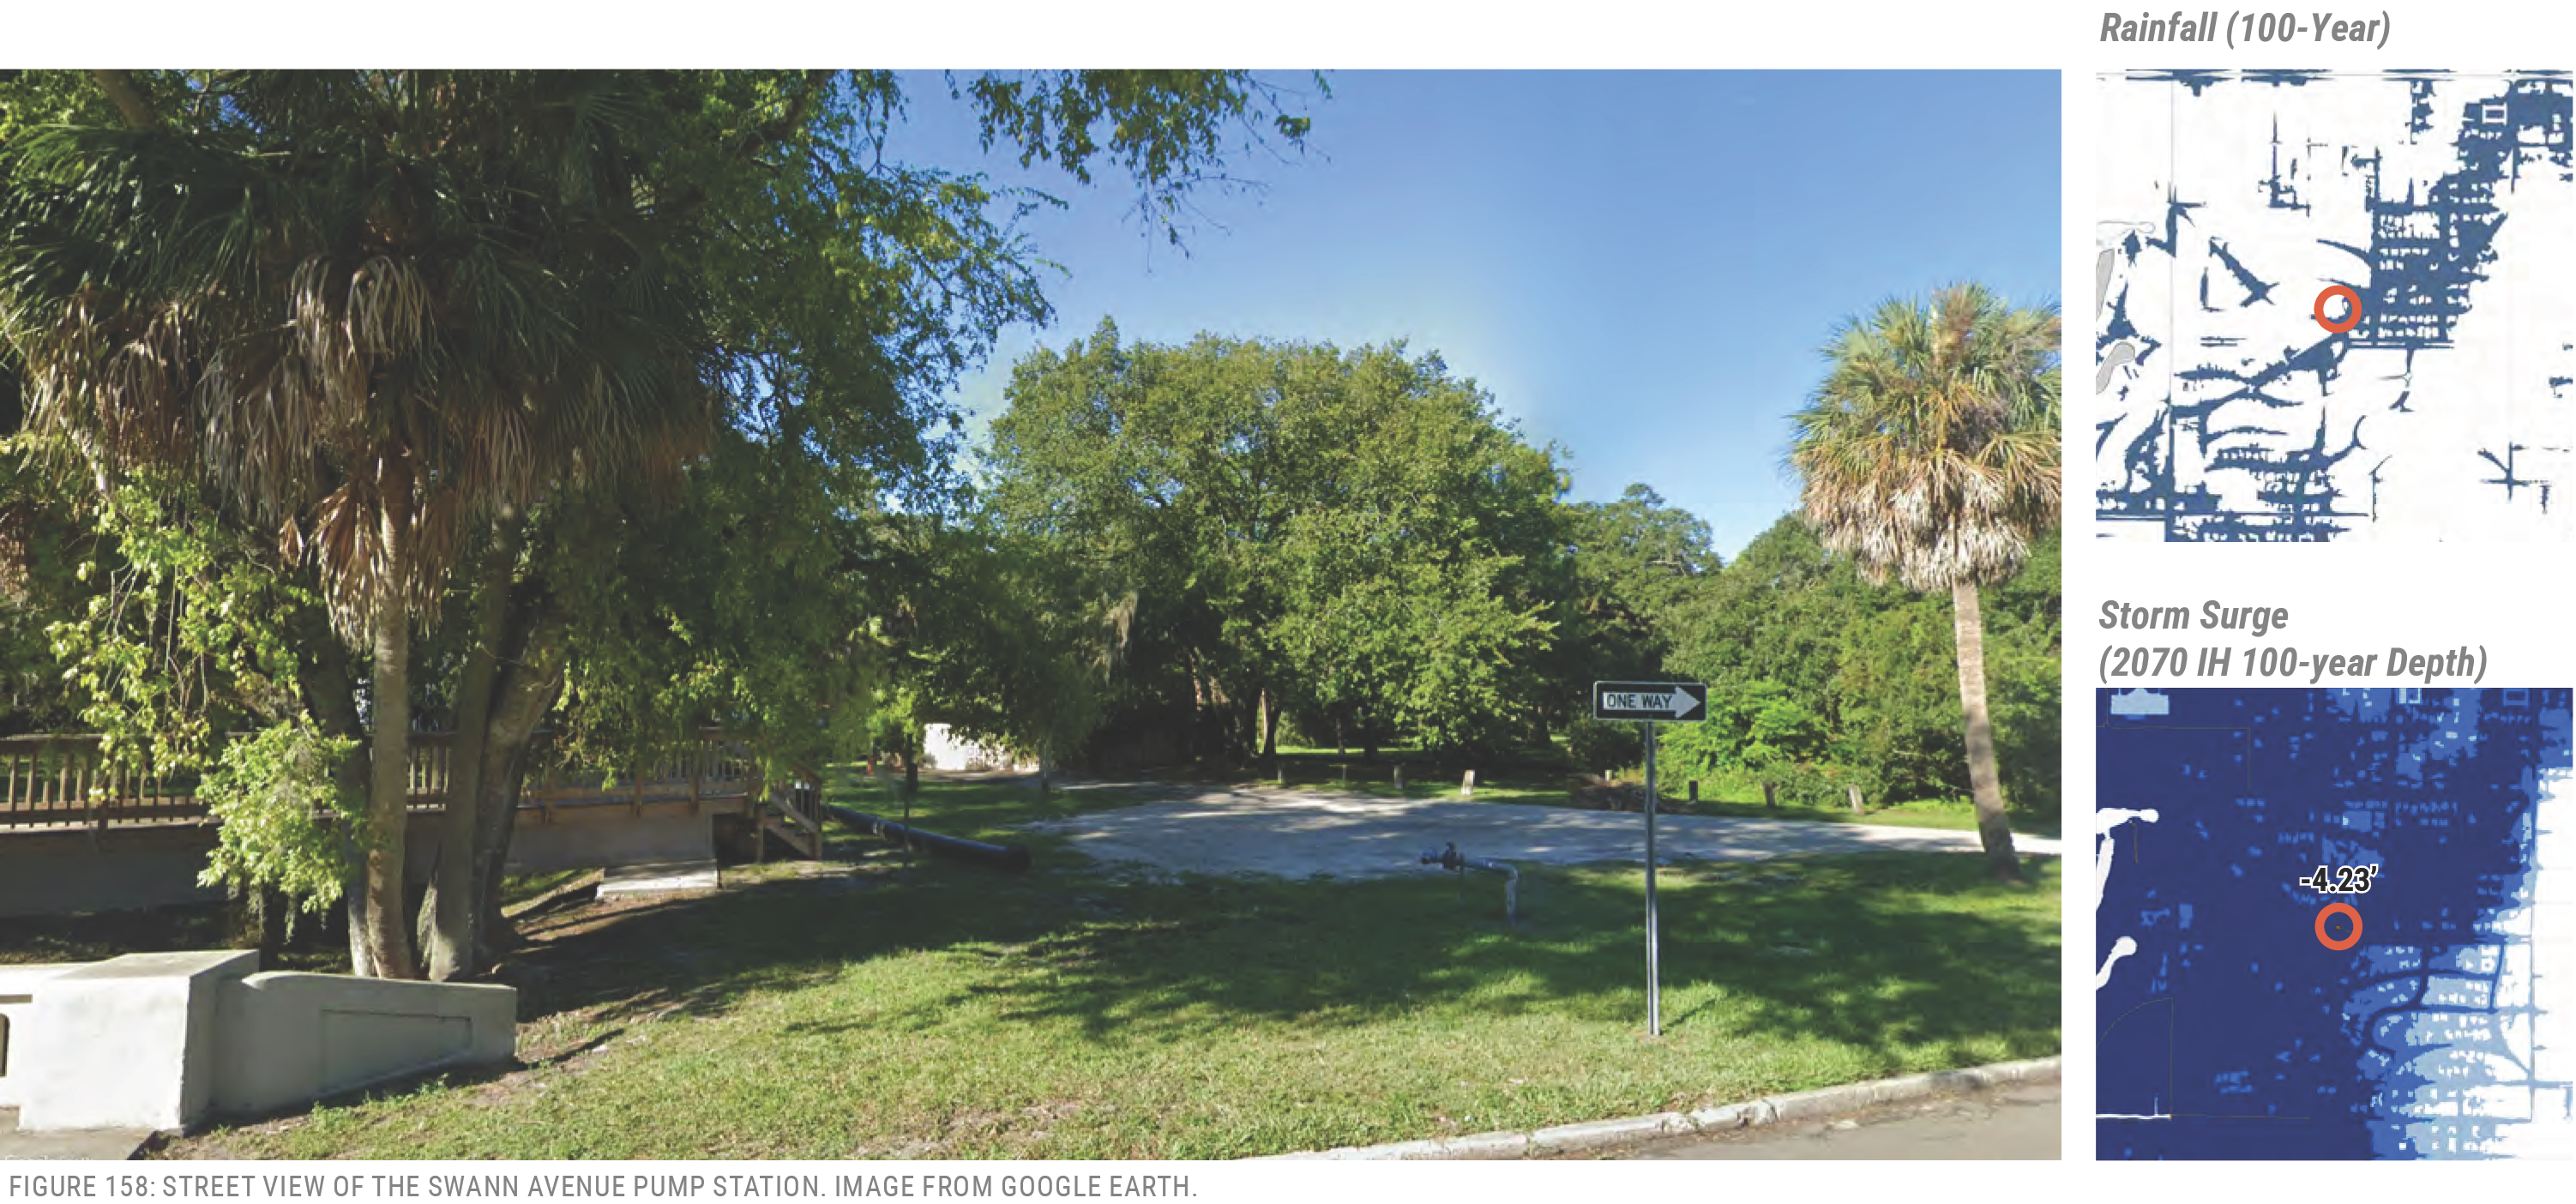
Pump Facility: Trilby
4736 West Trilby Avenue
Size: 1,425 GPM
History: 1954, Rehab 1963, 1999
Vulnerabilities:
- Rainfall
- Storm Surge
Location
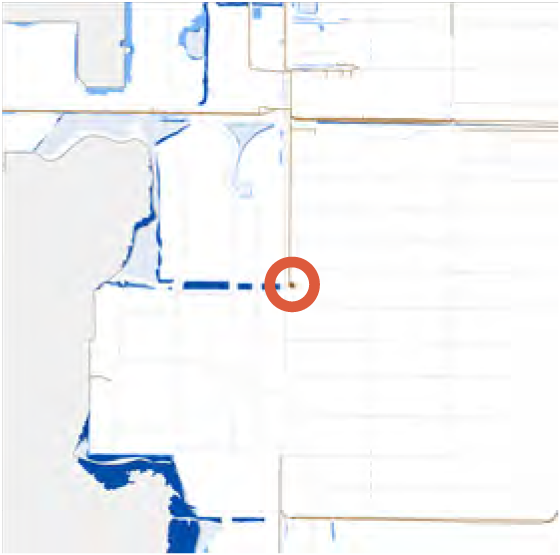
Rainfall (100-Year)
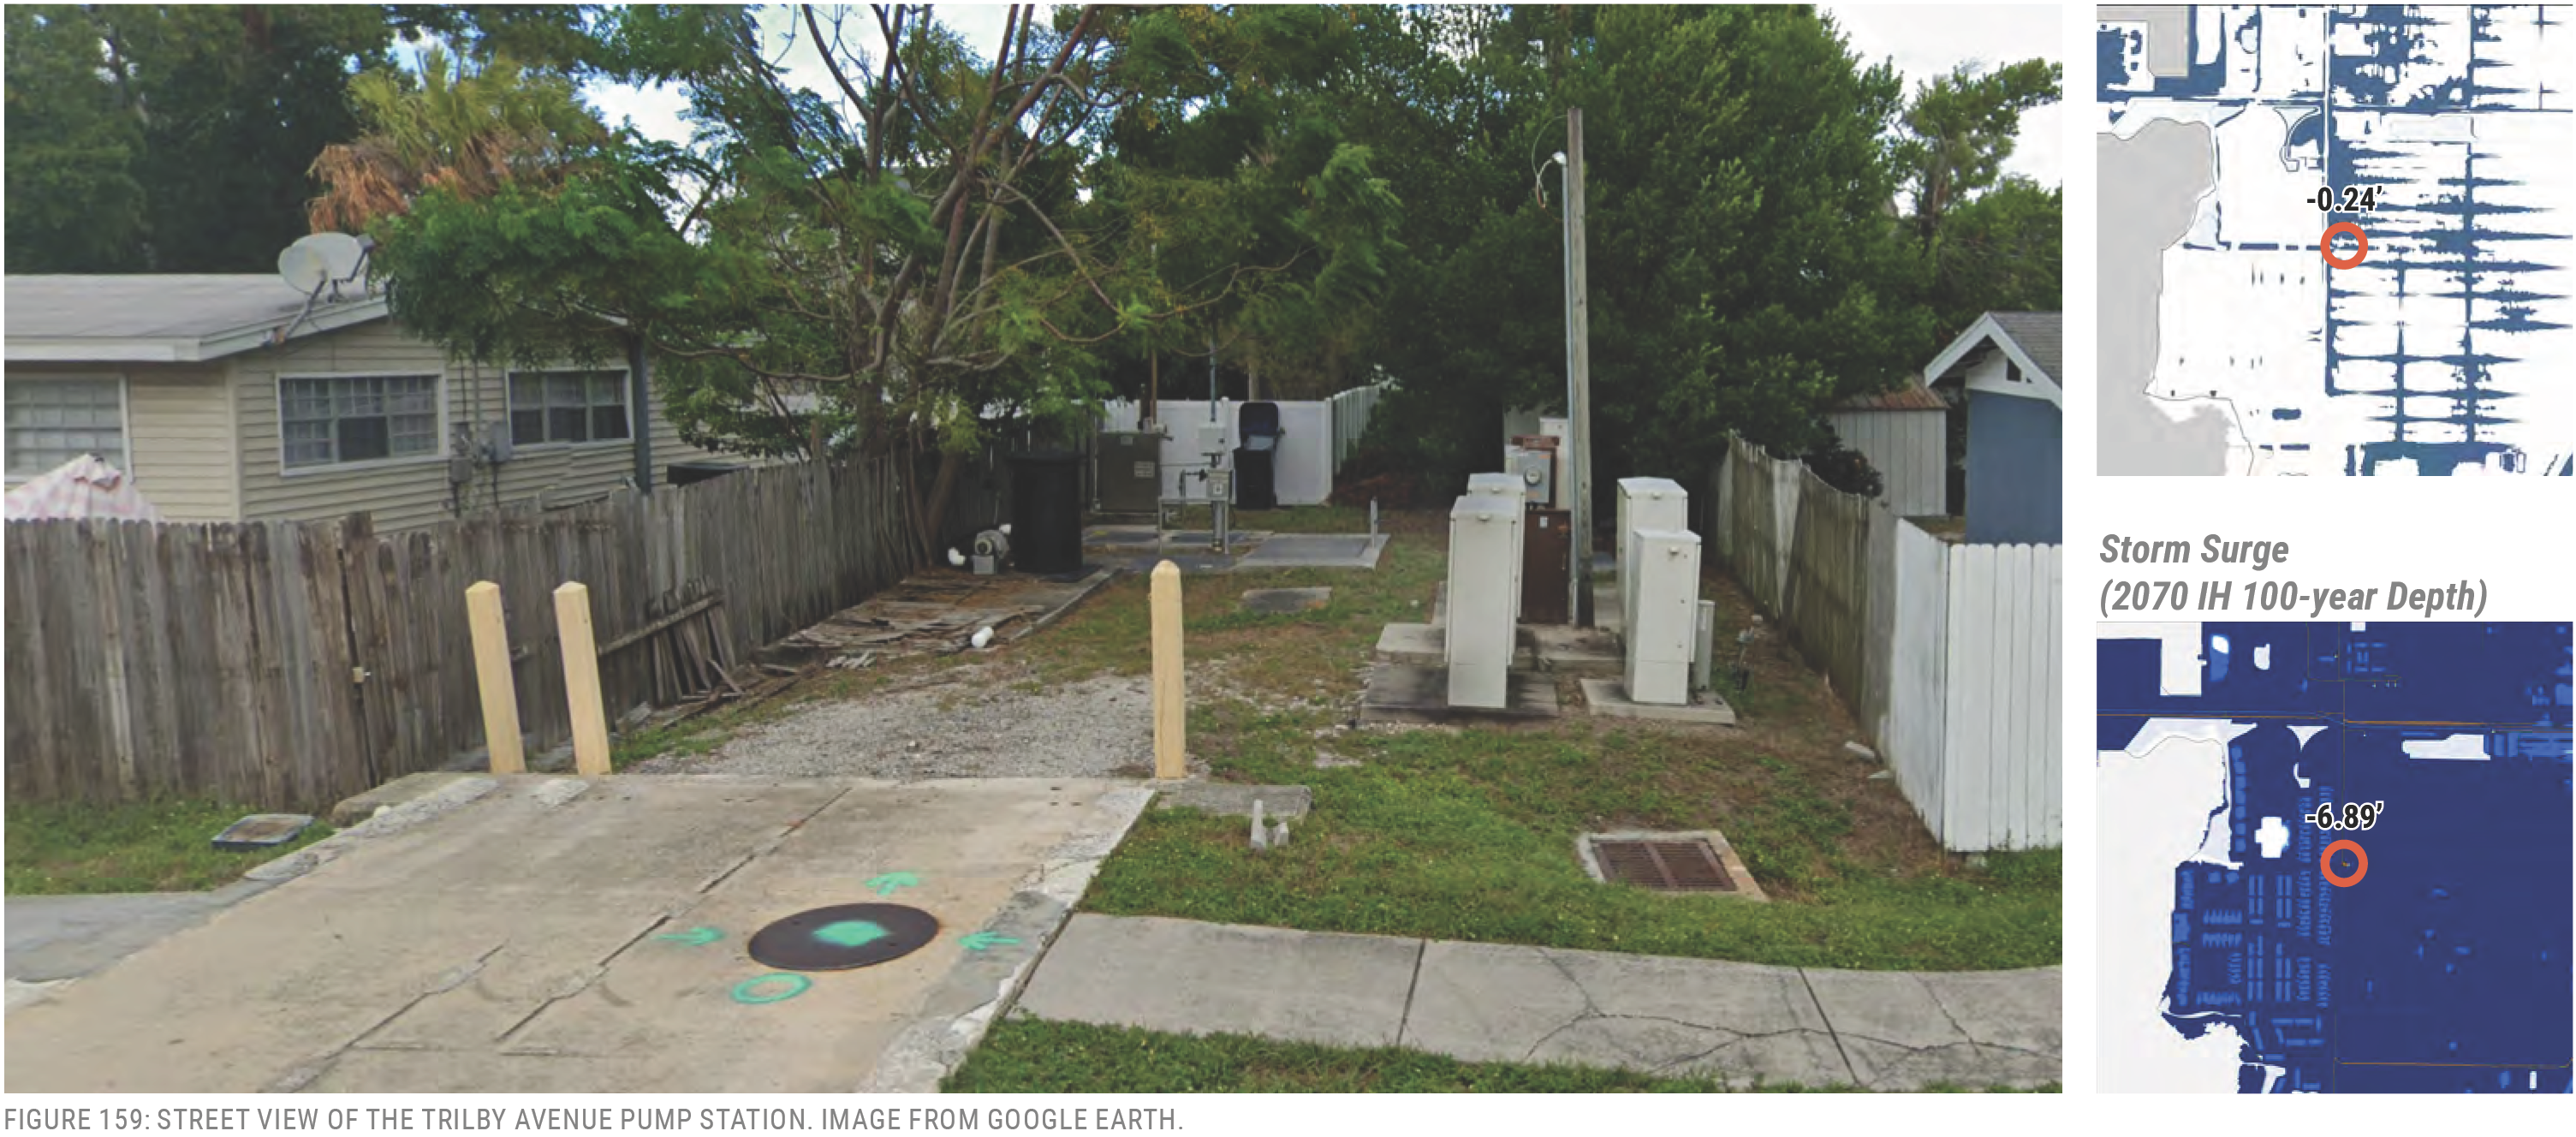
Pump Facility: Columbia
85 Columbia Drive
Size: 1,300 GPM
History: 1952, Replaced 1983
Vulnerabilities:
- Storm Surge
Location
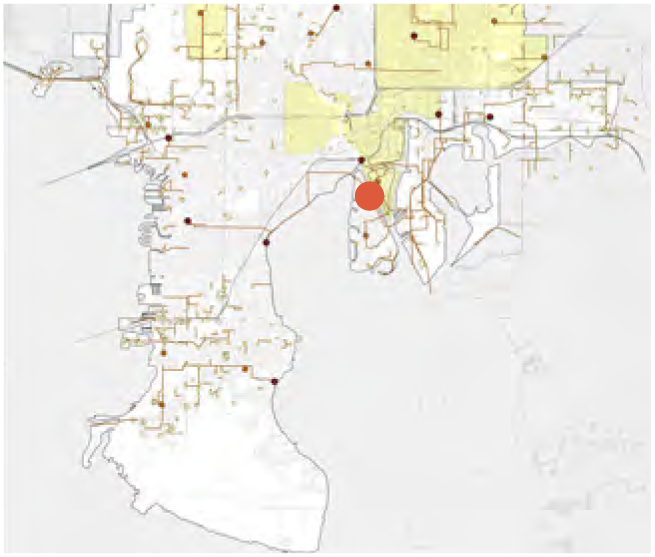
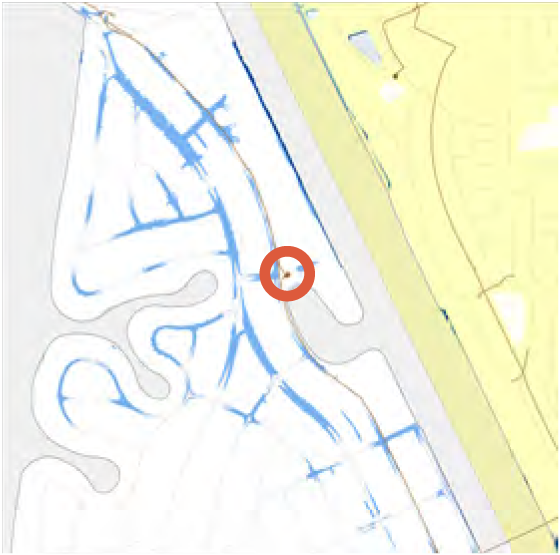
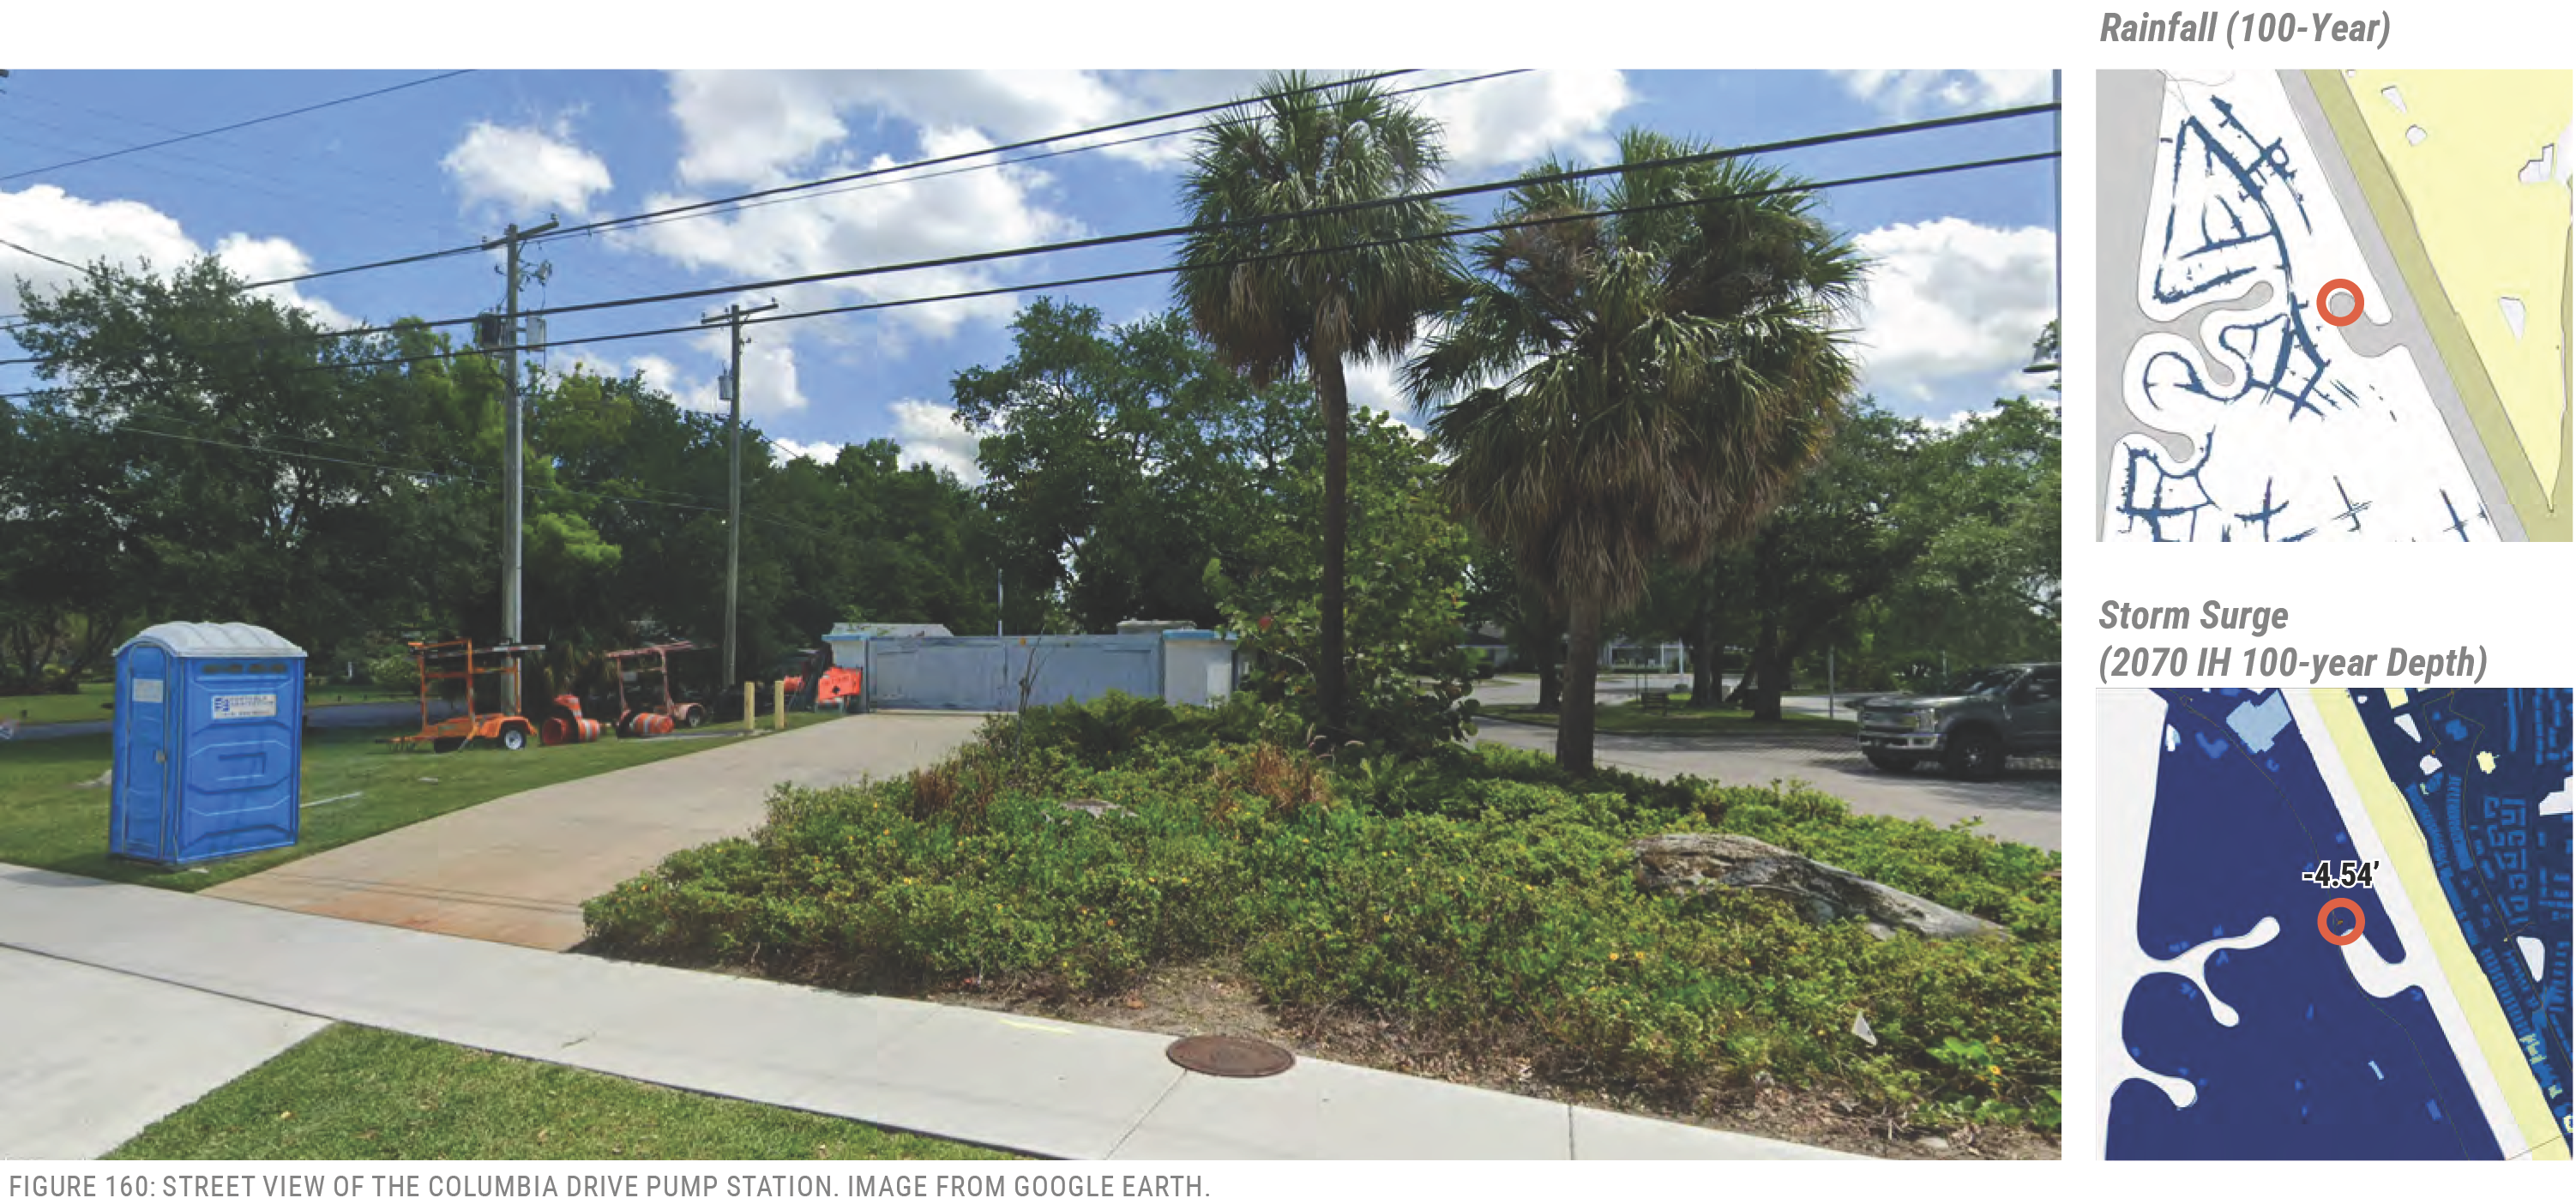
Pump Facility: Davis Islands
499 Suwanee Circle
Size: 1,250 GPM
History: 1920, Replaced 1982, Rehab 2001
Vulnerabilities:
- Storm Surge
Location
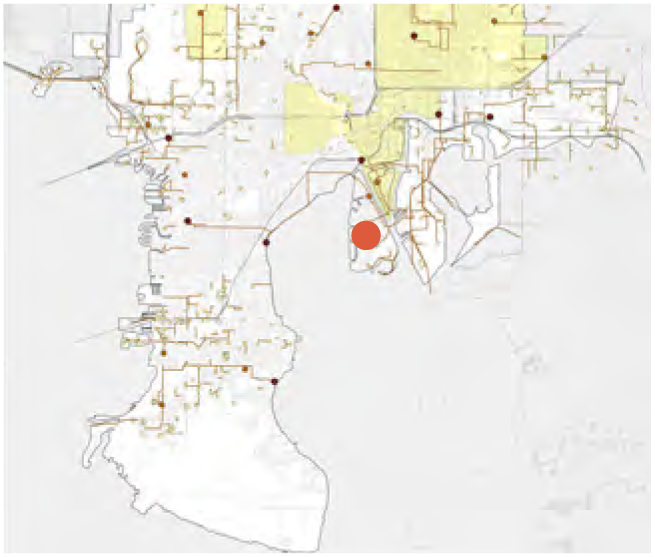
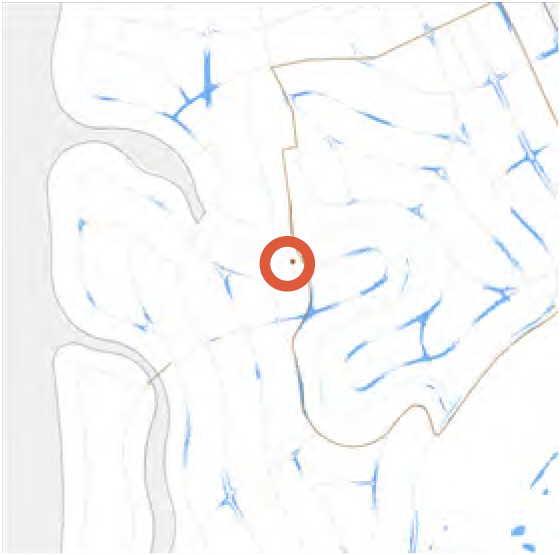
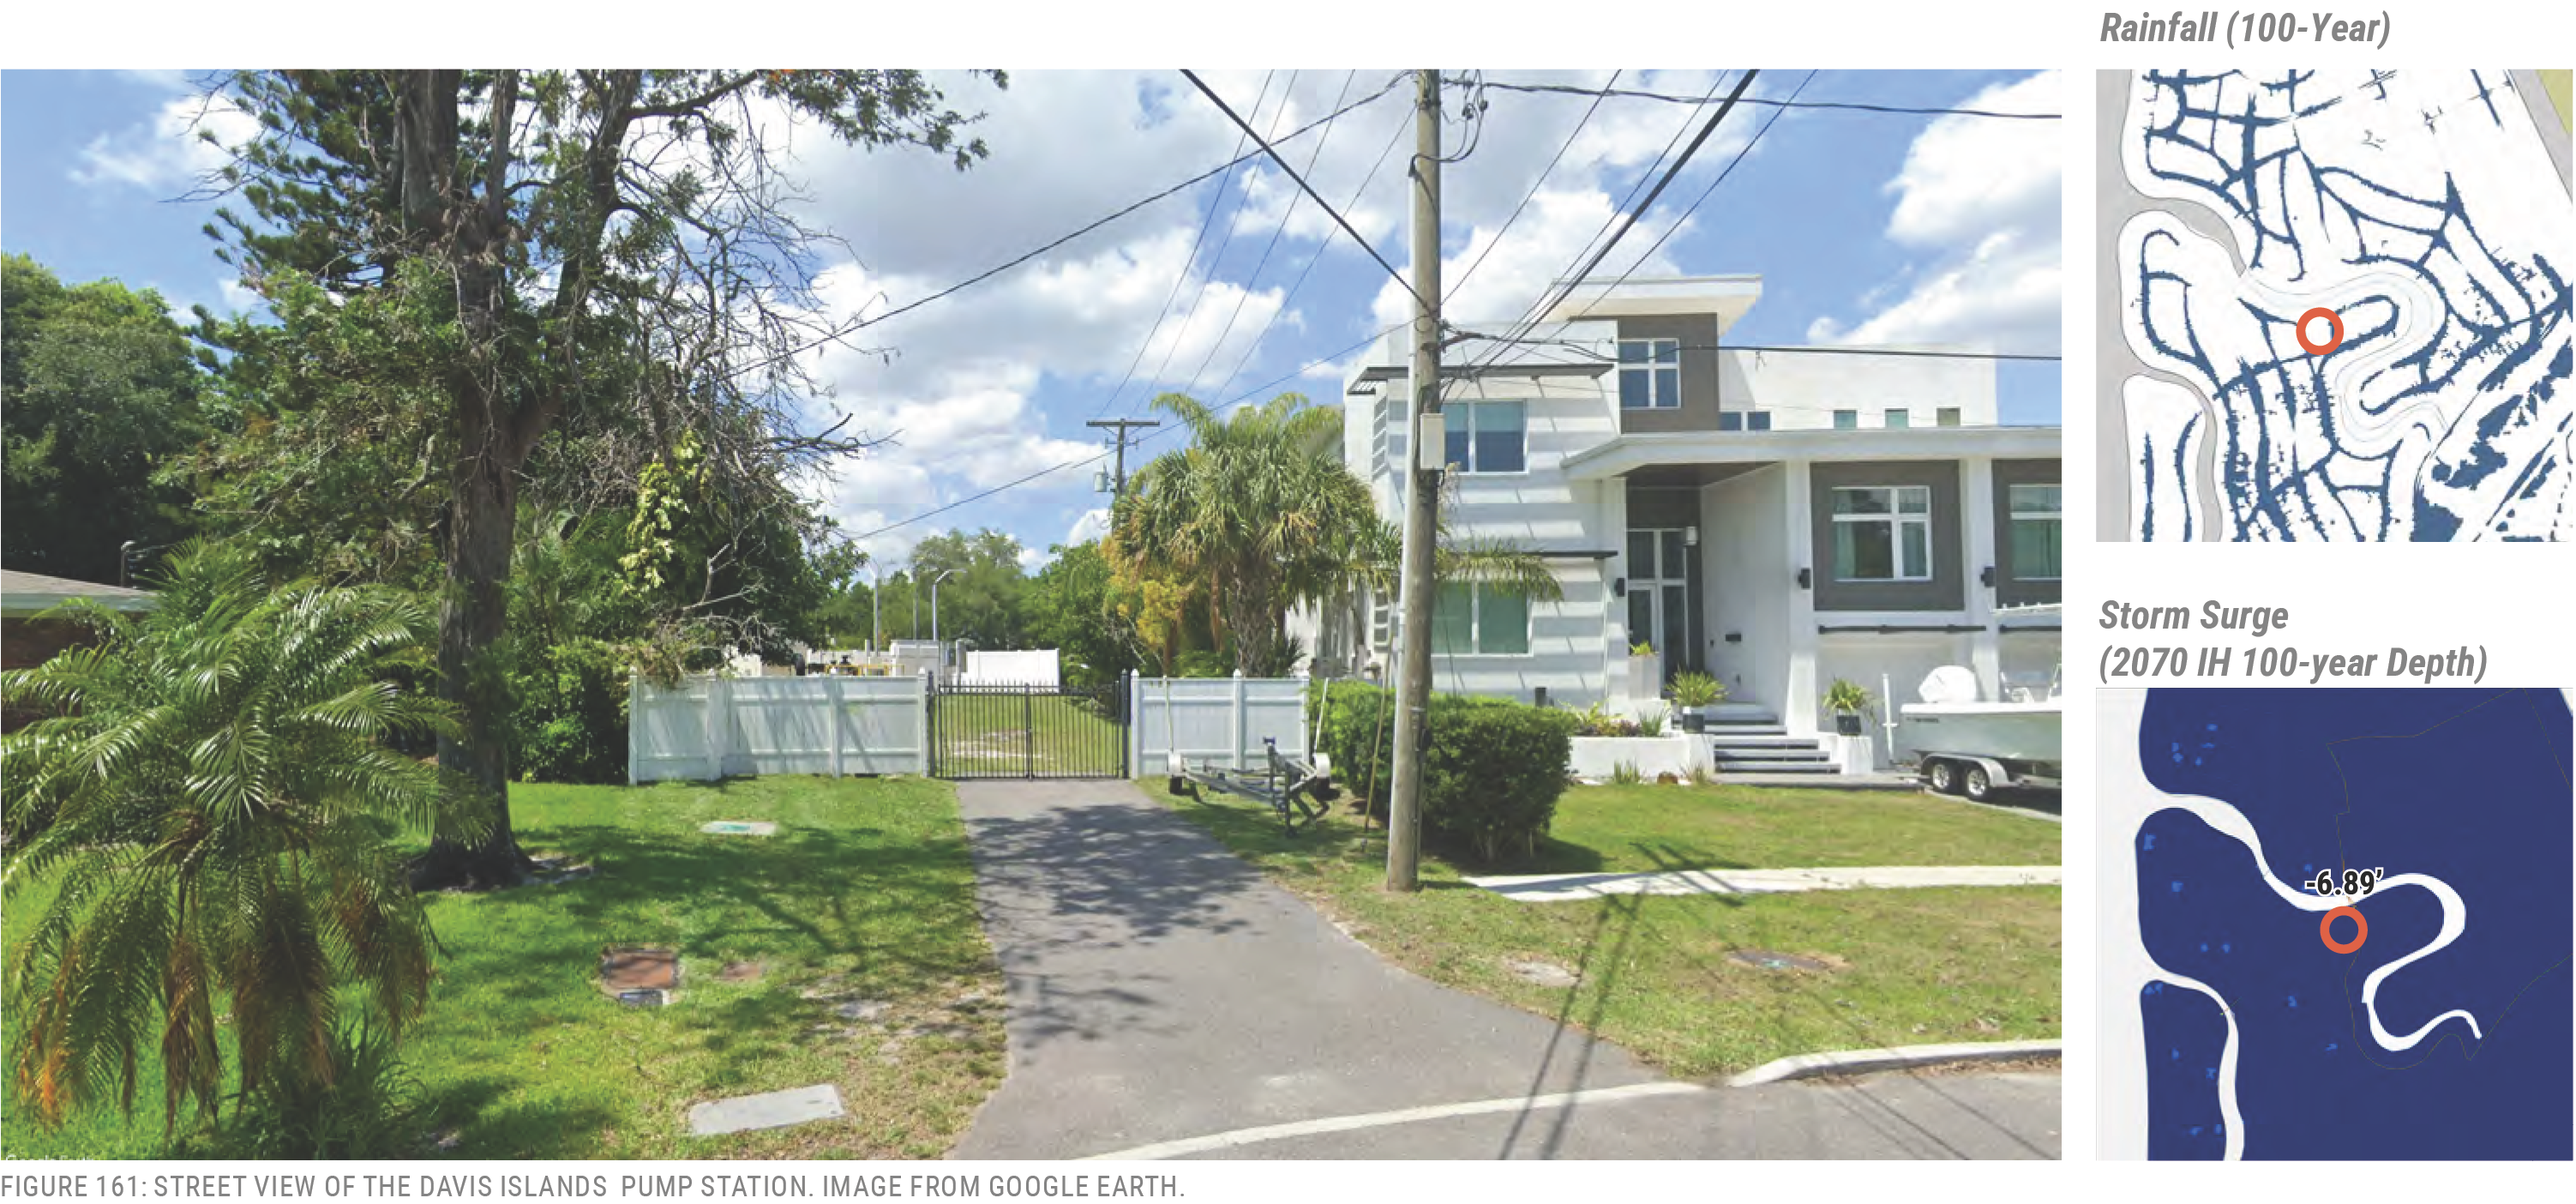
Pump Facility: Rome
4005 North Rome Avenue
Size: 1,100 GPM
History: 1964
Vulnerabilities:
- Storm Surge
Location
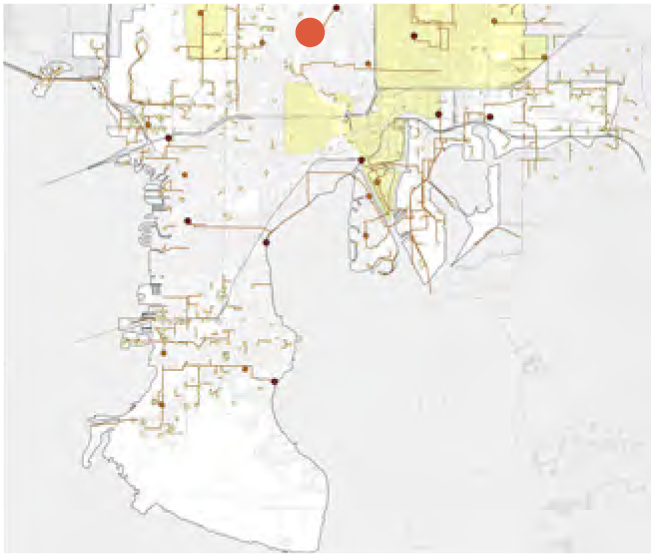
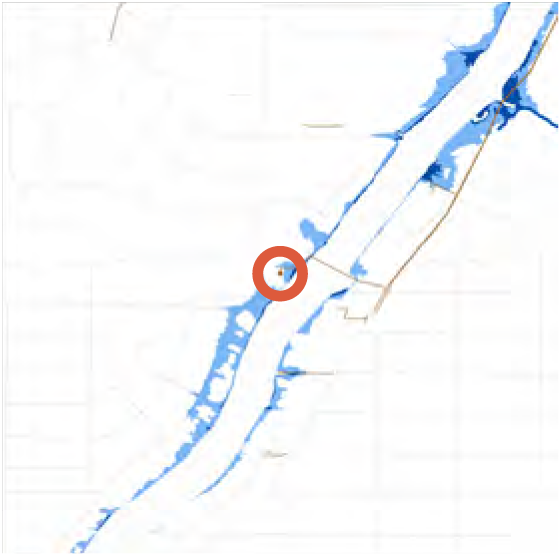
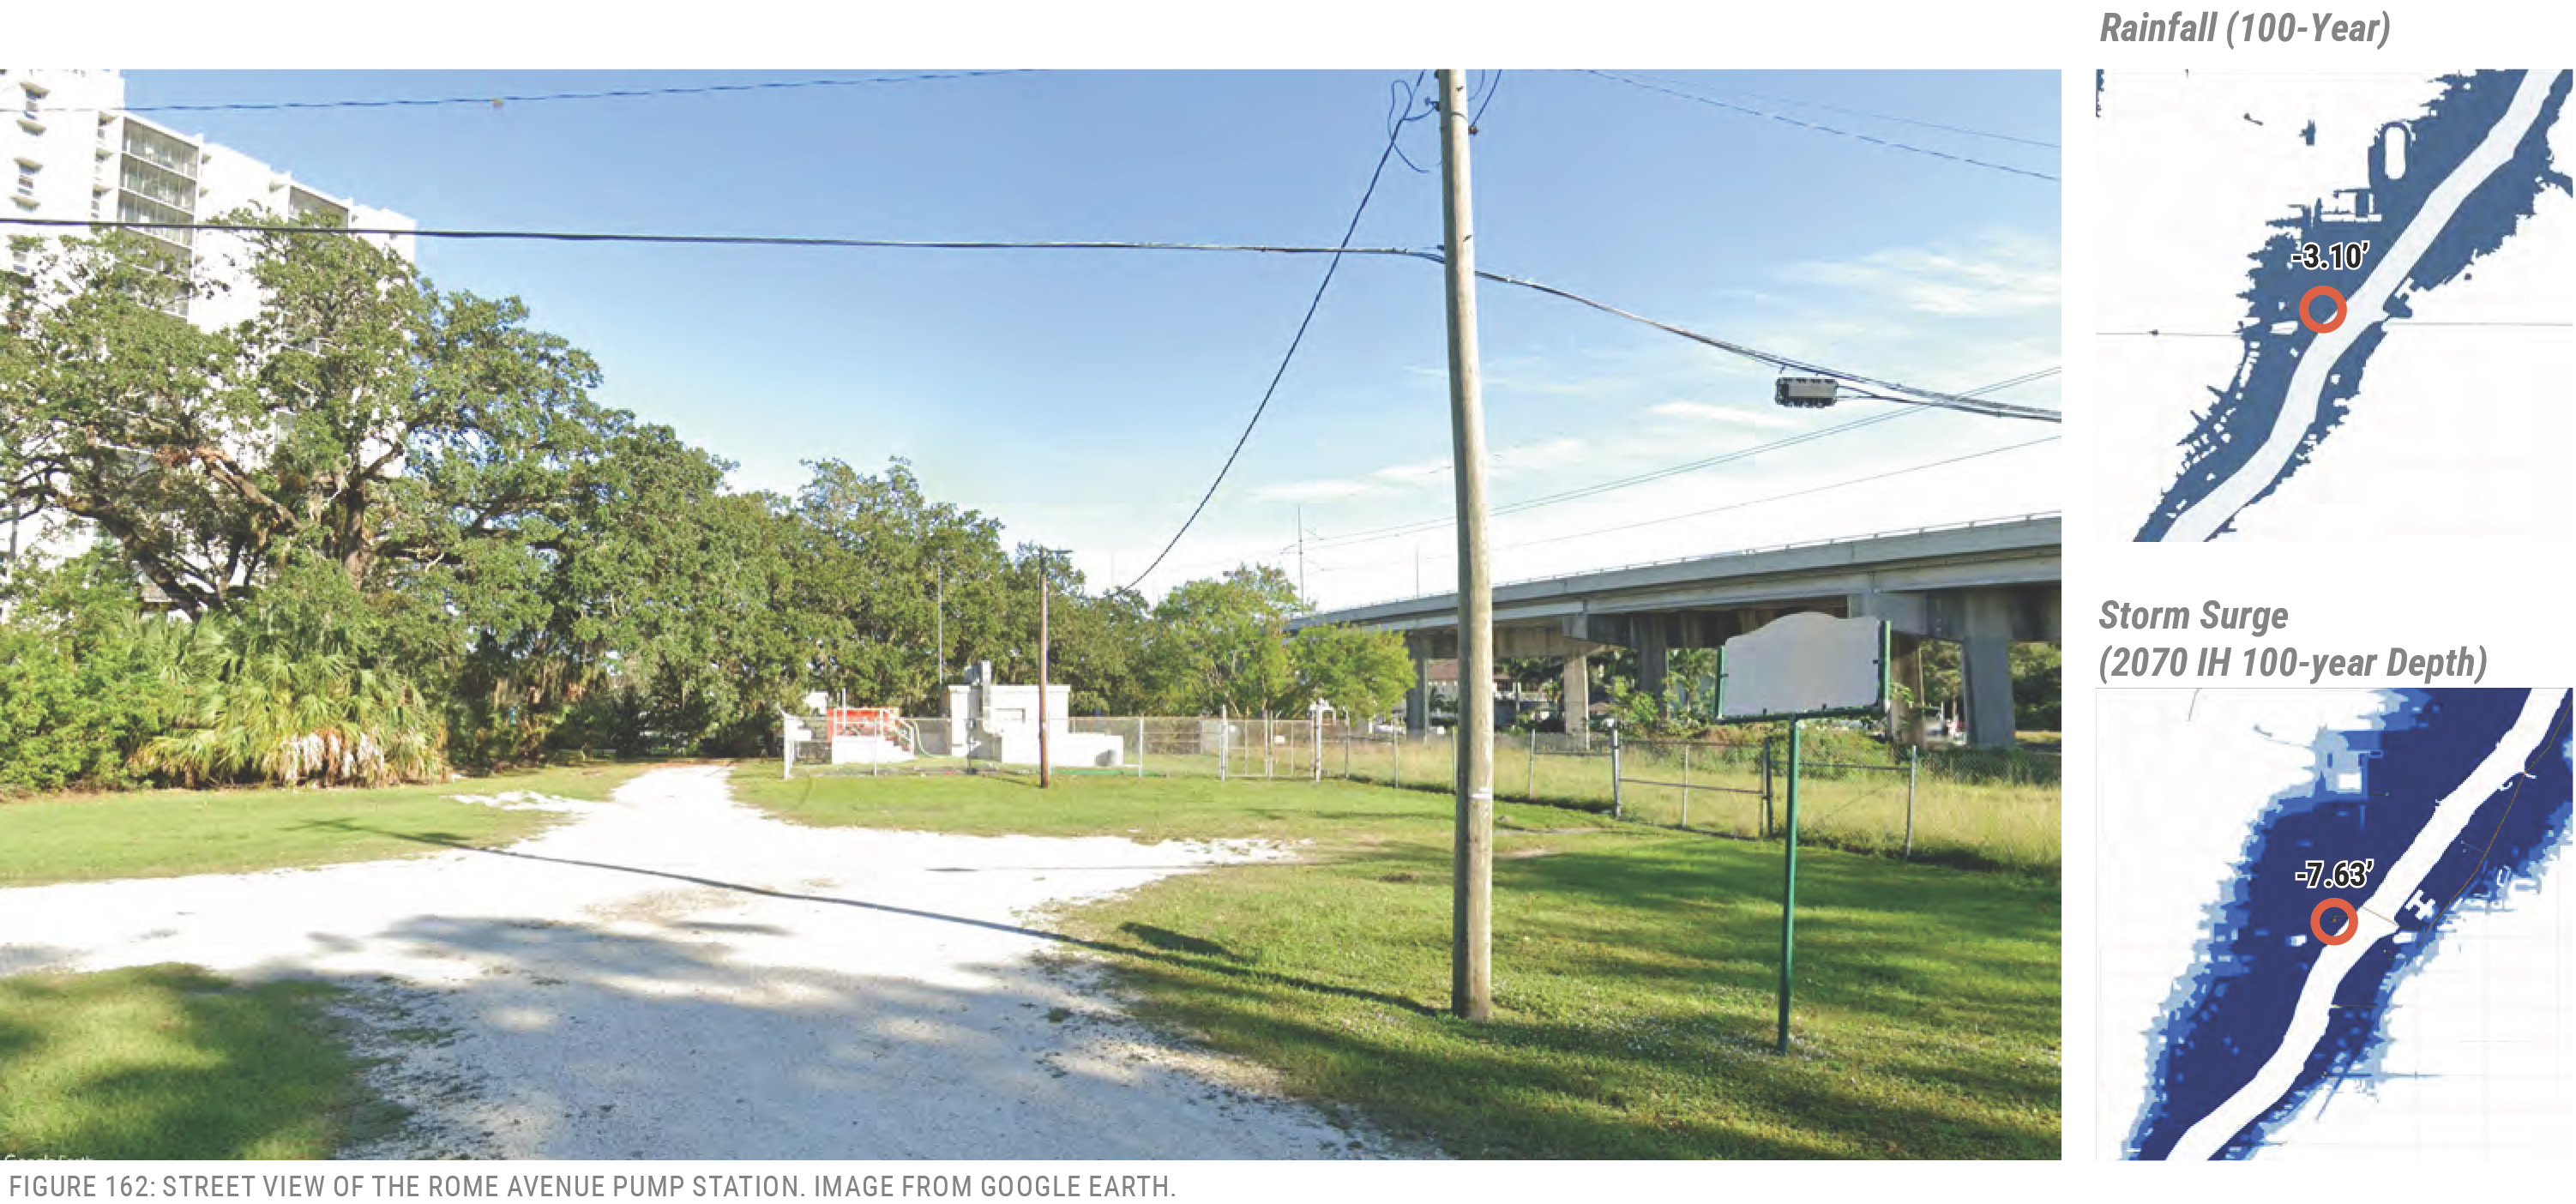
SEPTIC TANKS
Most of Tampa is connected to the city’s wastewater collection and treatment system. Outlier areas are mostly on the east edge of the city, and in Armenia Gardens Estates and Forest Hills. There are a few sites in the South Tampa Peninsula. Septic Tanks are susceptible to leaking, especially during periods of high ground water. Areas where 1-year stillwater impacts may occur at the surface are highlighted in the maps, where flooding and higher ground water elevations may become an issue.
If impacted, septic systems can send pollutants into the groundwater system, indirectly sending them into primary water bodies.
Findings
By 2070 the 1-year stillwater elevations, with the intermediate-high scenario, may reach the surface elevation of two properties that have septic tanks. Those properties, and other areas with septic tanks, are shown in Figure 163.
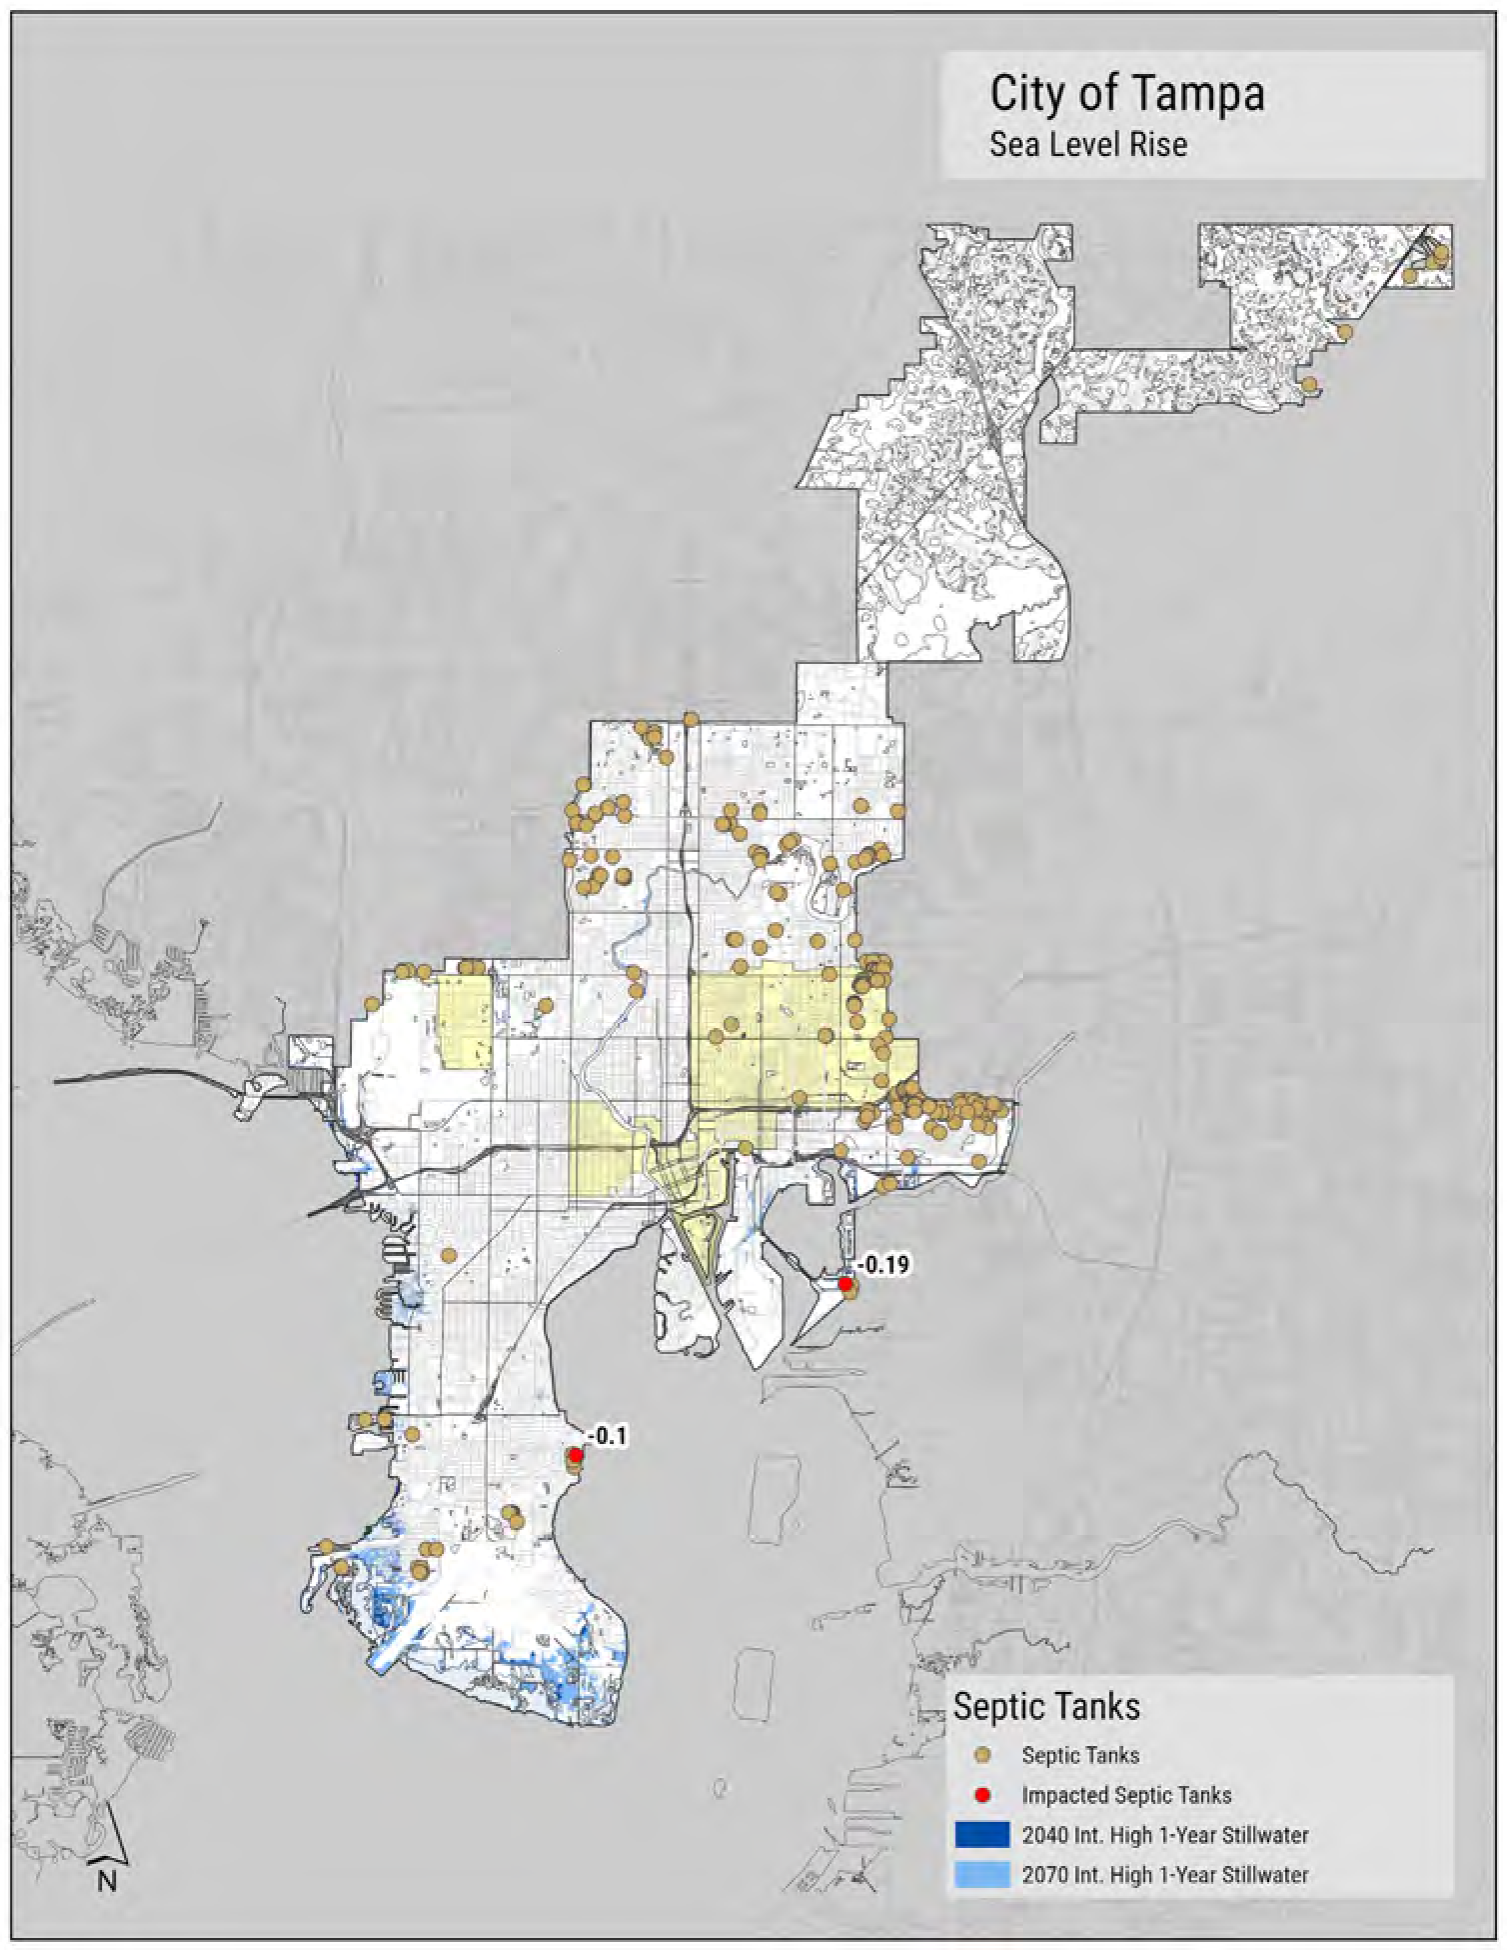
SOLID WASTE
As a department, City of Tampa Solid Waste processes approximately 400,000 tons of municipal solid waste and recycling annually (Applied Sciences, 2023). This system includes primary structures, such as the waste transfer facility and the waste-to-energy building, which are both on the McKay Bay Peninsula near Palmetto Beach. The operation also includes a fleet of trucks and fuel, storage lots, and an administrative building. Truck storage, fuel, and administration operations will soon be moved to the McKay Bay location. There will also be a new parking garage, fleet maintenance building, public restroom, fueling station, truck wash, container storage building, and chiller facility.
If the facilities are inoperable due to flooding, whether this occurs because of high water levels at the primary facility or because access is blocked on the roadways, either the city’s garbage will not be collected or it could potentially be delivered to Hillsborough County’s solid waste facility. This happened recently when the waste-to-energy plant was closed for maintenance. The city spent $150,000 per day to haul waste to the county’s landfill and lost out on revenues typically generated by the energy produced when burning trash (Sowers, 2024).
FINDINGS
At the McKay Bay facility, the tipping floor, where waste material is deposited, is on a hill, and most of the structures are at elevations above the 100-year floodplain. This should be evaluated closely for existing and proposed facilities at a more detailed level with surveyed elevations.
Sea Level Rise
No facilities are impacted by the scenarios.
Rainfall
A single private solid waste facility at 5111 North 26th Street is potentially impacted by current 100-year rainfall conditions.
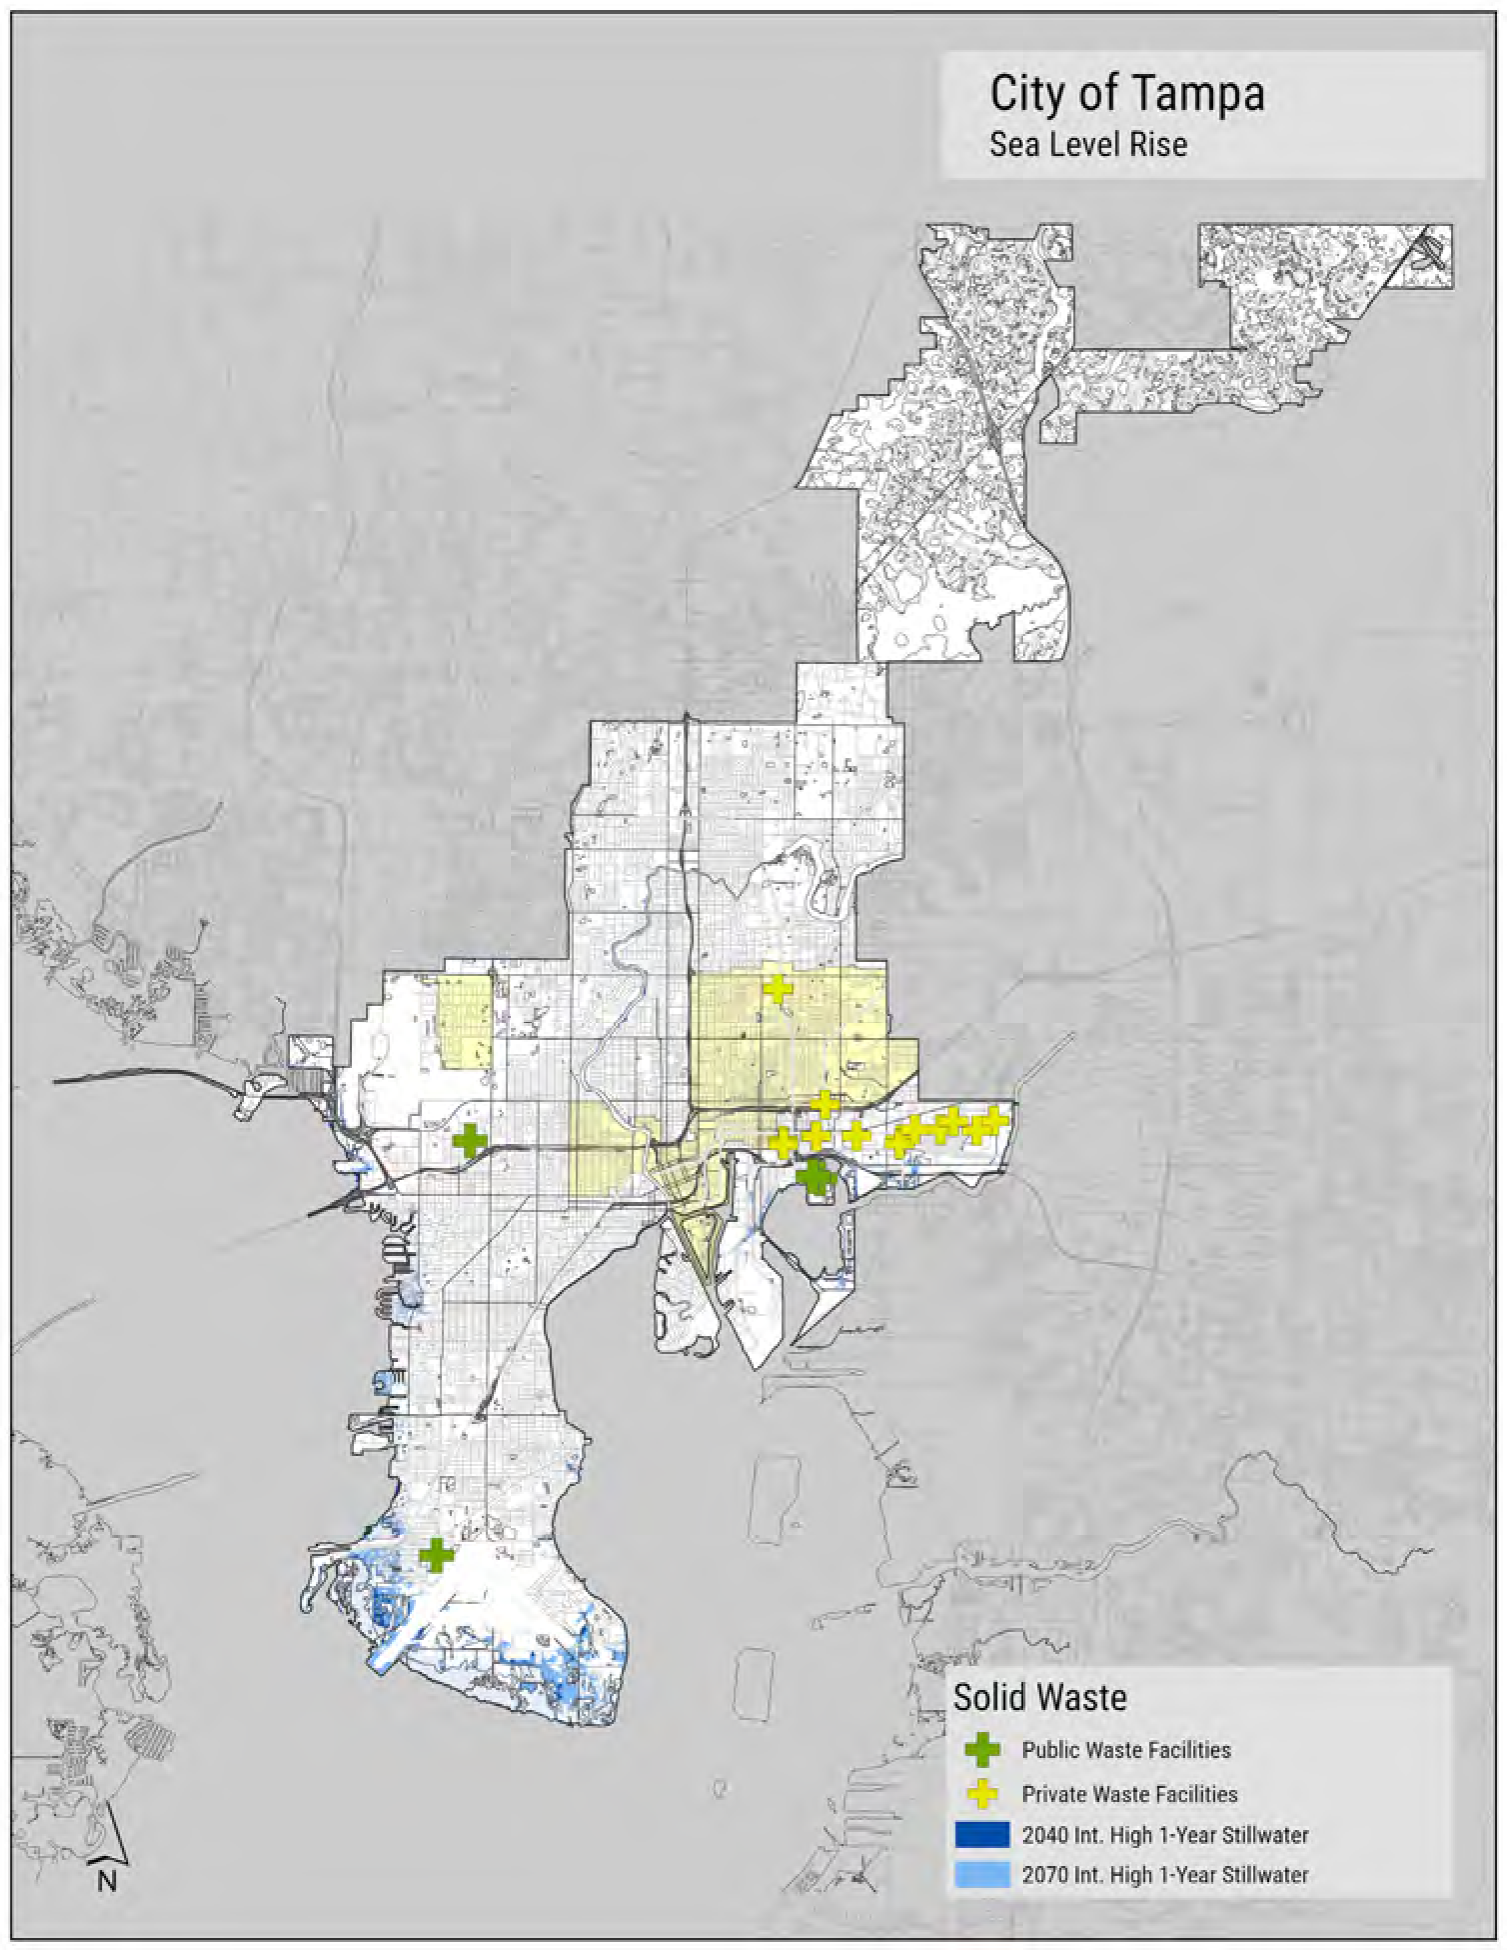
Storm Surge
Approximately half of the McKay Bay Peninsula site is within the current 100-year storm surge floodplain scenario, with an additional amount included in the 2070 intermediate-high scenario. The ground level of the waste-to-energy facility, transfer center, and adjacent buildings are projected to be flooded by approximately 4 feet of water.
Because of the intensity of uses and potential consequence of impacts, a focus area study has been developed as part of this project. Findings are included in a separate addendum to this report.
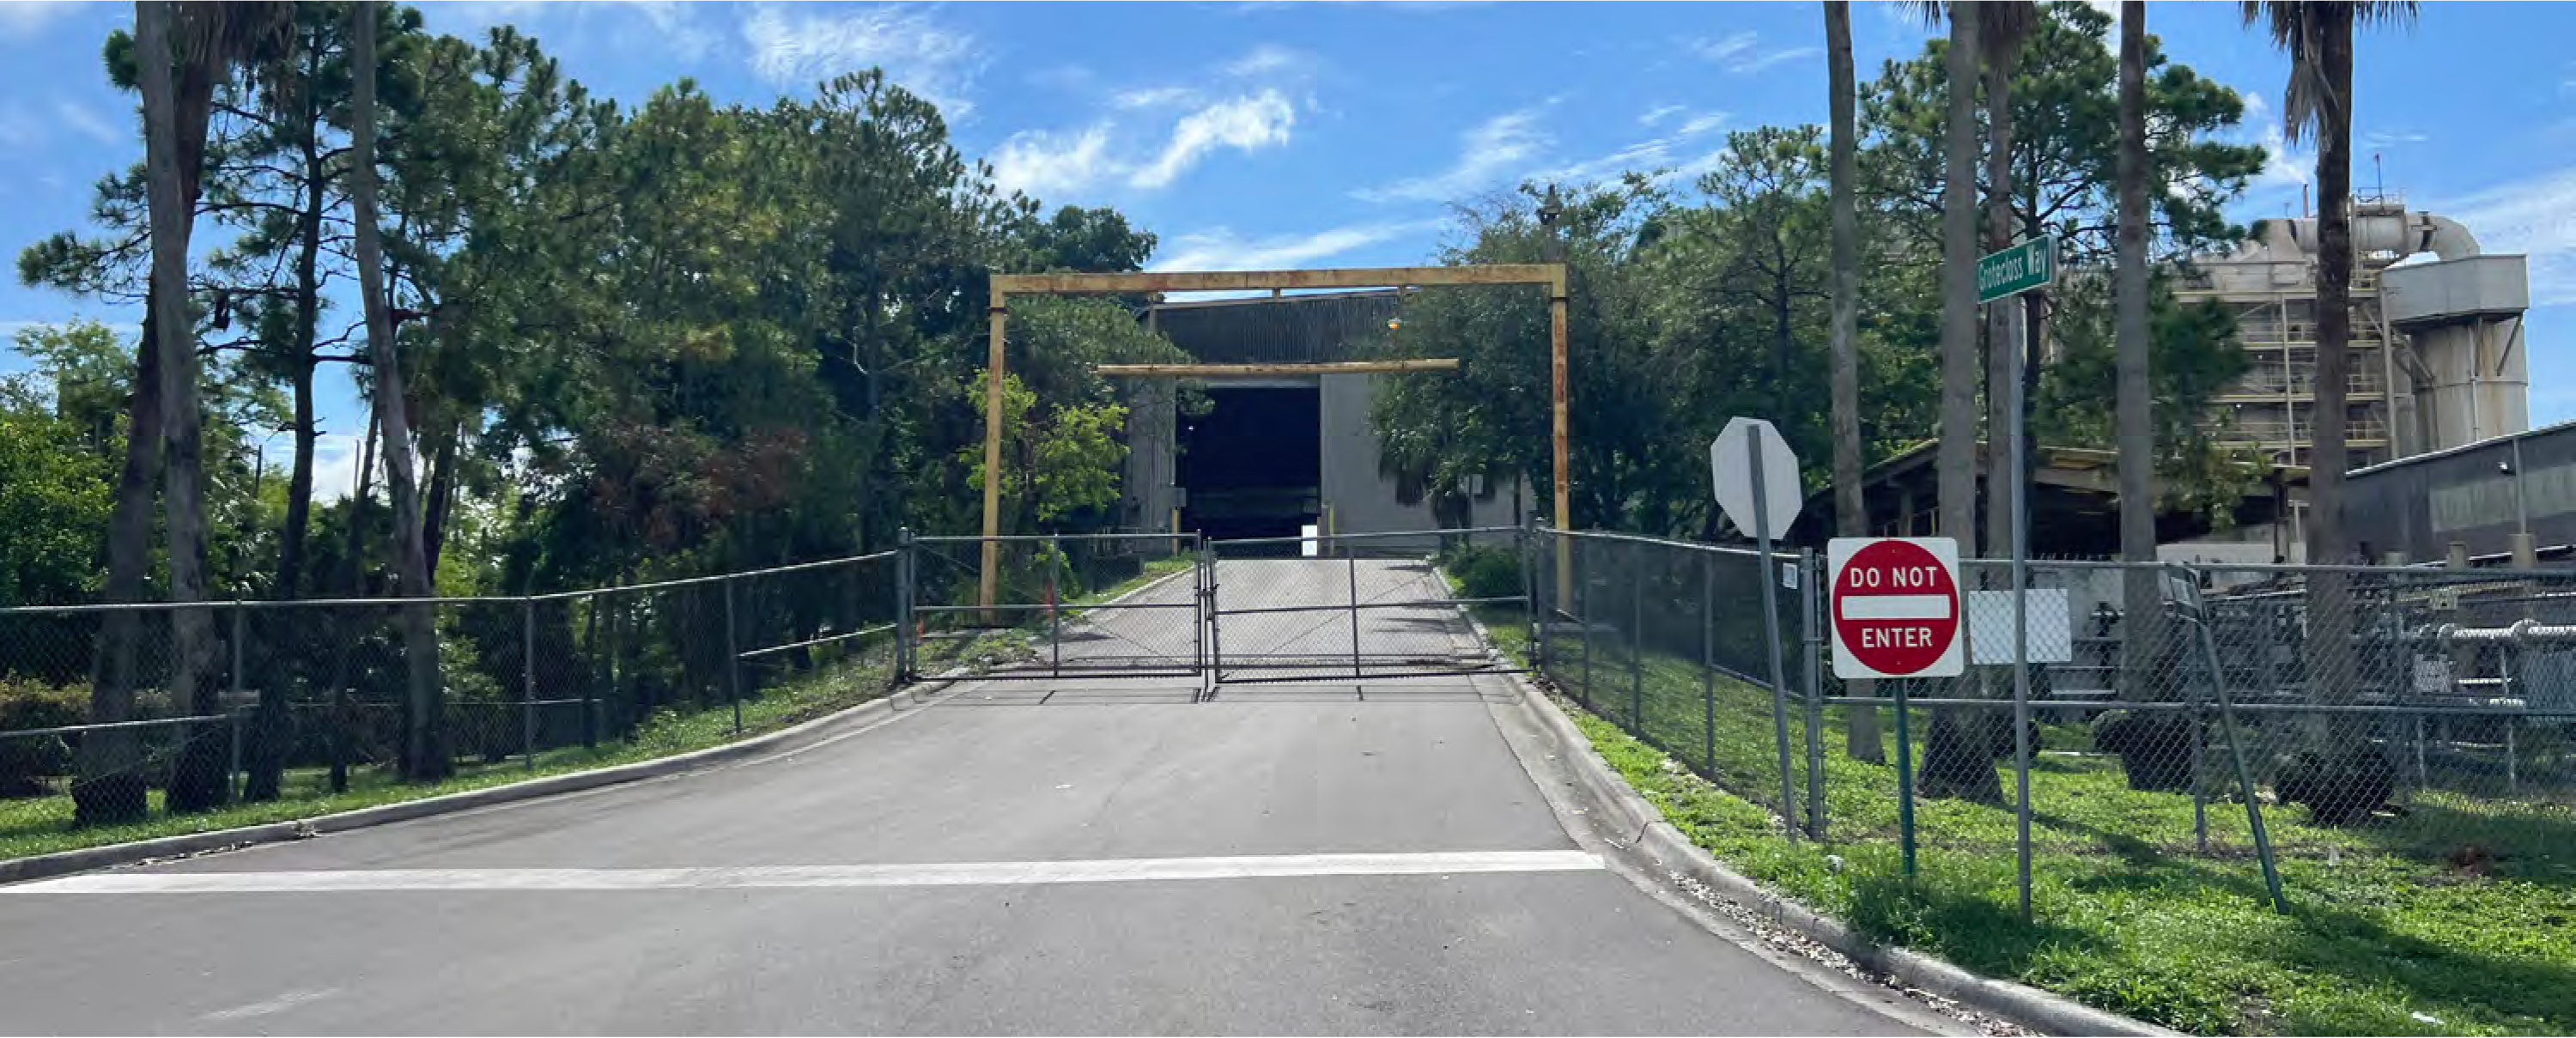
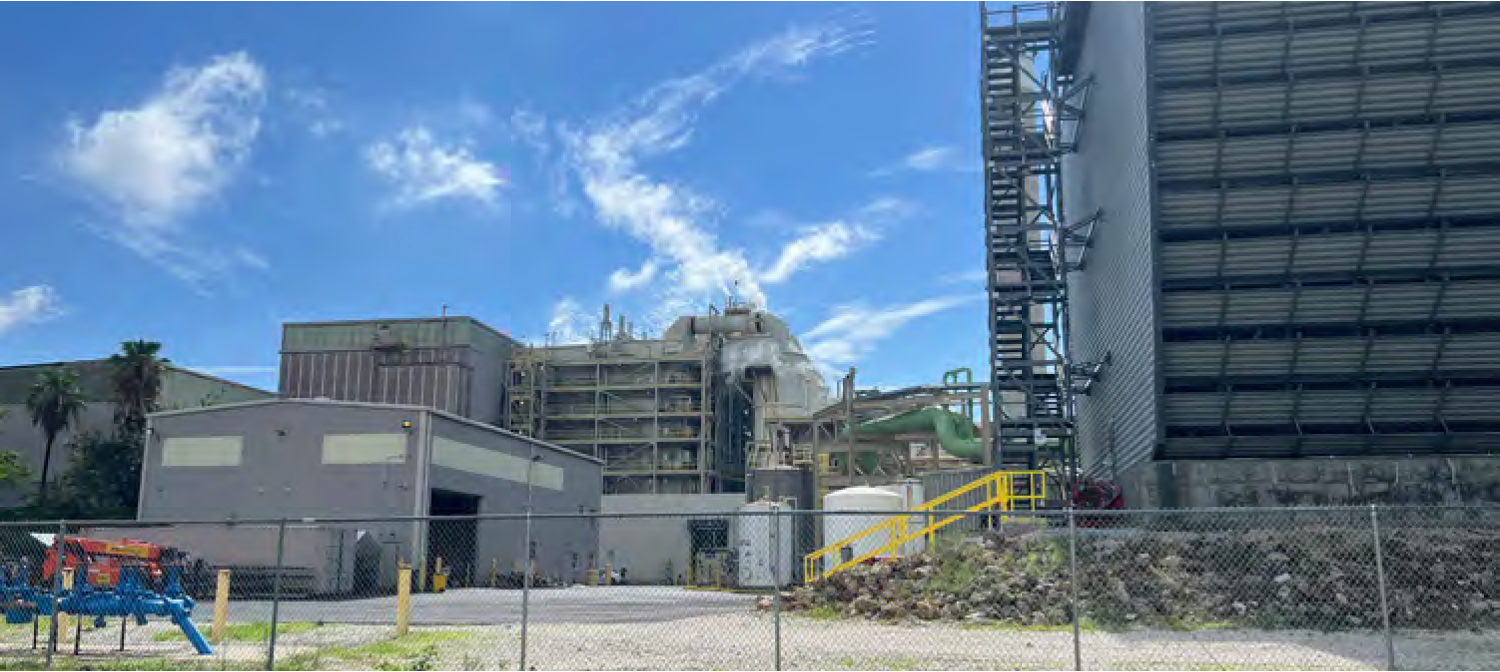
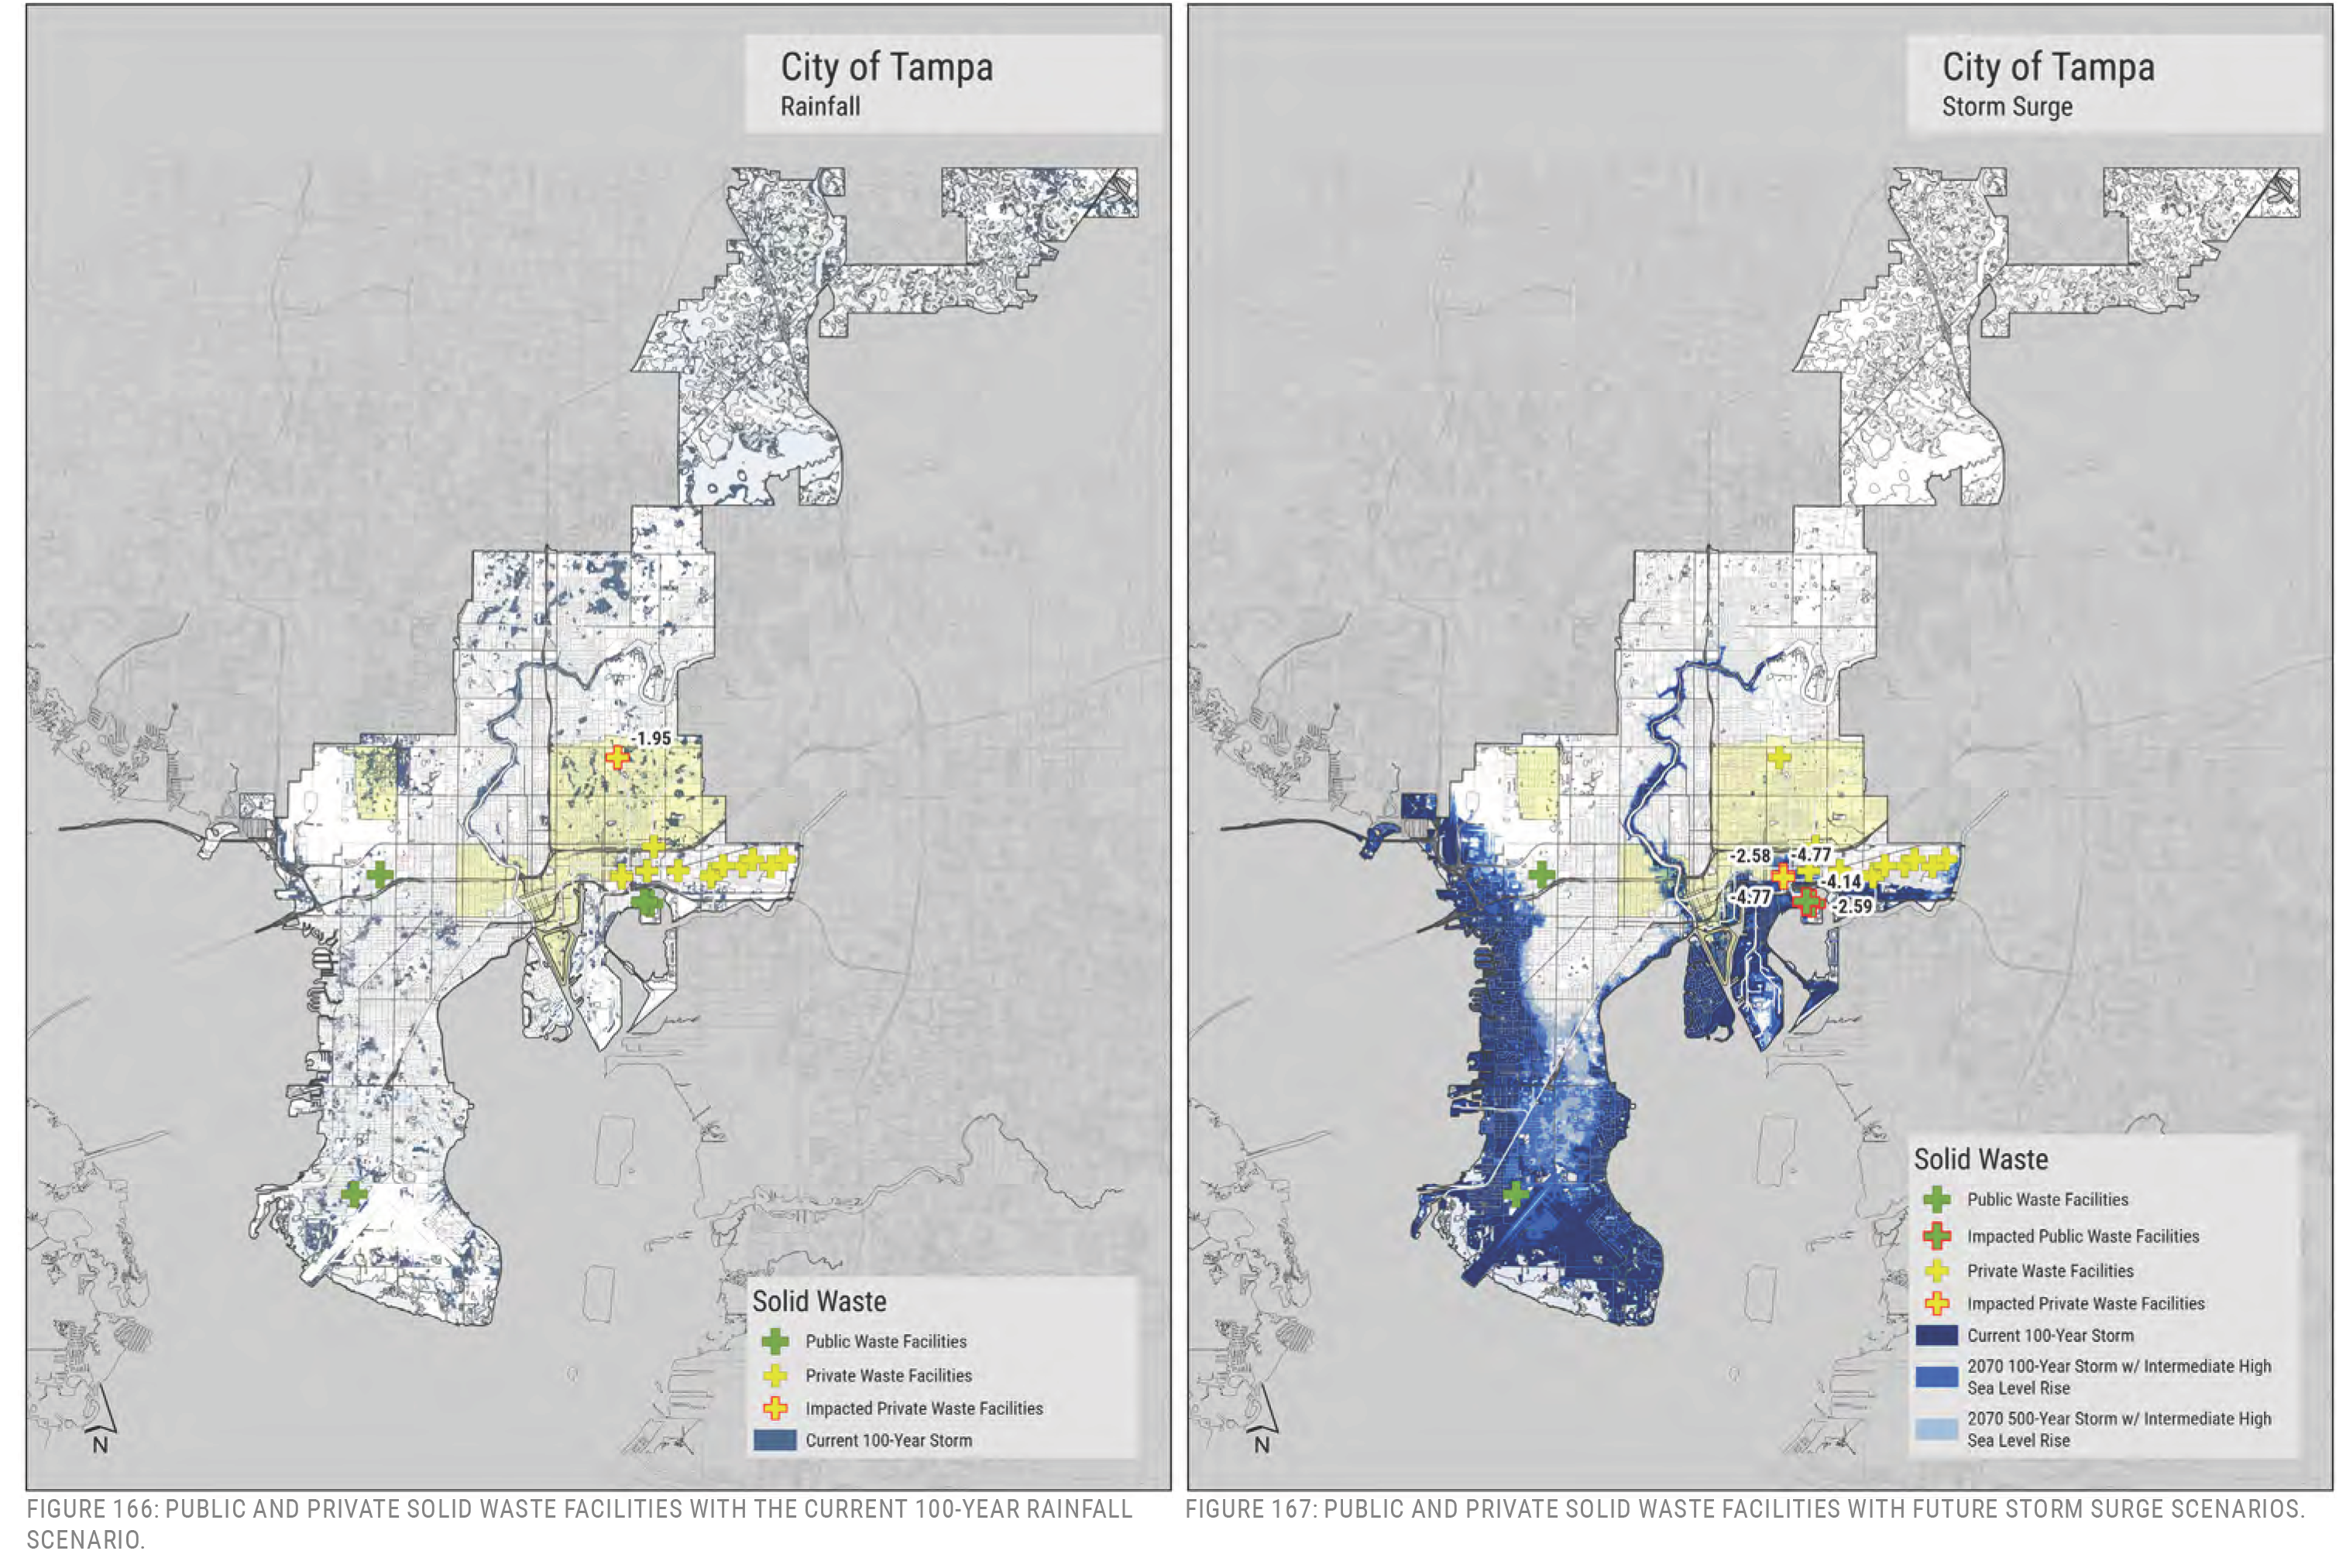
City of Tampa Rainfall — Solid Waste, Public Waste Facilities, Private Waste Facilities, Impacted Private Waste Facilities, current 100-Year Storm
City of Tampa Storm Surge — Solid Waste, Public Waste Facilities, Impacted Public Waste Facilities, Private Waste Facilities, Impacted Private Waste Facilities, Current 100-Year Storm, 2070 100-Year Storm with Intermediate High Sea Level Rise, 2070 500-Year Storm with Intermediate High Sea Level Rise
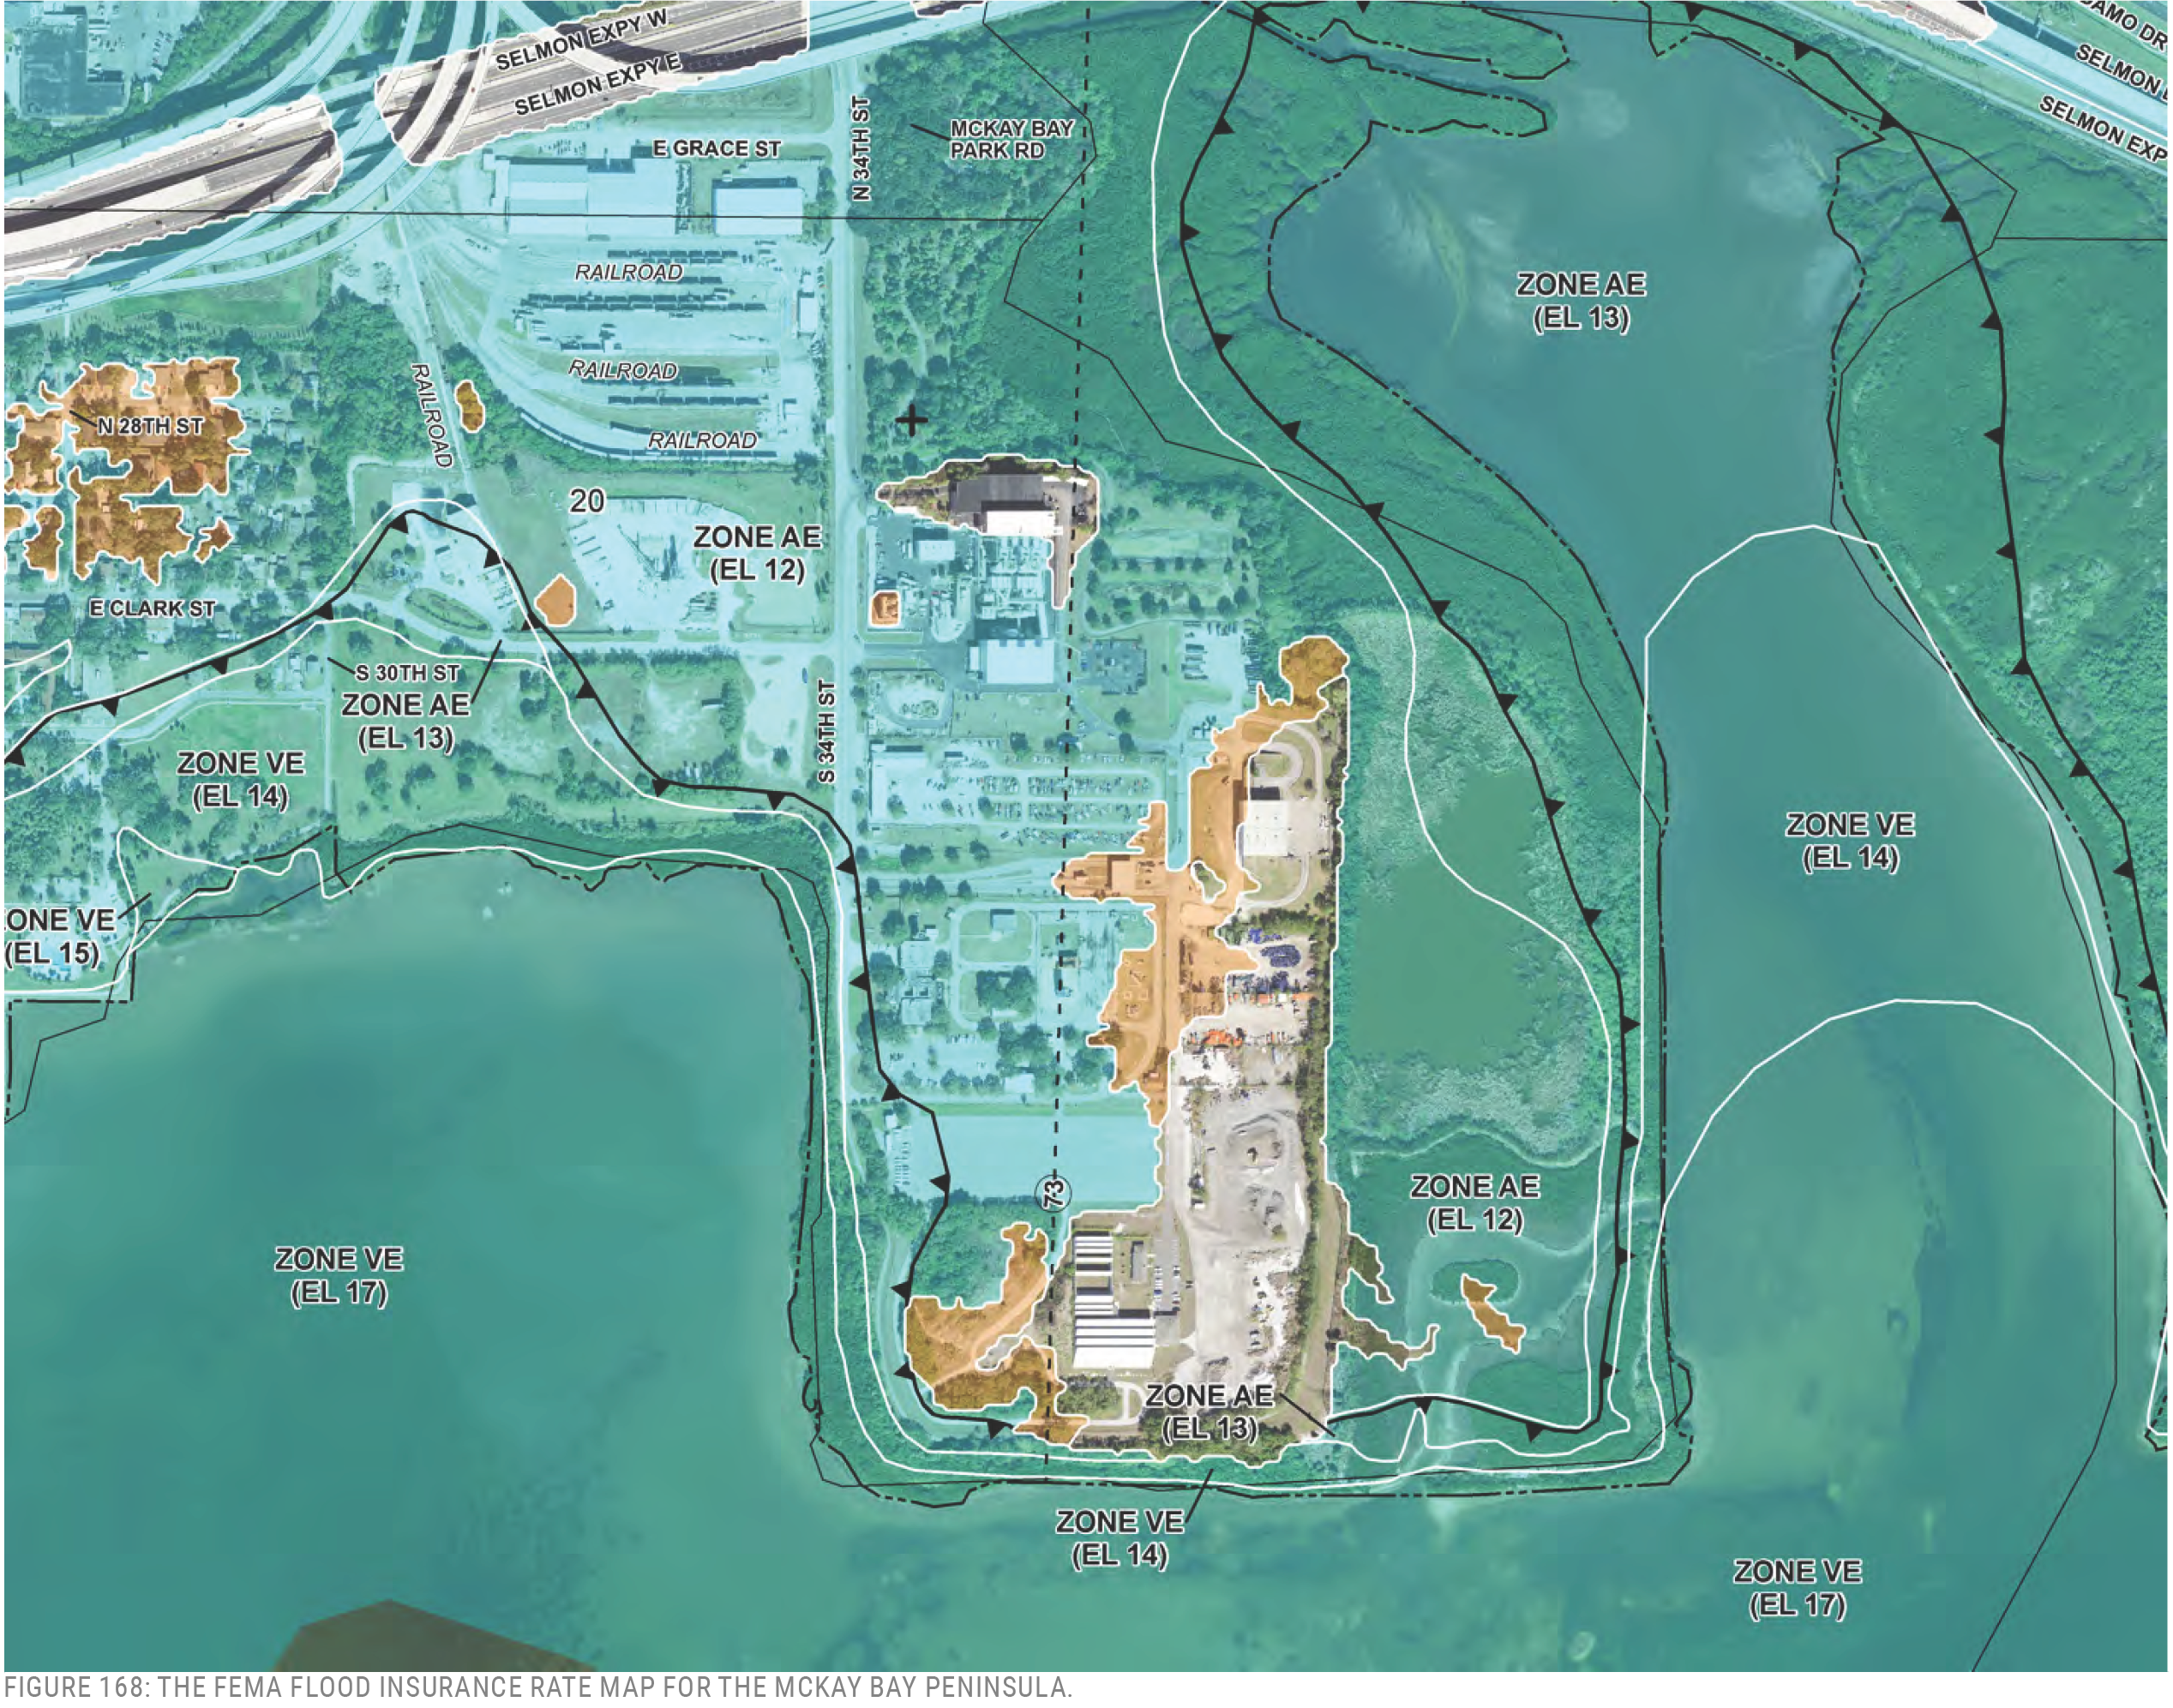

MEDICAL CARE
Medical care is an important aspect of daily life, but it is thrust into the spotlight during hazardous events. Not only are people injured during emergency situations, but a hurricane can also induce traumatic stress or make self-care more difficult, especially for more vulnerable populations (see Hillsborough County’s Community Vulnerability Study, 2021, for a thorough examination of induced pressures during hurricane situations). Urgent care, hospitals, and other medical facilities are important in ensuring the continued health of a community.
In Tampa, emergency medical service facilities are distributed throughout the city. Hospitals are more concentrated with primary facilities on Davis Islands, near Raymond James Stadium, and around the University of South Florida.
Impacts to physical structures can create problems for the continued operation of the facility, but contextual roadway access should be also considered. For example, Tampa General Hospital is the only Tier 1 Trauma Center in West Central Florida. It is accessed by a pair of bridges that cross over the mouth of the Hillsborough River.
FINDINGS
Sea Level Rise
Bayshore Boulevard, one of the primary roadway connections to Tampa General Hospital, has recently been closed multiple times because of high tide and stormwater flooding. Hurricane Idalia (2023) brought tides up 5.38 feet NAVD88, and during Hurricane Debby (2024), water reached levels of 3.82 feet NAVD88, according to the East Bay tide gauge. Tropical Storm Eta (2020) caused water levels to reach 4.7 feet NAVD88. Access to the northbound Bayshore ramps both on and off Davis Islands were closed during these storms, limiting transportation access with connection points further inland on West DeLeon Street remaining open.
Bayshore is projected to be impacted at the southern bridge connection annually as soon as 2040 with the intermediate-high sea level rise scenario (elevation 2.79 feet NAVD88). The current 1-year stillwater of 2.0 feet NAVD88 is below roadway elevations of 2.5 feet at the southern bridge and 3.9 feet at the northern bridge. The entire width of Bayshore Boulevard at
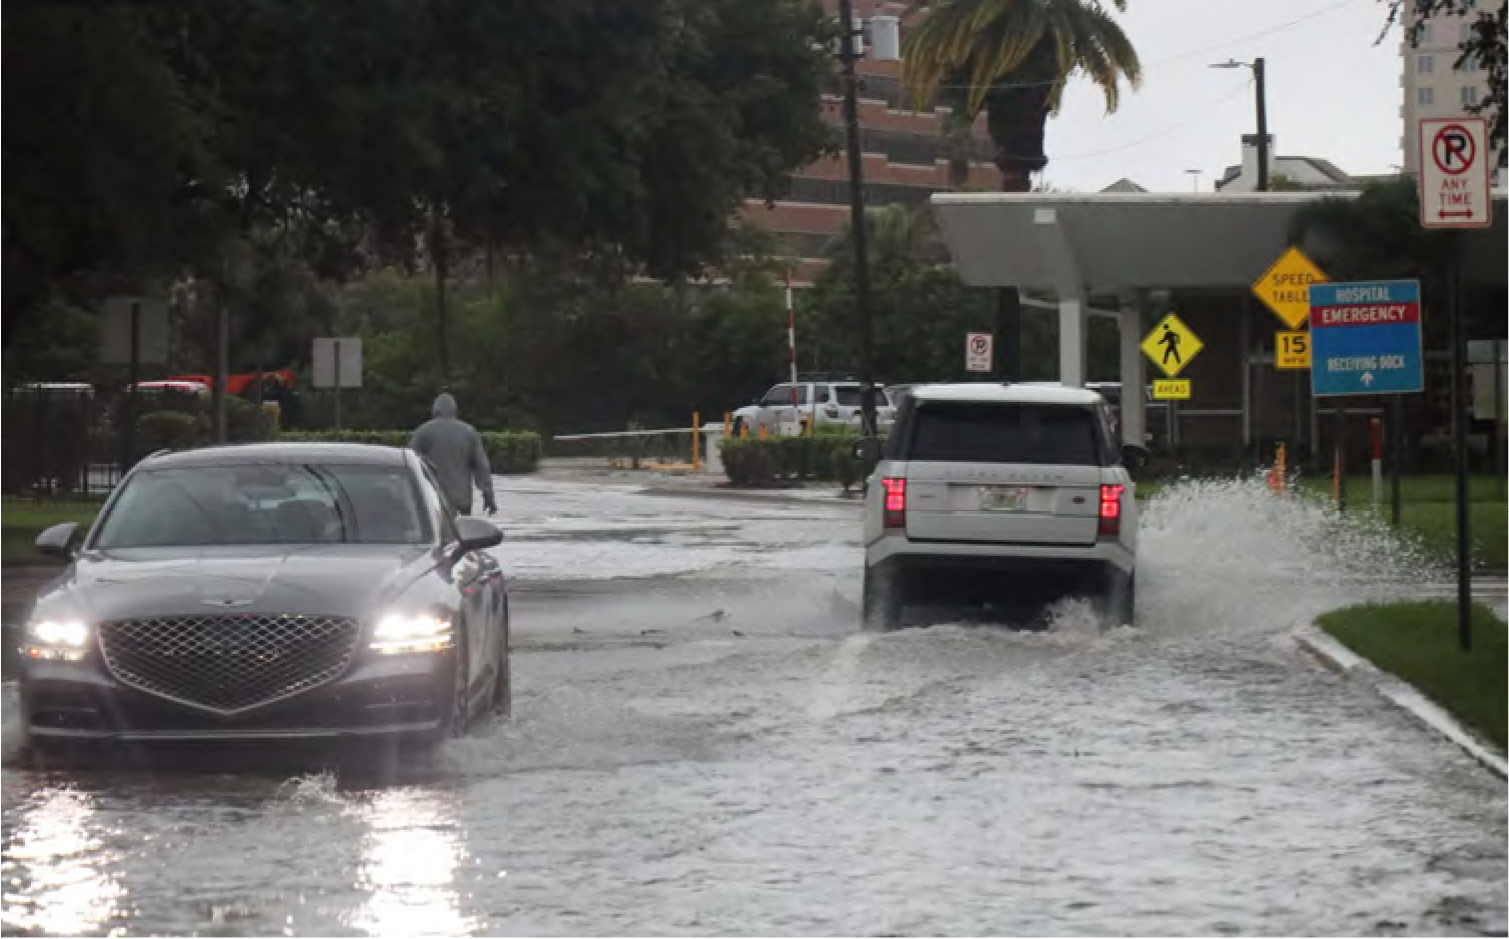
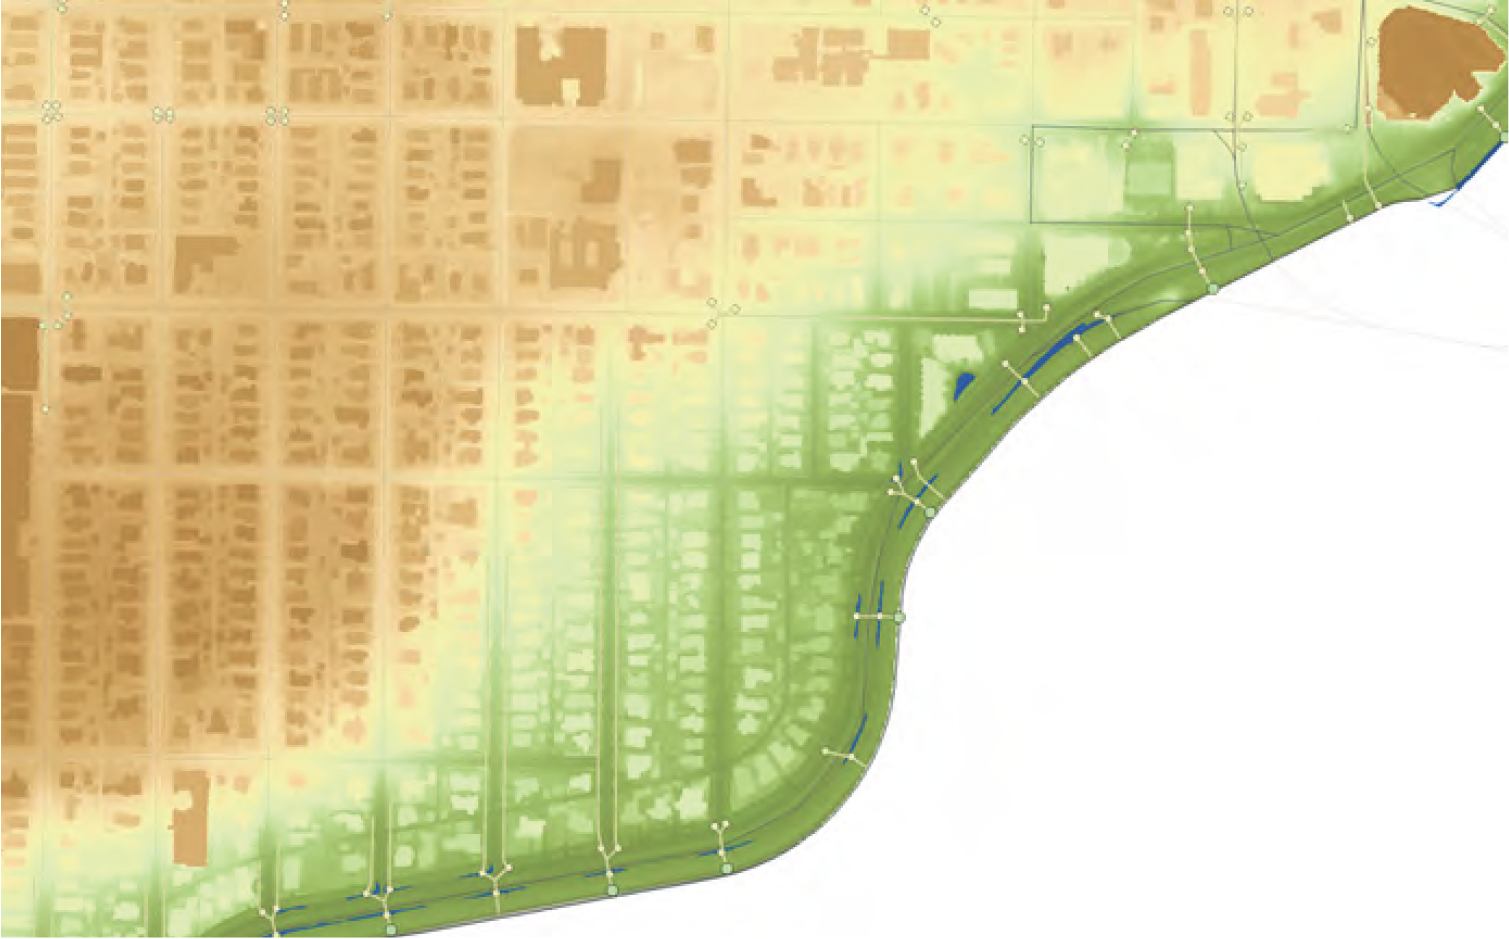
the bridge location is projected to be within the 2070 intermediate high scenario (elevation 4.76 feet NAVD88), as is Davis Islands Boulevard on the island side of the bridge (approximately 4.6 feet NAVD).
No other medical facilities are projected to be impacted by sea level rise.
Rainfall
No structures are projected to be impacted by the current 100-year rainfall scenario. Some facilities may be impacted because of access limitations during extreme rainfall events. This includes:
- Tampa General Hospital – It was recently affected by Bayshore Boulevard closure during a storm on September 4, 2024, when Tampa Airport received 4.58 inches of rain within a two-hour period. For reference, the current 25-year scenario is 7.9 inches of rain within a 24-hour period. The roadway access is affected on all sides by the 100-year rainfall event, except where there are direct connections between the hospital and West DeLeon Street.
- Memorial Hospital of Tampa is situated within an area with potentially significant rainfall flooding.
- Shriners Hospital for Children at University of South Florida would potentially have access limitations.
Storm Surge
The only hospital directly impacted by storm surge scenarios would be Kindred Hospital in South Tampa, which is a small medical facility. It is slab on grade construction.
Tampa General Hospital may also be impacted but has raised its primary facilities and utilities above the 100-year scenario. Access would be the most pressing impact, with Bayshore Boulevard becoming increasingly vulnerable as sea level elevations increase and bridges age.
Future vulnerabilities, costs of impacts, and adaptation options a separate report has been prepared.
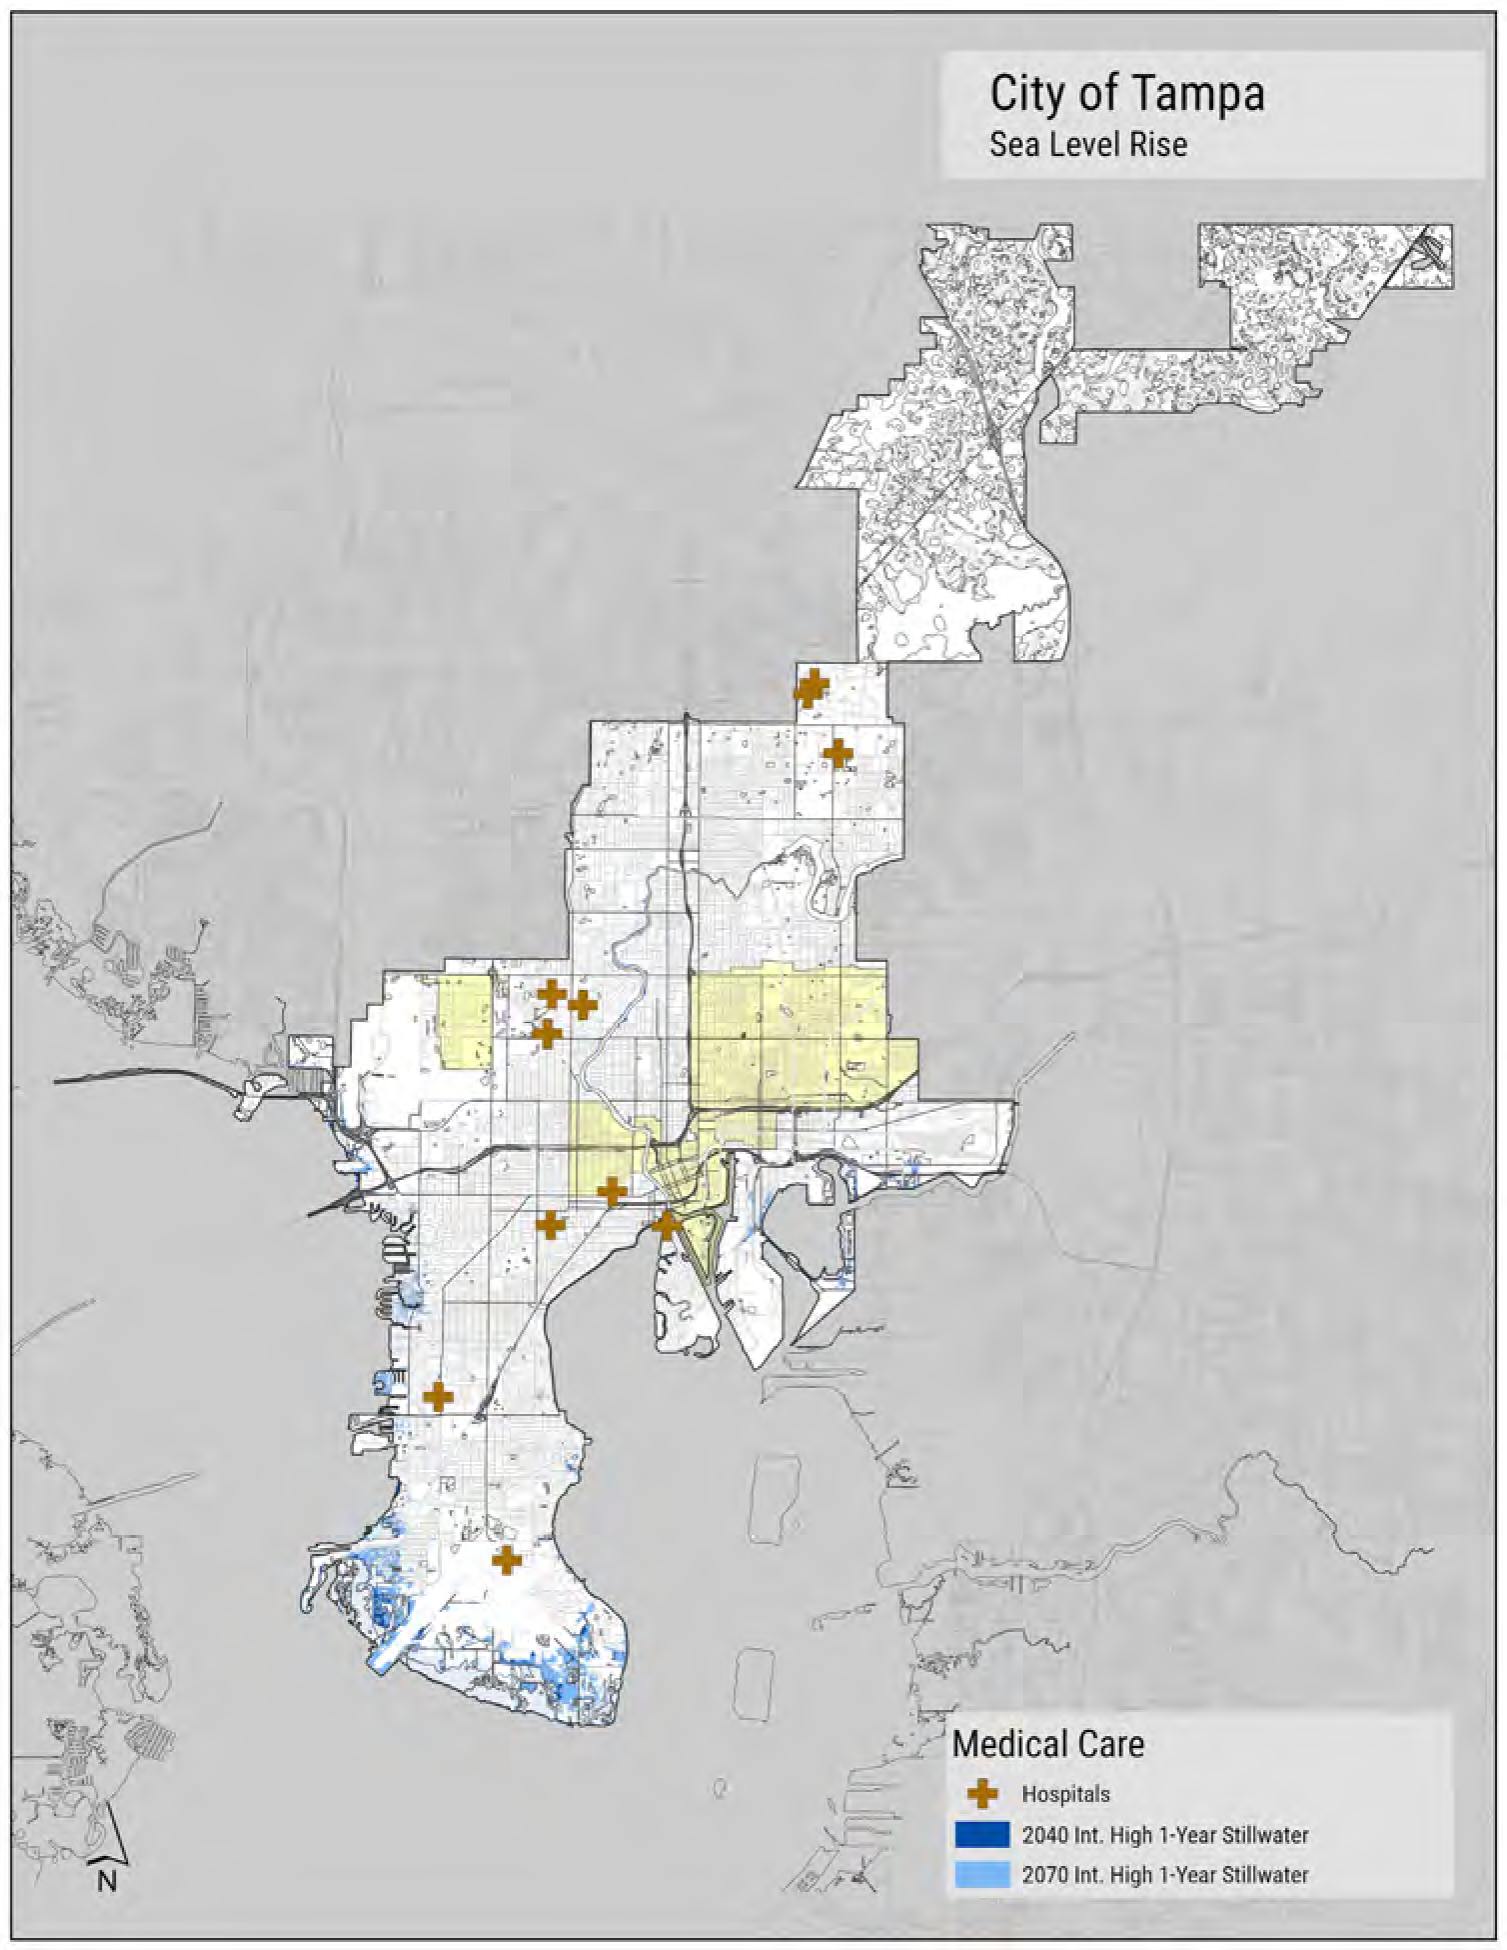
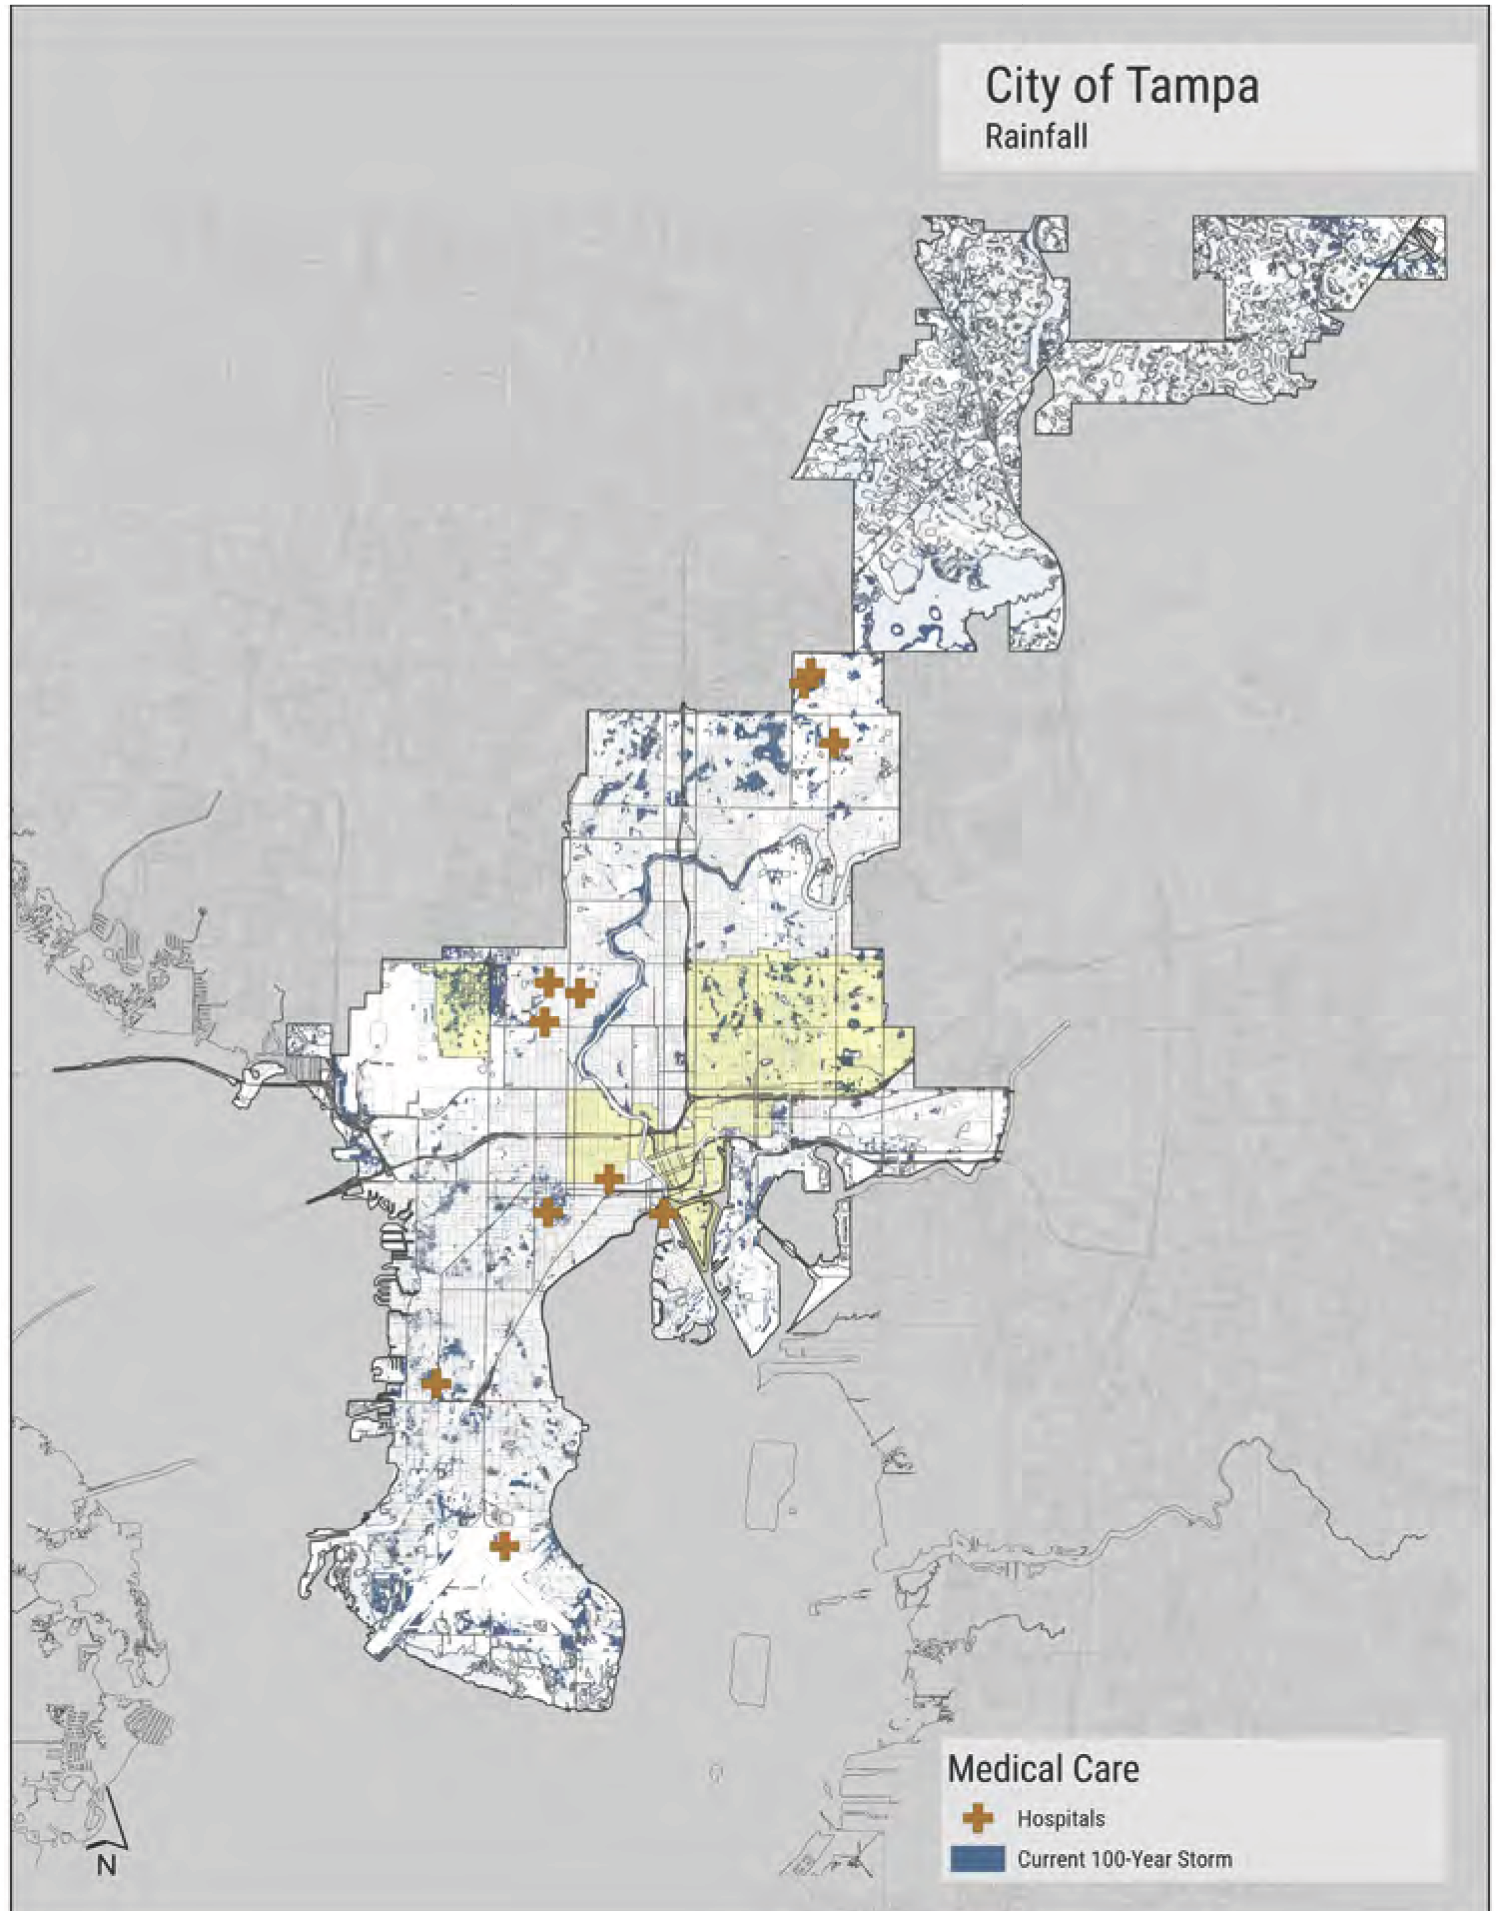
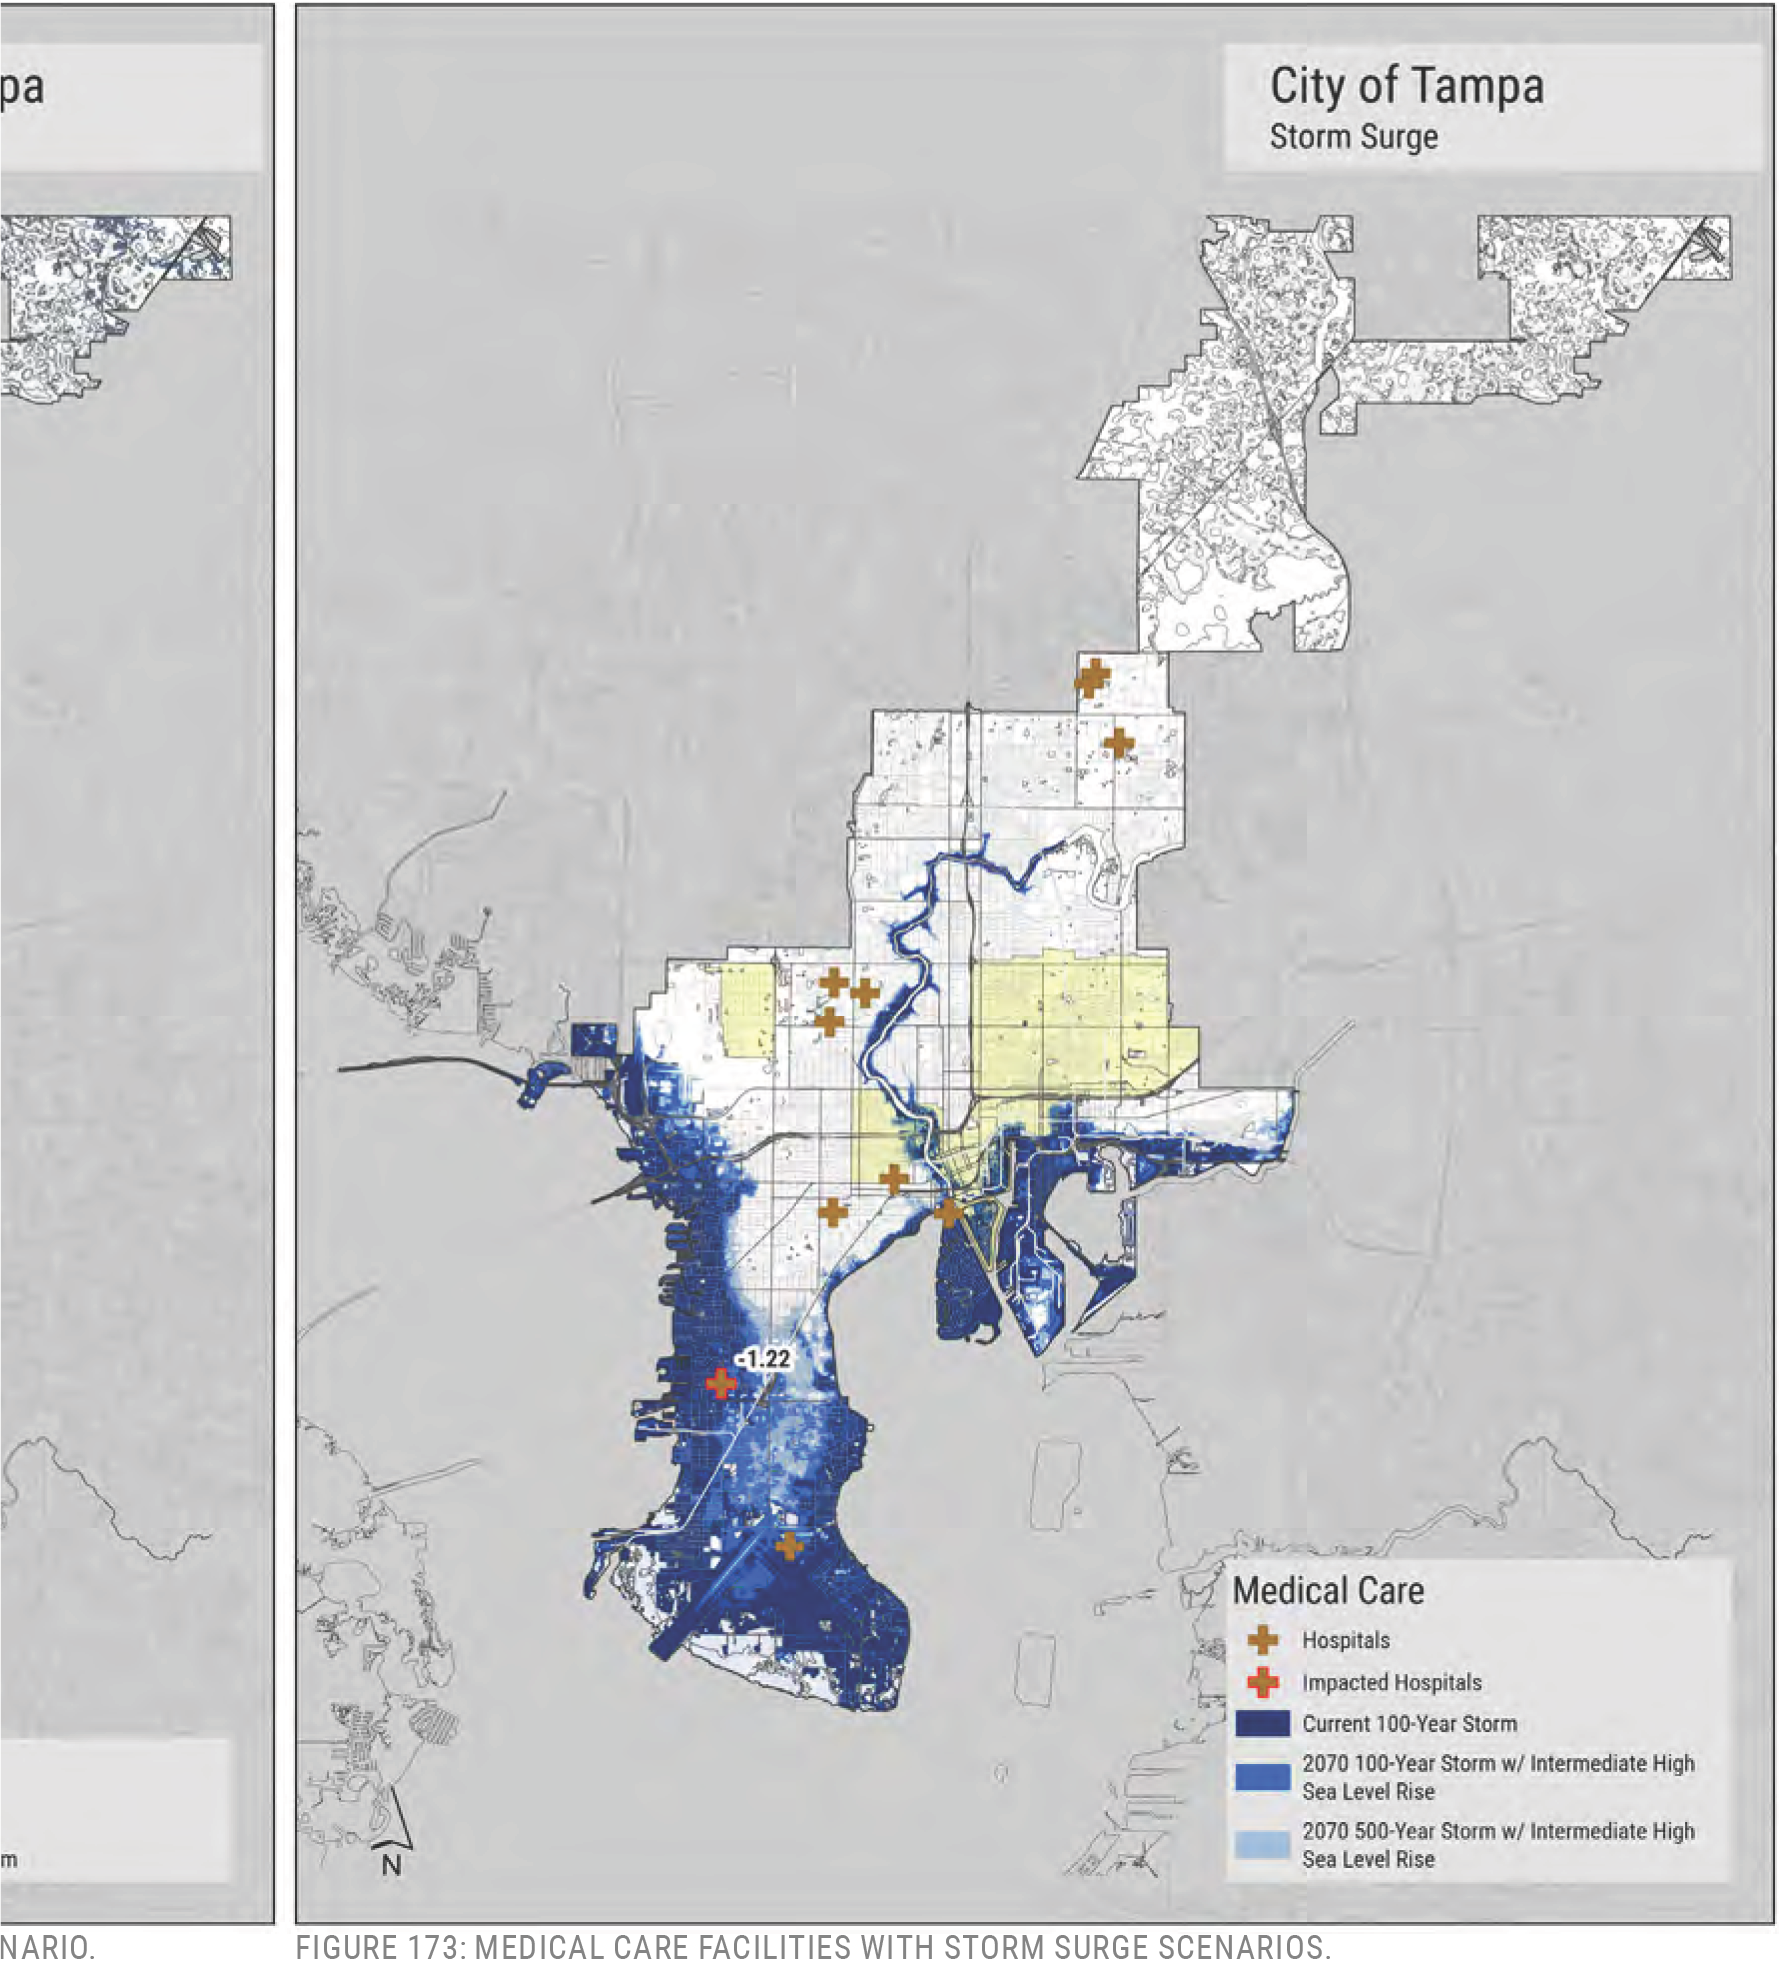
INDUSTRIAL SITES
These uses are distributed throughout the city but are mostly concentrated within a few areas. They are economic drivers and provide local jobs but are also a point-source for pollutants when flooded.
FINDINGS
Sea Level Rise
Two locations where industrial sites are concentrated and could be regularly impacted by higher sea levels includes:
- The south end of Palmetto Beach near the port entry.
- Port Tampa City
Rainfall
Areas with a high potential for rainfall impacts include:
- Drew Park
- Historic Ybor City between 22nd Street and the Connector
- Port Tampa City
- Near 19th and Columbus in East Tampa
Storm Surge
The establishment of Tampa’s port figures significantly in the city’s history. Much of its early economic advancement was due to maritime and industrial activities. There are a number of industrial uses located along the city’s coastline, which could be impacted by significant storm surge events. Focus can be put on the following areas:
- Near the port, into Ybor and East along Adamo Drive
- Port Tampa City
- The area just south of the Airport
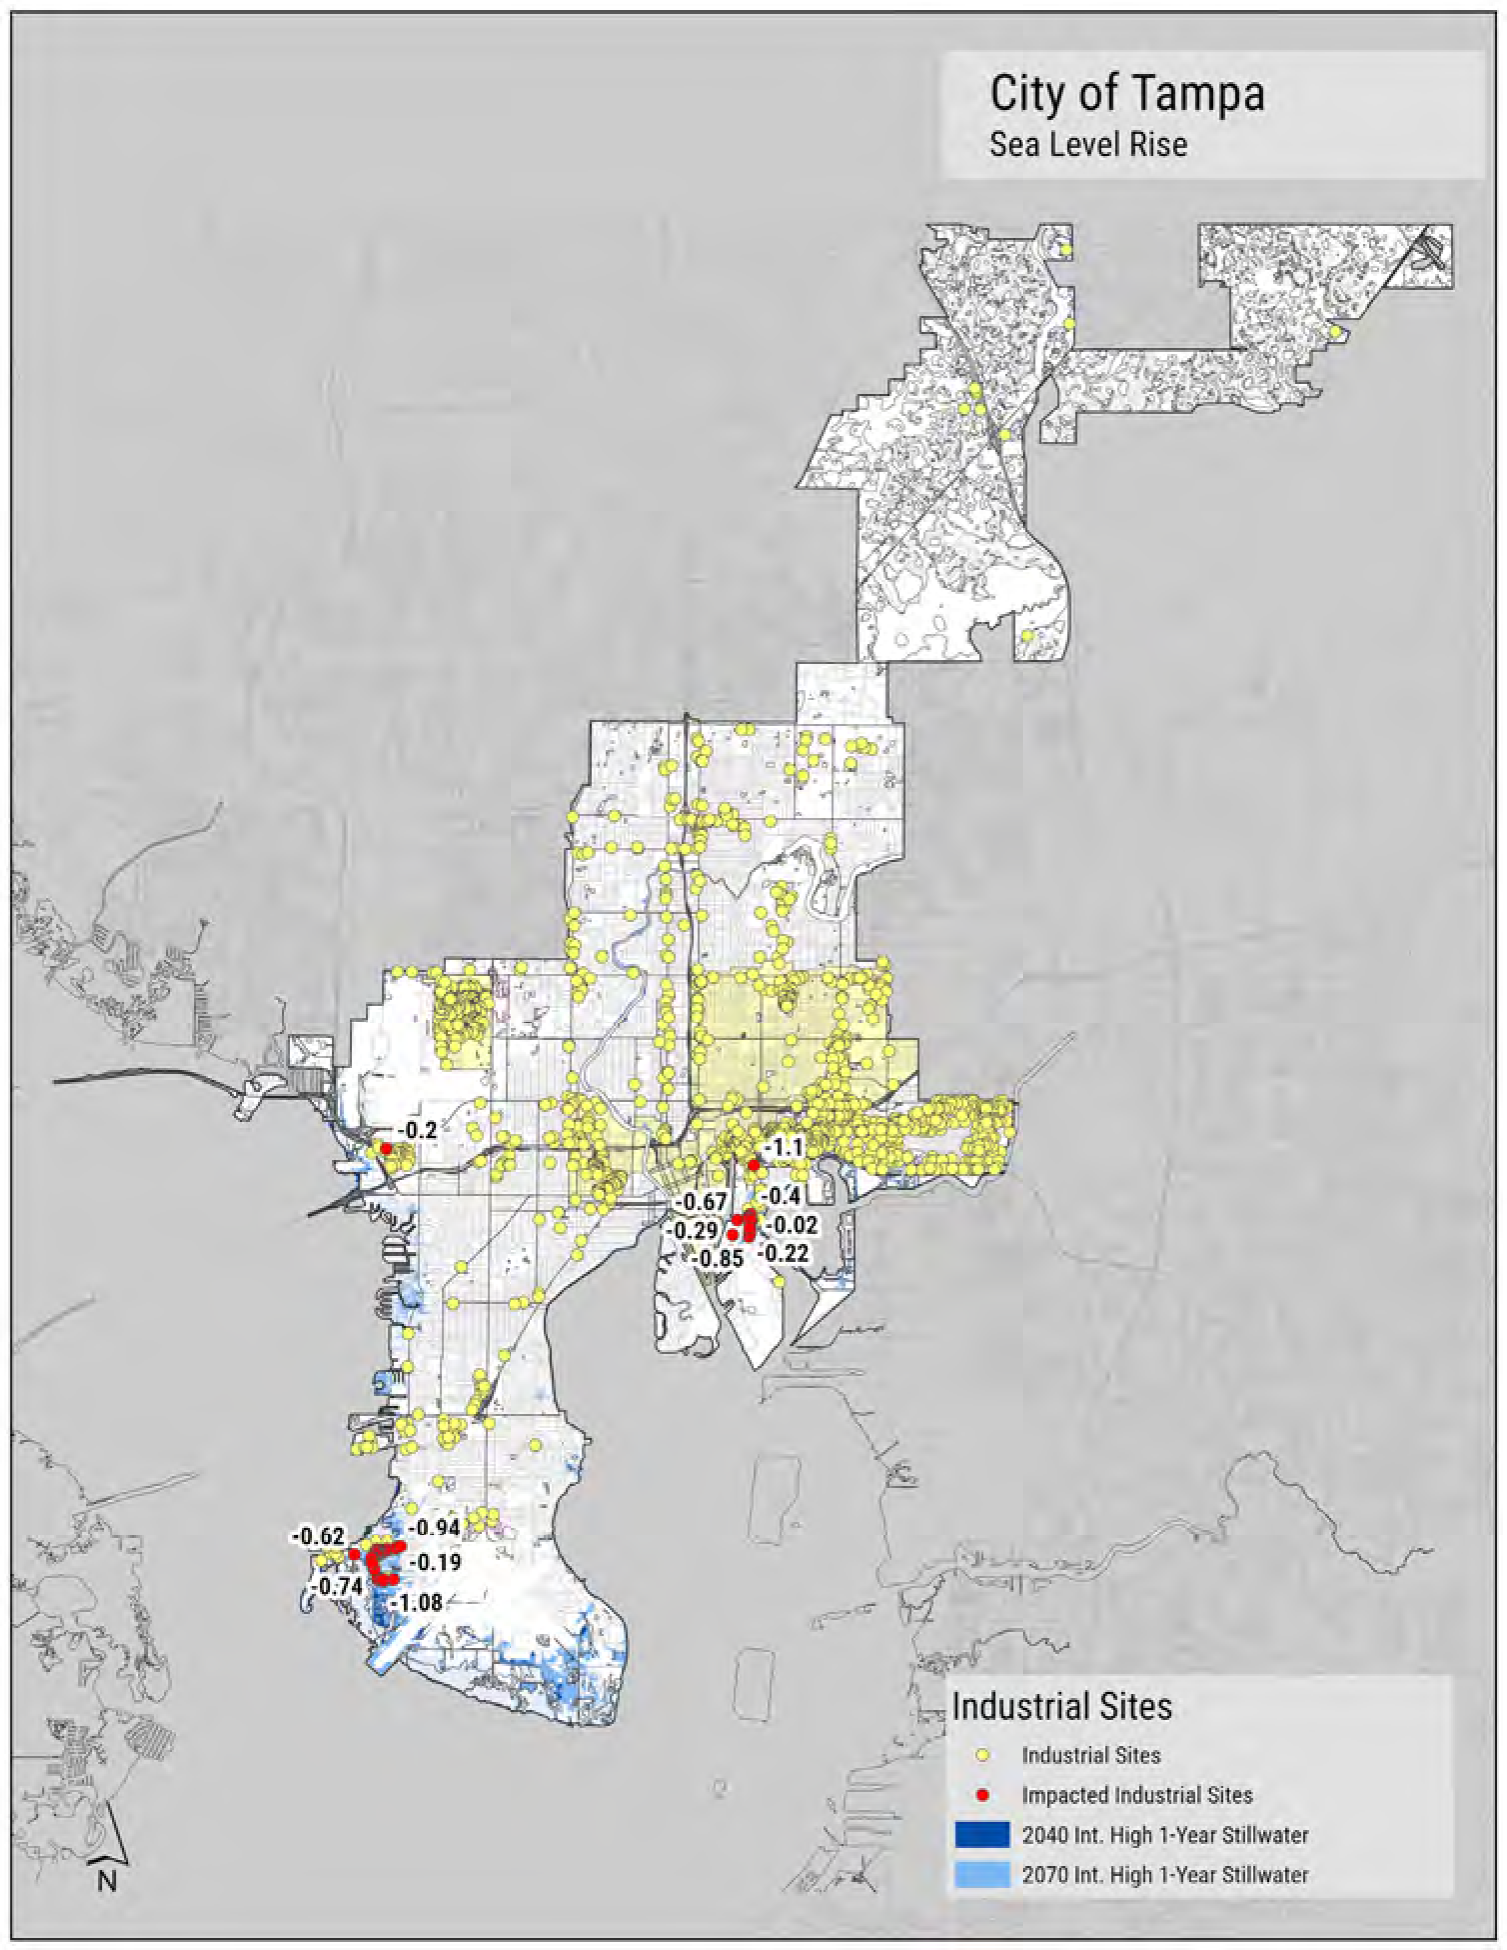
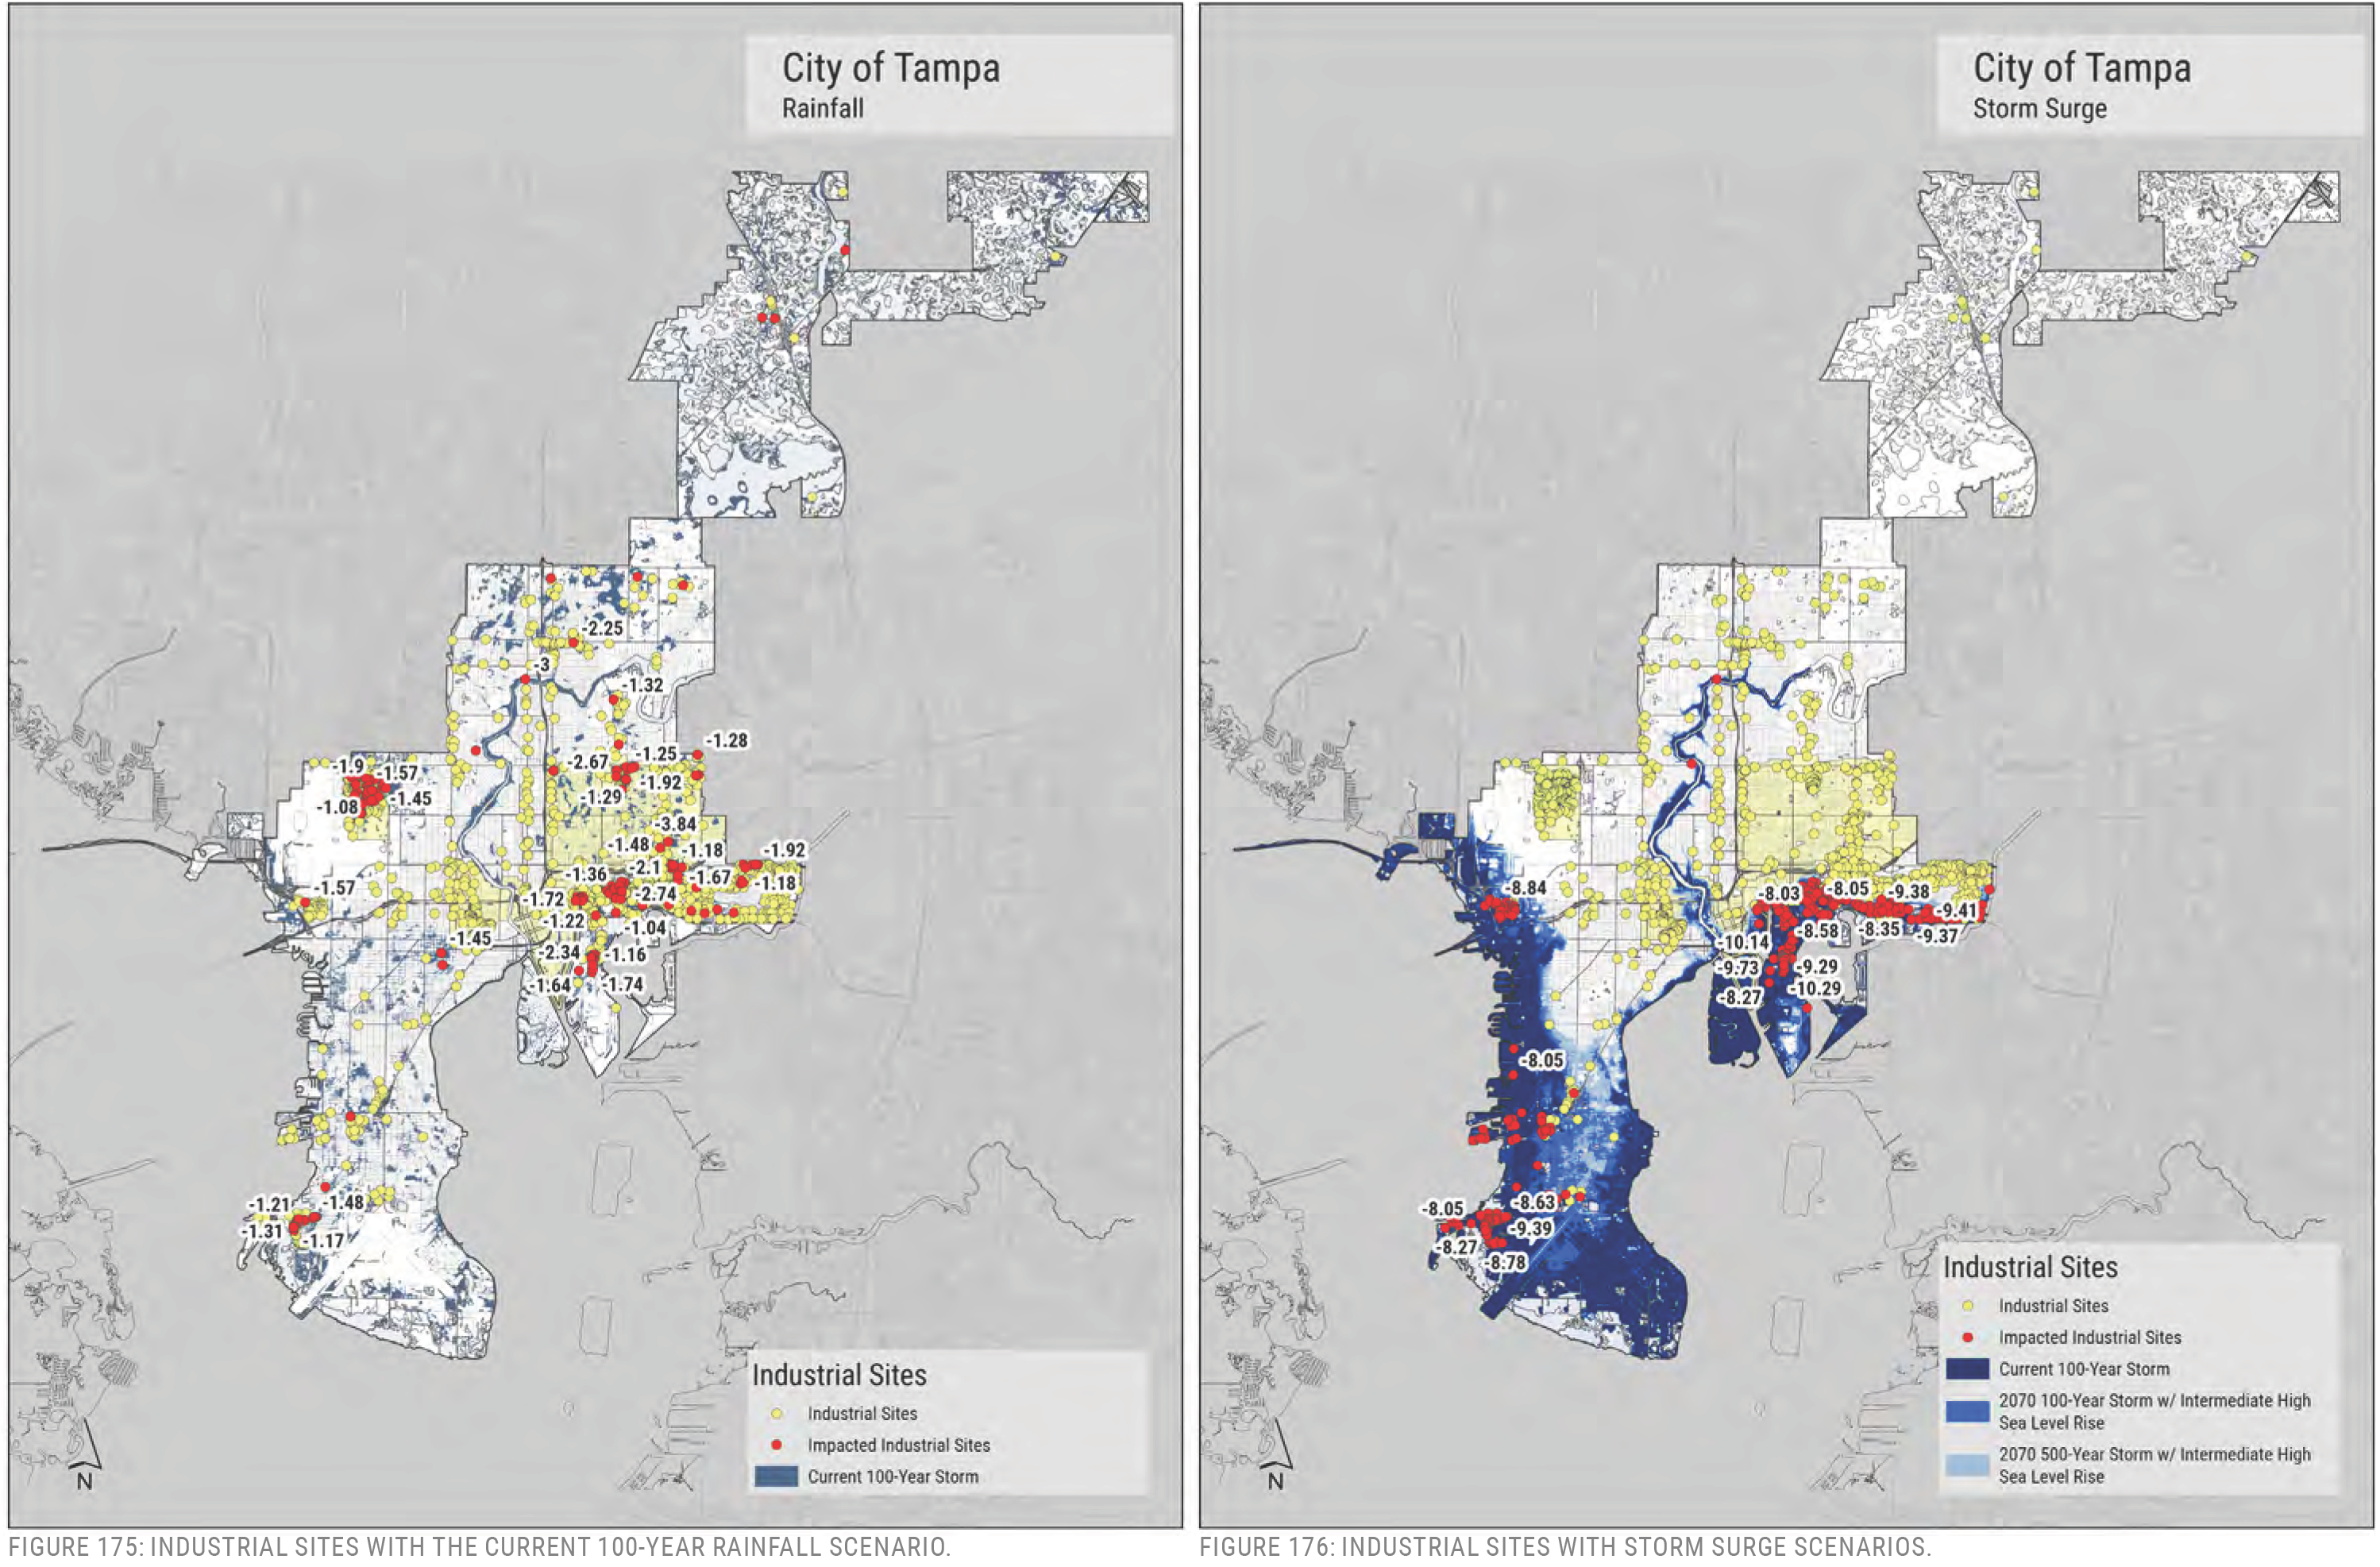
City of Tampa Rainfall iJ -11�·, w �� � � Industrial Sites Industrial Sites � Impacted Industrial Sites ■ Current 100-Year Storm
City of Tampa Storm Surge Industrial Sites �� � Impacted Industrial Sites � � [■ Current 100-Year Storm � 2°70 100-Year Storm w/ Intermediate High Sea Level Rise 2070 500-Year Storm w/ Intermediate High Sea Level Rise
COMMERCIAL SITES
Tampa’s commercial zones are mostly located along major transportation corridors, with a few exceptions in downtown, Hyde Park Village, Ybor City, and Drew Park. These areas supply goods and services that support the daily life of the city. Some are also important for preparation and recovery from disastrous events like hurricanes. These sites are typically at grade (not raised) with street access, making them vulnerable to surface level flooding. Impacts may decrease the availability of materials available and may also influence the economic prosperity of the city and its people.
FINDINGS
Sea Level Rise
Sea level rise scenarios reveal minimal impact on commercial areas within the City of Tampa. A few areas with concentrated vulnerabilities include:
- Palmetto Beach
- Port Tampa City
Rainfall
Areas with risk to rainfall flooding includes:
- Drew Park
- Palma Ceia Pines
Storm Surge
The city’s commercial core is mostly outside of the area affected by the 100-year storm surge scenario. Areas that would be affected include:
- Gandy Boulevard and areas south
- Manhattan and Westshore boulevards south of Estrella Street
- The Westshore and Tampa International Airport neighborhoods
- Palmetto Beach
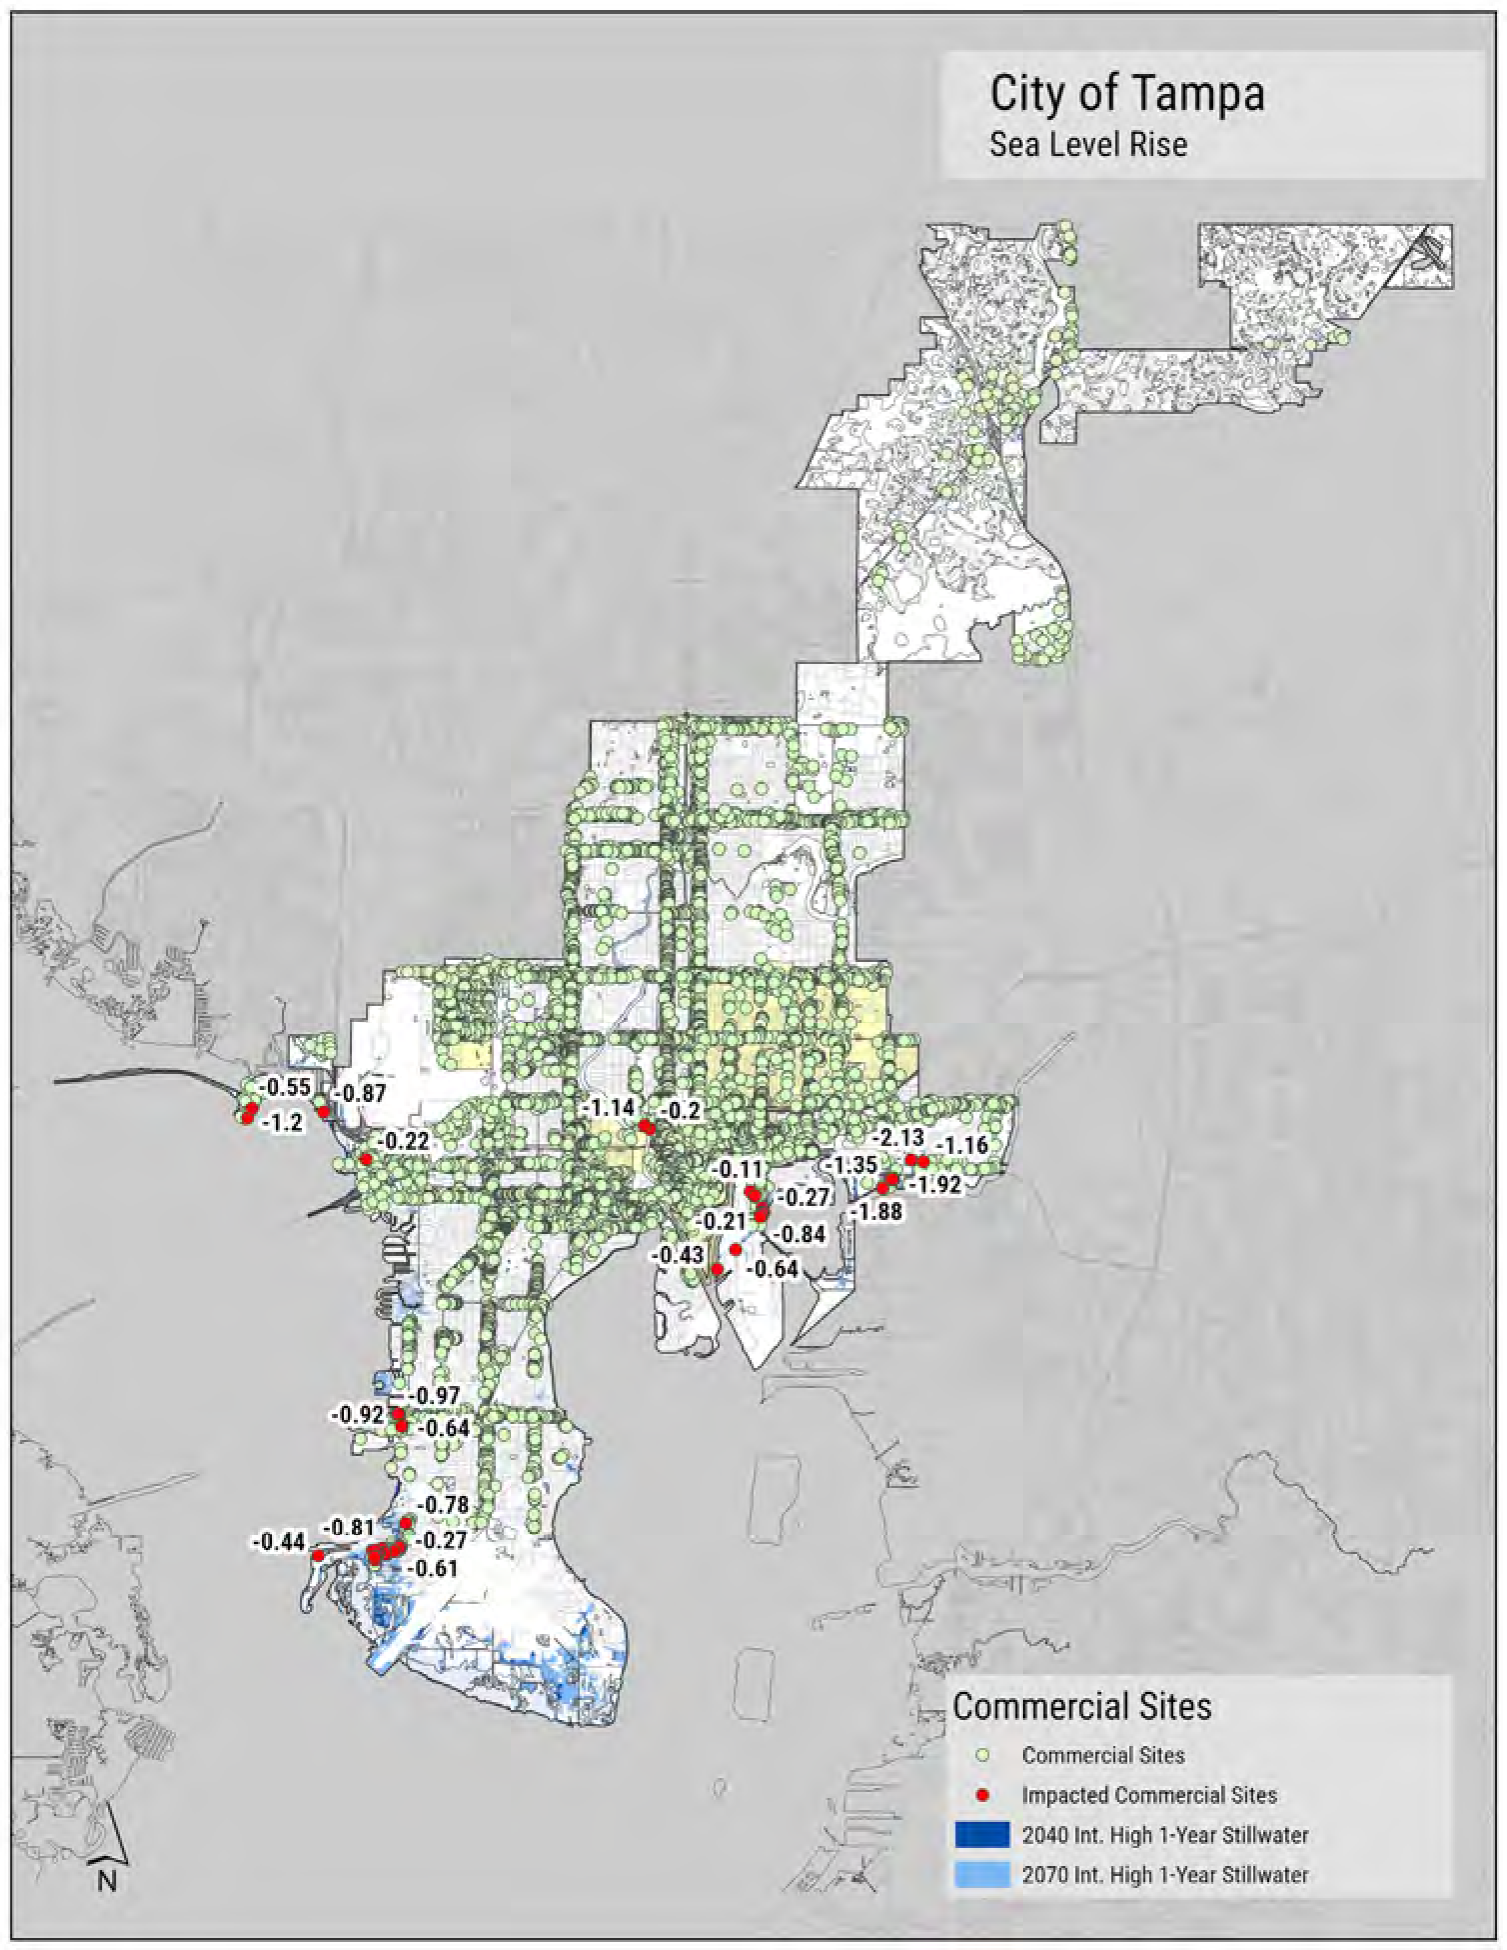
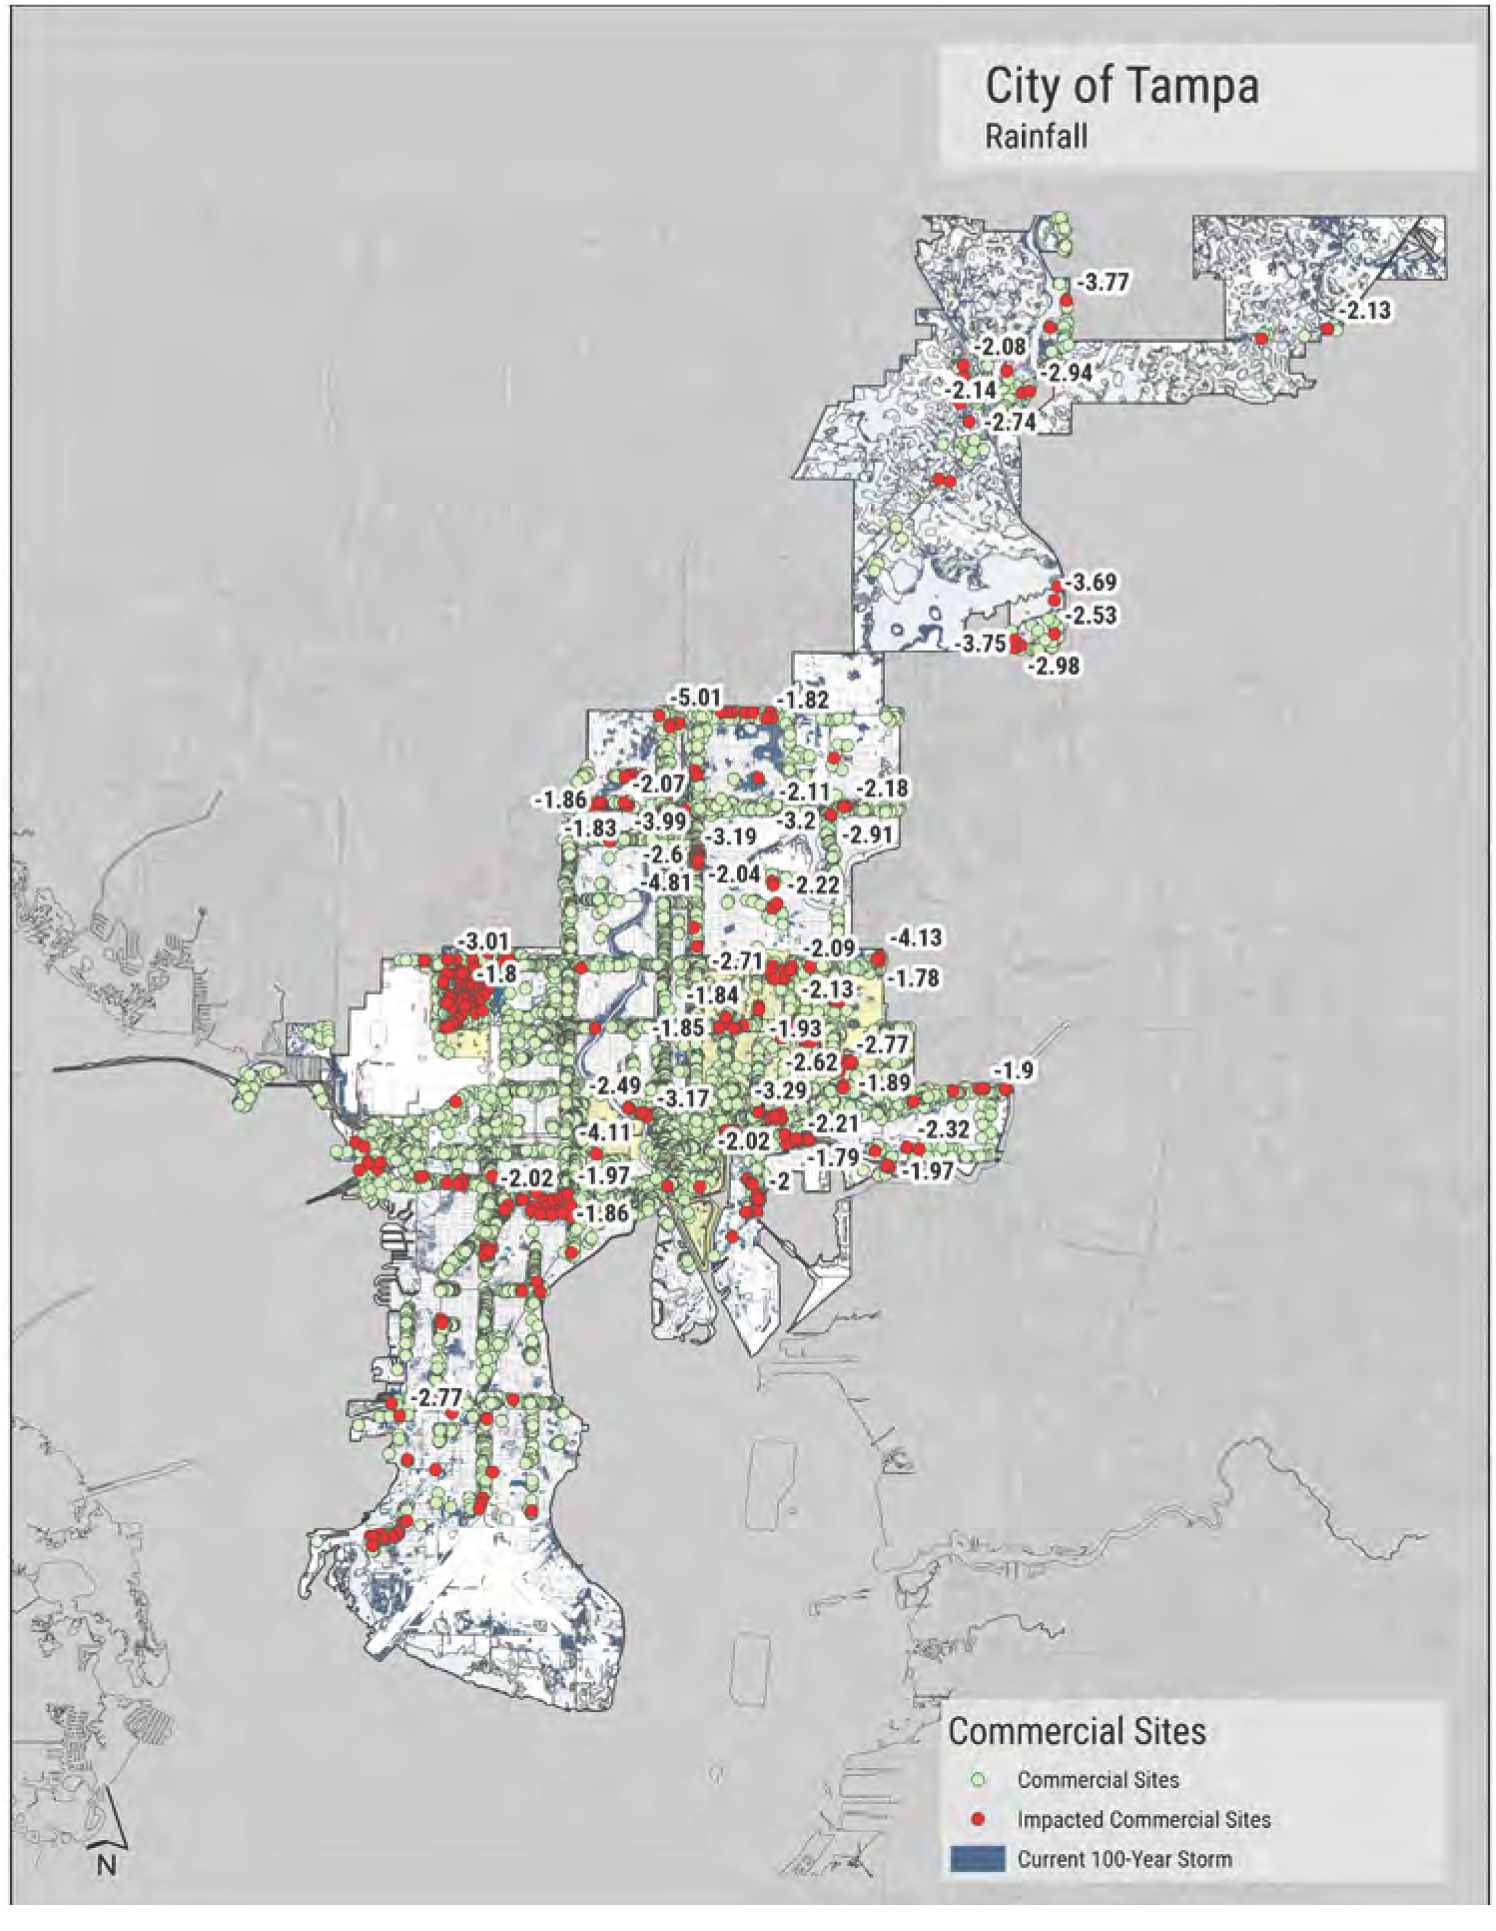
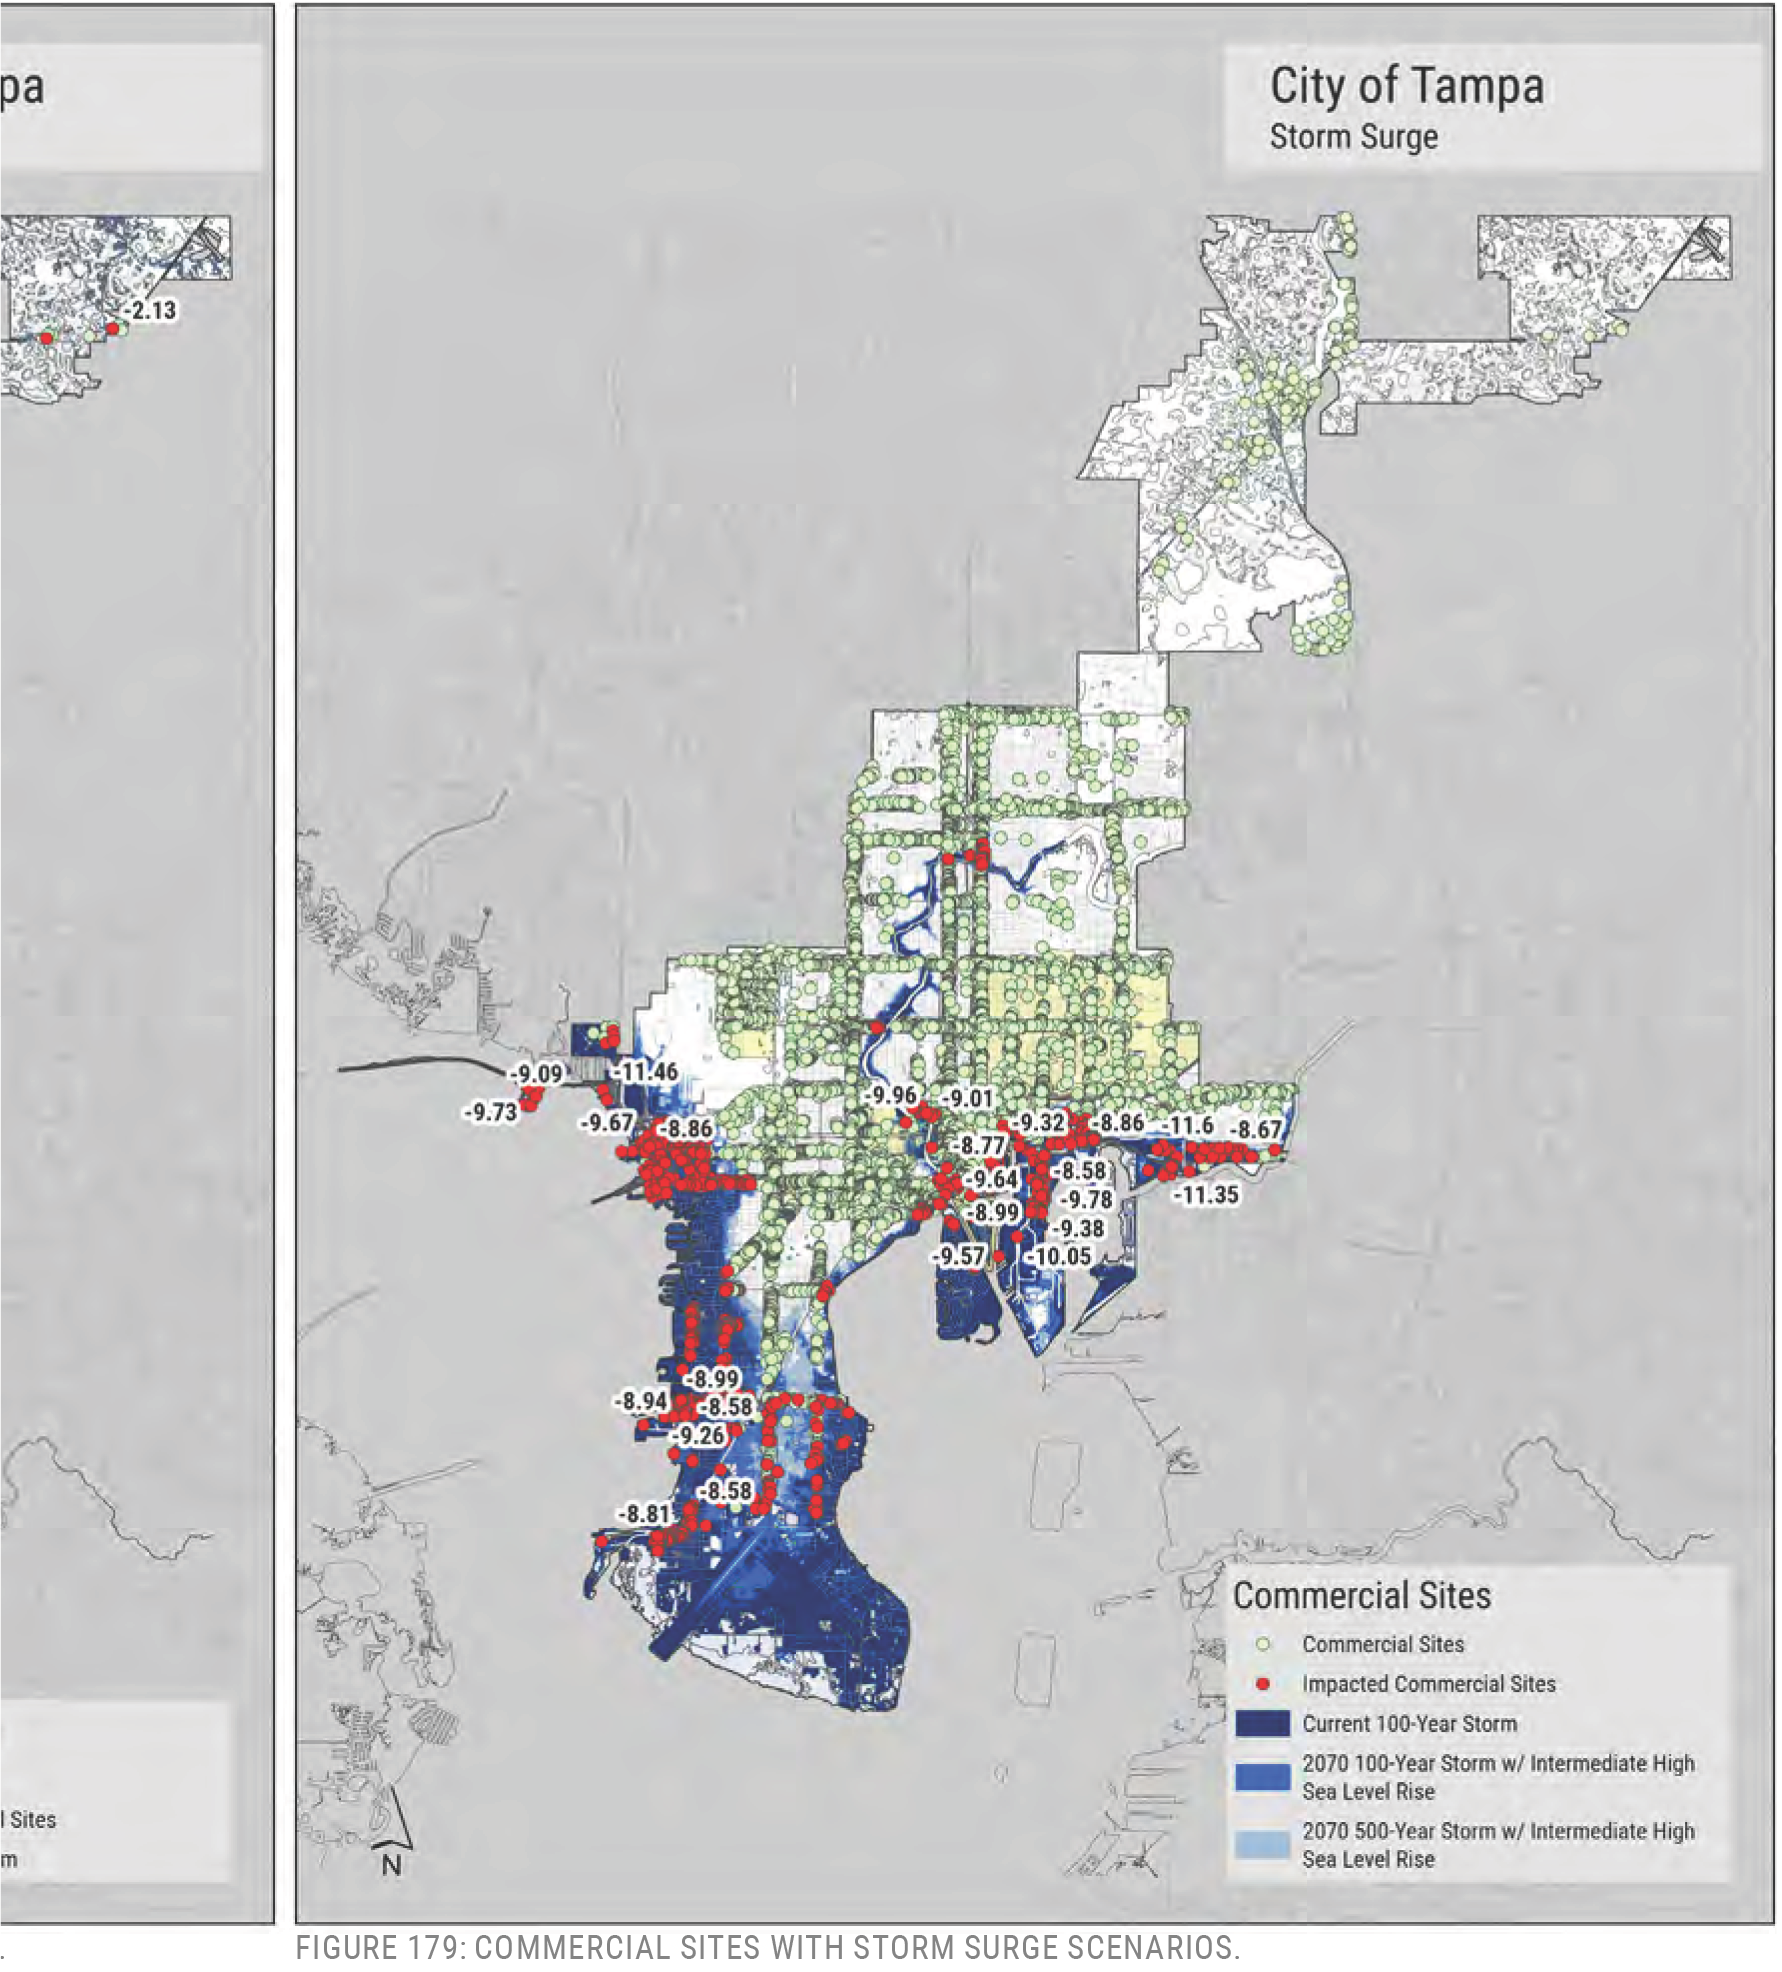
VULNERABLE BY HOUSING TYPE
Housing programs aimed at assisting vulnerable communities provide shelter for those in financial need, that are aged, or that rely on assistance for health purposes. This type of housing is spread through the city with most facilities outside of major flood zones. In times of flooding, these housing types may need special assistance from emergency services personnel, adding to the duties already required during a hazardous event.
Specifically, six types of housing were evaluated: retirement homes, affordable public housing, homeless shelters, assisted living facilities, mobile homes, and Tampa Housing Authority properties. Consideration should also be given to access to these facilities. Many of them rely on medical response services and deliveries of medication.
FINDINGS
Sea level rise and rainfall are not expected to cause significant impacts that would make a facility inoperable. Only single-story facilities that are on-grade would have this type of vulnerability, and this is not common. Two such facilities could potentially include:
- 4018 North Riverside Drive (Tampa Housing Authority)
- 11201 North 22nd Street (Tampa Housing Authority)
Storm Surge
There is greater potential for storm surge to have an impact on vulnerable housing types. In Tampa, this may include (in order of concern):
- 4018 North Riverside Drive (Tampa Housing Authority), with nearly 6.5 feet of surge inundation (depth, with the 100-year, 2070 intermediate-high scenario)
- A cluster of assisted living and nursing homes near Gandy and Manhattan boulevards.
- Hudson Manor on Davis Islands could receive almost four feet of inundation. It is unknown whether this would cause significant impacts.
- The Brookdale Bayshore Assisted Living Facility near Ballast Point, which could have nearly two feet of water inundation (with the 2070 intermediate-high scenario). It is assumed that this would not significantly impact the facility.
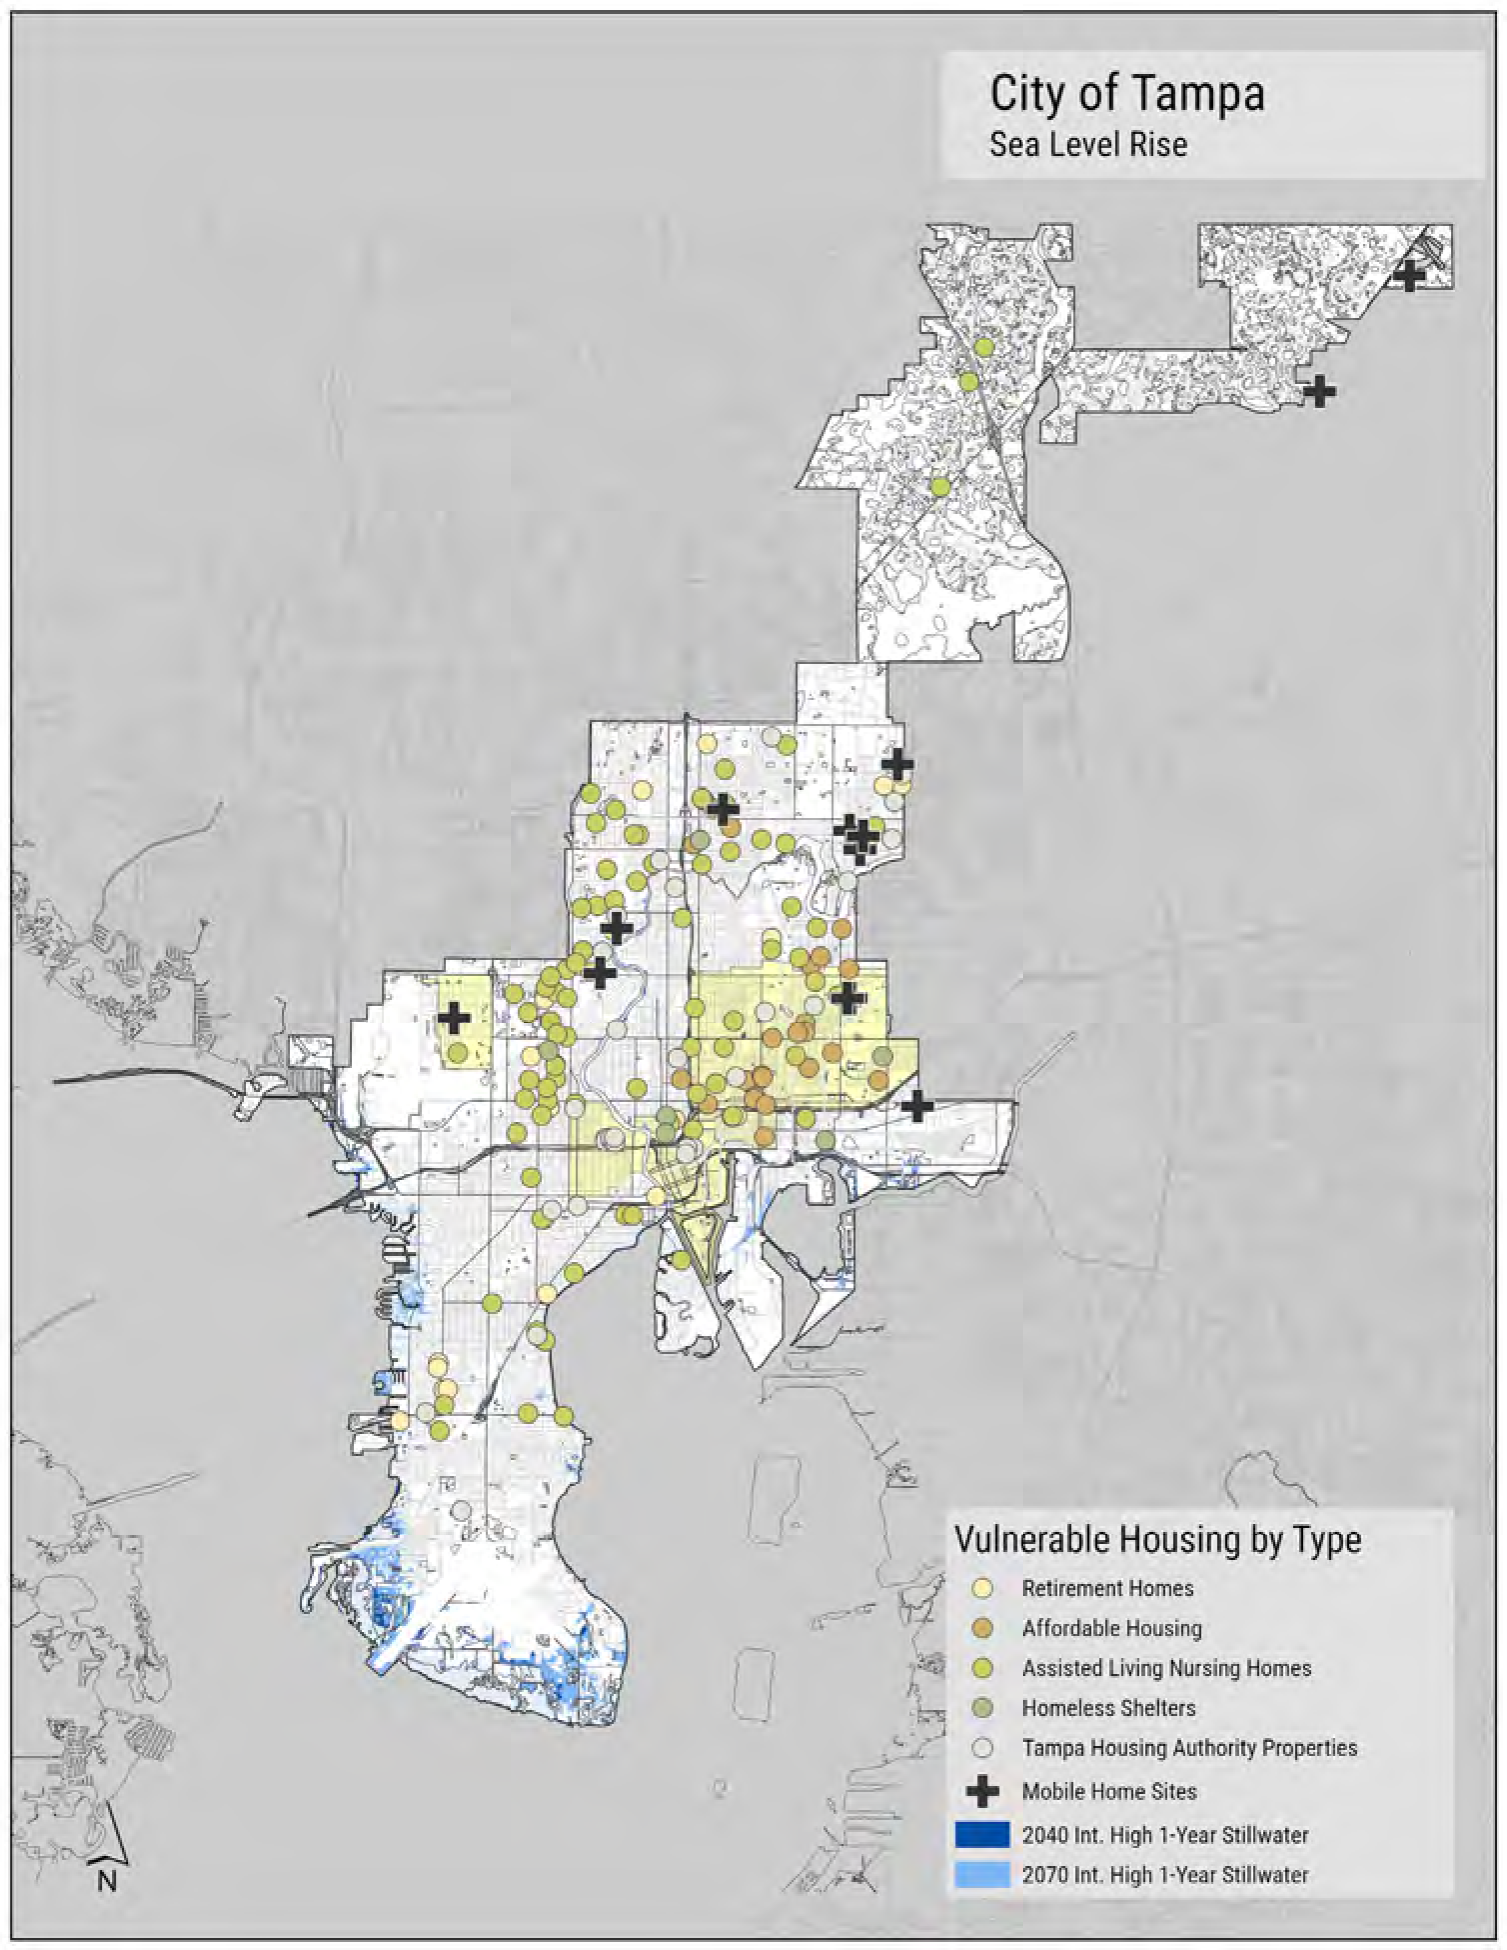
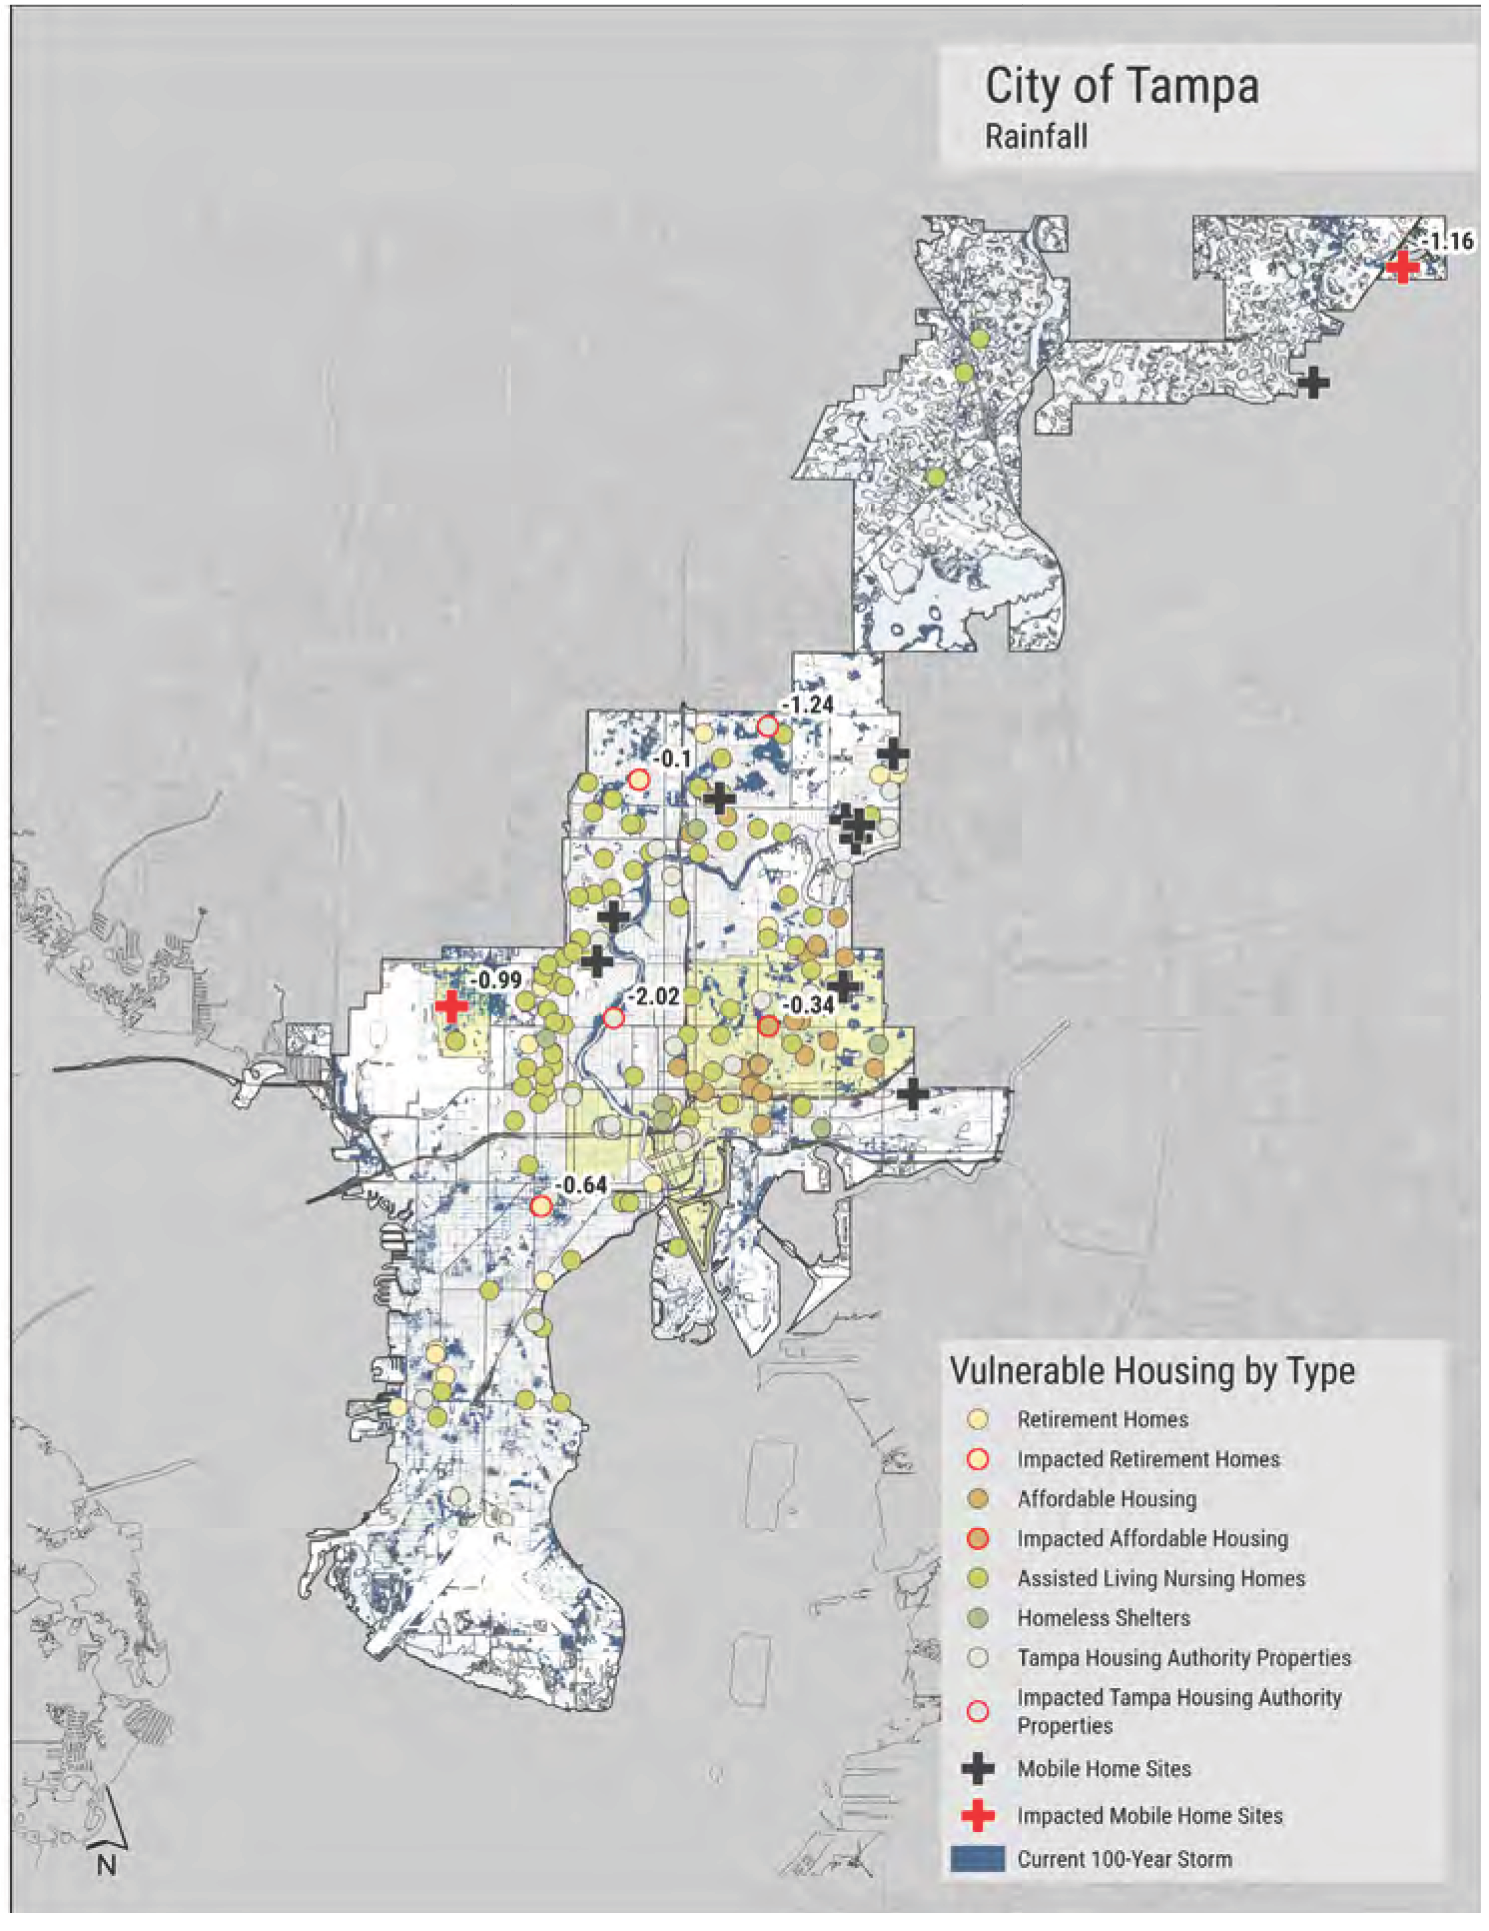
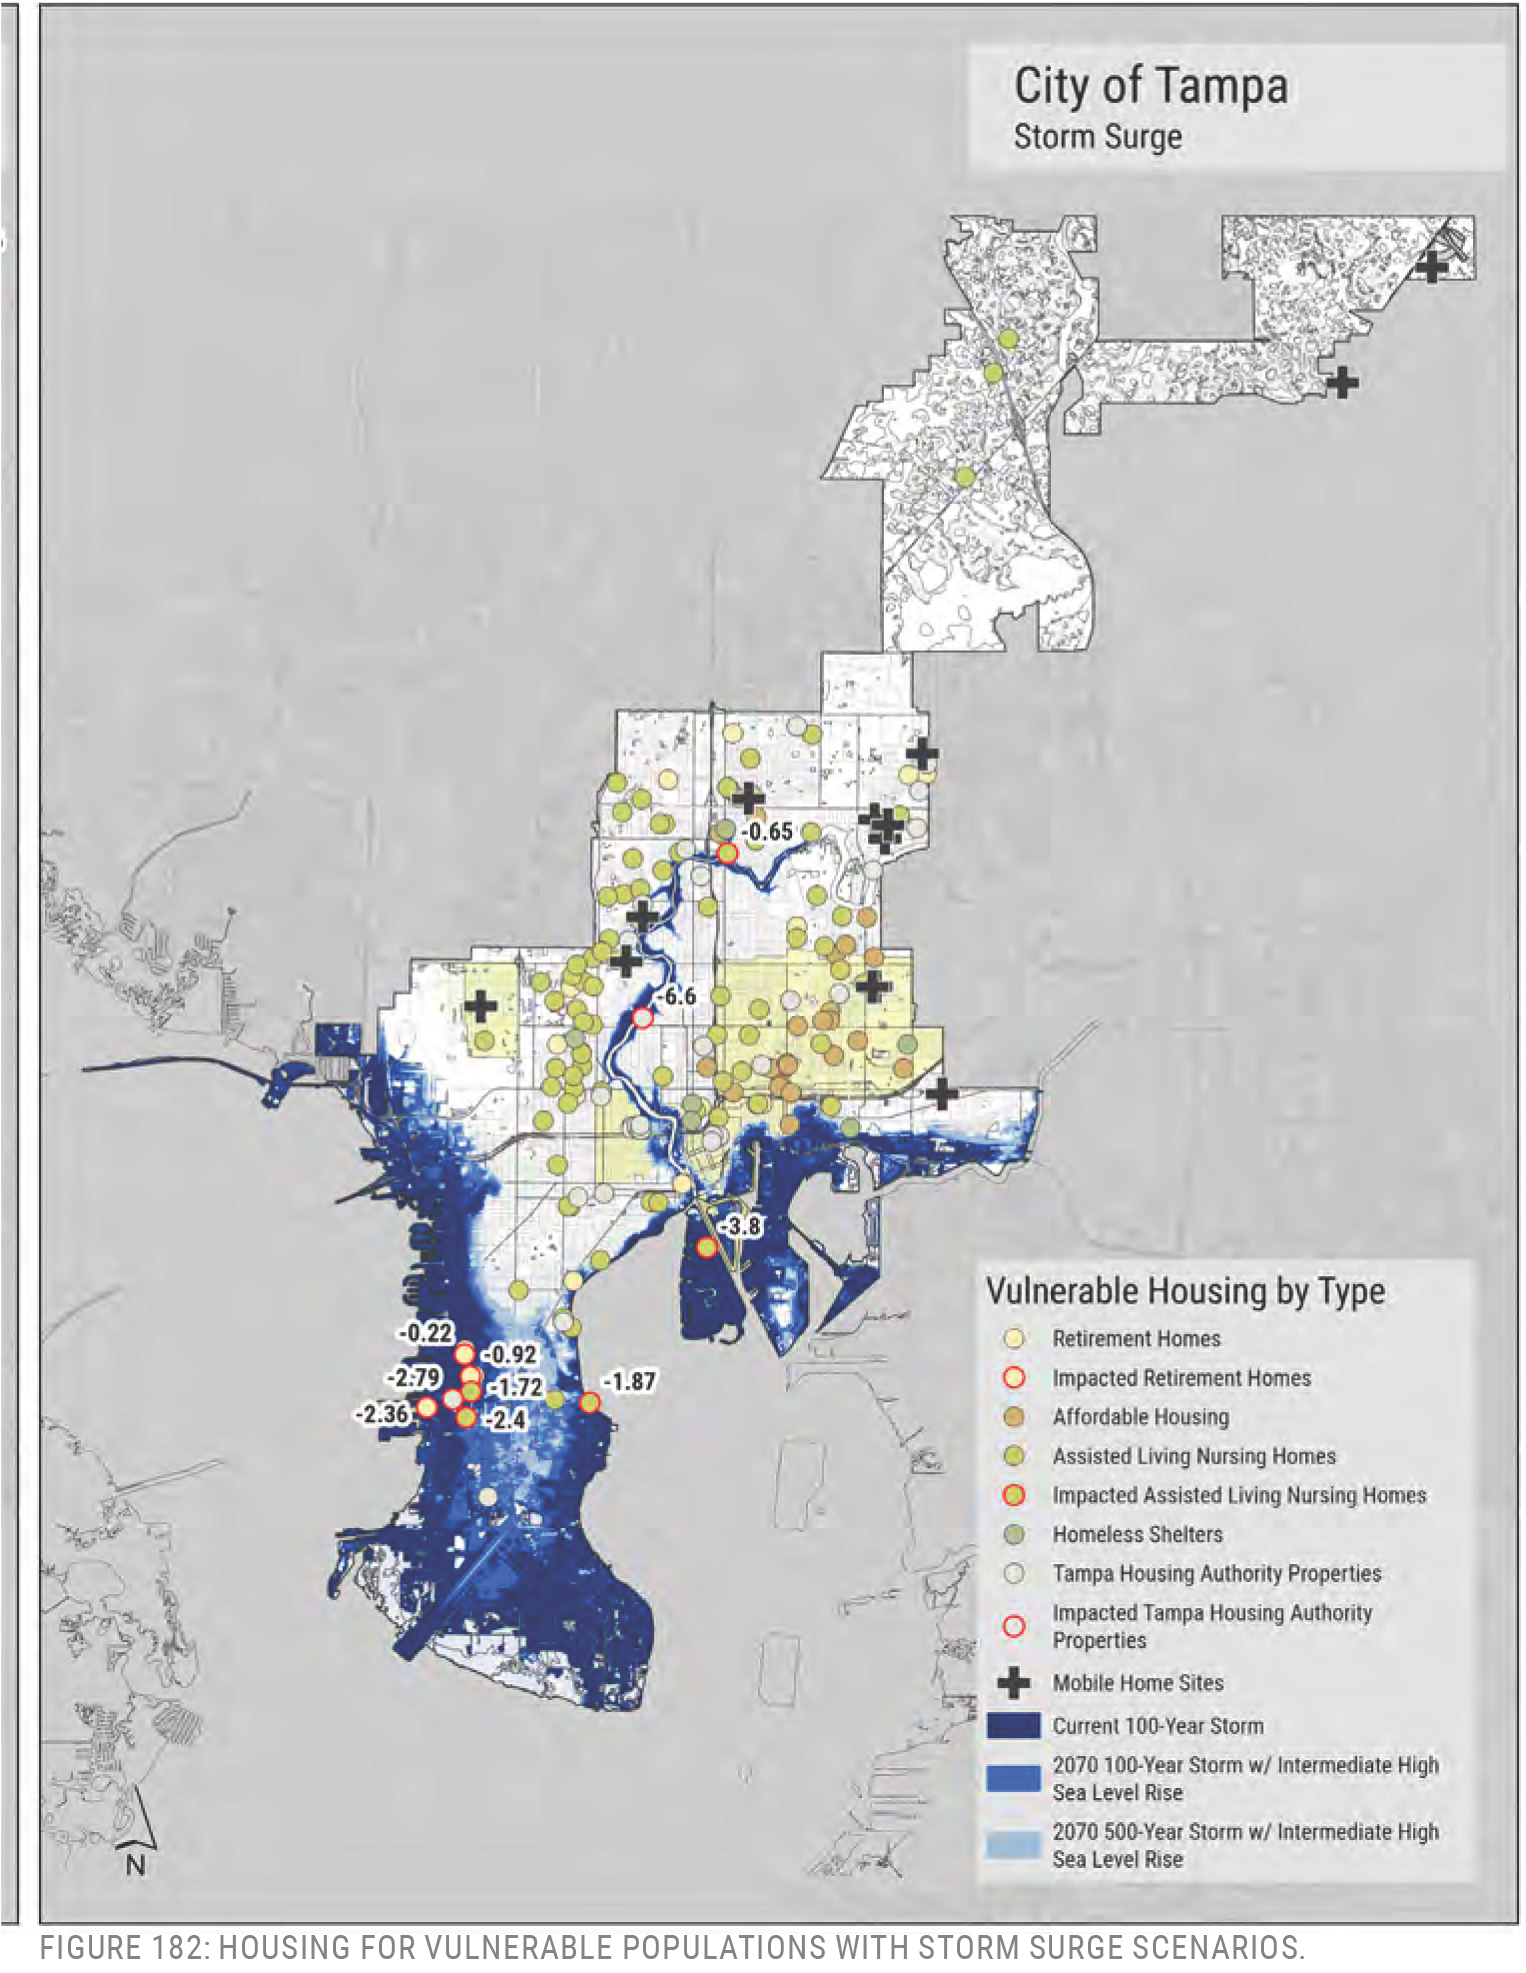
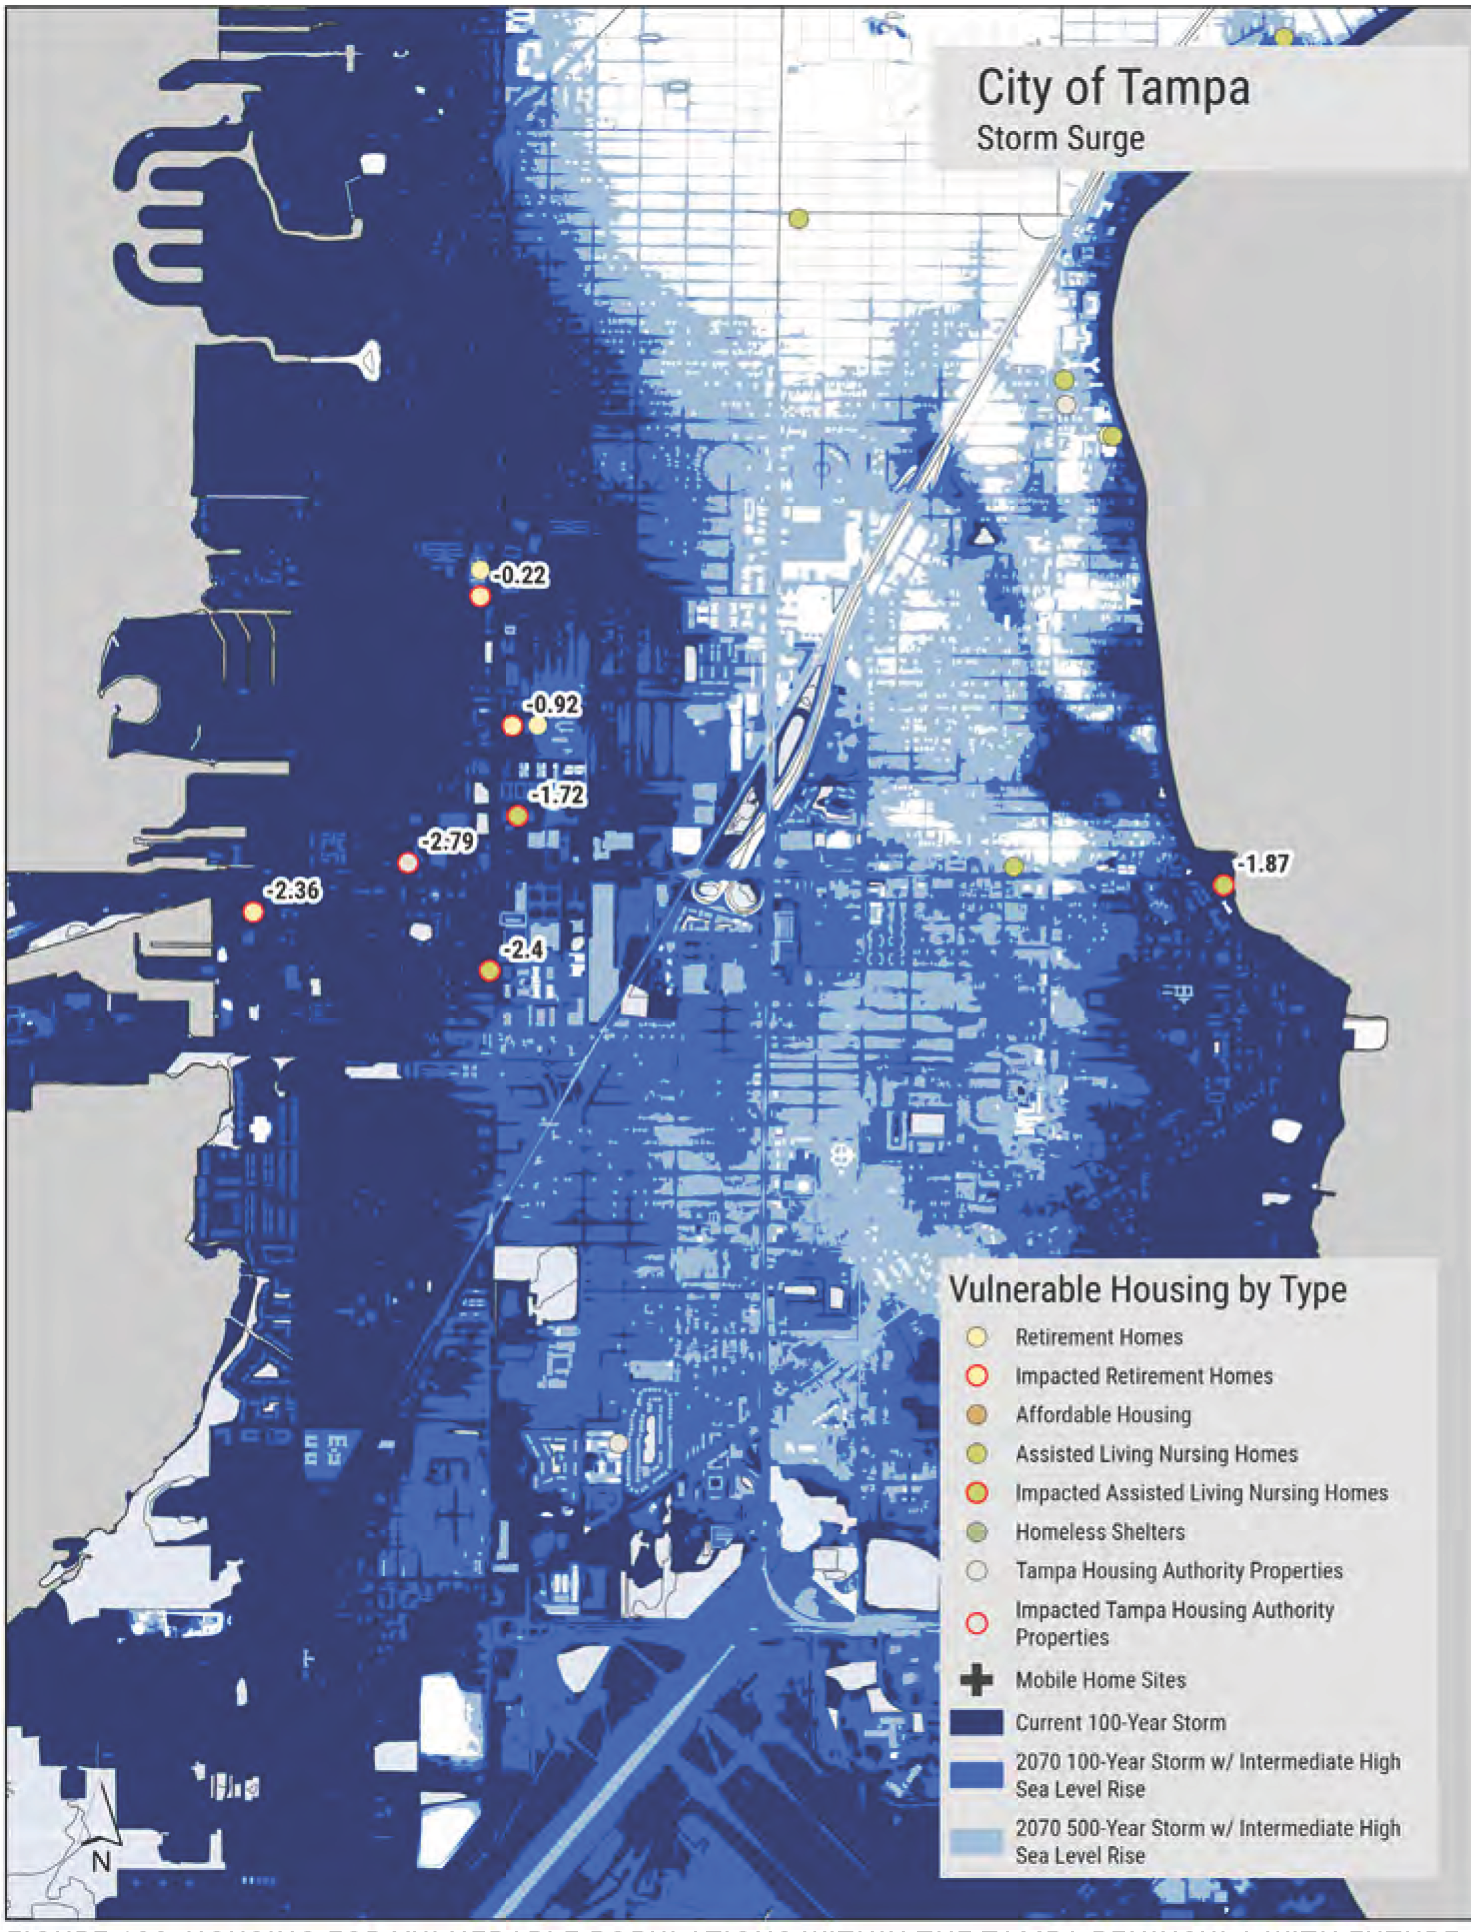
City of Tampa Retirement Homes Impacted Retirement Homes Affordable Housing Assisted Living Nursing Homes Impacted Assisted Living Nursing Homes Homeless Shelters Tampa Housing Authority Properties Impacted Tampa Housing Authority Properties Mobile Home Sites ■ Current 100-Year Storm ■ 2222SE2��"���mew«non 2070 500-Year Storm w/ Intermediate High Sea Level Rise
FIGURE 183: HOUSING FOR VULNERABLE POPULATIONS WITHIN THE TAMPA PENINSULA WITH FUTURE STORM SURGE SCENARIOS. DEPTHS RELATE TO THE 2070 INTERMEDIATE-HIGH SCENARIO.
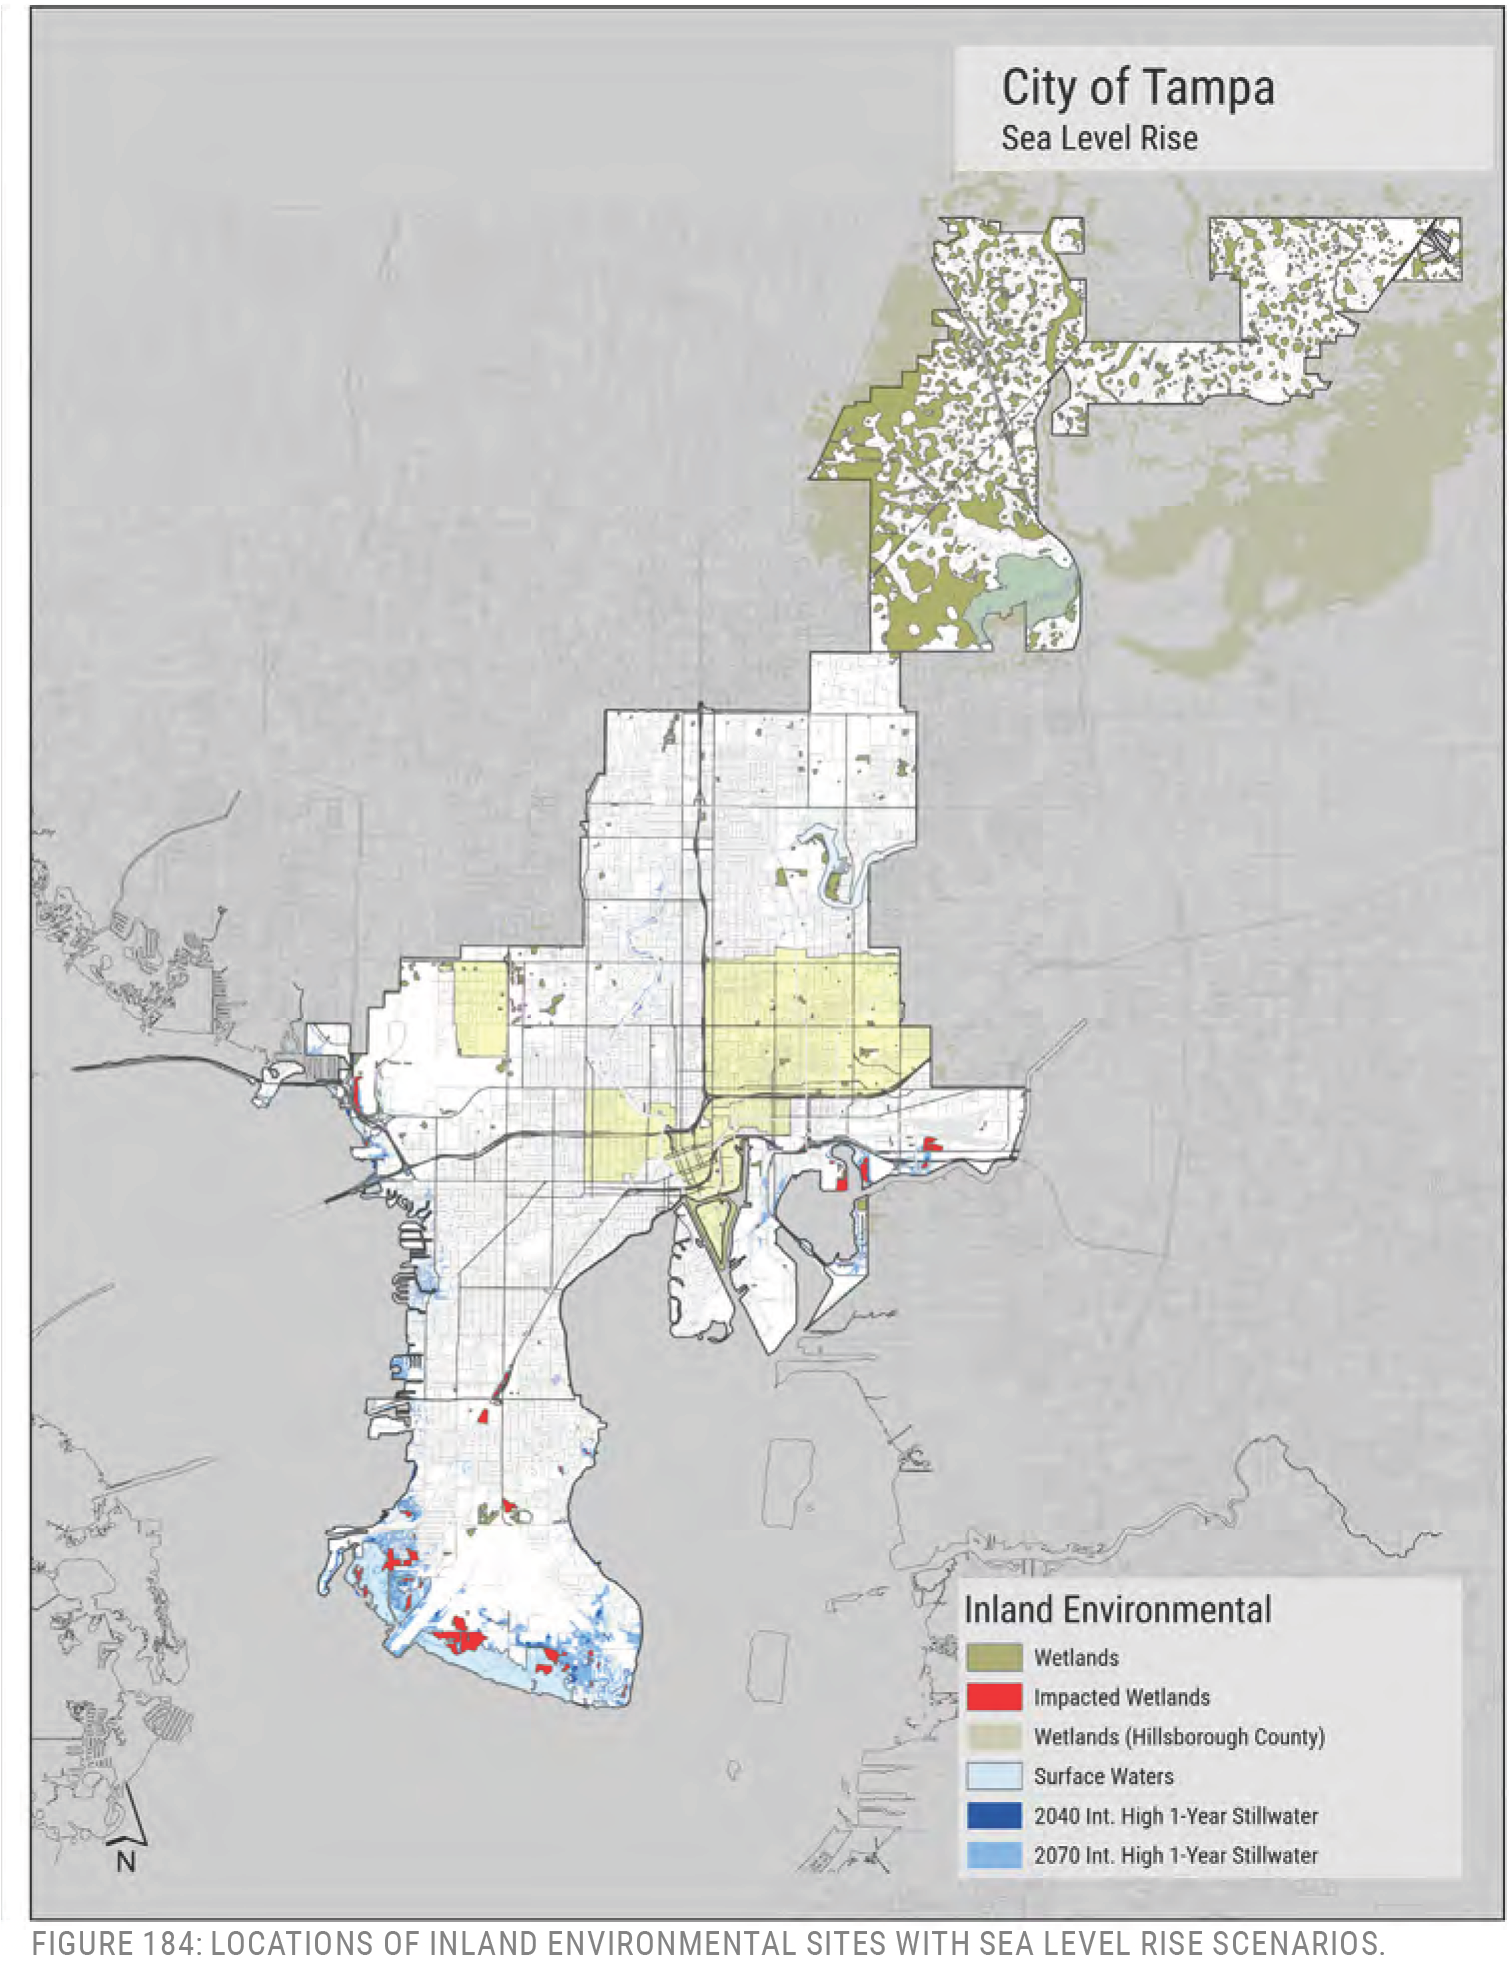
City of Tampa Sea Level Rise inland Environmental wetands Impacted Wetlands Wetlands (Hillsborough County) Surface Waters ■ 2040 Int. High 1-Year Stillwater 2070 Int. High 1-Year Stillwater
FIGURE 184: LOCATIONS OF INLAND ENVIRONMENTAL SITES WITH SEA LEVEL RISE SCENARIOS.
ENVIRONMENTAL
INLAND ENVIRONMENTAL
Surface waters (lakes and ponds) and wetlands are integral to Tampa’s ecosystem of natural environments. Sea level rise may cause change for some of these places as they endure increased exposure to salt water, affecting their composition and function. This map (Figure 186) highlights wetlands that are within the 2070 intermediate-high floodplain, as an indicator of potential change to wetland systems.
COASTAL ENVIRONMENTAL
Coastal environmental assets consist of four categories of land cover: mangroves, marshes, oysters, and sea grass. Map (Figure 187) shows the location of those elements for the consideration of future planning and climate change.
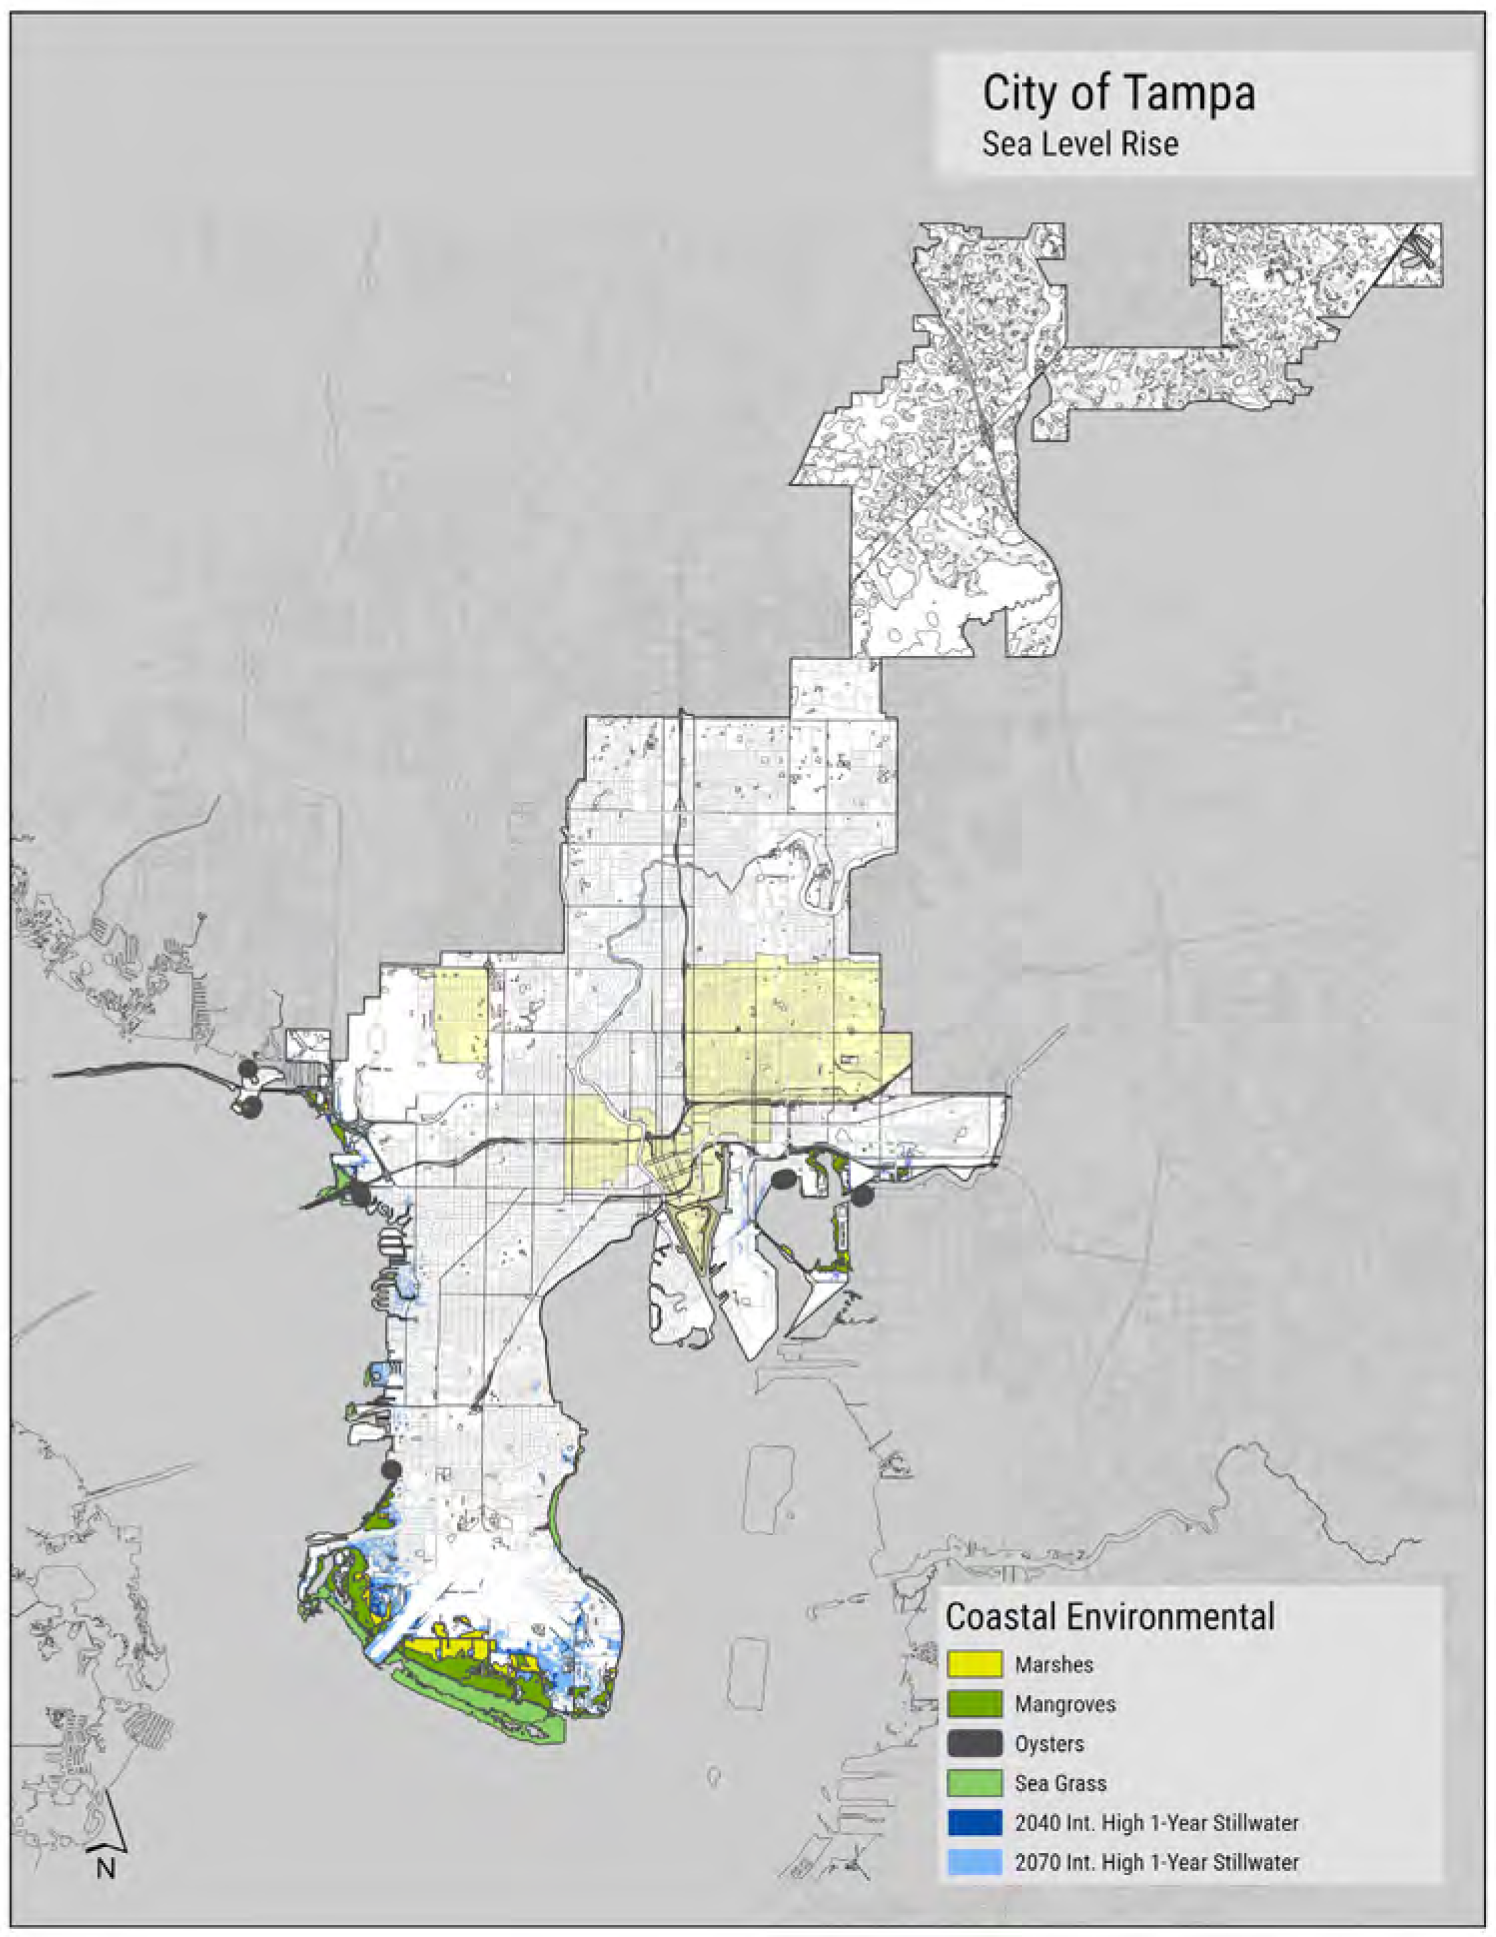
SUMMARY OF VULNERABILITIES

SUMMARY
The primary vulnerabilities in the City of Tampa are related to private property risk, especially related to inland flooding from extreme rainfall events. Tampa’s flat terrain and inland basins are not represented well in FEMA’s Flood Insurance Rate Maps, and so many property owners are unaware of their susceptibility to flooding. Over the last century homes and businesses have been built within inland basins where flooding can occur, and many of the historic drainage mechanisms such as sinks are no longer functioning, or do not have an appropriate carrying capacity to remove all of the water. This was on display recently during Hurricane Milton (2024) when most Tampa neighborhoods received more than 13 inches of rainfall. Stormwater solutions such as pumps, large scale piping, and property buyouts in flood vulnerable areas will help to alleviate future flooding problems.
Private property is also vulnerable at the coast, more so from surge than sea level rise. Most of the city’s land is above elevation 5 feet NAVD88 (the 2070 intermediate-high scenario for the 1-year stillwater event is 4.76 feet NAVD88). However, the effects of compound flooding (sea level rise with hurricane induced surge) could cause significant damage to Tampa neighborhoods, as was seen during Hurricane Helene (2024) when waters reached elevation 8 feet NAVD88. Coastal areas will need individual strategies for coping with higher tides and surge. As was discussed in the City’s Regulatory Approach to Sea Level Rise study, different communities will have different capacities for adaptation. This should be considered when devising future planning solutions.
When considering municipal infrastructure, the wastewater pump stations are the most susceptible assets to flooding. They tend to be in low-lying locations within the city and when these systems are off-line there is potential for sewers to overflow and flooding to increase. The inability to transport sewage to the treatment plant can cause serious problems for residences and businesses.
Lastly, there are many different roadways that are vulnerable to flooding with city limits. This is a product of topography but also the stormwater system, especially in inland basins. Roadways are essential for transportation with important connections to hospitals, schools, and neighborhood amenities. It is also the transportation infrastructure that enables the solid waste system to access its customers and to remove trash and debris. A minimum level of service should be established and maintained for primary access roads, such as the one connecting the city to the McKay Bay Solid Waste Facility, push routes, or other emergency facilities.
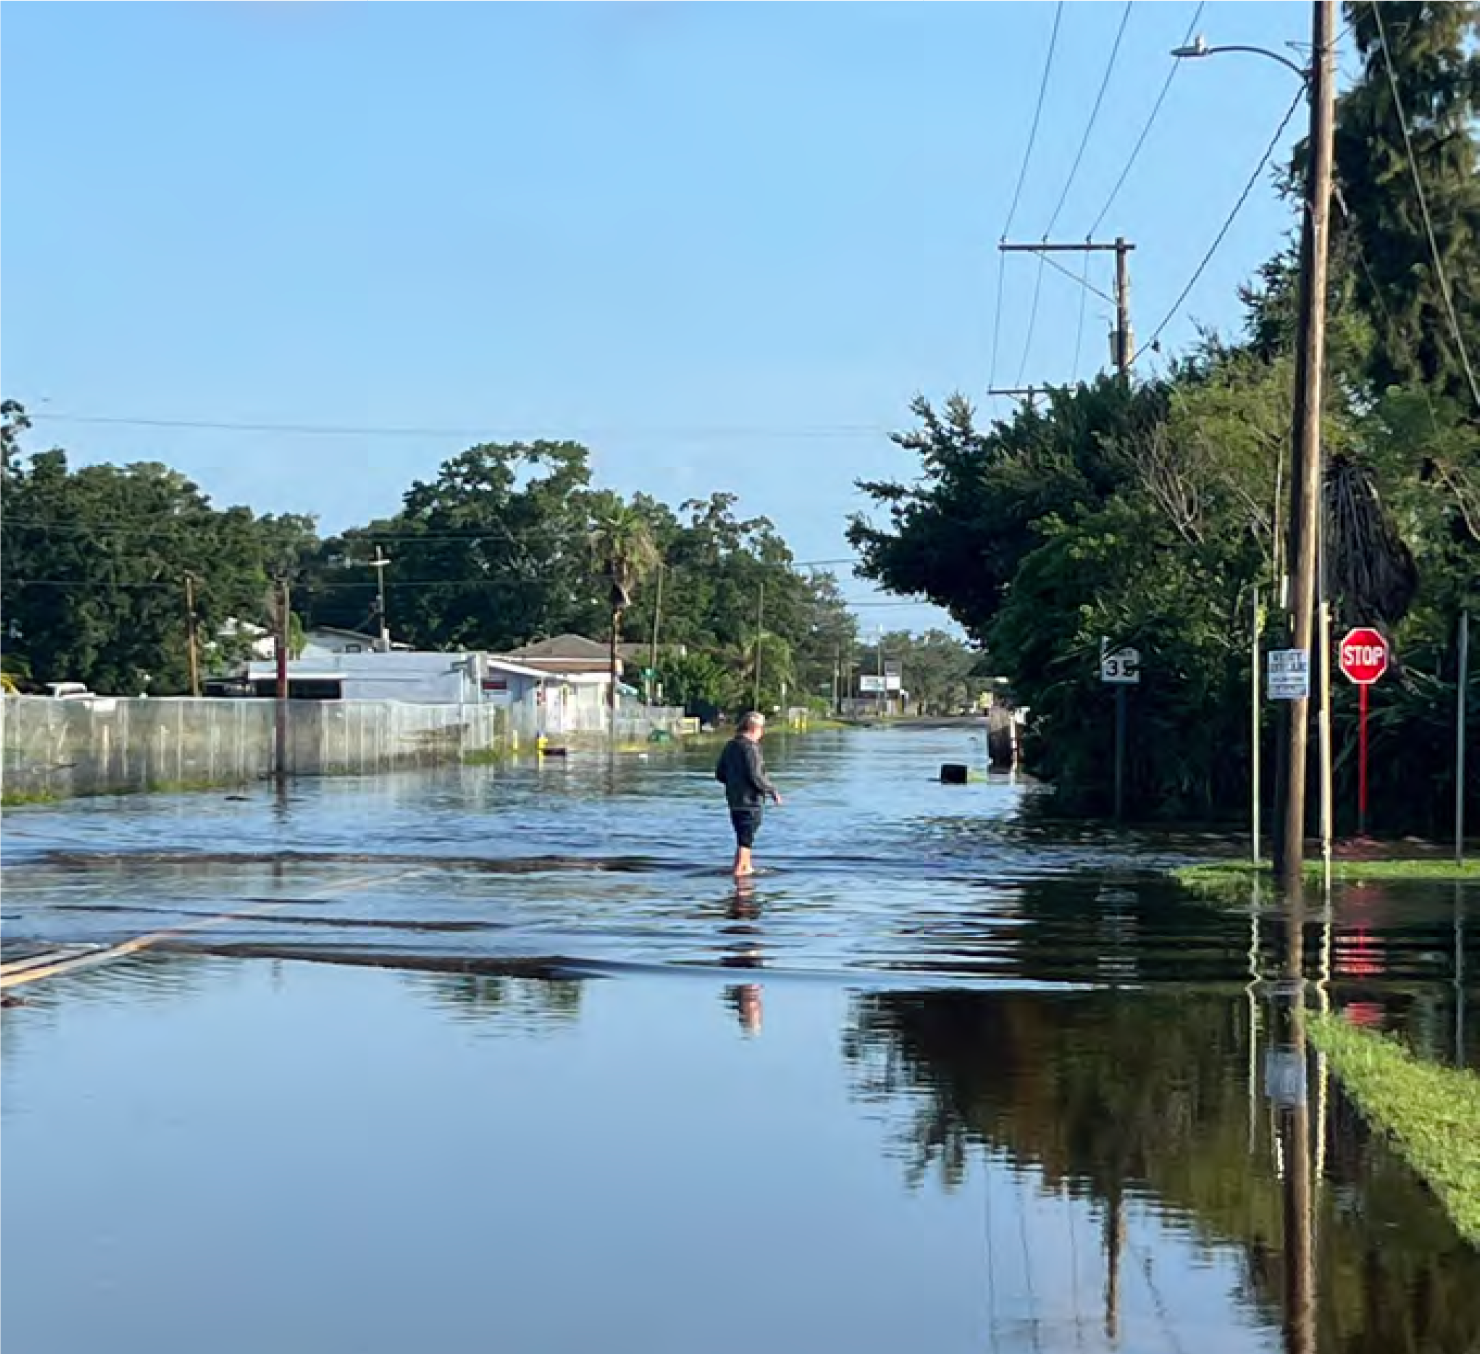
PRIORITIZING VULNERABILITIES
The project followed the FDEP Resilient Florida guidelines, according to Florida Statute 380.093, which has established a process for conducting vulnerability assessments. All city assets were compared against various flood scenarios for sea level rise, rainfall, and storm surge. This provides a sense of ‘exposure’ to flooding, as a hazard. Since most assets were not associated with vertical information, their assigned height was equal to the adjacent ground value. In many cases, this might not be the actual point of vulnerability. For example, a wastewater pump may not be affected if water were to cover the ground at its location. It may be sensitive to flooding only when the water rises a few feet above the ground to where it reaches electrical components. It’s also possible that an asset is not affected at all by flooding. This is referred to as ‘sensitivity.’ The variability between each asset’s sensitivity can be very different. To account for this, for the purposes of this report sensitivity is defined by a number between 0 and 4, with 0 being non-affected and 4 being highly affected for a long duration of time. This process was somewhat subjective, therefore, the findings of this assessment should be used to focus future efforts on physical evaluations that are more precise.
To prioritize next steps and determine where immediate action is needed, this study multiplied factors of exposure and sensitivity with the ‘consequence of impact.’ This algorithm help to identify significant city features that are vulnerable to flooding.
Exposure
Floodplains were created for each flood scenario, which were cross-referenced with assets using Geographic Information System (GIS) applications. Findings reveal the exposure, or the presence of water at the base of each asset, during a scenario (NOAA, 2023). This does not necessarily mean that an asset is impacted. It is an indicator, but because of limited elevation and physical/ structural information, the modeling cannot conclude that something exposed to water is subject to failure. For example, an electrical box may be within the floodplain of a sea level rise scenario, but the component may be connected to the top of a pole or a wire. A recommended next step would be to determine the elevation value that triggers failure for each asset, and to use that, instead of the ground-level elevation, when running exposure analyses.
Sensitivity
Vulnerability is the combination of exposure and sensitivity. To be vulnerable, an asset needs to be proximal to a hazard (exposed), but also affected by that proximity. This potential for failure can be different between assets. In each asset section, this level of detail is developed as far as possible and described in the narrative. A score was given for each asset category, used to determine risk and prioritize critical assets for mitigation.
This study also provides a comprehensive analysis of overall sensitivity by asset category – this is the general sensitivity level for each asset type within the city and evaluates the number of assets affected per category.
Consequence of Impact
To prioritize next steps, the study evaluated each asset’s risk based on a combination of exposure, sensitivity, and also the consequence of impact. For example, if a park lawn is flooded, the consequences may be minimal. In the same property an electrical utility could be impacted by the same flood causing much more concern. A wastewater treatment plant, if it were to be flooded, could potentially have regional effects. The multiplication of factors resulted in a “Risk Prioritization Score” for every asset in the study, which can be found in the prioritization section of this report.
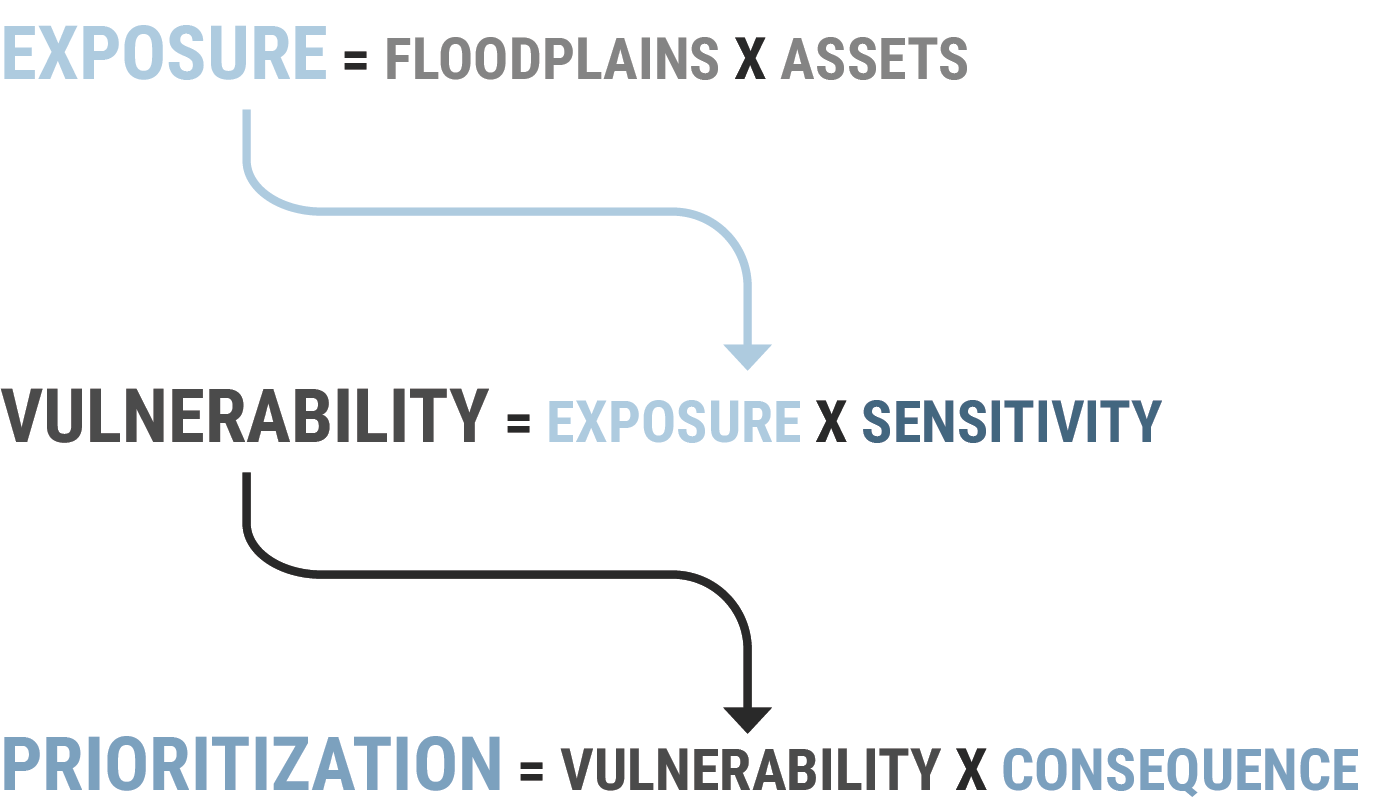
FLOOD EXPOSURE SCORE *
| Time frame | Frequency | Depth (ft) |
|---|---|---|
| Year 2070 | 500-Yr Storm | -0.5 to 0.5 |
| Year 2040 | 100-Yr Storm | -2 to -0.5 |
| Current | Sea-Level-Rise | -5 to -2 |
| -10 to -5 | ||
| -100 to -10 |
Example: Year 2070, 100-Year Storm with a depth of -3ft is (1+2)x3 = 9 (flood exposure score, for that event only. All events are added).
Example: If a pump has a flood depth of -4ft, it receives a score of 3.
SENSITIVITY SCORE
| Sensitivity | Examples |
|---|---|
| Low Sensitivity | Stormwater Inlets, Parks |
| Sensitive | Pump Stations, Health Care Facilities |
| Very Sensitive | N/A |
Example: Inlets are intended to handle water, but function at lower capacity if impacted, however wastewater treatment plants cannot function if impacted.
CONSEQUENCE
| Consequence | Examples |
|---|---|
| Localized or Minimal Impact | Bus Stops, Parks |
| Mid-Level Impact | Schools, Local Government Facilities |
| System Impacts | Wastewater Pump Station, Evacuation Route |
| Regional Impacts | Hospital, Wastewater Treatment Plant |
RISK PRIORITIZATION SCORE
Current Time frame = 3 100-Yr Frequency = 2 -8.63ft Depth Depth Score = 4 WASTEWATER PUMP STATION Sensitivity = 2 Consequence = 3
Example: The Bayshore Wastewater Pump Station has an exposure score of 912; ((152 x 2) x3). Its exposure score, based on frequency and depth of flooding, is 152. Its sensitivity score is a 2 and its consequence score is a 3.

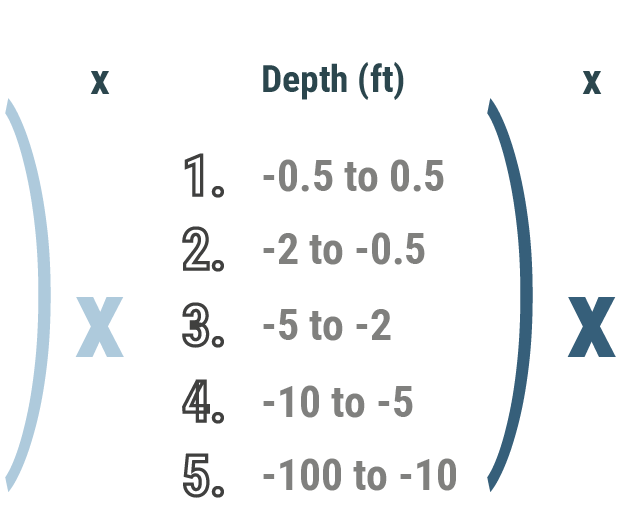
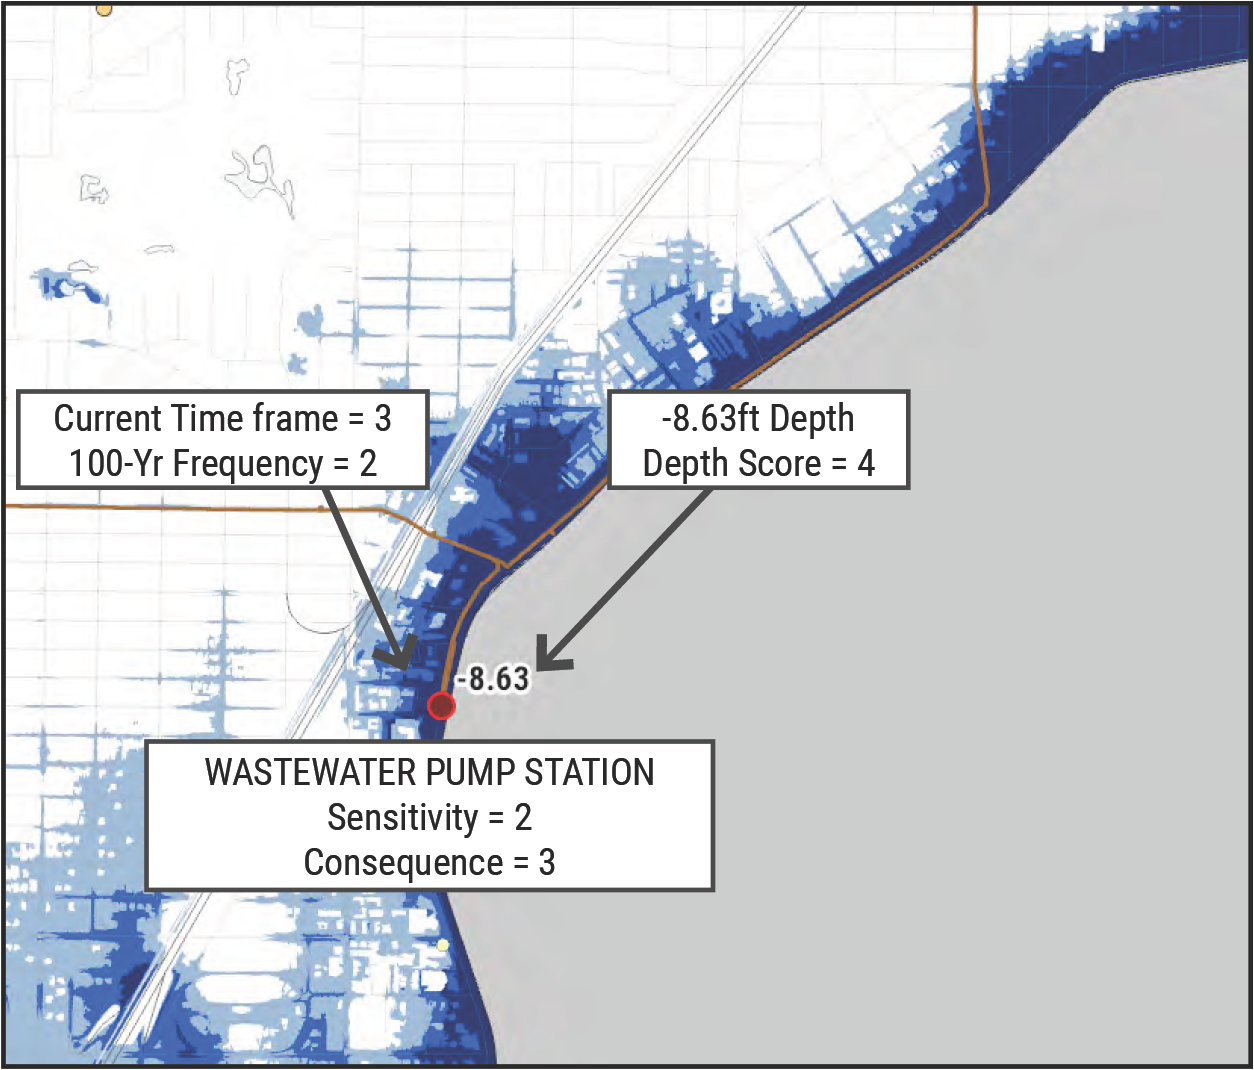
A prioritized list and map were created using the best available data and the multiplier algorithm explained on the previous pages. Due to potential inaccuracies in data management and subjective interpretations regarding asset sensitivity and consequence, the prioritization summary should be used as a guide and was created for discussion purposes with city staff. The list below represents an analysis for city infrastructure and facilities only.
PRIORITIES FOR MITIGATION
Wastewater pump stations are of highest concern. A significant number of them are located at low elevations and are in areas with either storm surge or rainfall vulnerabilities, or both. There are multiple pump stations along the Hillsborough River, which appears to be a primary area of concern.
The algorithm also pinpointed multiple evacuation routes to be prioritized for flood mitigation. Some of these are susceptible to storm surge, for which there is not a solution, but others are susceptible to flooding during severe rainfall (the 100-year event was used in this determination). Each street should be reviewed through more detailed analysis, some of which is included in the transportation section of this report. The stormwater system is a significant contributing factor to flooding during rainfall events and so a site-scaled hydraulic and hydrologic (H & H) analysis would be beneficial to confirm results. The locations on this list could potentially be prioritized in the upcoming city-wide H & H study.
The Davis Islands fire station is the only structure that is represented in the ‘top 30’ prioritized list.
The Hillsborough River Dam is an extraordinarily important structure for the city and should be prioritized for safeguarding and mitigation to all vulnerabilities. A vulnerability assessment was recently performed for the dam, which included a structural analysis and a potential floodway study (multiple reports, 2021-2022).
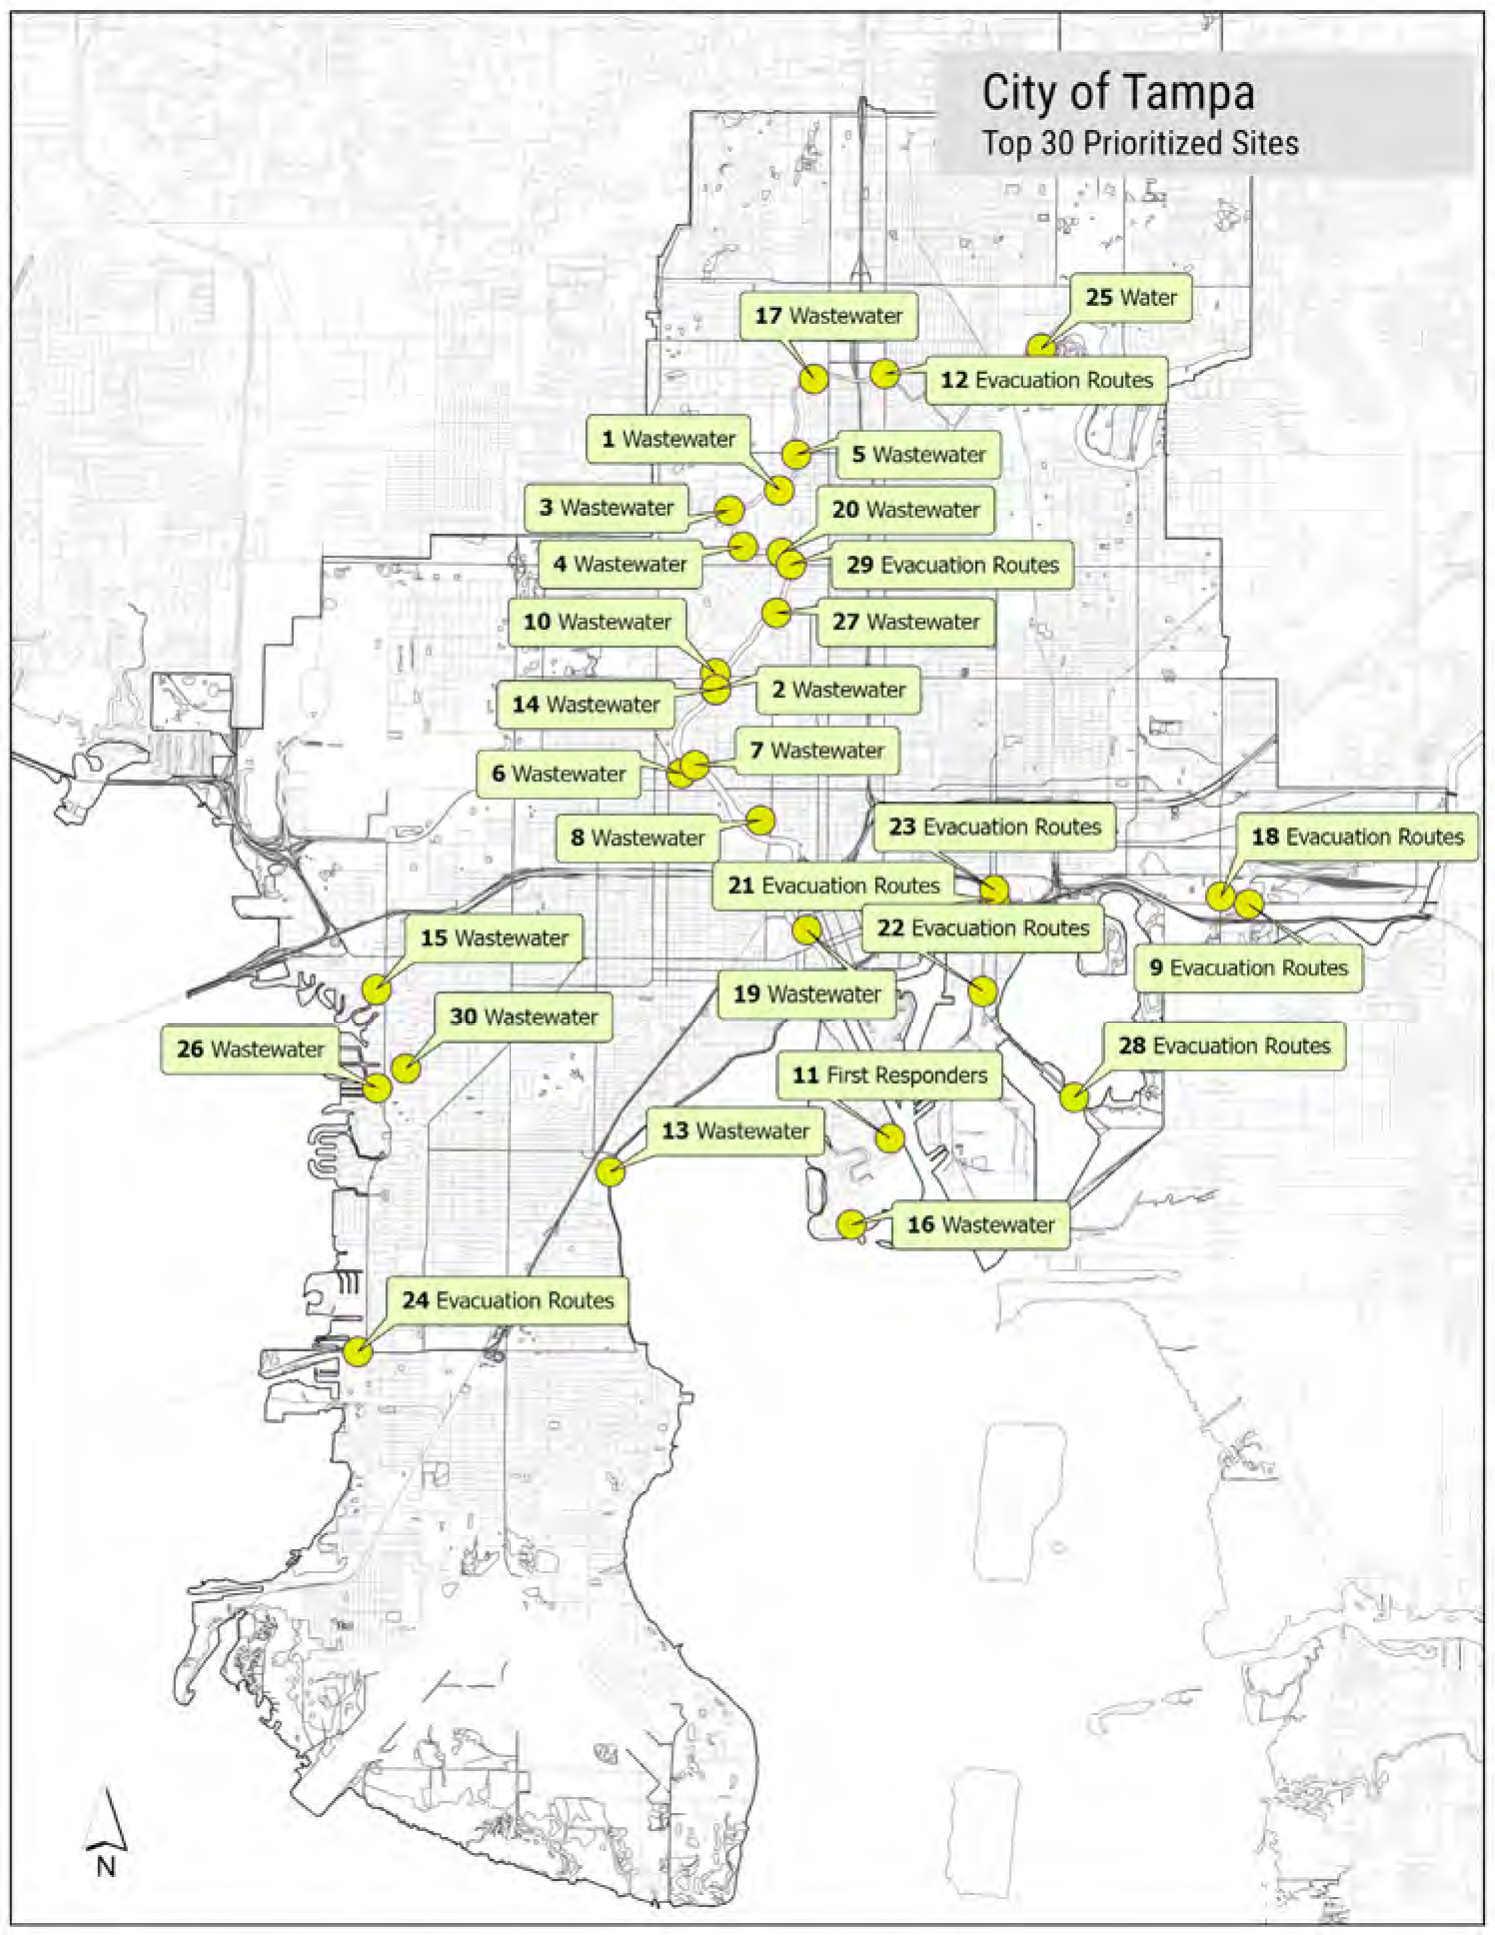
| Rank | Asset Type | Name | Elevation (Feet/NAVD) | Risk Score |
|---|---|---|---|---|
| WASTEWATER - LARGE PUMP STATION | EPPS PARK | 3.65 | 1158 | |
| WASTEWATER - LARGE PUMP STATION | VIRGINIA | 4.09 | 1086 | |
| WASTEWATER - LARGE PUMP STATION | HANNA | 4.97 | 1056 | |
| WASTEWATER - LARGE PUMP STATION | RIVER TERRACE | 5.06 | 1056 | |
| WASTEWATER - LARGE PUMP STATION | SLIGH | 5.21 | 1020 | |
| WASTEWATER - LARGE PUMP STATION | CORDELIA (JOE’S PLACE) | 5.05 | 1014 | |
| WASTEWATER - LARGE PUMP STATION | PERRY | 5.54 | 990 | |
| WASTEWATER - LARGE PUMP STATION | RIDGEWOOD | 5.46 | 966 | |
| EVACUATION ROUTES | ADAMO DRIVE | 5.31 | 966 | |
| WASTEWATER - LARGE PUMP STATION | ROME | 6.40 | 960 | |
| FIRST RESPONDERS | FIRE STATION #17 (DAVIS ISLANDS) | 8.16 | 928 | |
| EVACUATION ROUTES | NORTH NEBRASKA AVENUE | 6.96 | 924 | |
| WASTEWATER - LARGE PUMP STATION | BAYSHORE | 4.78 | 912 | |
| WASTEWATER - SMALL PUMP STATION | VIRGINIA | 1.43 | 904 | |
| WASTEWATER - LARGE PUMP STATION | NEPTUNE WAY | 3.55 | 900 | |
| WASTEWATER - LARGE PUMP STATION | SEVERN | 5.53 | 882 | |
| WASTEWATER - LARGE PUMP STATION | HIGHLAND | 7.46 | 882 | |
| EVACUATION ROUTES | NORTH 50TH STREET | 6.46 | 882 | |
| DELETED | DELETED | DELETED | DELETED | |
| WASTEWATER - LARGE PUMP STATION | COMANCHE | 8.05 | 858 | |
| EVACUATION ROUTES | NORTH 22ND STREET | 5.95 | 858 | |
| EVACUATION ROUTES | SOUTH 20TH STREET | 5.97 | 858 | |
| EVACUATION ROUTES | NORTH 21ST STREET | 5.47 | 858 | |
| EVACUATION ROUTES | WEST GANDY BOULEVARD | 4.95 | 858 | |
| WATER | THE HILLSBOROUGH RIVER DAM | 840 | ||
| WASTEWATER - LARGE PUMP STATION | MELROSE | 4.89 | 834 | |
| WASTEWATER - LARGE PUMP STATION | LOUISIANA | 7.89 | 828 | |
| EVACUATION ROUTES | CAUSEWAY BOULEVARD | 5.69 | 828 | |
| EVACUATION ROUTES | WEST HILLSBOROUGH AVENUE | 8.50 | 828 | |
| WASTEWATER - LARGE PUMP STATION | CULBREATH BAYOU | 5.90 | 810 | |
*Number 19 was purposefully deleted. It referenced a pump station that was included in the data but is no longer active.
During the study, additional prioritization rankings were developed by asset type. These lists are for discussion purposes only and represent the output of alternative algorithms used for determining focus areas for consideration.
Local Government Facilities
- McKay Bay Solid Waste Facility
- Joe Abrams Fitness and Wellness Center
- Port Tampa Park Recreation Center
- Solid Waste Brush Site Office
- Marjorie Park Dockmaster Building
- Tampa Police Department Training Facilities
- Sulphur Springs Aquatics Maintenance Building
- Picnic Island Picnic Shelters
- Sweeper Facility at Hooker’s Point
- Keep Tampa Bay Beautiful Building (leased)
Water Utility Facilities
- Hillsborough River Dam
- Sulphur Springs Pump Station
Stormwater Pump Stations
- Donut Pond
- Poinsettia
- Curiosity Creek
- Eastridge
- Penalty Lake Golf Course
- El Portal
- AMI Hospital
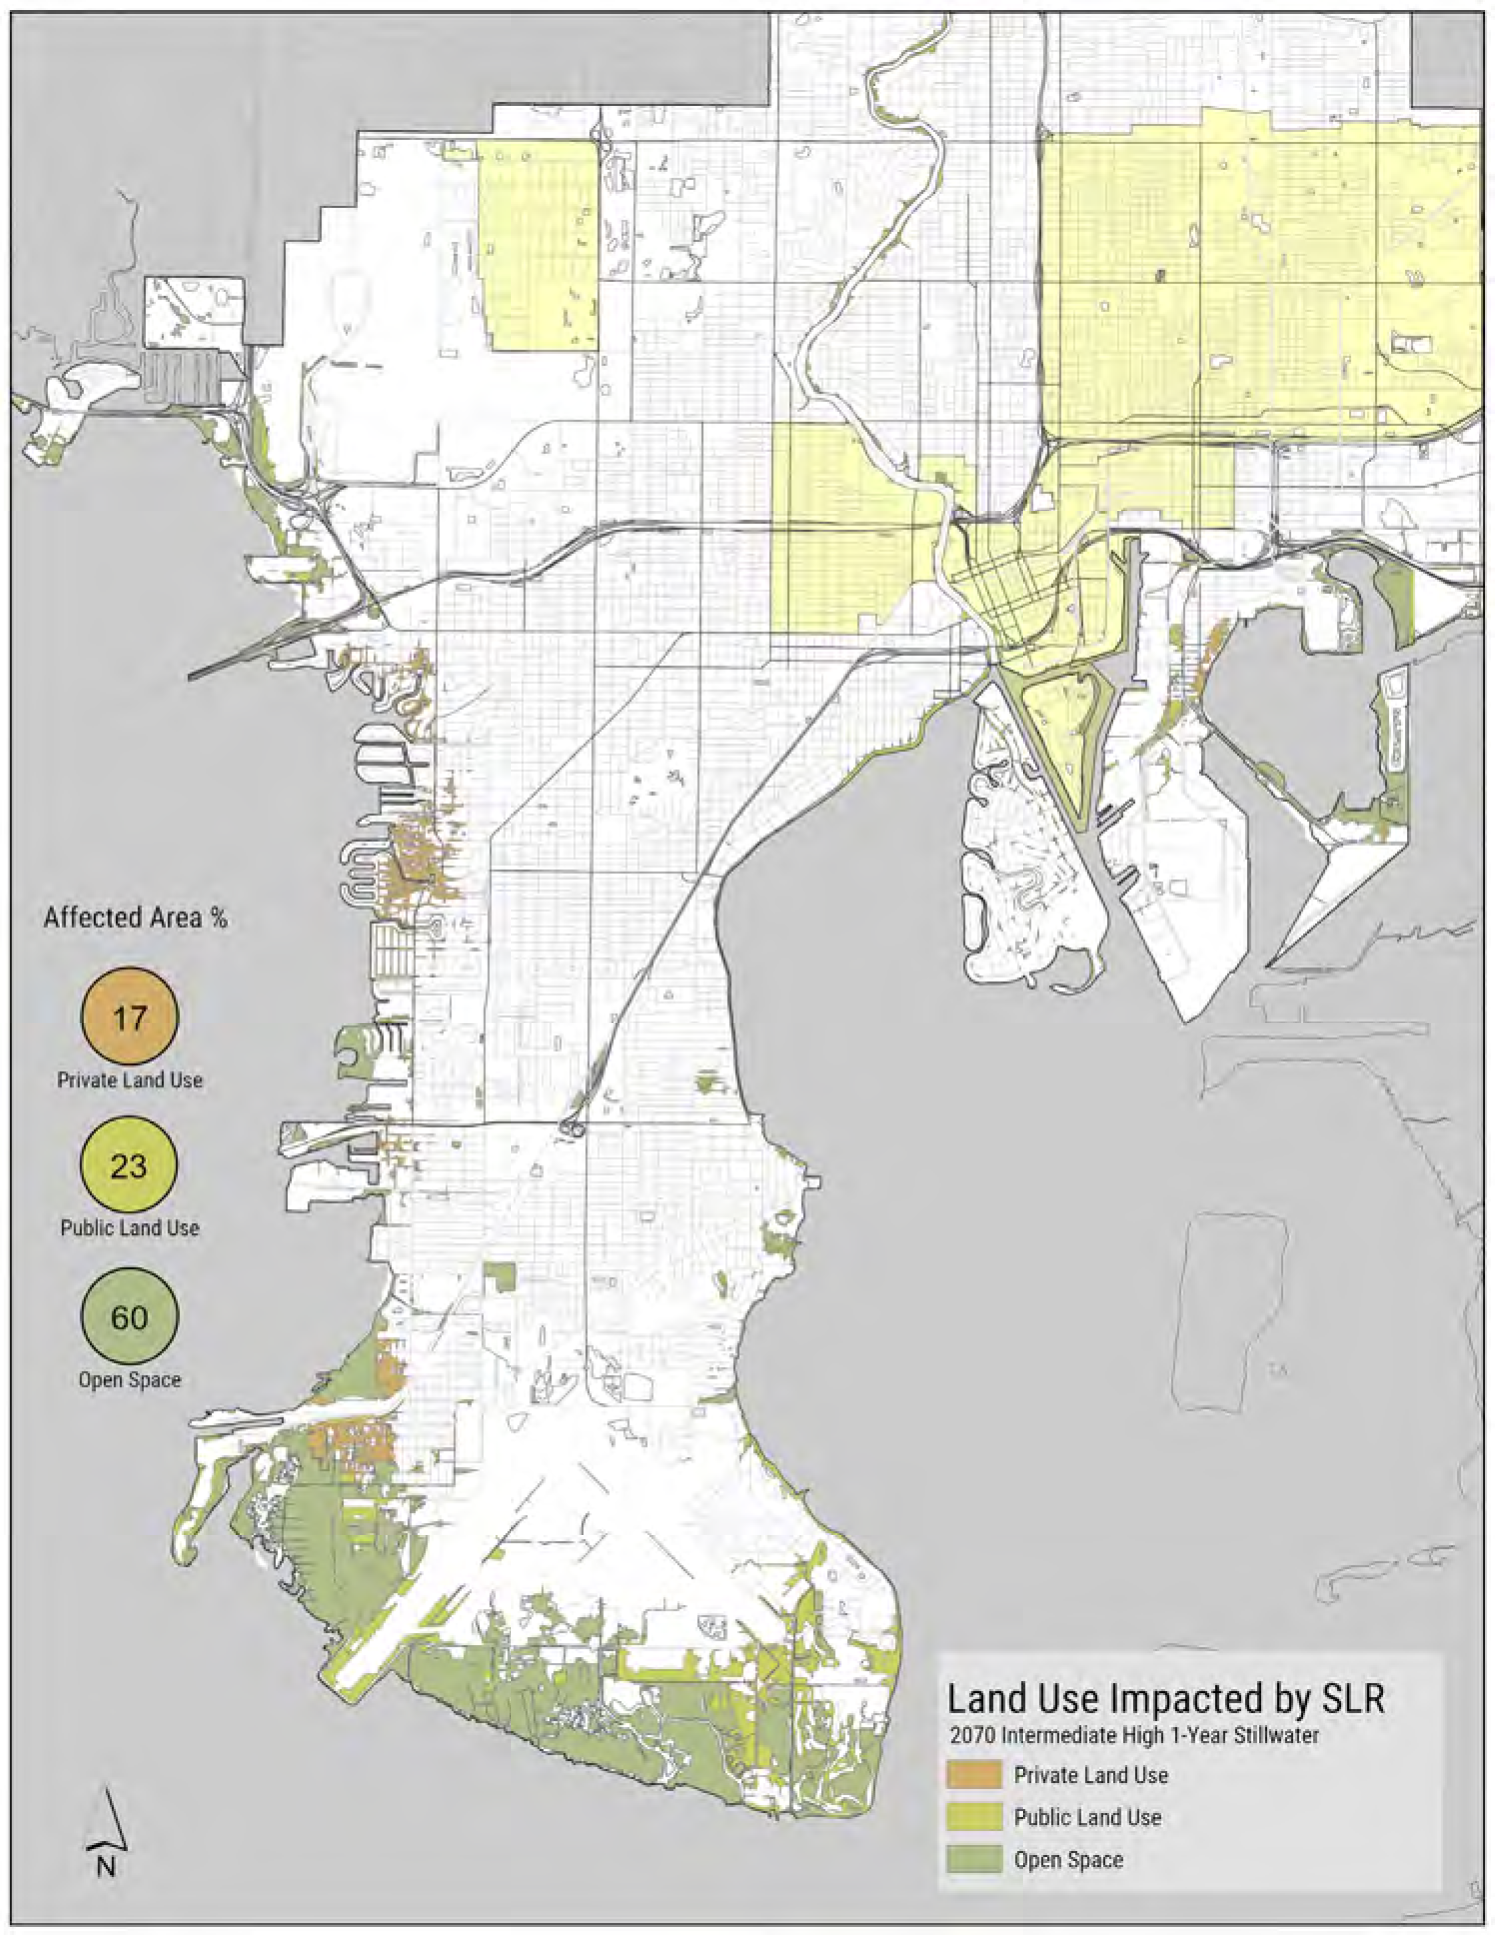
Educational Facilities
- Tinker Elementary (MacDill Air Force Base)
- Lanier Elementary
- DeSoto Elementary
- Madison Middle
- Monroe Middle
First Responders
- Fire Station #17 (Davis Islands)
- Fire Station #6 (Palmetto Beach)
REFERENCES
- Applied Sciences. 2020. The Tampa Sea Level Rise Vulnerability Analysis. For the City of Tampa. Retrieved from https://www.tampa.gov/sites/default/files/document/migrated/slr_vulnerability_analysis_report.pdf
- Applied Sciences. 2022. Vulnerability Assessment Memorandum for the Howard F. Curren Advanced Wastewater Treatment Plant. For the City of Tampa.
- Applied Sciences. 2023. City of Tampa Climate Action and Equity Plan. For the City of Tampa. Retrieved from https://www.tampa.gov/document/climate-action-and-equity-plan-122846
- Black and Veatch. 2018. City of Tampa Potable Water Master Plan. Retrieved from https://www.Tampa.gov/document/city-tampa-potable-water-system-master-plan-29906
- City of Tampa. 2021. Resilient Tampa: Transforming our city's tomorrow. Retrieved from https://www.tampa.gov/green-tampa/resilience
- Climate Science Advisory Panel [CSAP]. 2015. Recommended projection of sea level rise in the Tampa Bay Region. p. 311-318 in Burke, M., editor. Proceedings of the Sixth Tampa Bay Area Scientific Information Symposium (BASIS 6).
- Climate Science Advisory Panel [CSAP]. 2019. Recommended Projections of Sea Level Rise in the Tampa Bay Region.
- Cook, B., Cheng, A. & Fernandez, S. (2021). Land Regulatory Response to Sea-level Rise: Final Report (Report #7). For the City of Tampa. Retrieved from https://www.tampa.gov/document/final-recommendations-report-5-70196
- Federal Emergency Management Agency [FEMA]. 2021. Flood Map Service Center. Retrieved from https://msc.fema.gov/portal/home
- Florida Department of Environmental Protection [FDEP]. 2022. Standardized Vulnerability Assessment: Scope of Work Guidance. Retrieved from https://floridadep.gov/rcp/resilient-florida-program/documents/standard-vulnerability-assessment-scope-work-guidance
- Hillsborough County. 2024. 1938 Aerial Imagery - Hillsborough County. Retrieved from https://www.arcgis.com/apps/mapviewer/index.html?webmap=6c85dd3ffa9341e38c3ab05f6d23e424
- Krietz, A. 2022. Florida surpasses 1 million registered vessels, leads the nation. Tampa Bay 10 WTSP. Retrieved from https://www.wtsp.com/article/news/regional/florida/florida-vessel-registration-1-million-boats/67-35ab7602-aa41-4692-8d67-d79bb2c3b40d
- National Oceanic and Atmospheric Administration [NOAA]. 2017, January. Global and Regional Sea Level Rise Scenarios for the United States. Retrieved from https://tidesandcurrents.noaa.gov/publications/techrpt83_Global_and_Regional_SLR_Scenarios_for_the_US_final.pdf
- National Oceanic and Atmospheric Administration [NOAA]. 2022, February. 2022 Sea Level Rise Technical Report. Retrieved from (https://noaa.gov): https://oceanservice.noaa.gov/hazards/sealevelrise/sealevelrise-tech-report-sections.html
- National Oceanic and Atmospheric Administration [NOAA]. 2023. U.S. Climate Resilience Toolkit. Web, accessed 2/15/2023. See (https://toolkit.climate.gov/steps-to-resilience/understand-exposure)
- National Oceanic and Atmospheric Administration [NOAA]. 2024. NOAA Historical Hurricane Tracks. Retrieved from (https://noaa.gov). See (https://coast.noaa.gov/hurricanes/#map=4/32/-80)
- National Oceanic and Atmospheric Administration [NOAA]. 2014b. NOAA Tides and Currents. St. Petersburg, FL Station ID: 8726520. http://tidesandcurrents.noaa.gov/stationhome.html?id=8726520.
- Resilient Florida Grant Program, Florida Stat. § 380.093. 2021. See (https://www.flsenate.gov/laws/statutes/2021/380.093)
- Simmons, K., Czajikowski, J., and Done, J. 2018. Economic Effectiveness of Implementing a Statewide Building Code: The Case of Florida. Land Economics. May 2018, 94 (2) pp. 155-174. DOI: (https://doi.org/10.3368/le.94.2.155)
- South Florida Water Management District [SFWMD]. 2022, April 27. Technical Memorandum: Adoption of Future Extreme Rainfall Change Factors for Flood Resiliency Planning in South Florida. Retrieved from (https://sfwmd.gov): https://apps.sfwmd.gov/sfwmd/gsdocs/TPubs/2022_SFWMD_TM_Adoption_of_Future_Extreme_Rainfall_Change_Facotrs_for_Resiliency_Planning_in_South_Florida_rev2.0.pdf
- Tampa Bay Regional Planning Council [TBRPC]. Model Shoreline Ordinance Template. Retrieved from (https://tbrpc.org/model-shoreline-ordinance/)
- United States Geologic Survey [USGS]. 2022, April 01. Change factors to derive projected future precipitation depth-duration-frequency (DDF) curves at 174 National Oceanic and Atmospheric Administration (NOAA) Atlas 14 stations in central and south Florida. Retrieved from sciencebase.gov: (https://www.sciencebase.gov/catalog/item/62420146d34e915b67eae181)
- University of South Florida. 2020. The Hillsborough County Community Vulnerability Study. For Hillsborough Office of Emergency Management.
APPENDIX
SUPPLEMENTARY INFORMATION
EXPOSURE ANALYSIS
Additional maps were created to show the depth of flooding for each flood scenario, as defined by F.S. 380.093.
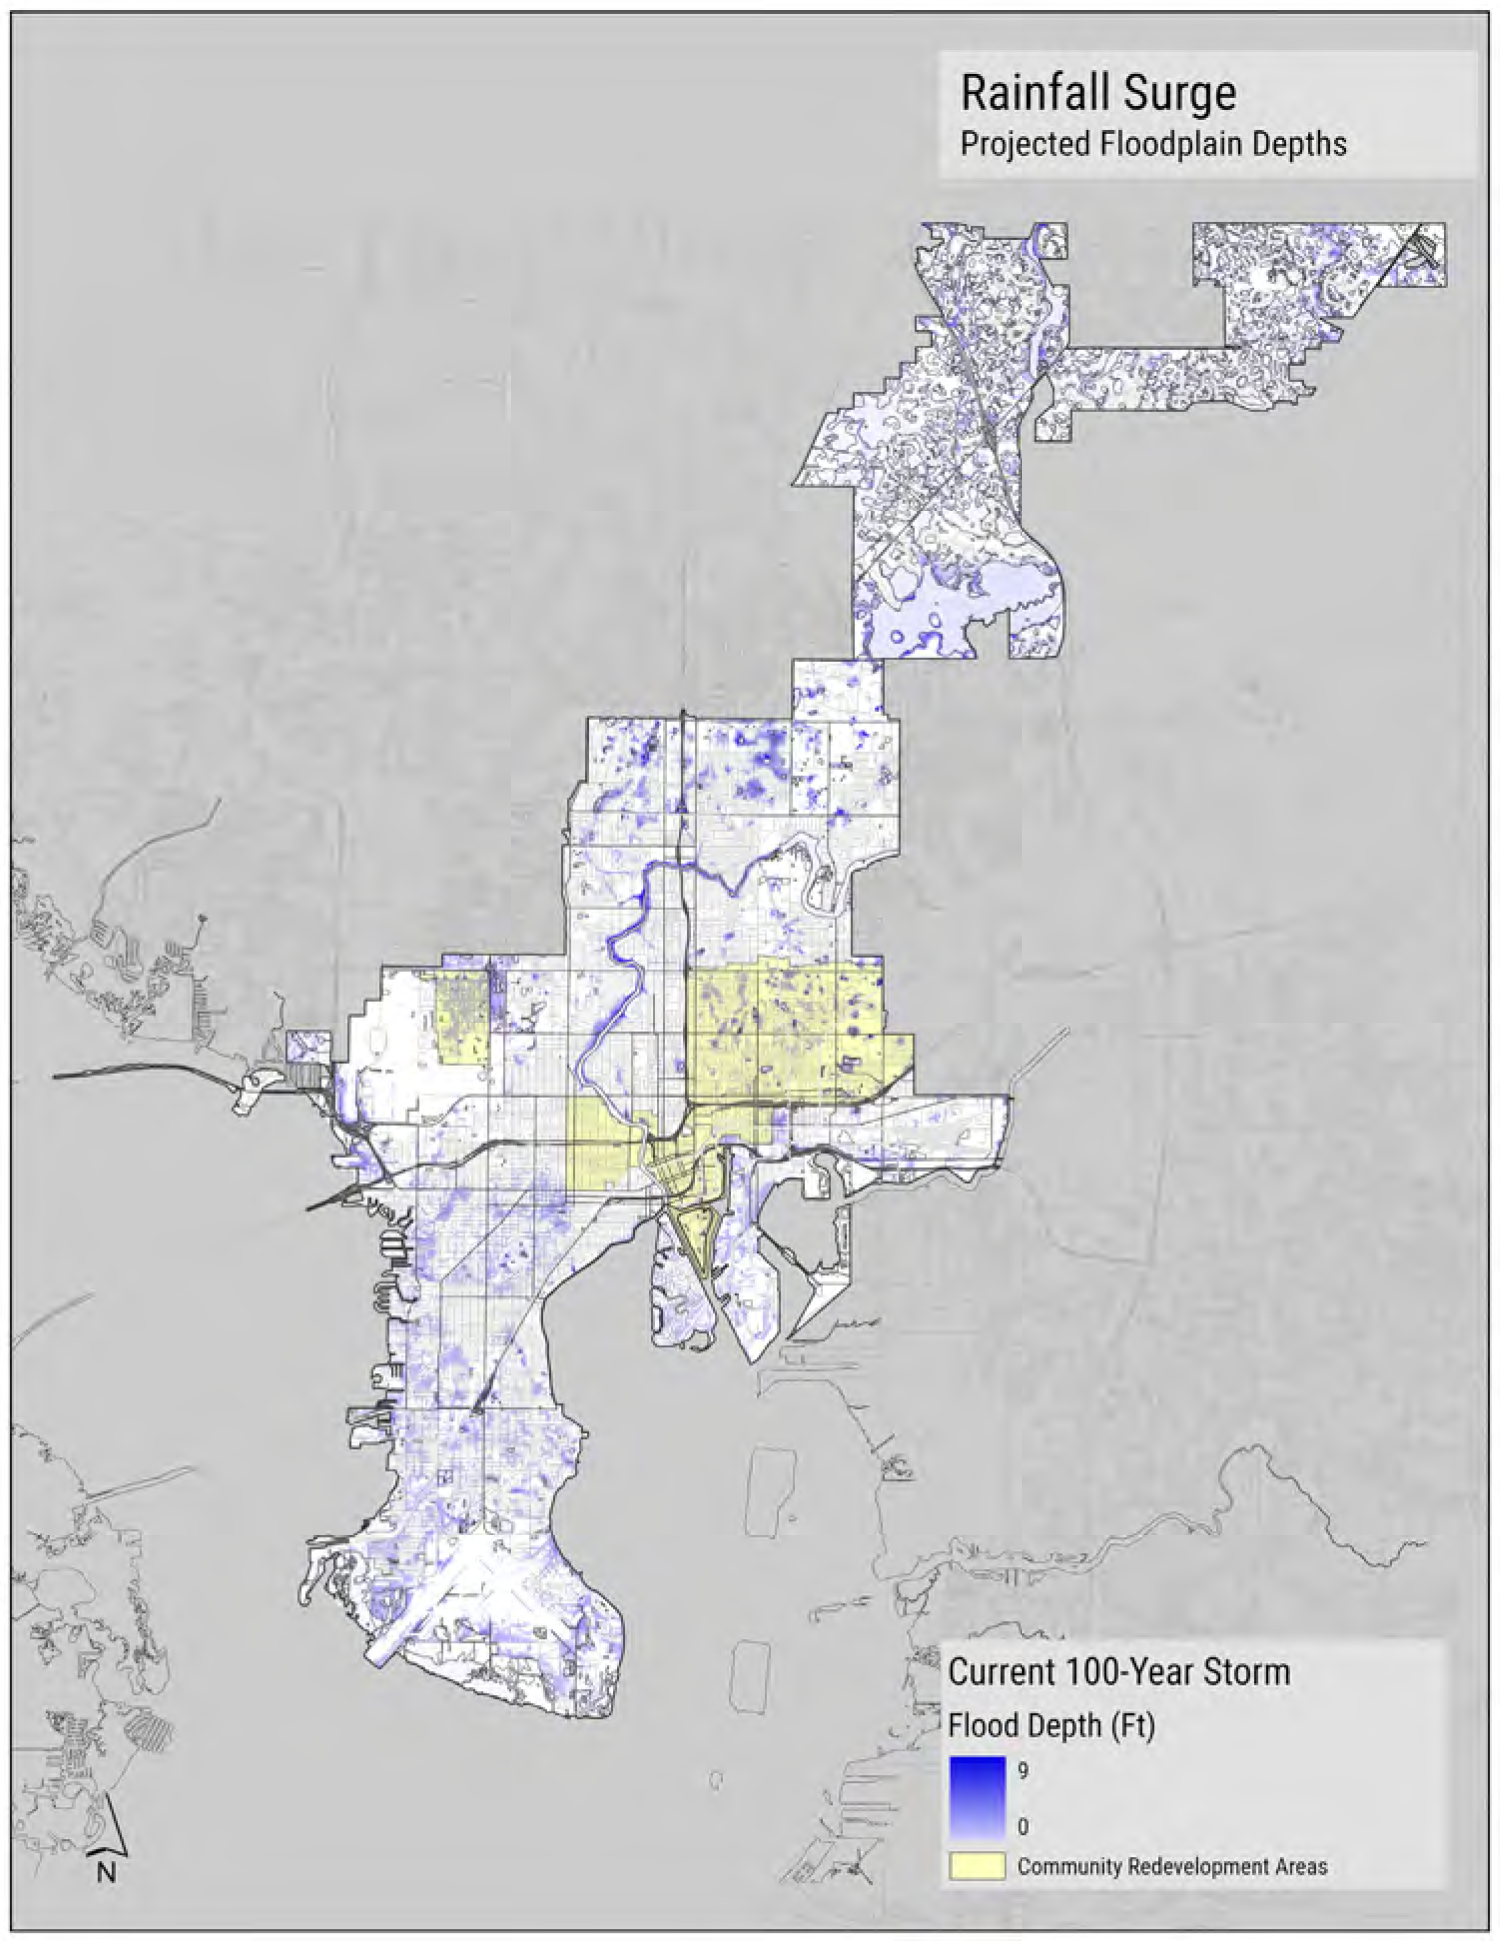
FIGURE 189: CURRENT 100-YEAR RAINFALL SCENARIO.
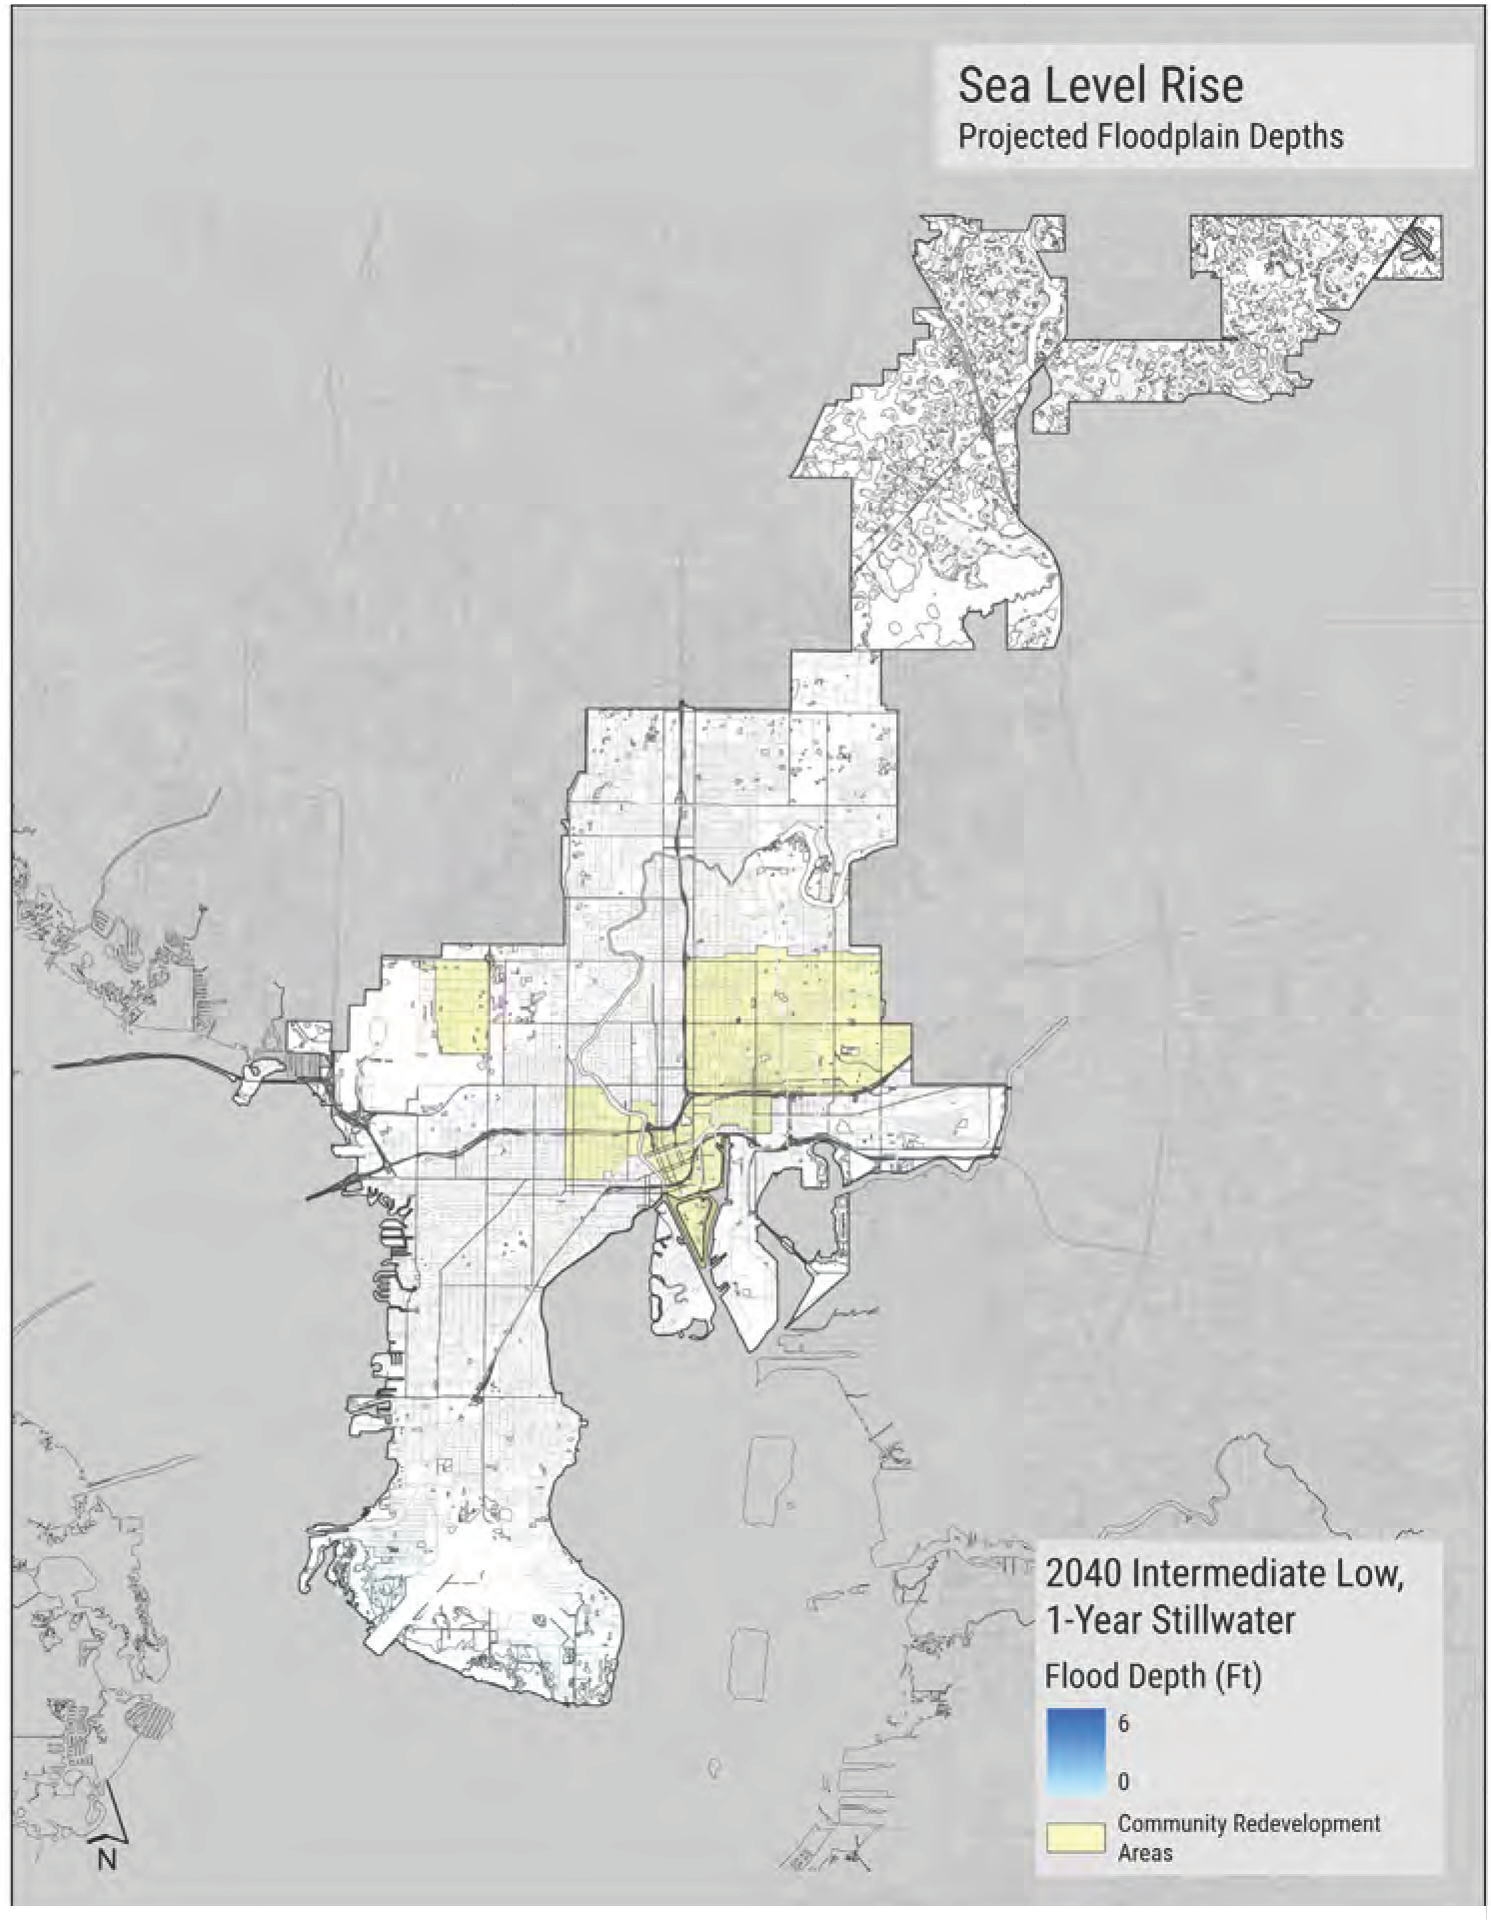
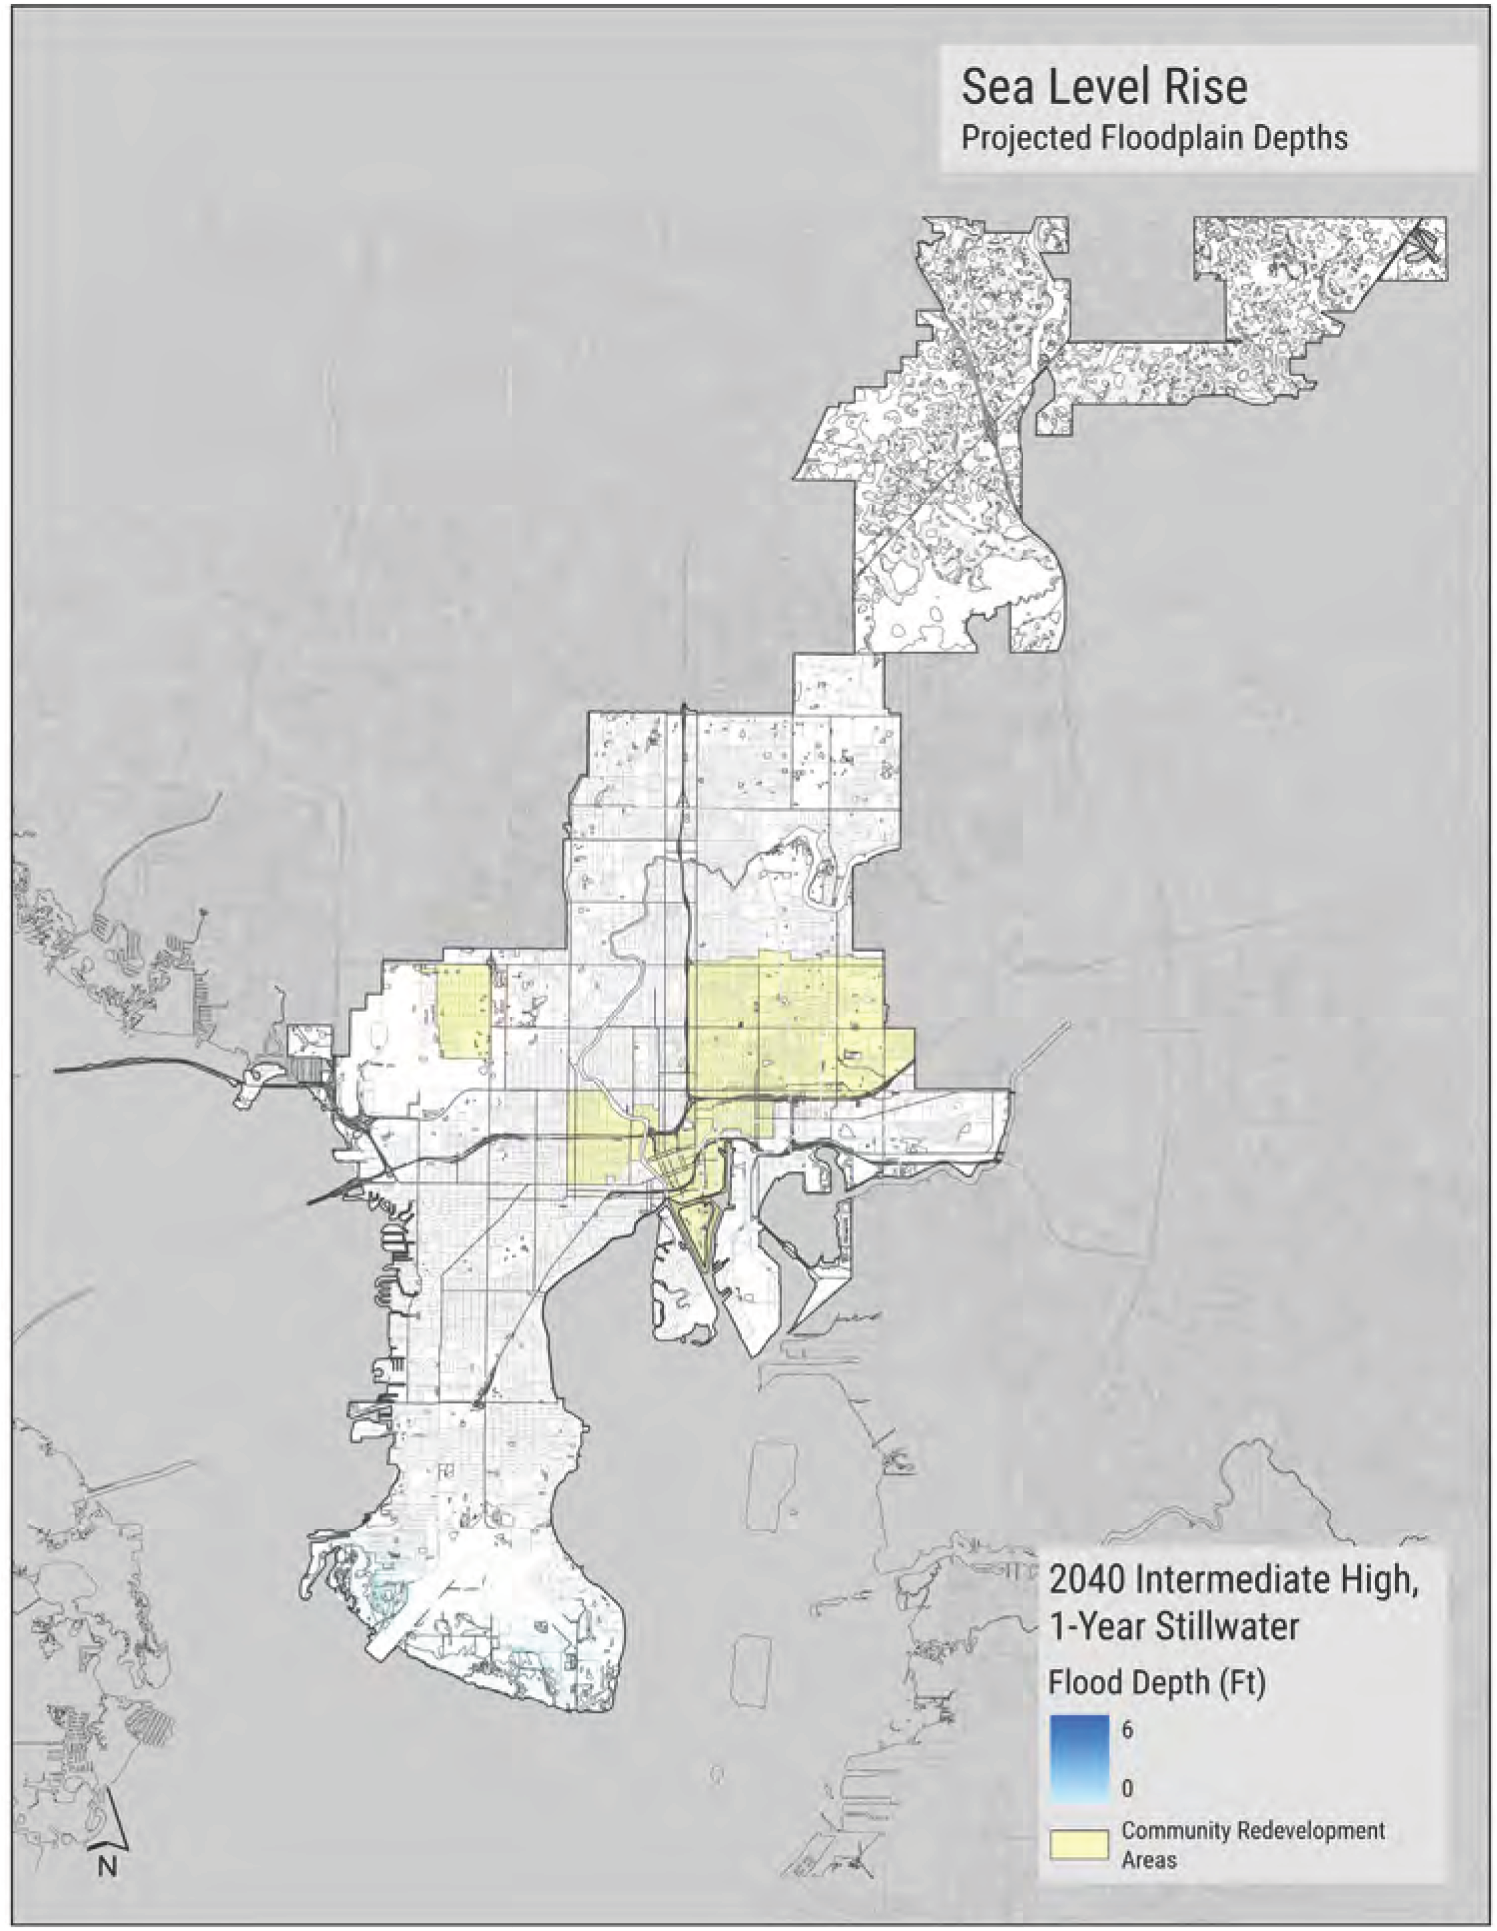
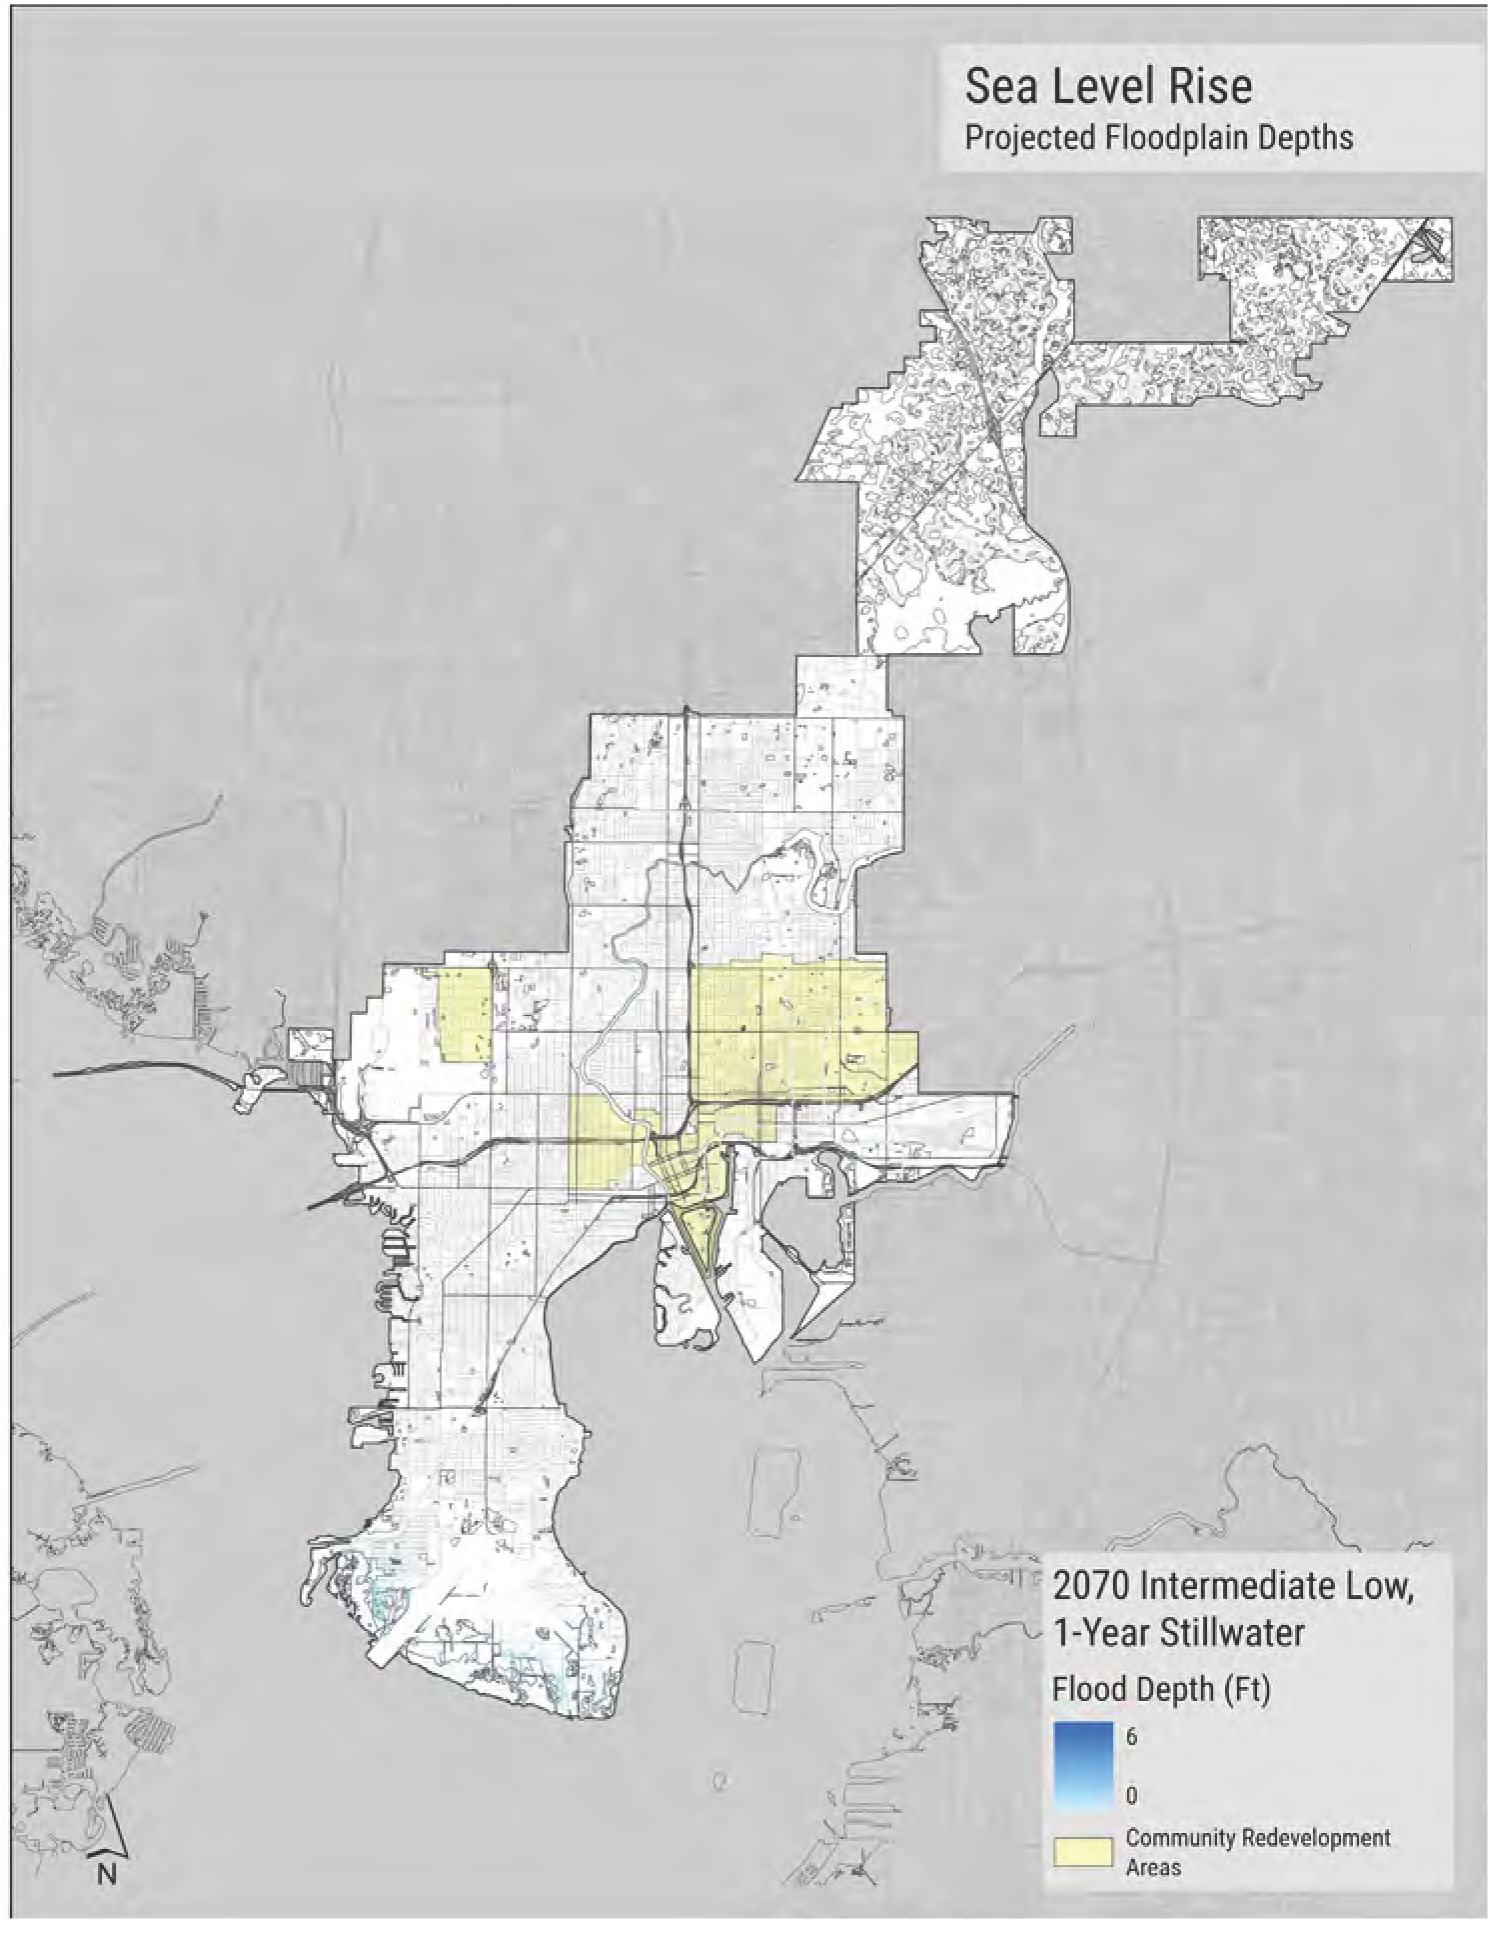
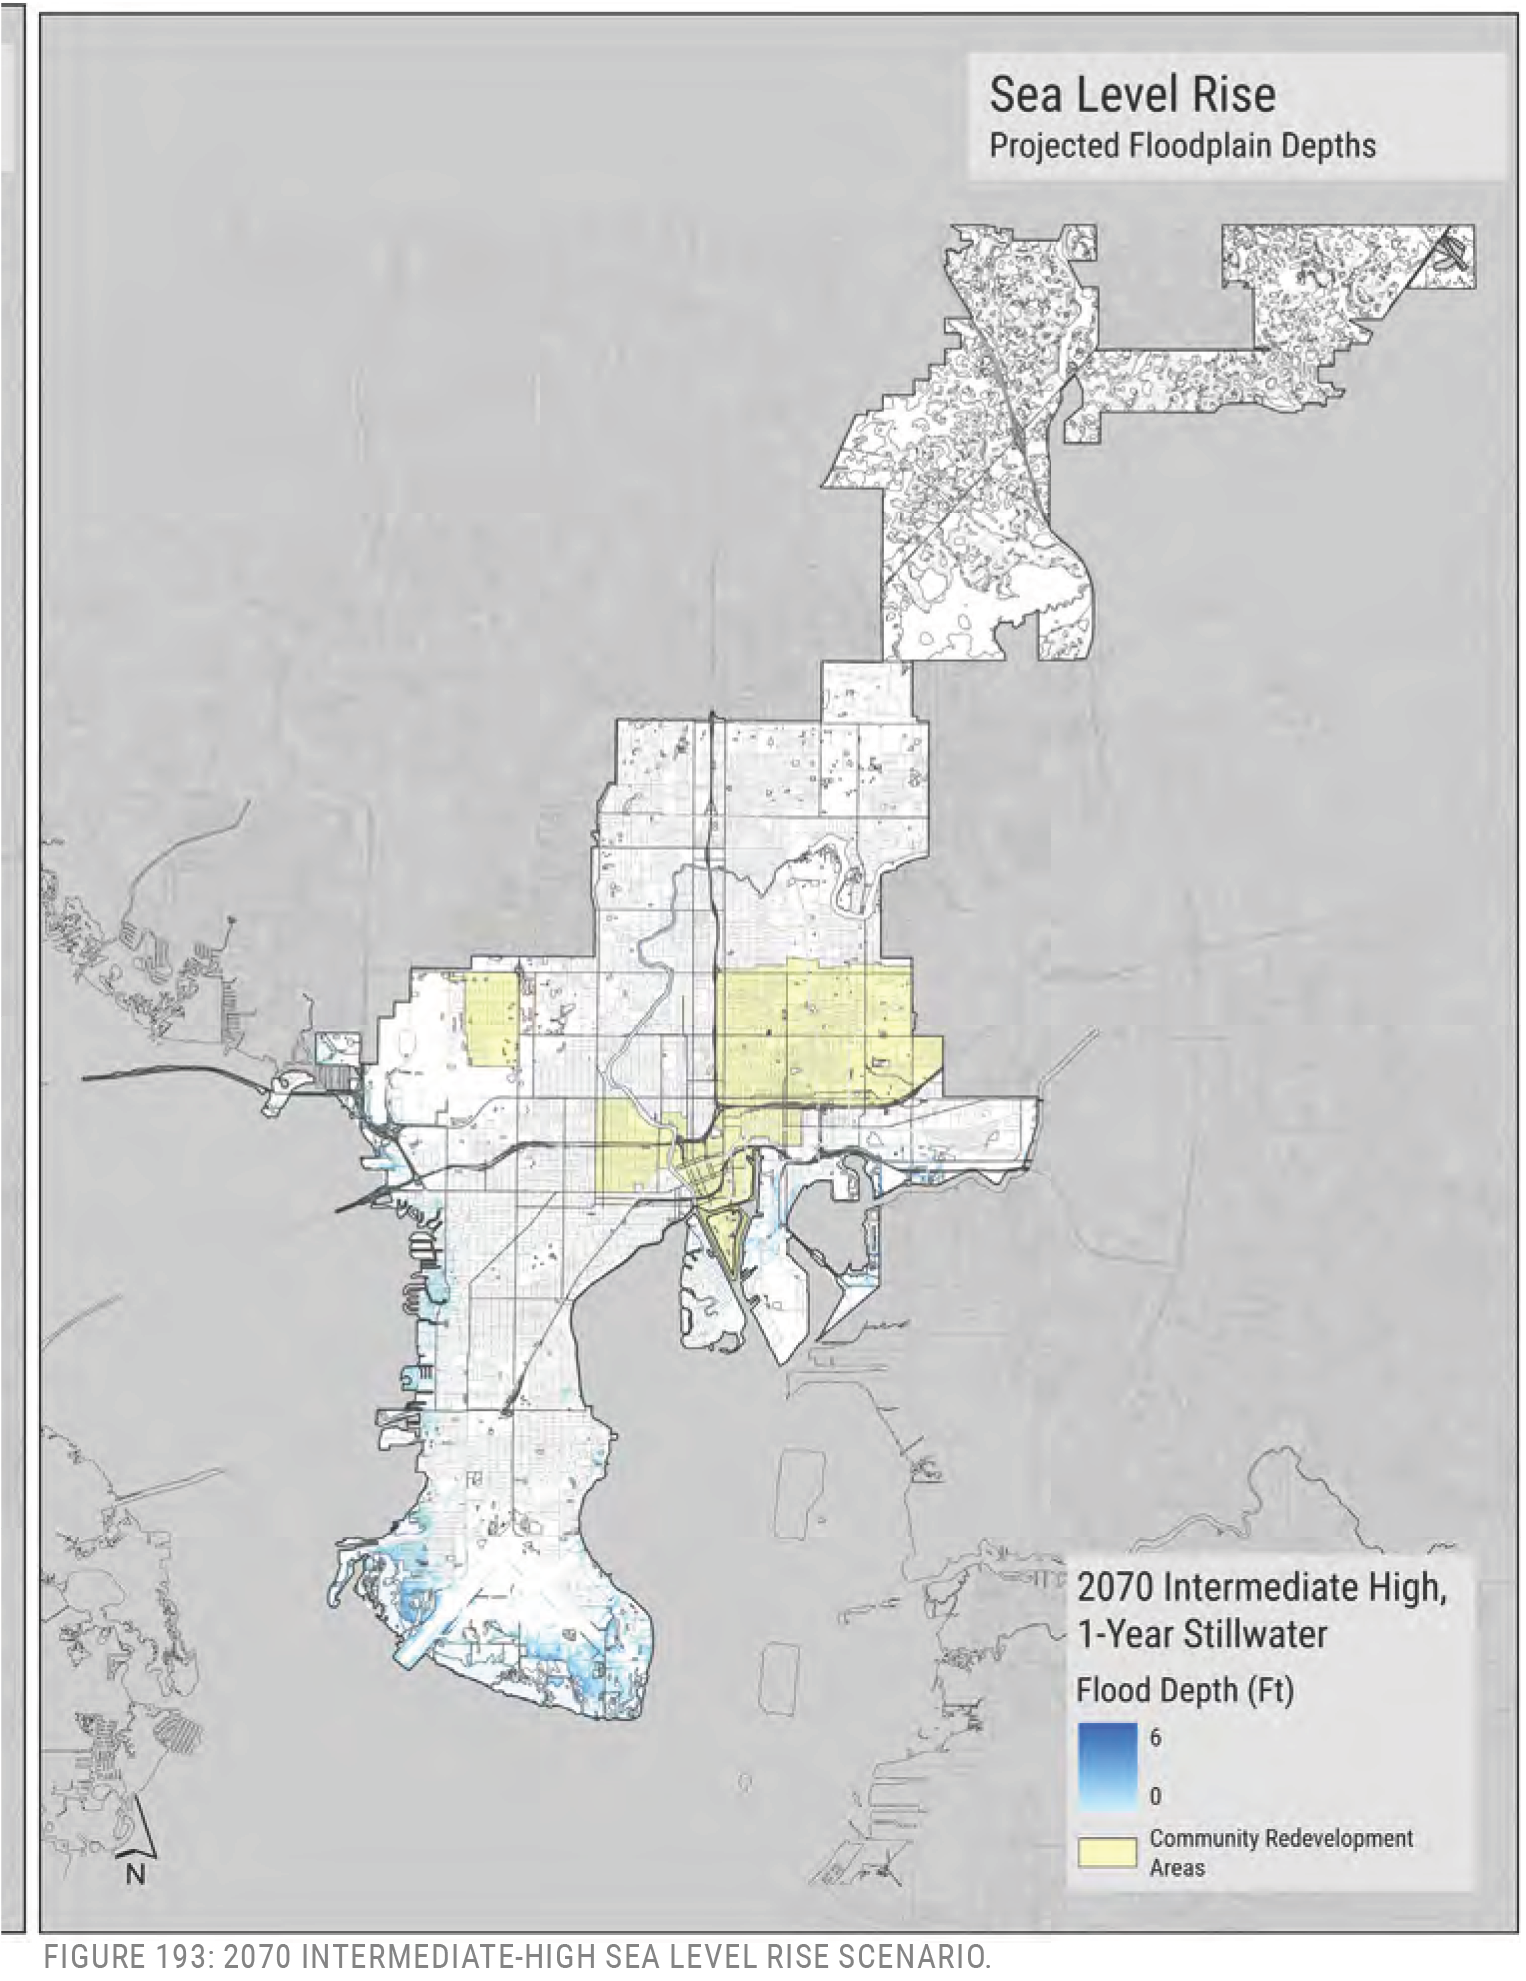
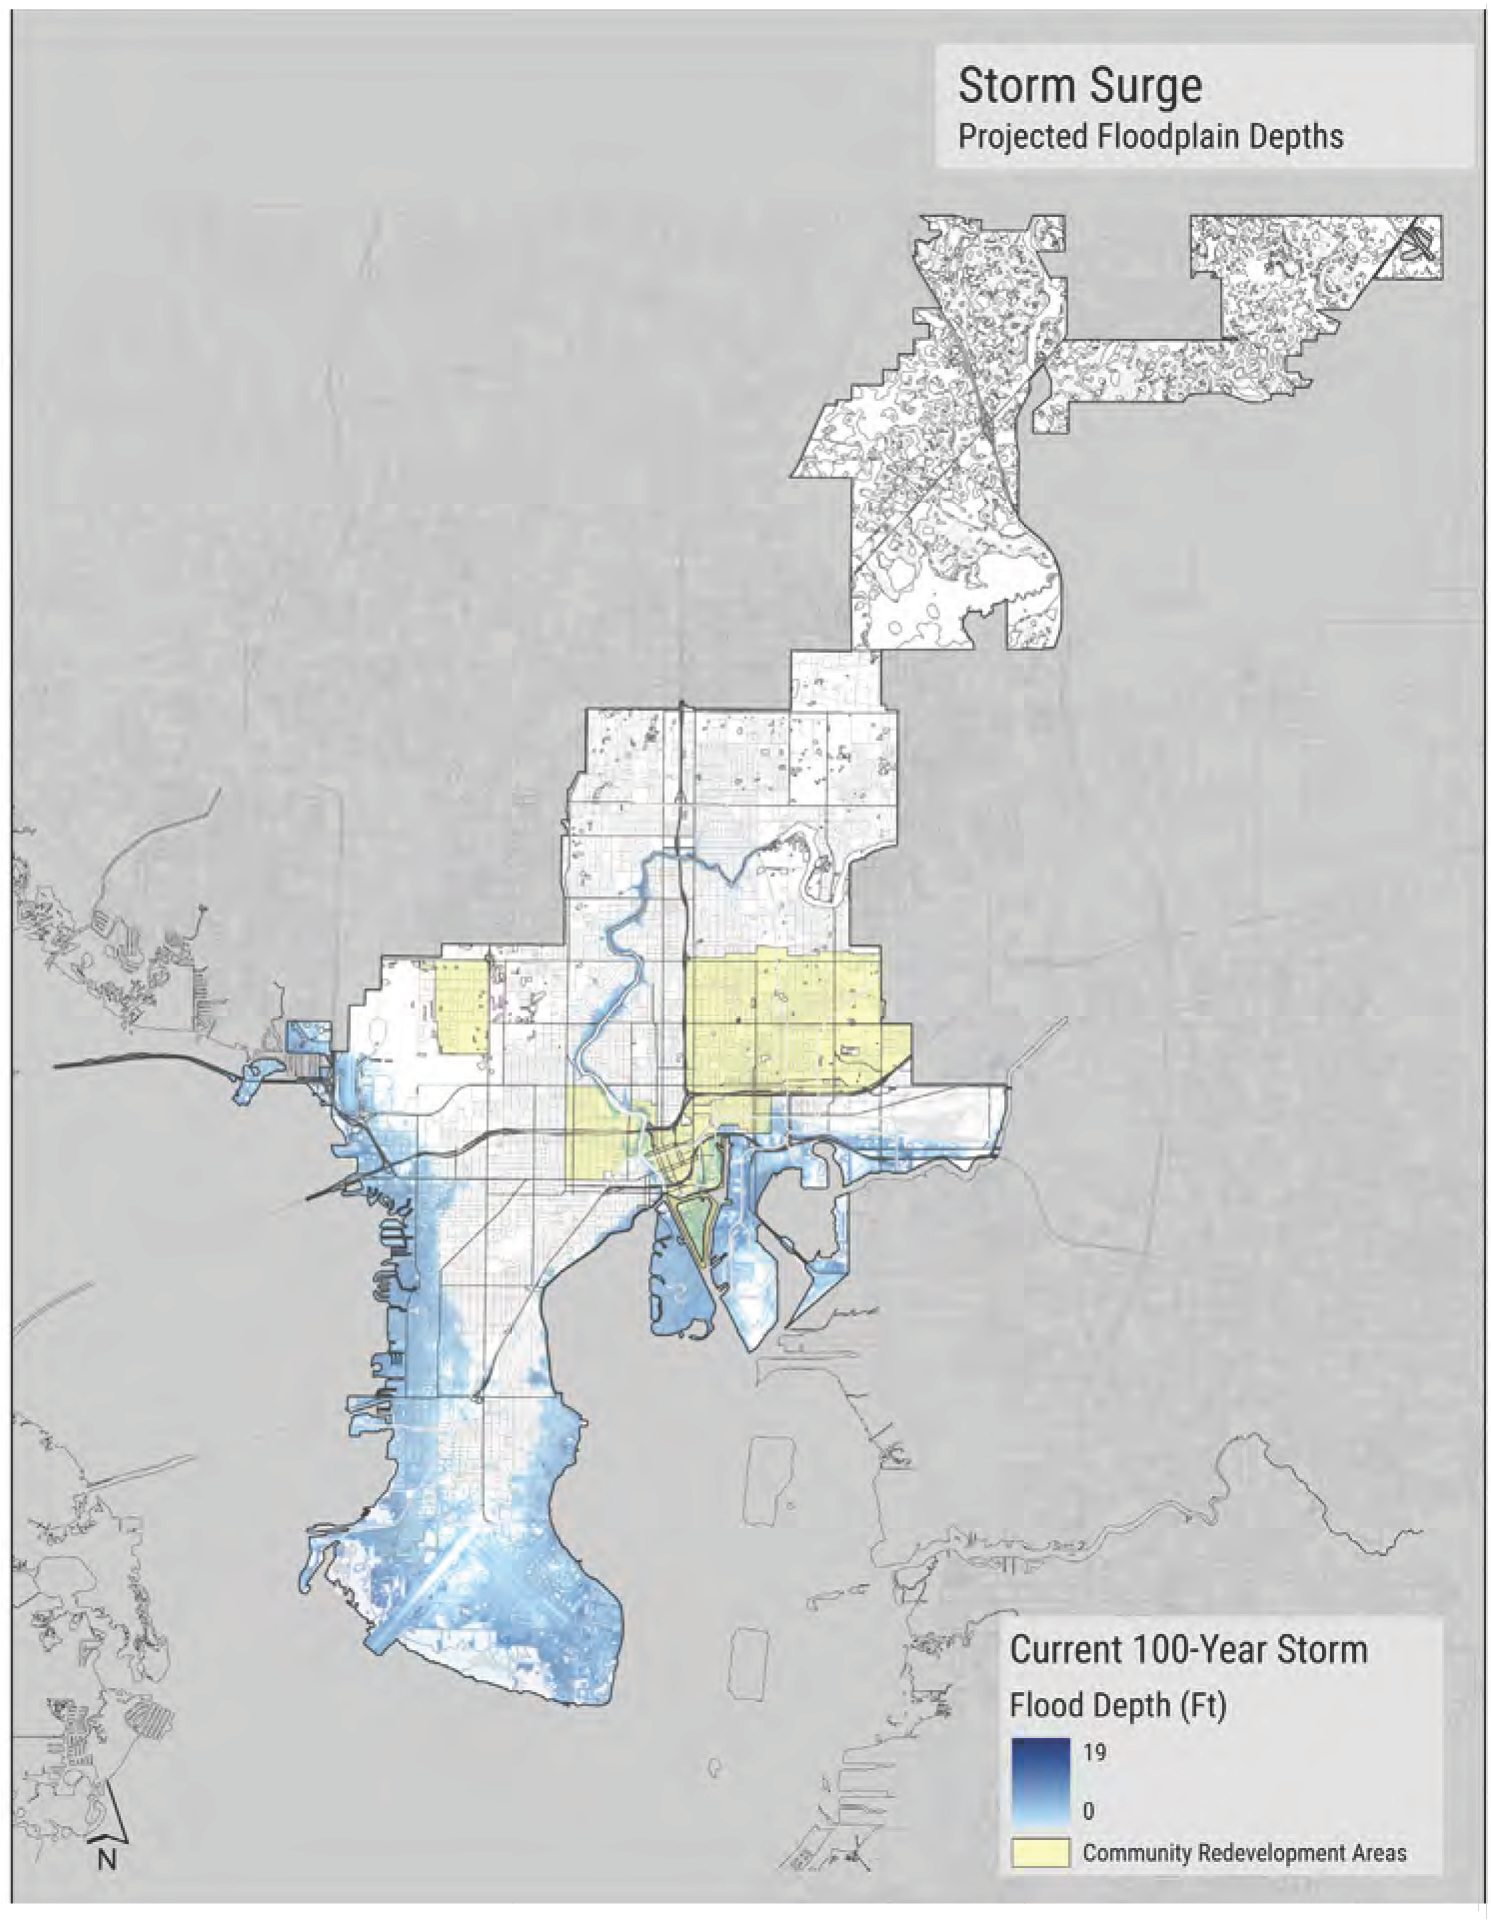
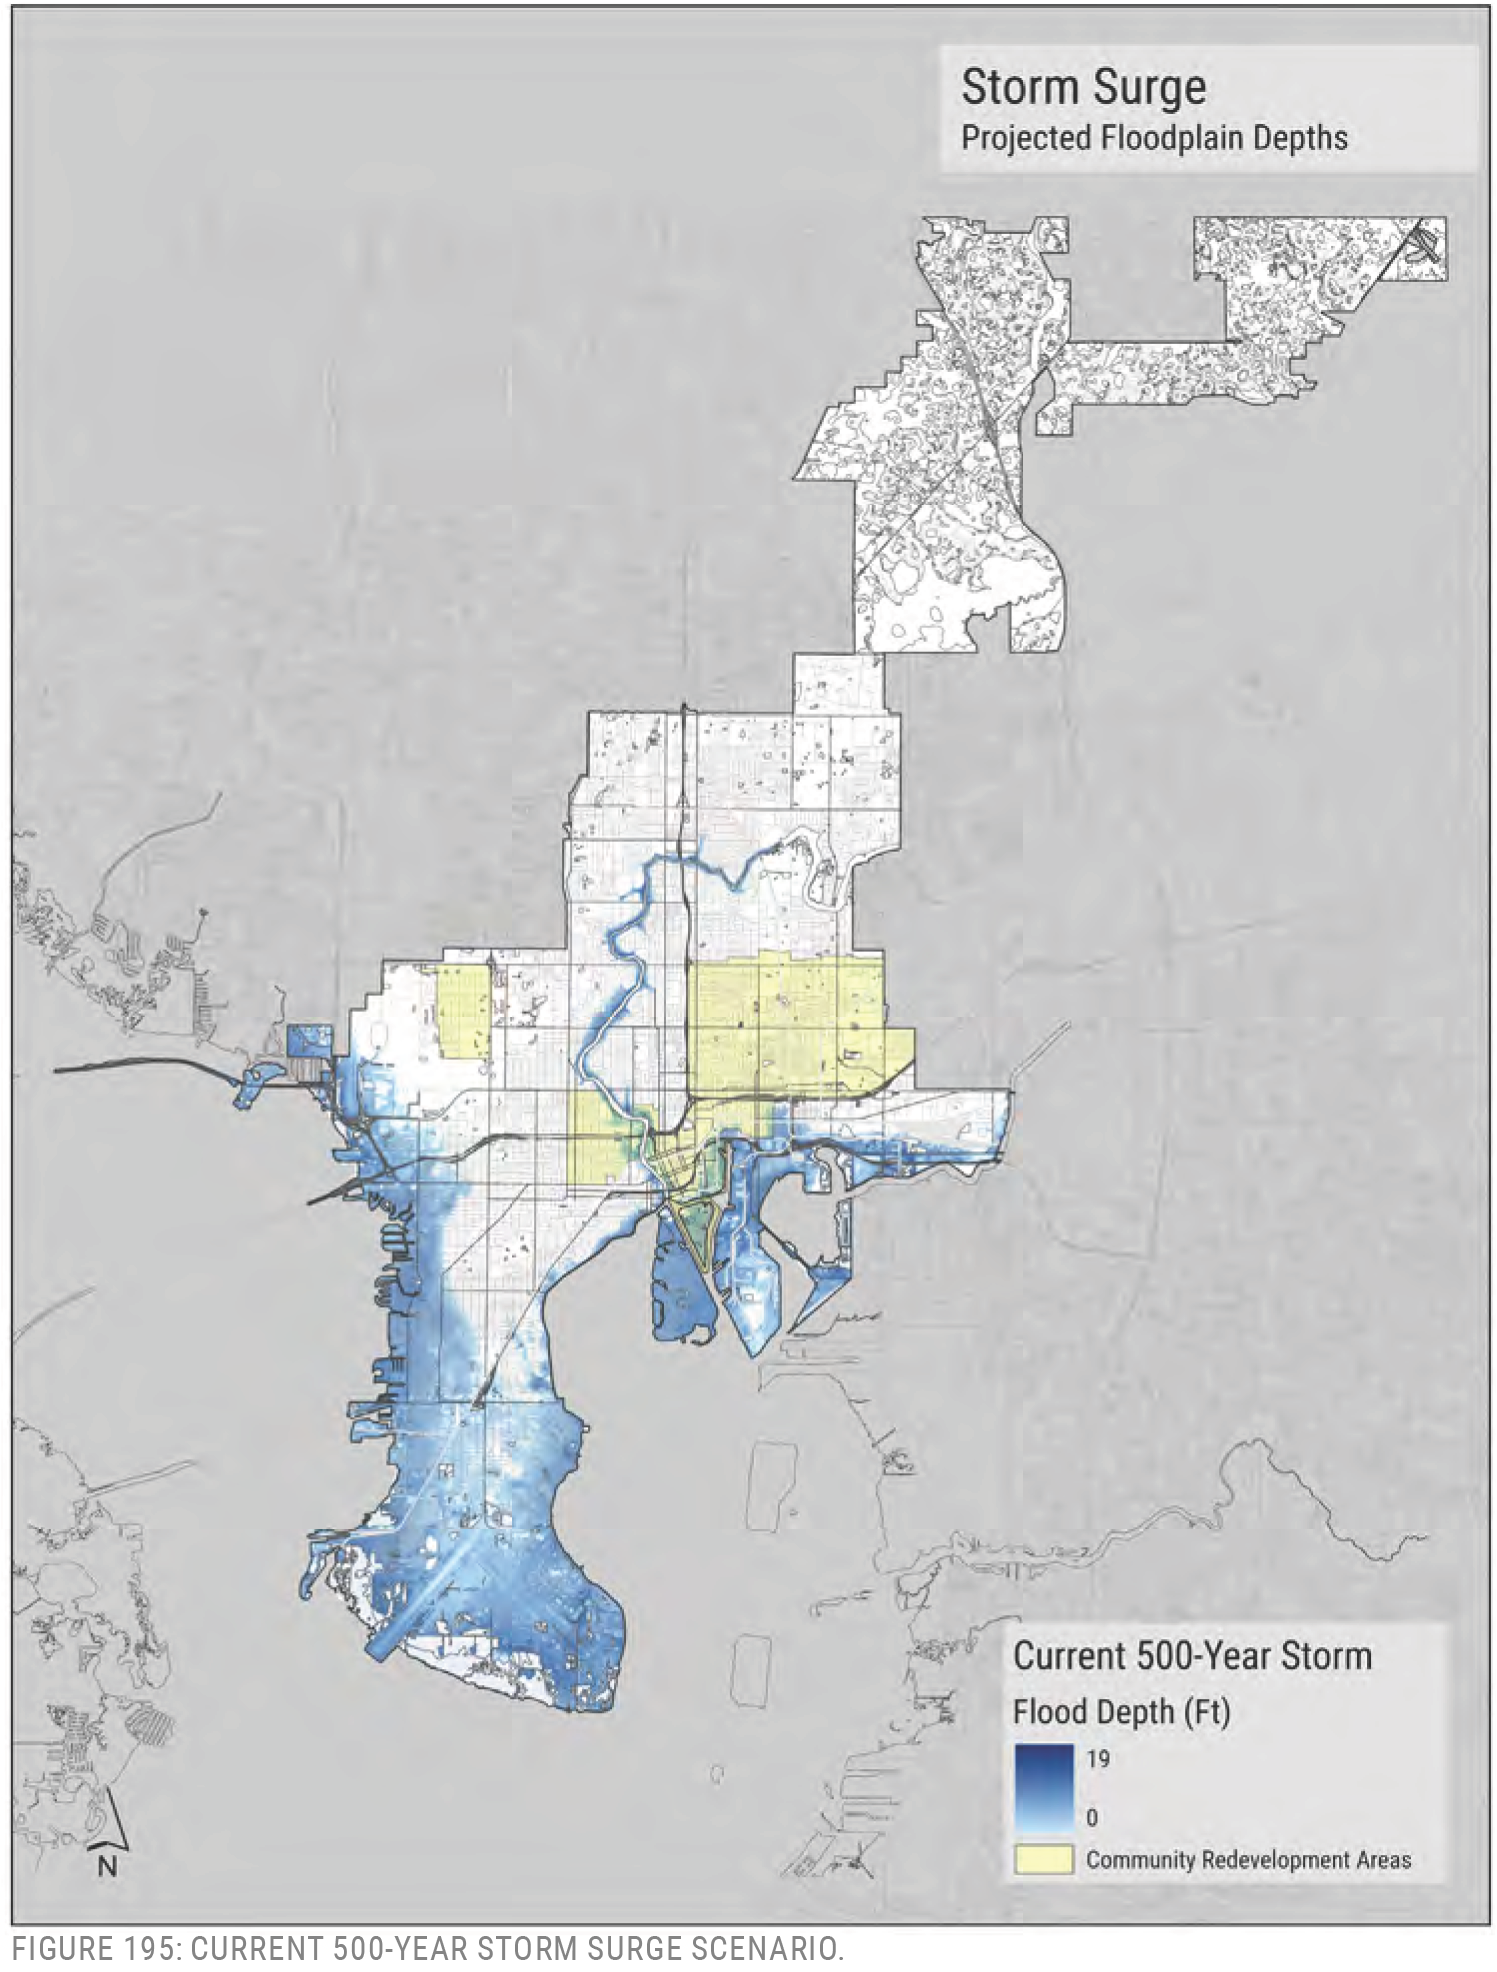
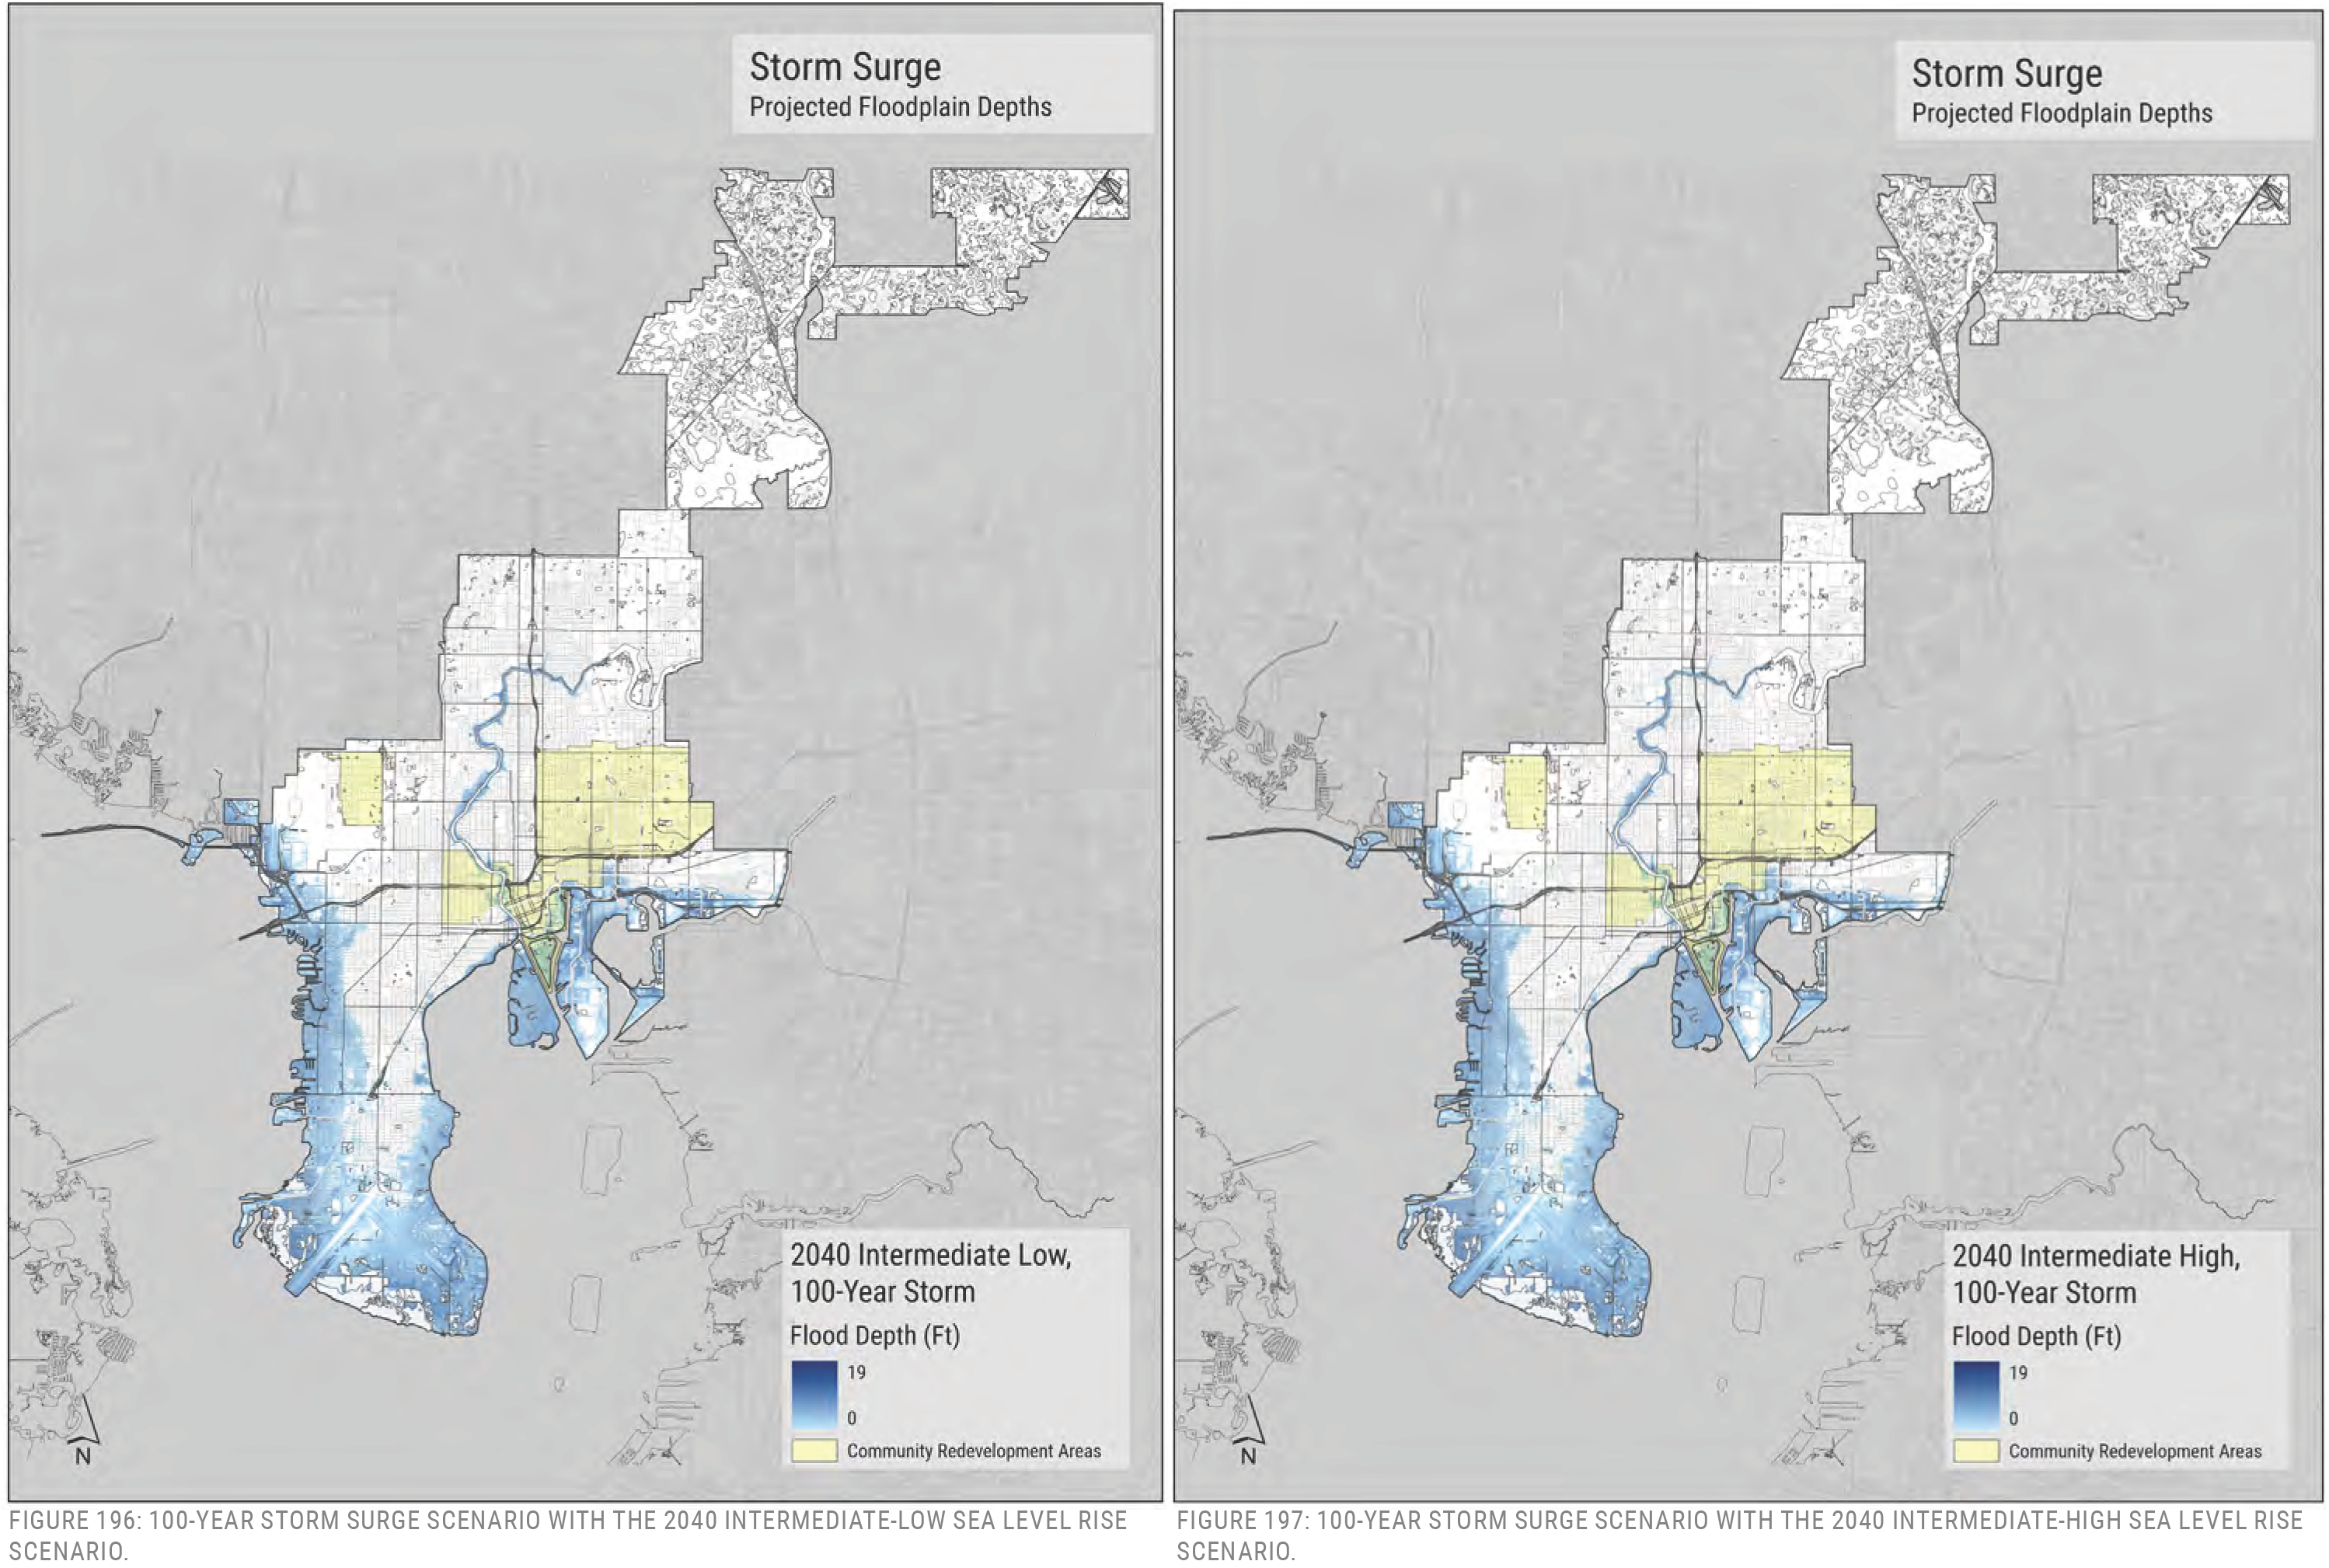
FIGURE 197: 100-YEAR STORM SURGE SCENARIO WITH THE 2040 INTERMEDIATE-HIGH SEA LEVEL RISE SCENARIO.
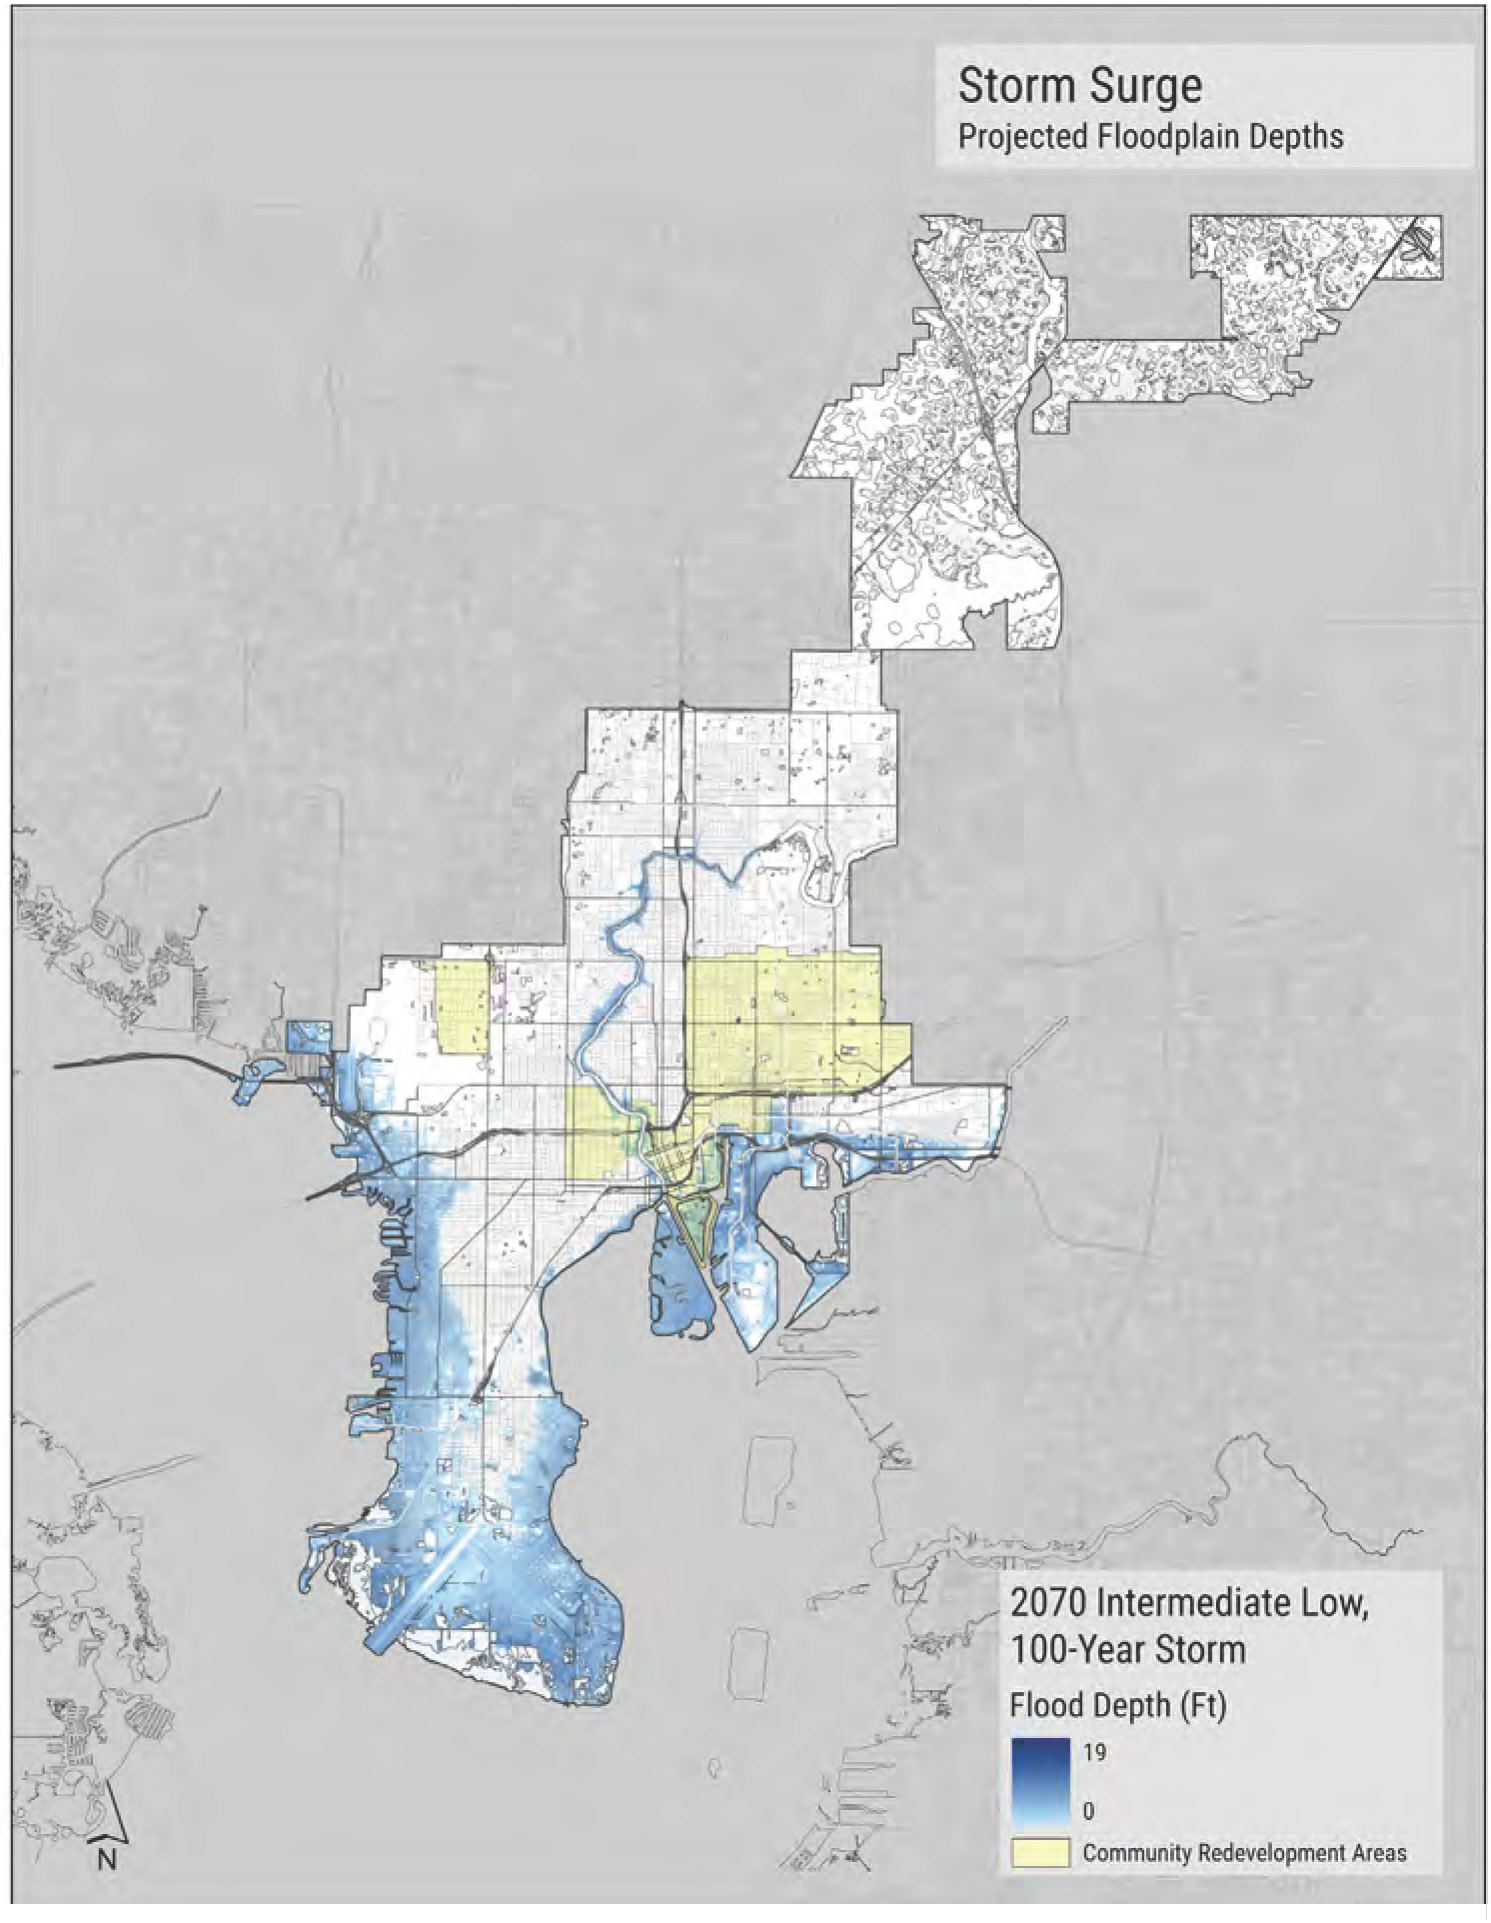
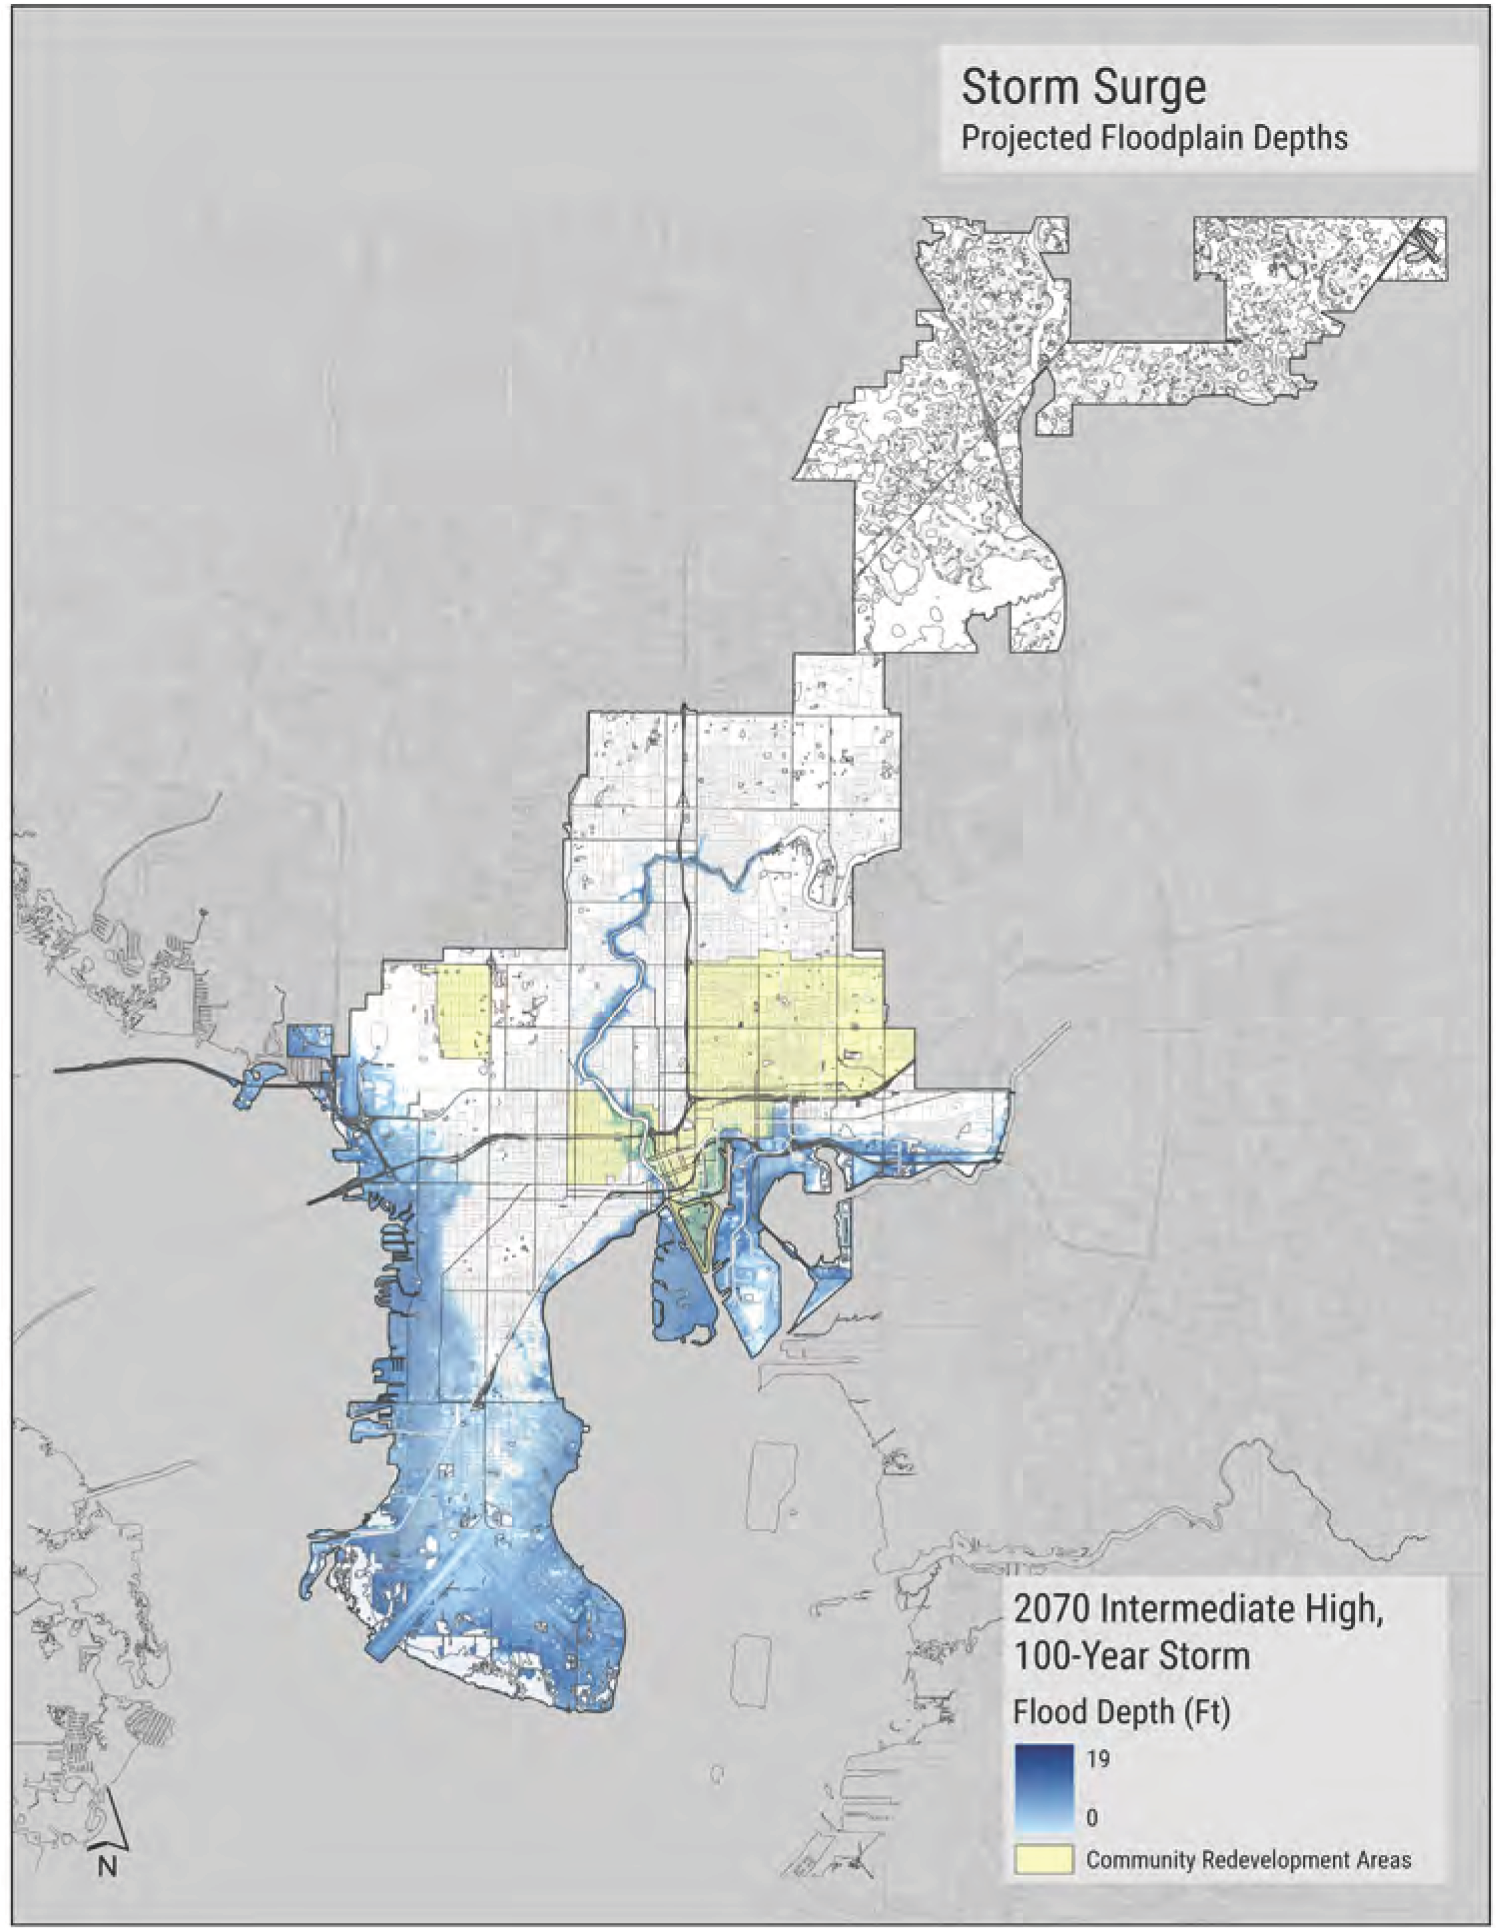
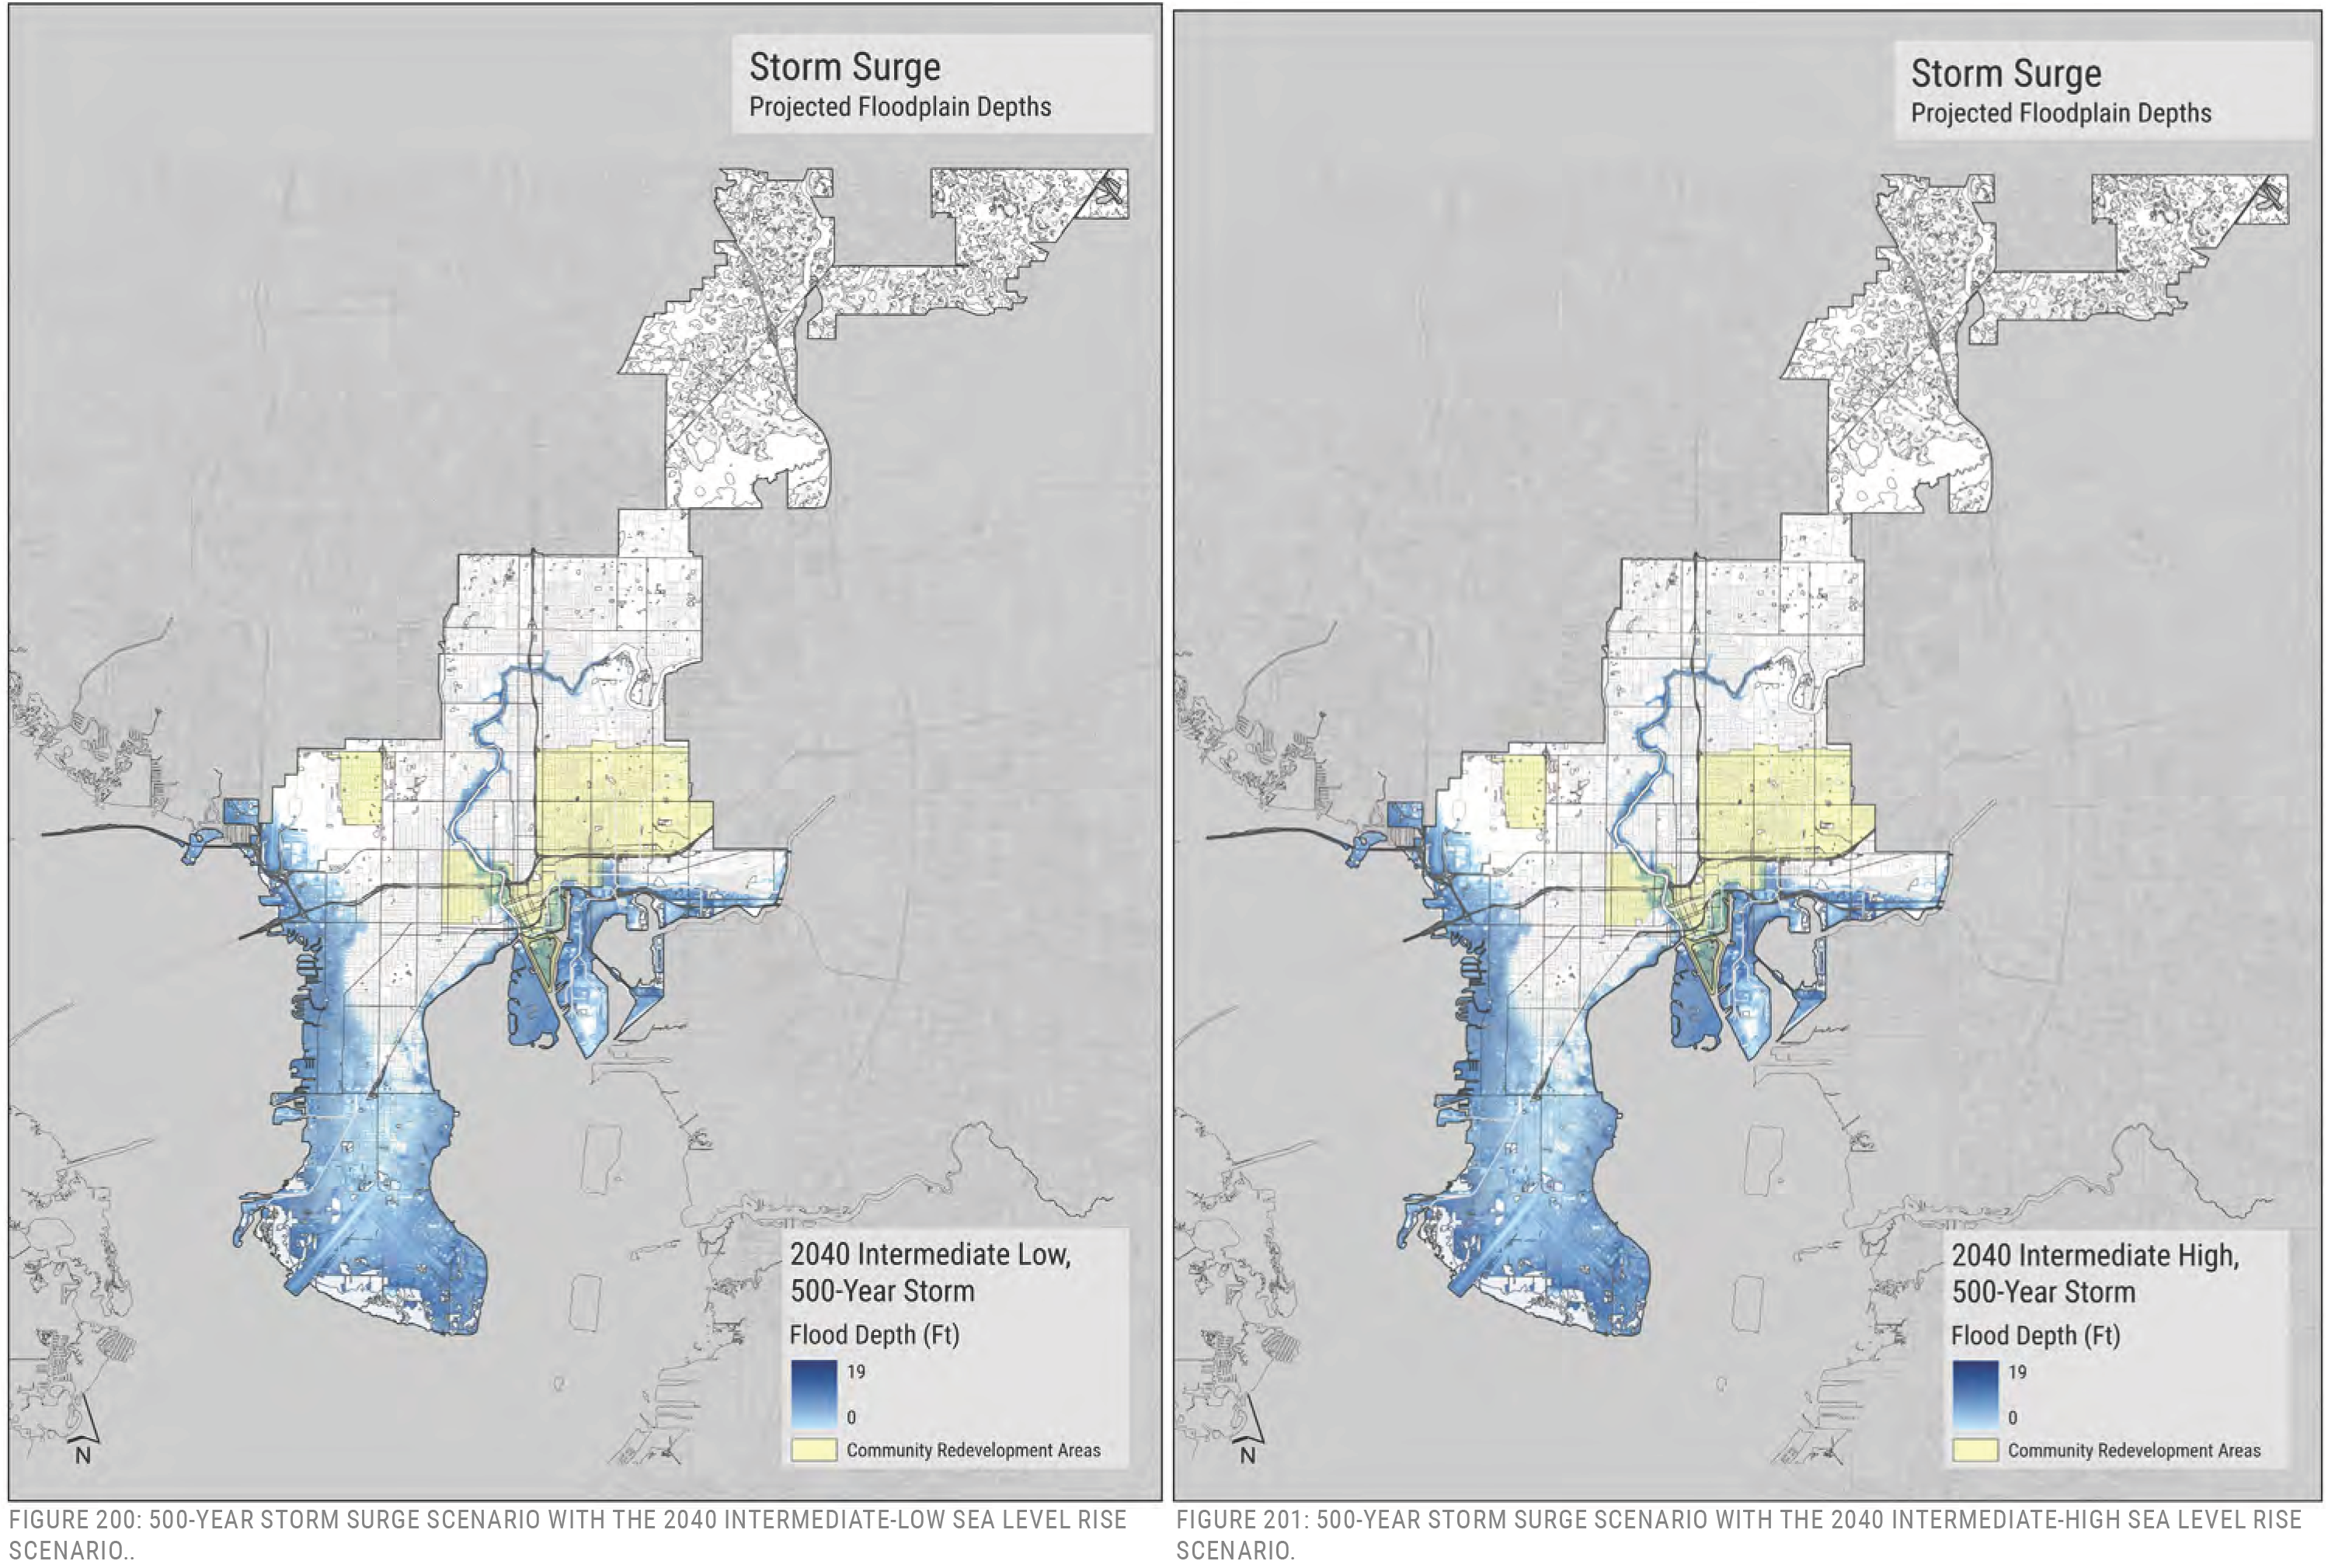
FIGURE 200: 500-YEAR STORM SURGE SCENARIO WITH THE 2040 INTERMEDIATE-LOW SEA LEVEL RISE SCENARIO. Storm Surge Projected Floodplain Depths. Intermediate Low, 500-Year Storm, Flood Depth (Ft), Community Redevelopment Areas.
FIGURE 201: 500-YEAR STORM SURGE SCENARIO WITH THE 2040 INTERMEDIATE-HIGH SEA LEVEL RISE SCENARIO. Storm Surge Projected Floodplain Depths. Intermediate High, 500-Year Storm, Flood Depth (Ft), Community Redevelopment Areas.
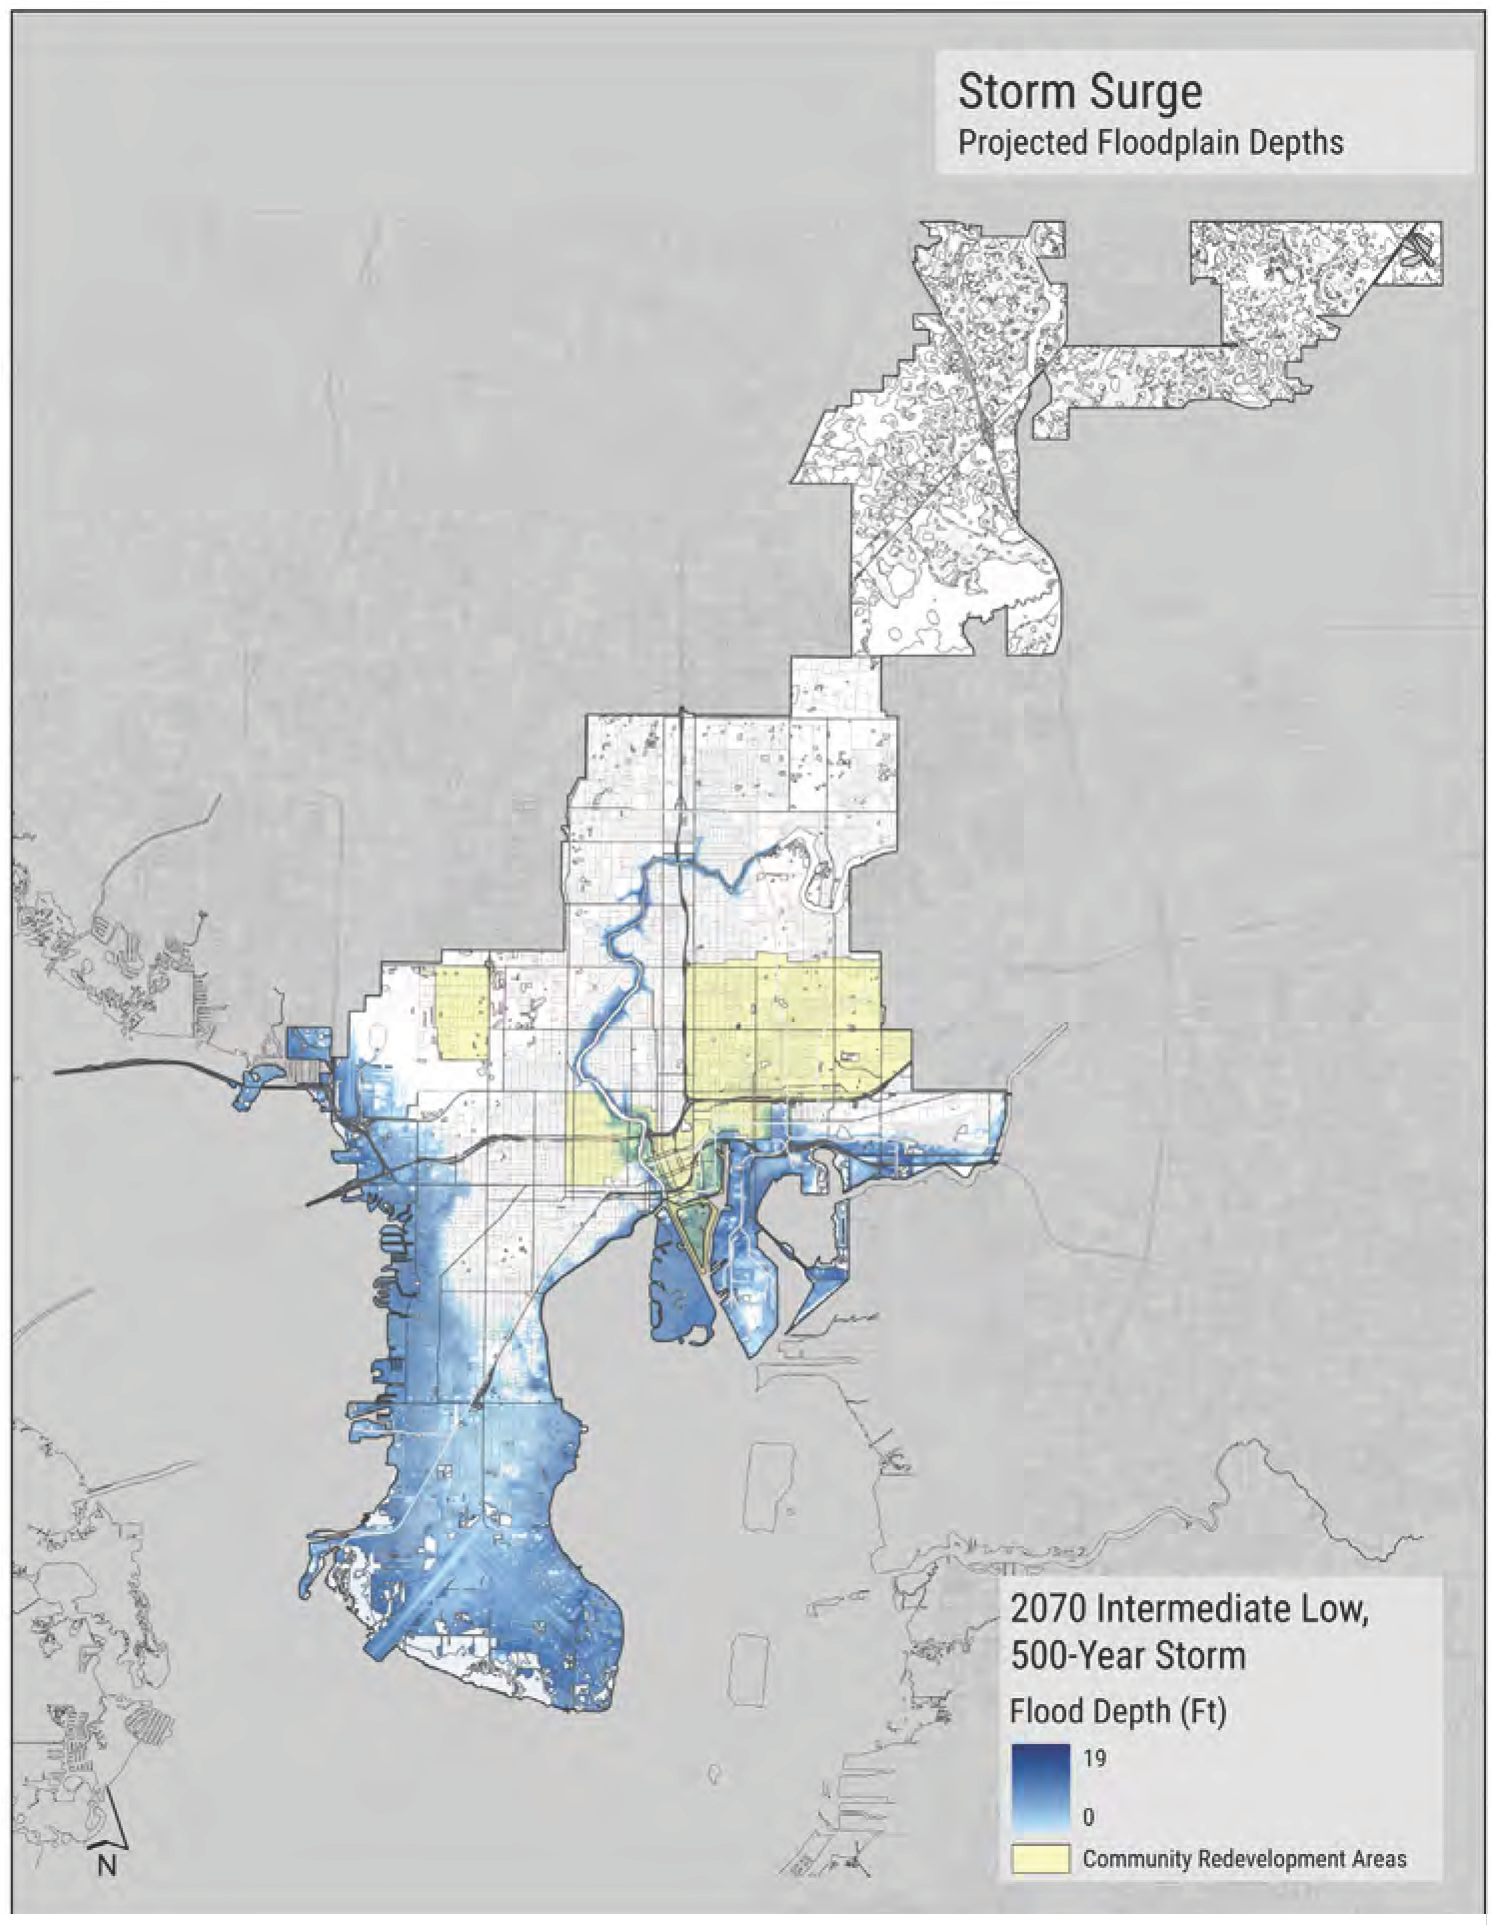
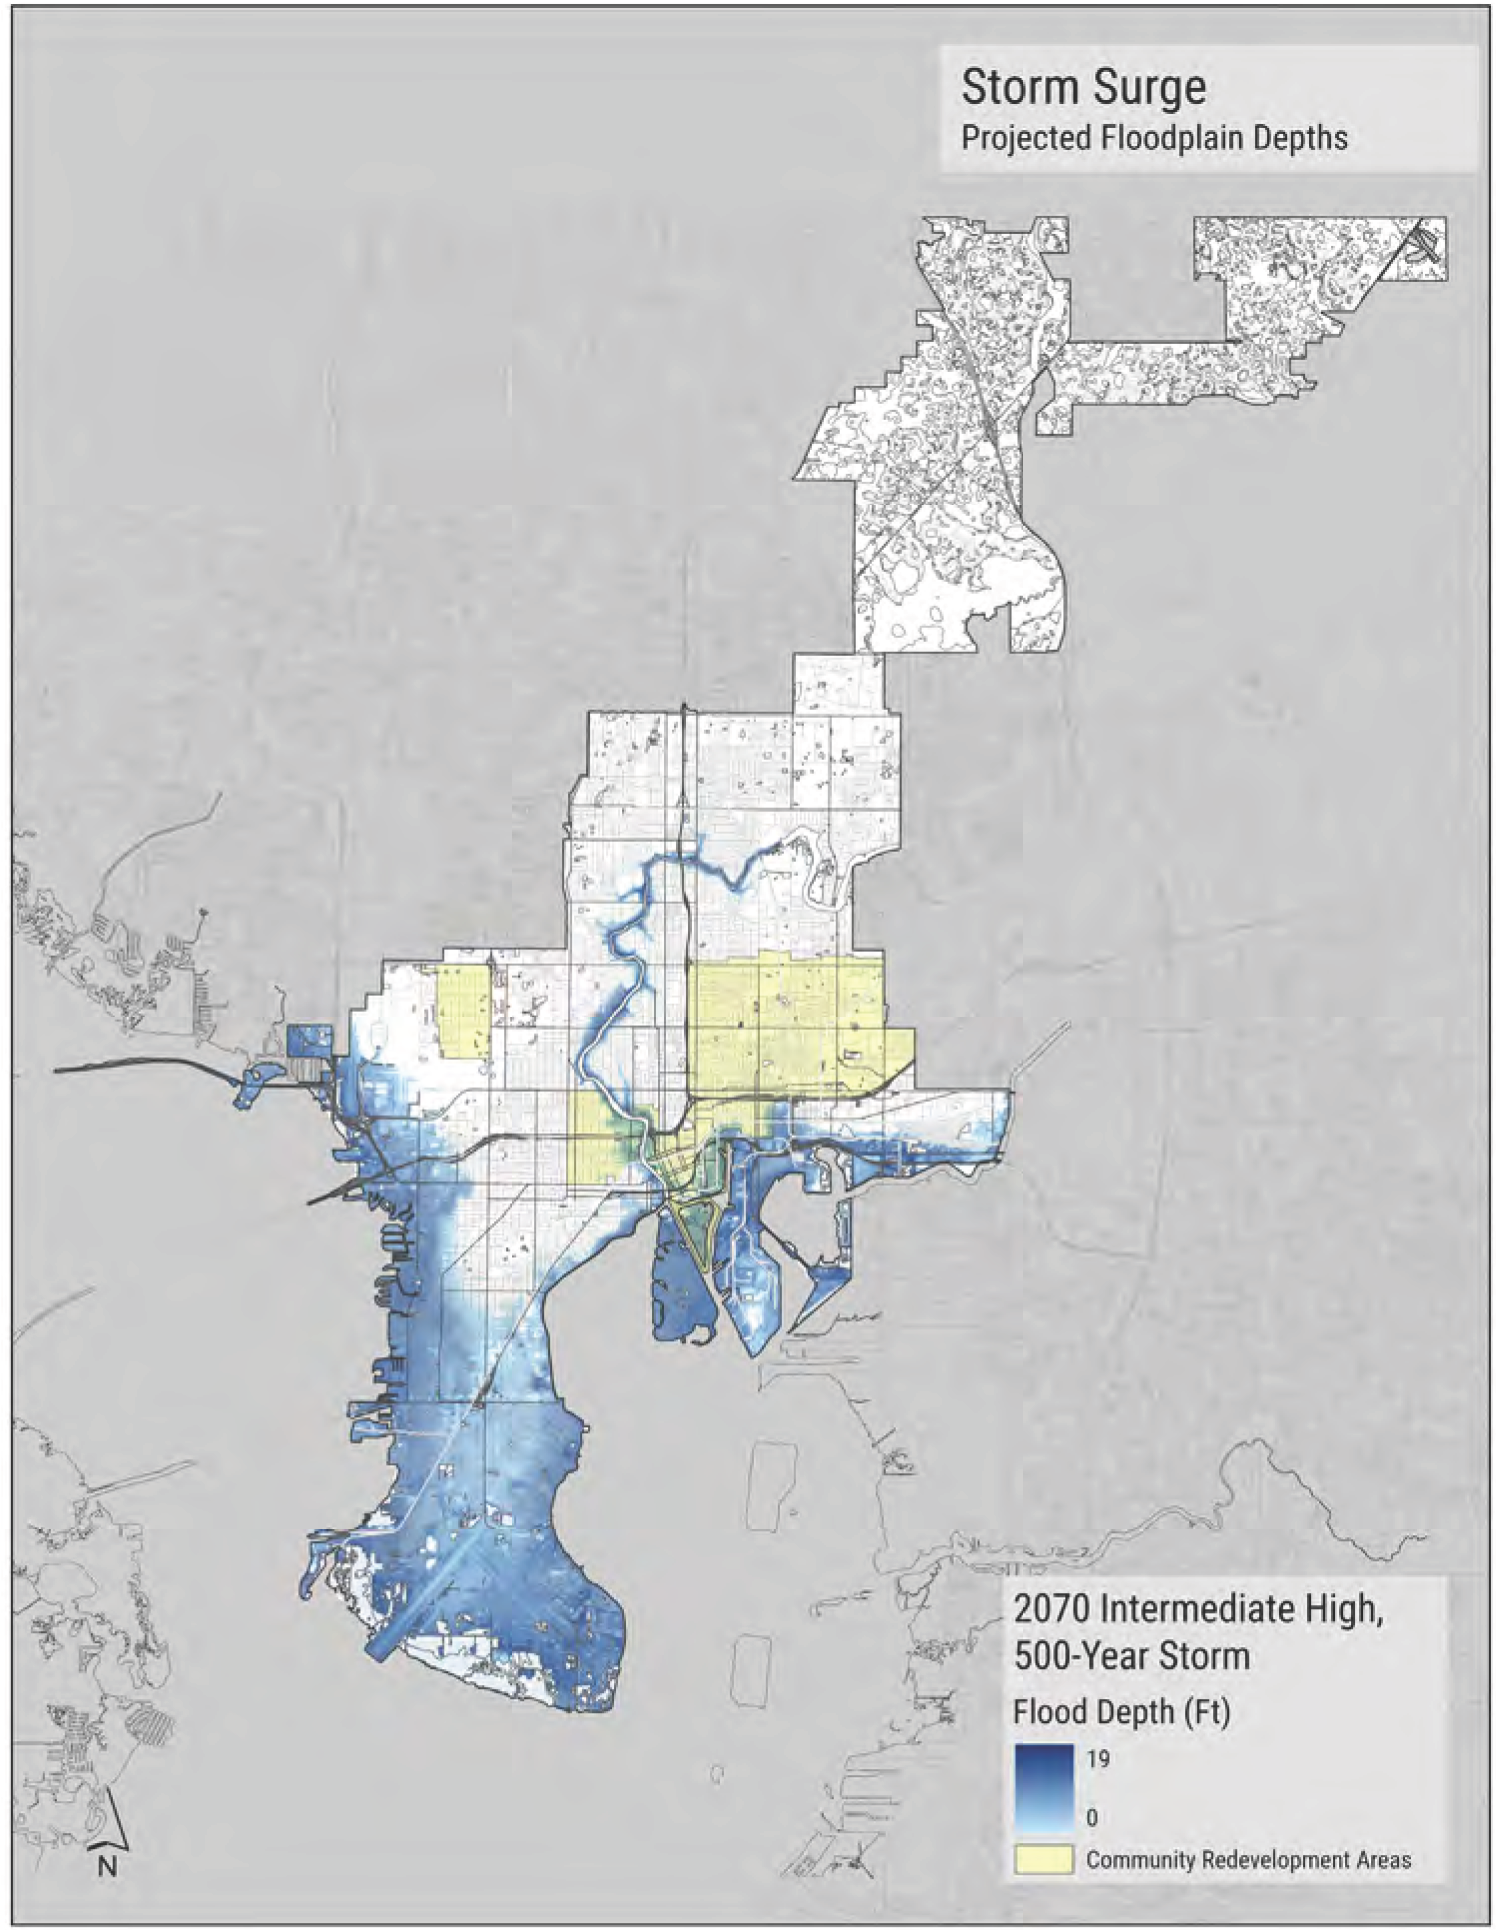
Sensitivity Analysis
In addition to the maps and tables provided within the body of the report, the following maps show city-wide assets in relation to the intermediate-low scenarios. For simplicity and efficiency, the intermediate-high scenarios were shown on the maps within the report.
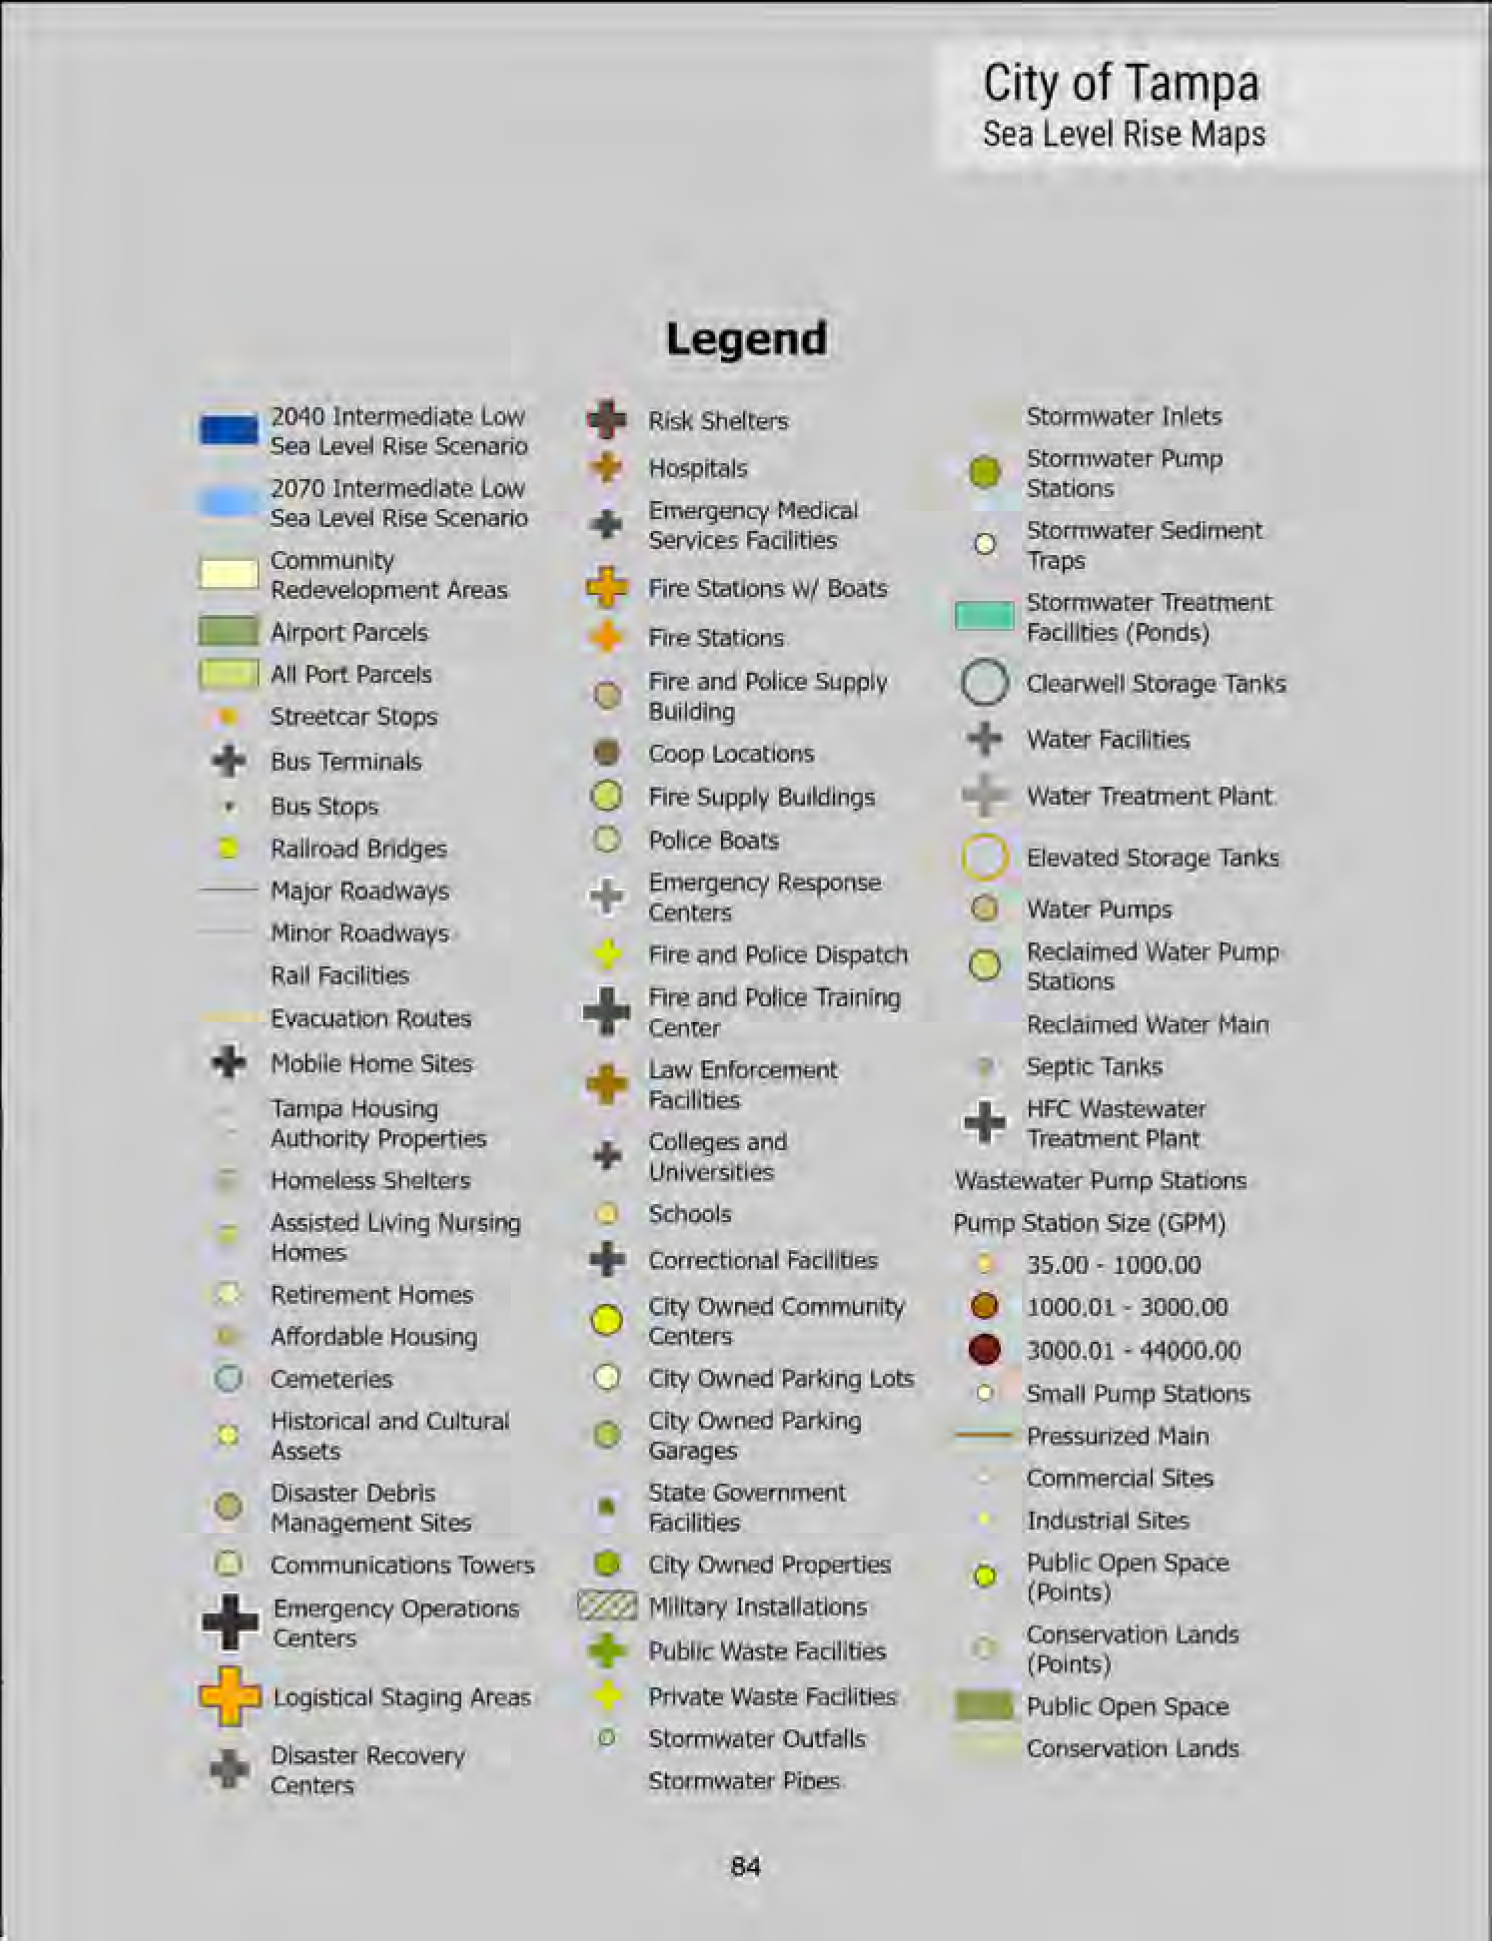
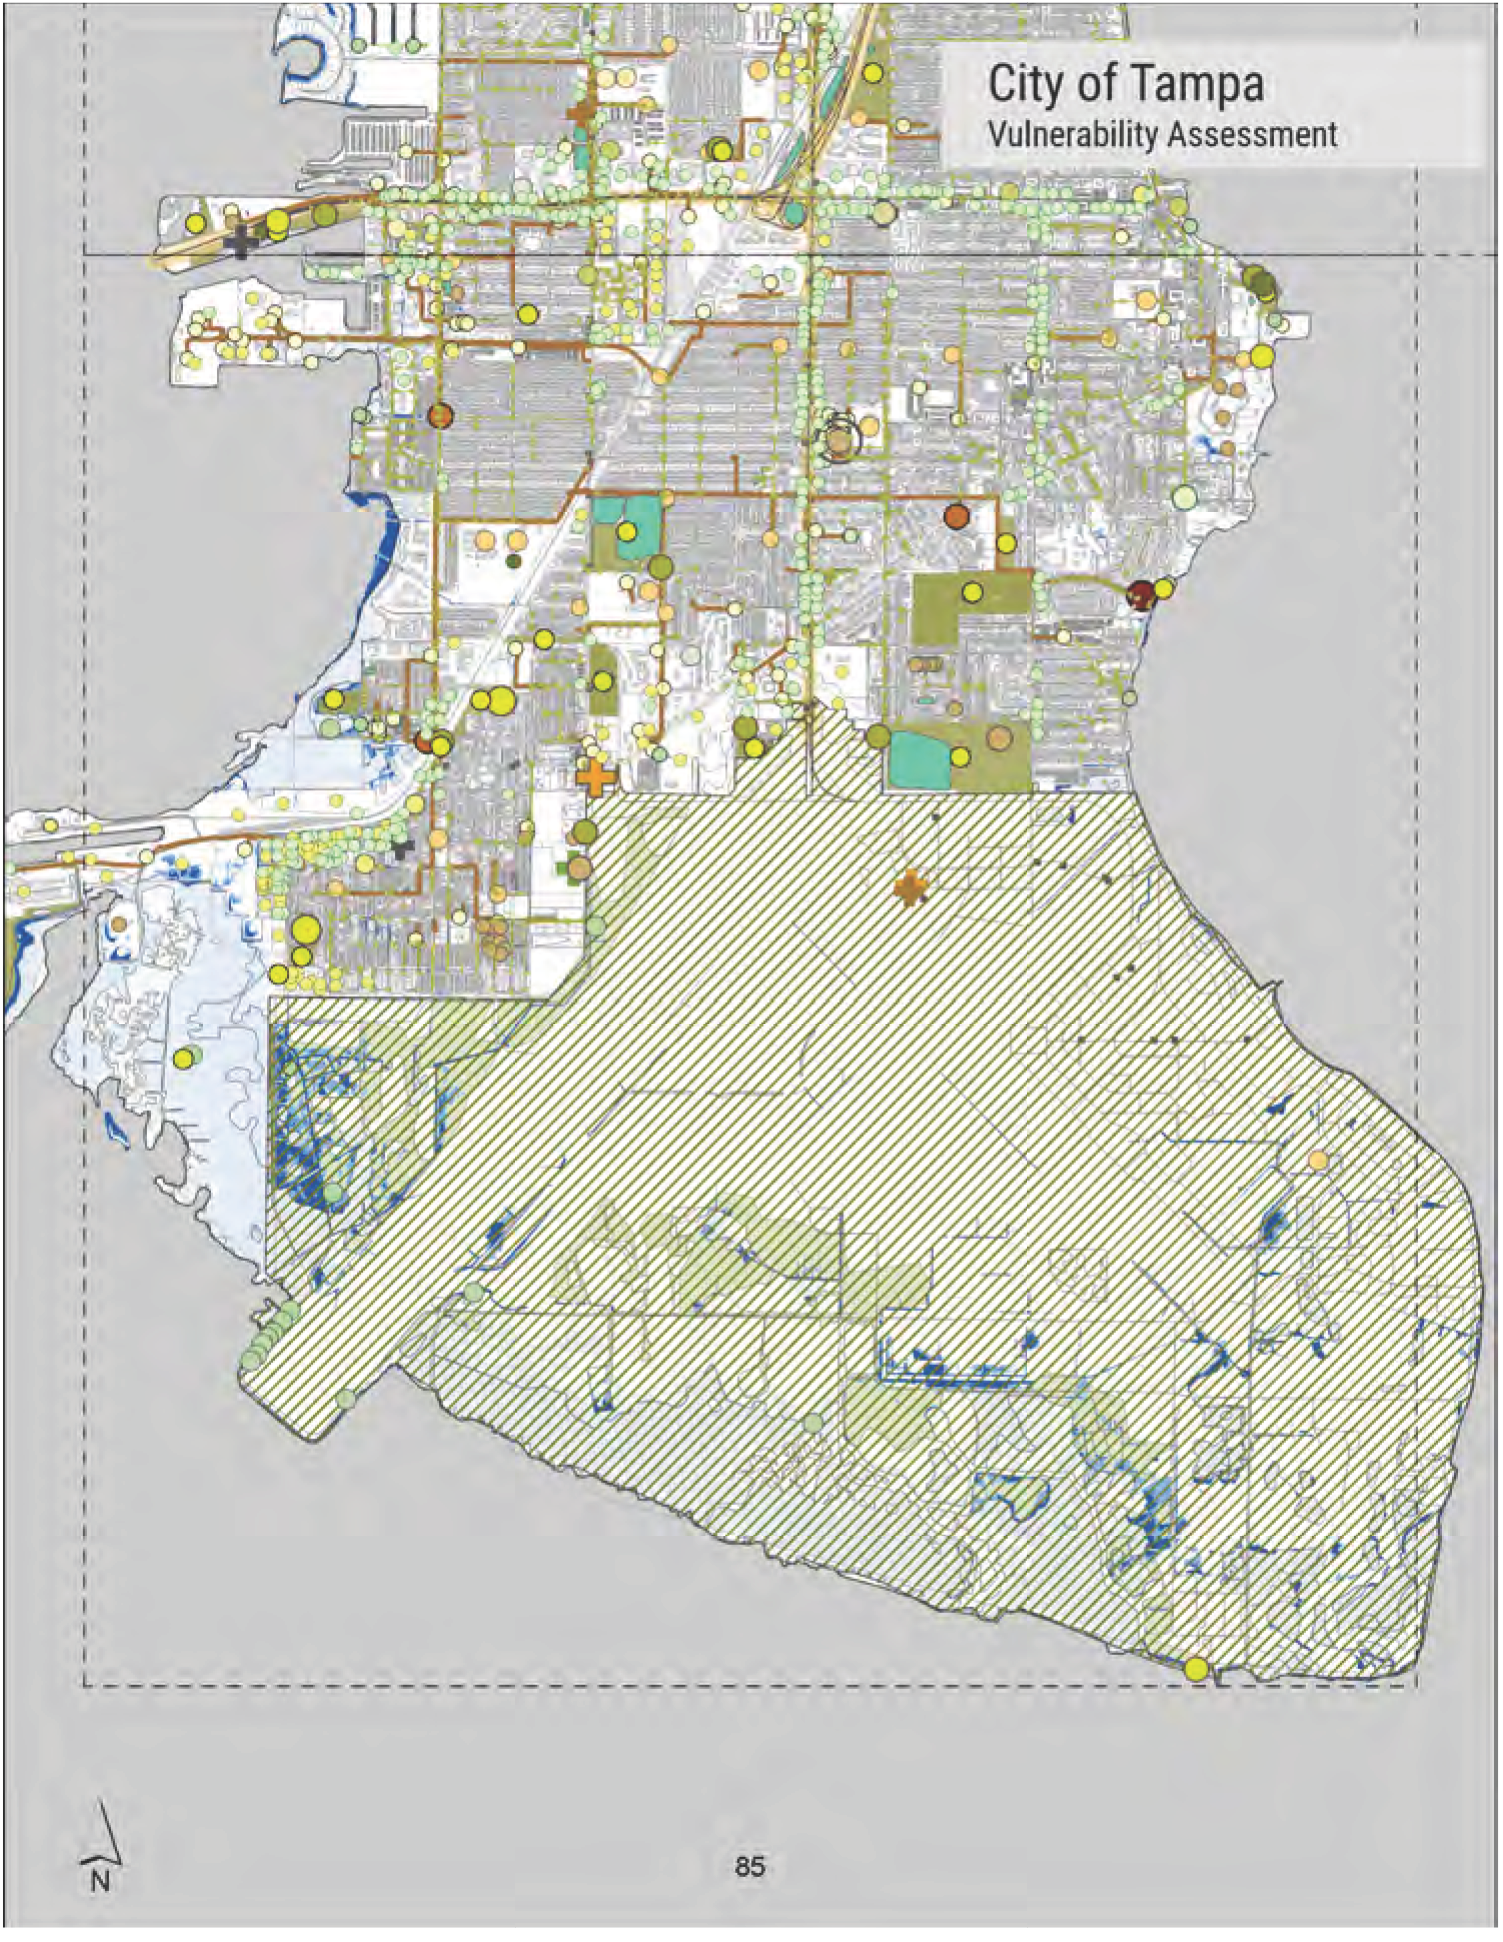
FIGURE 205: ALL CITY ASSETS WITH THE INTERMEDIATE-LOW SEA LEVEL RISE SCENARIOS.
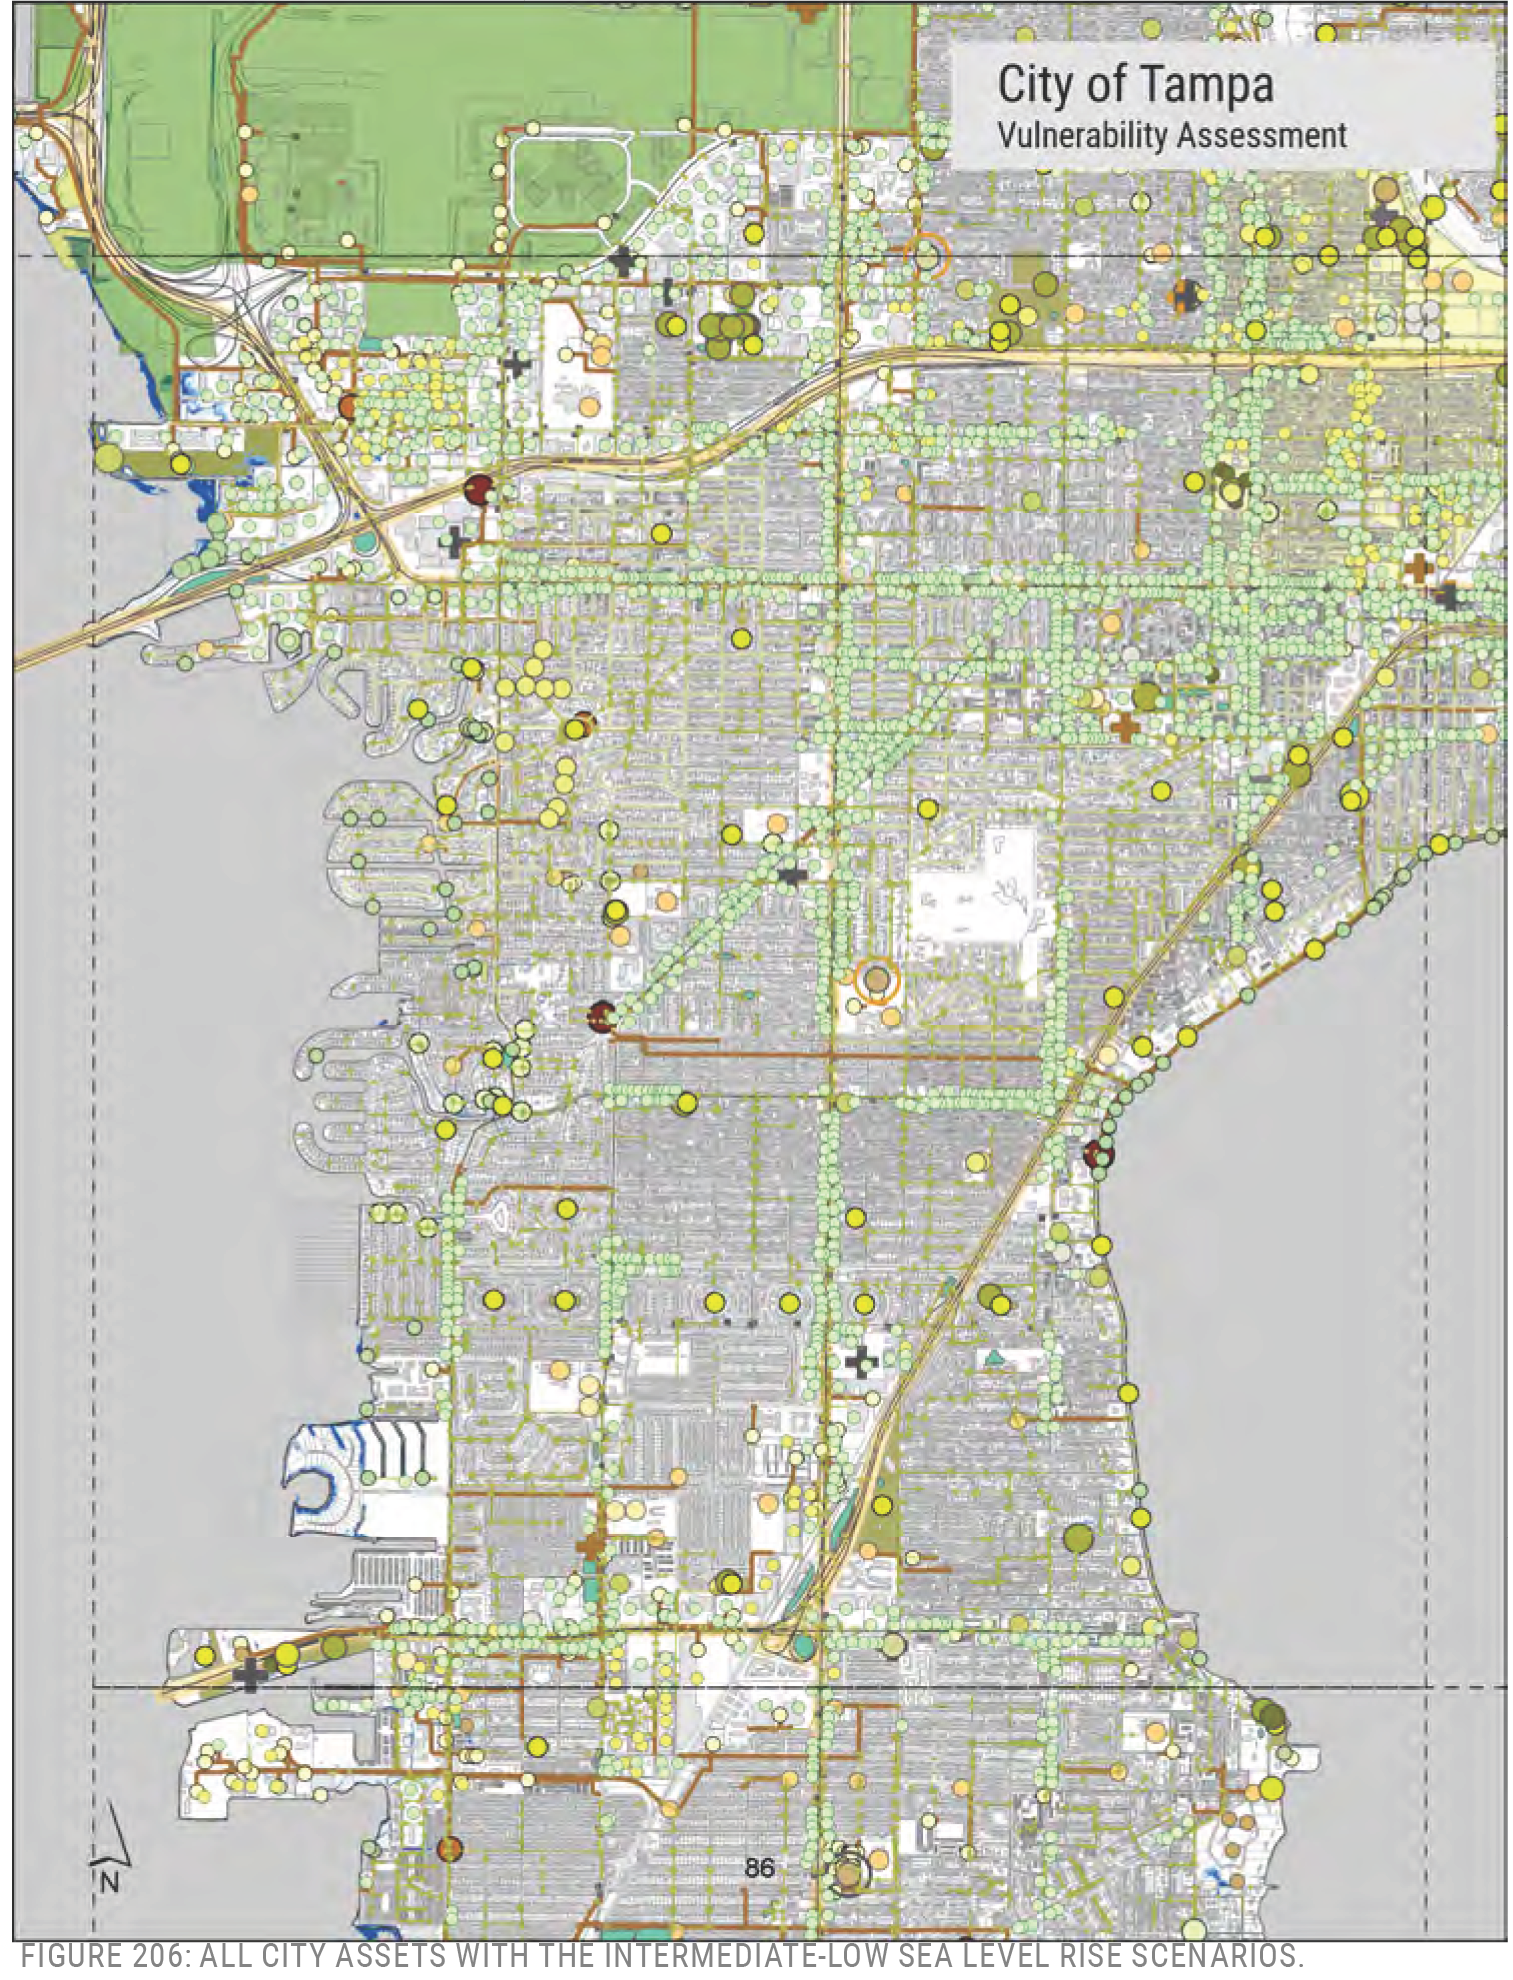
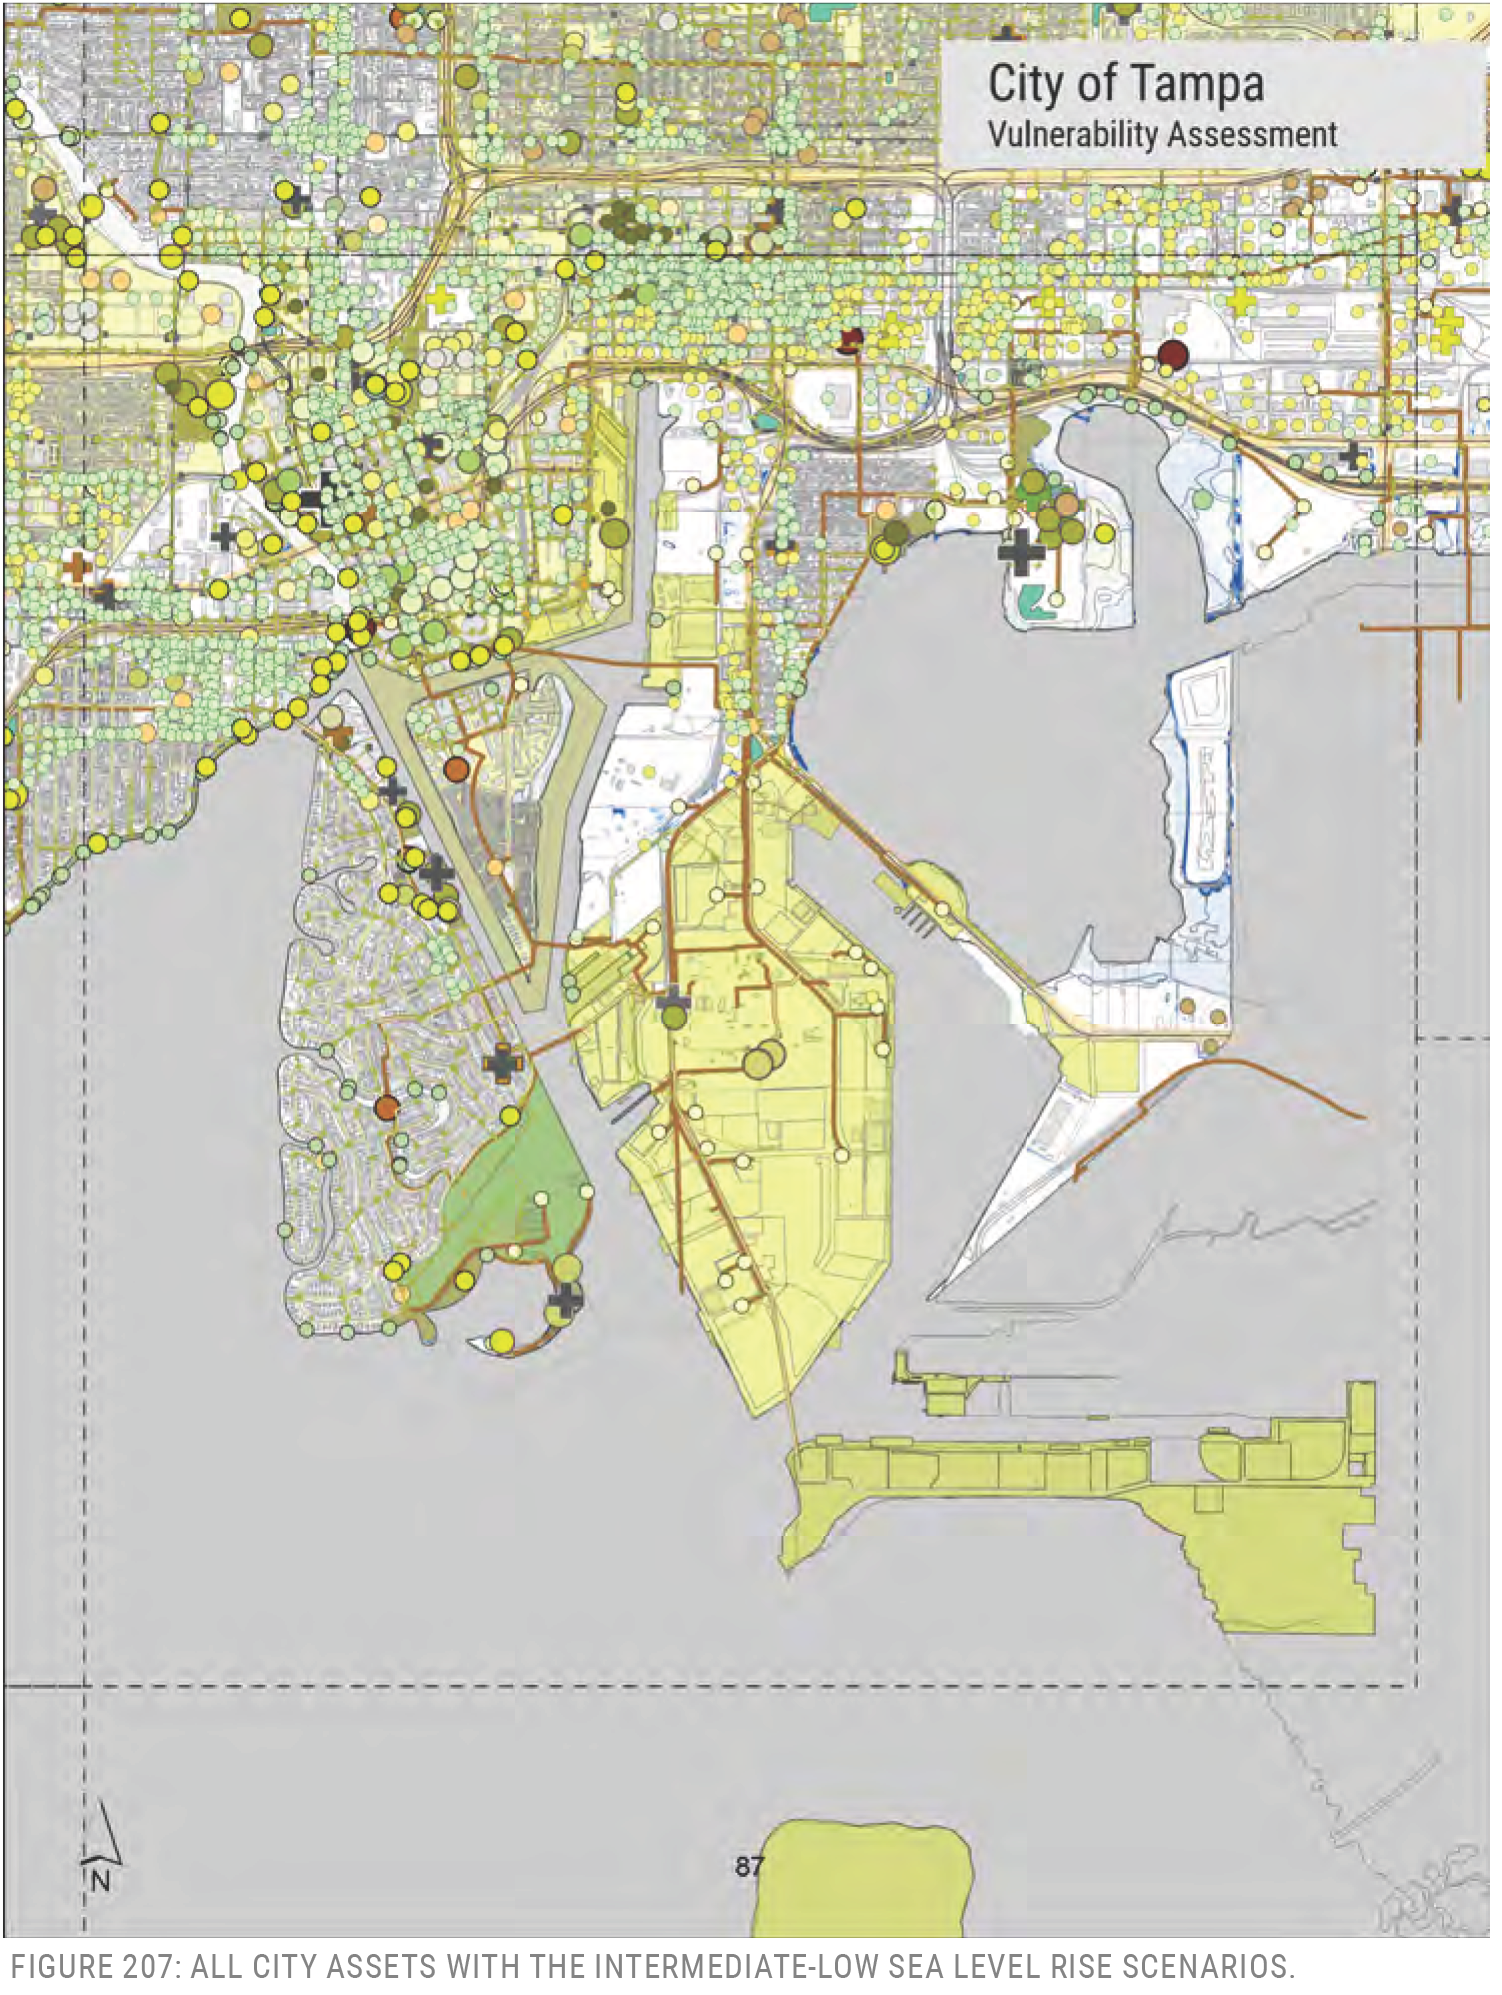
FIGURE 207: ALL CITY ASSETS WITH THE INTERMEDIATE-LOW SEA LEVEL RISE SCENARIOS.
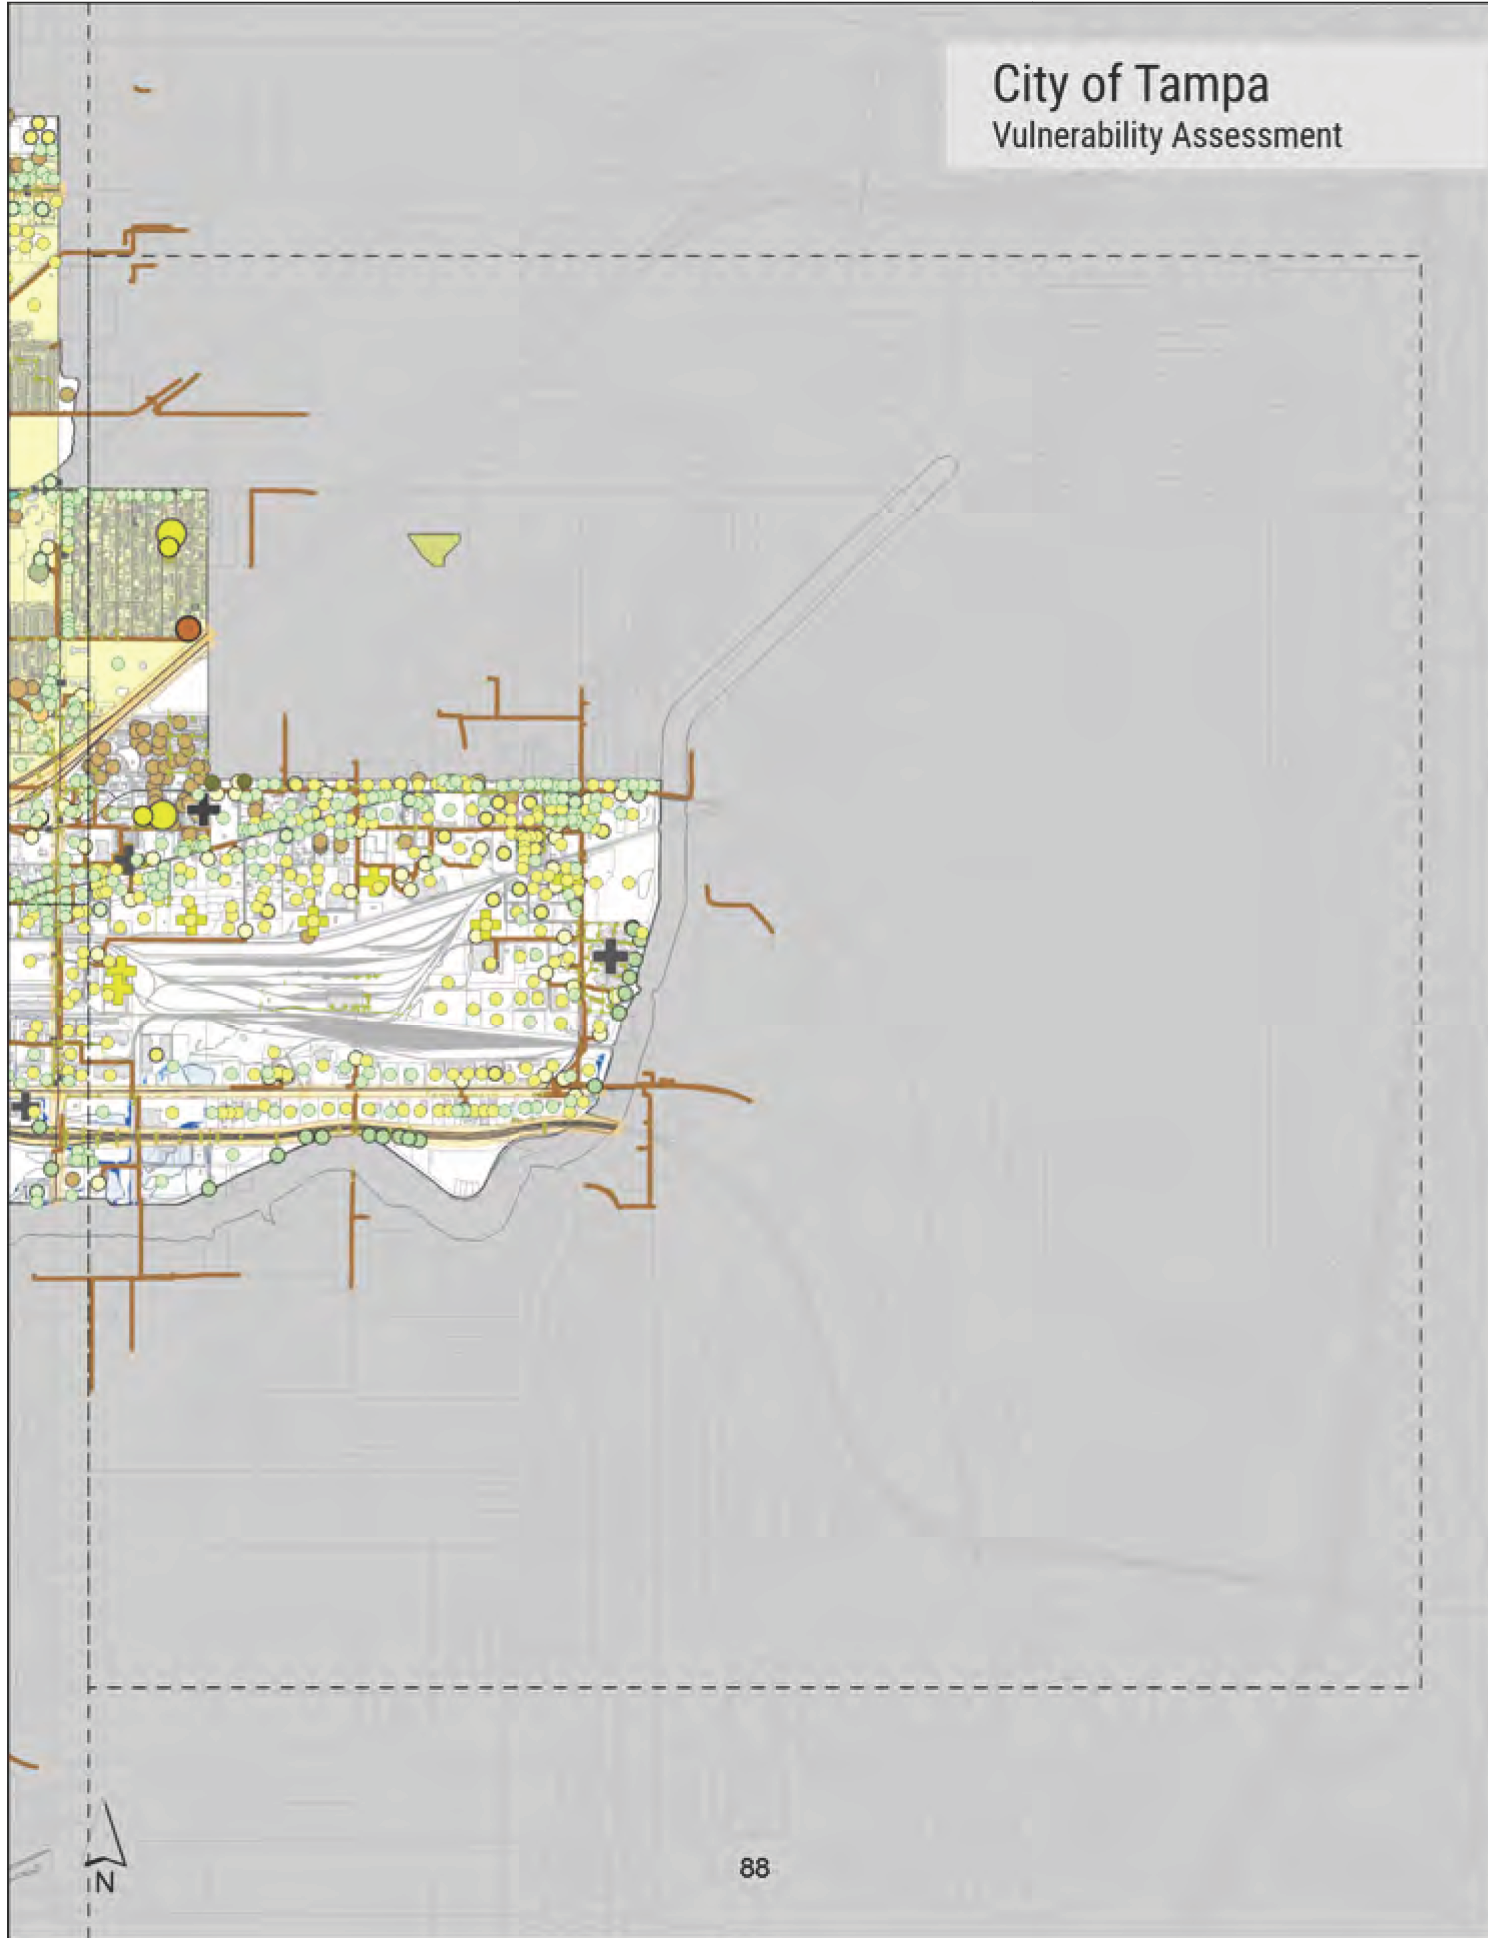
City of Tampa Vulnerability Assessment
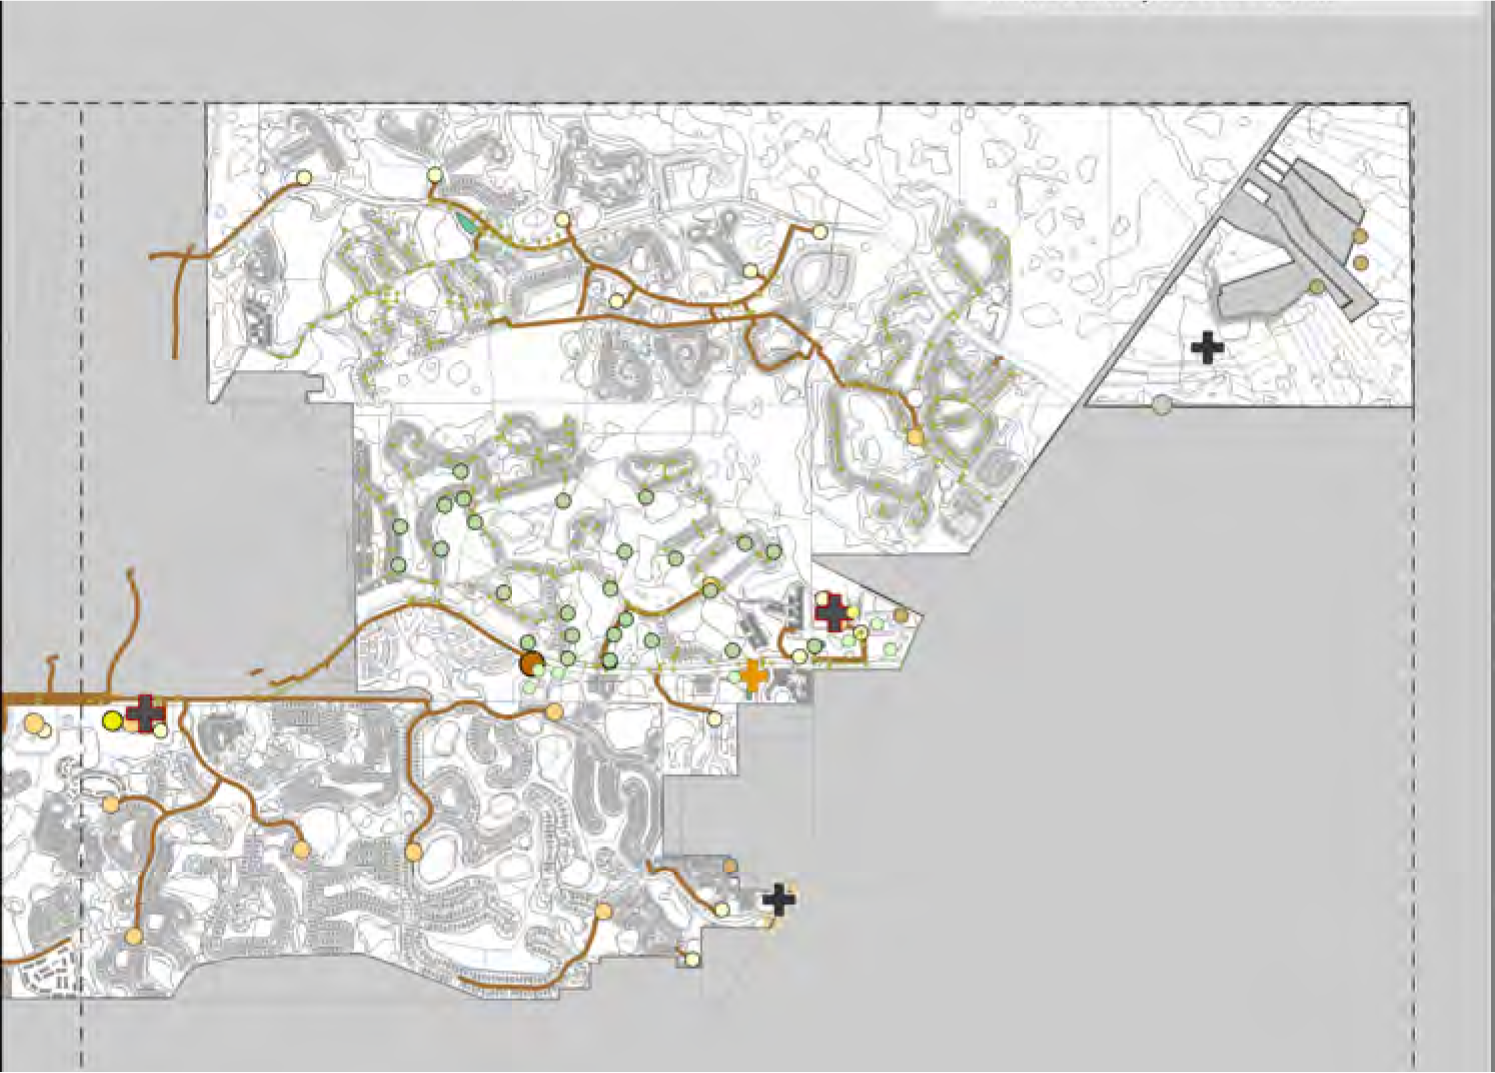
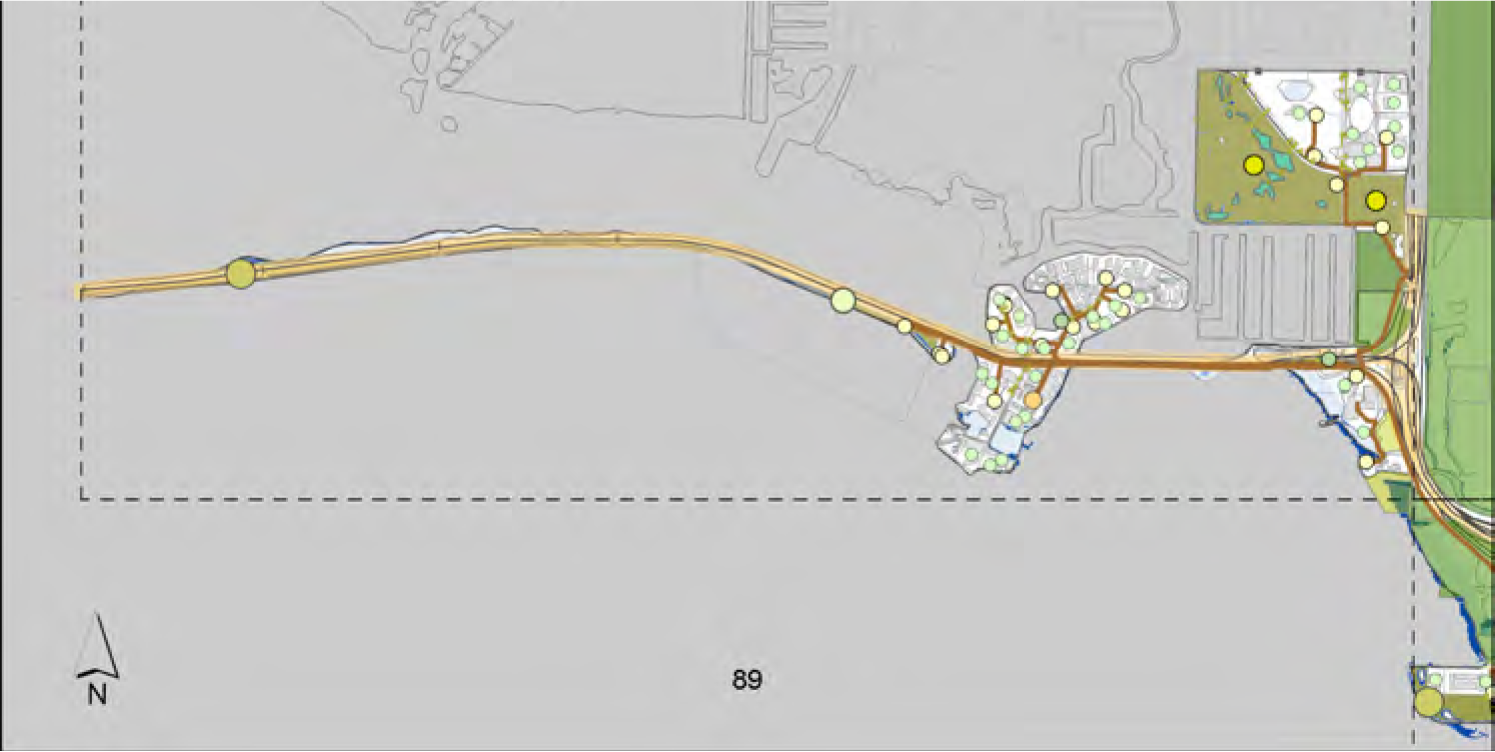
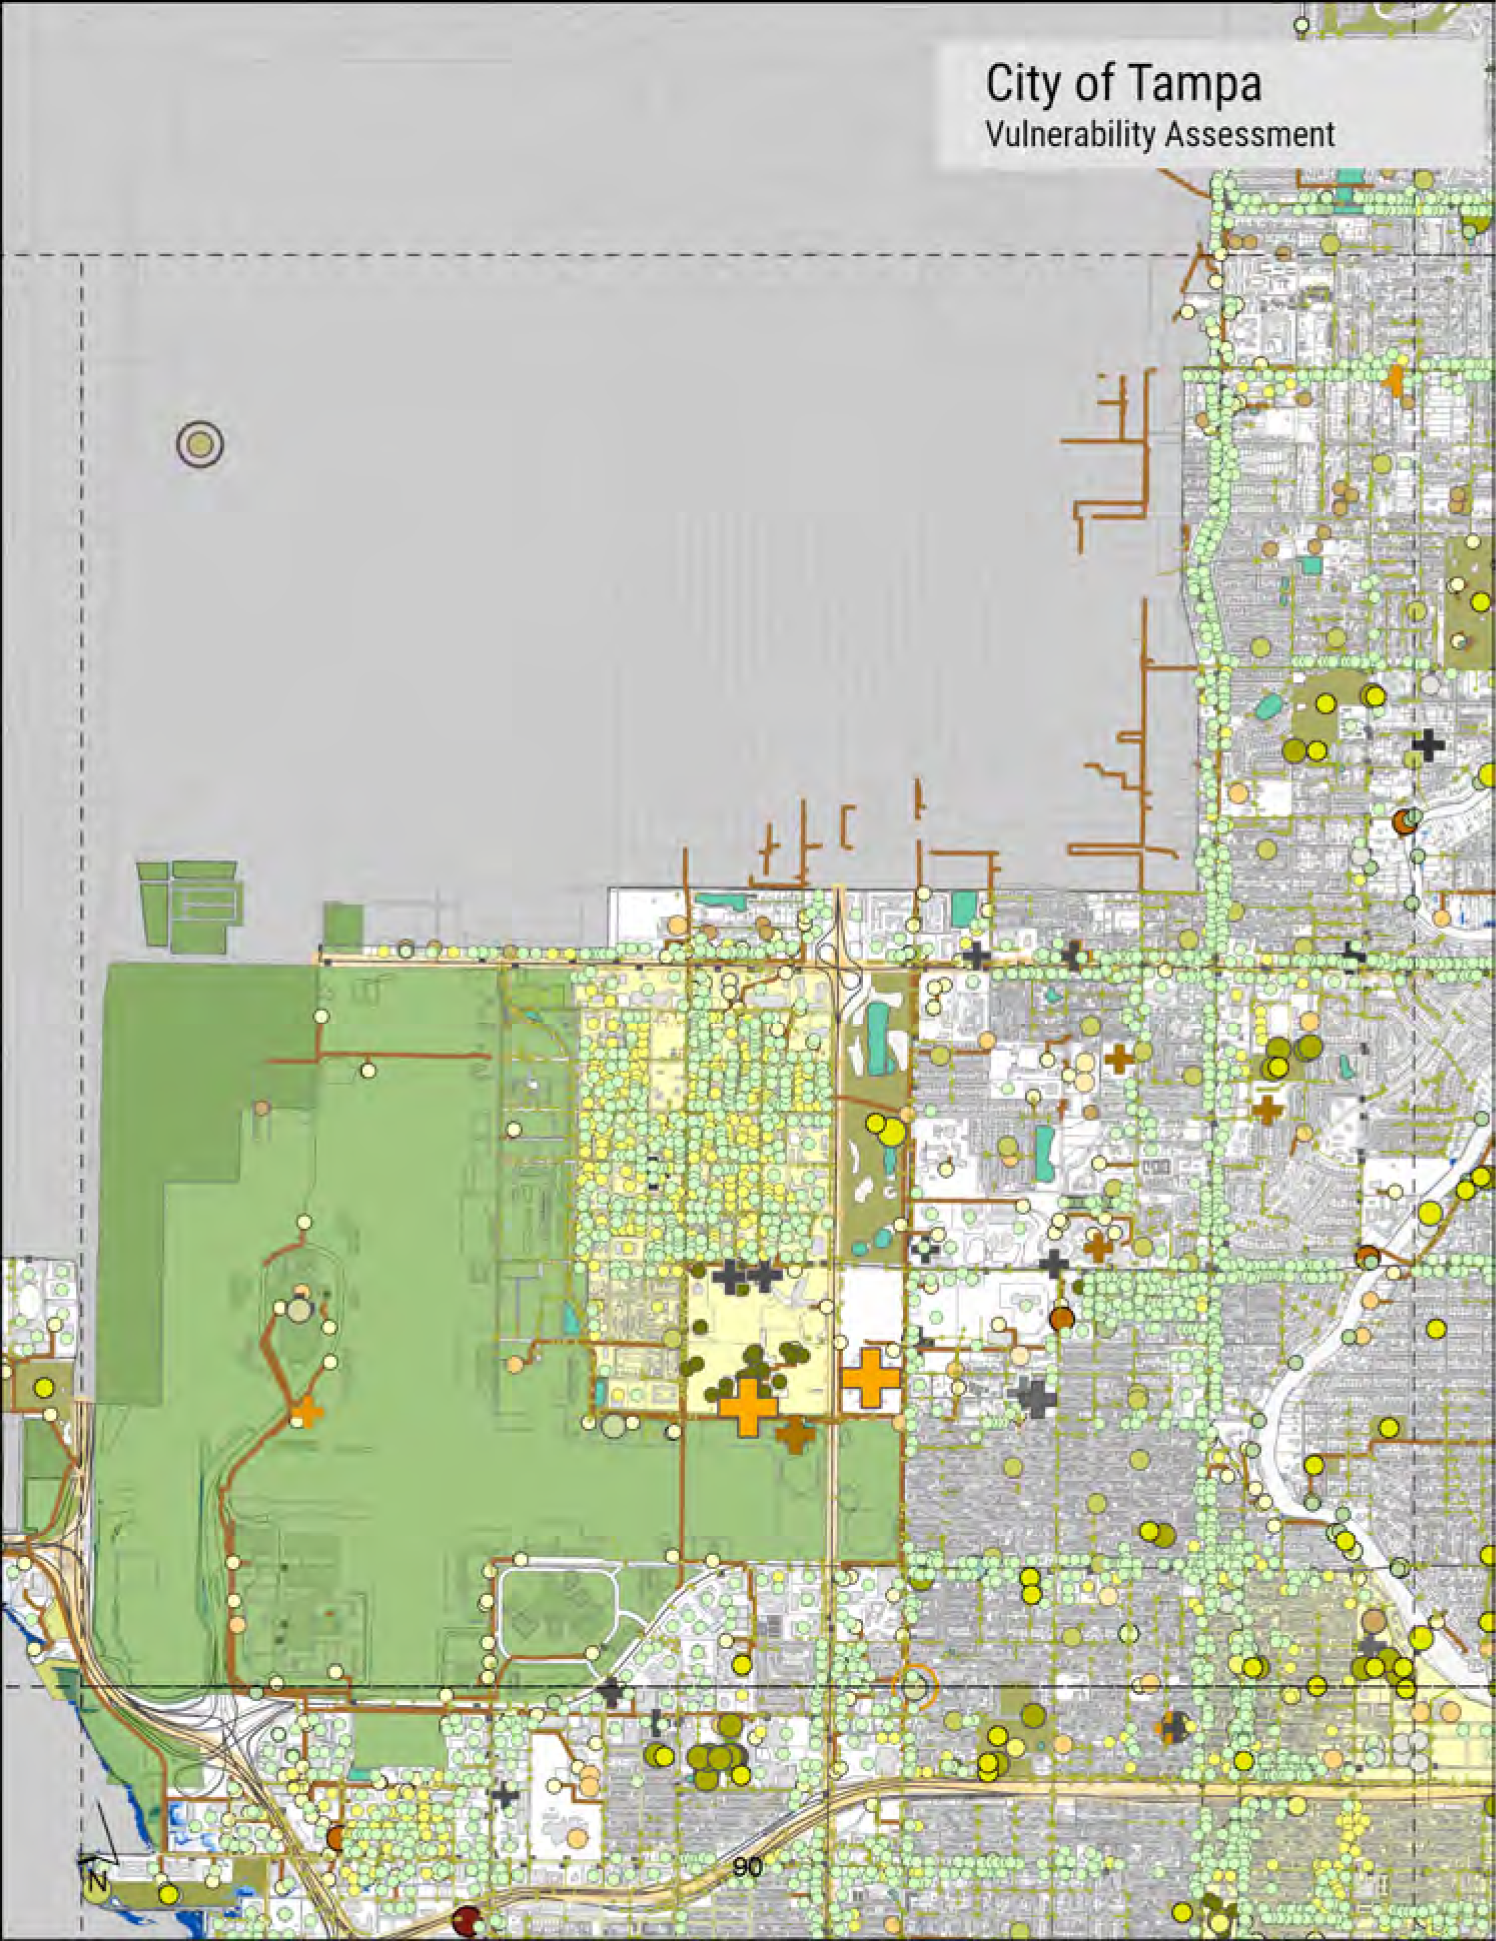
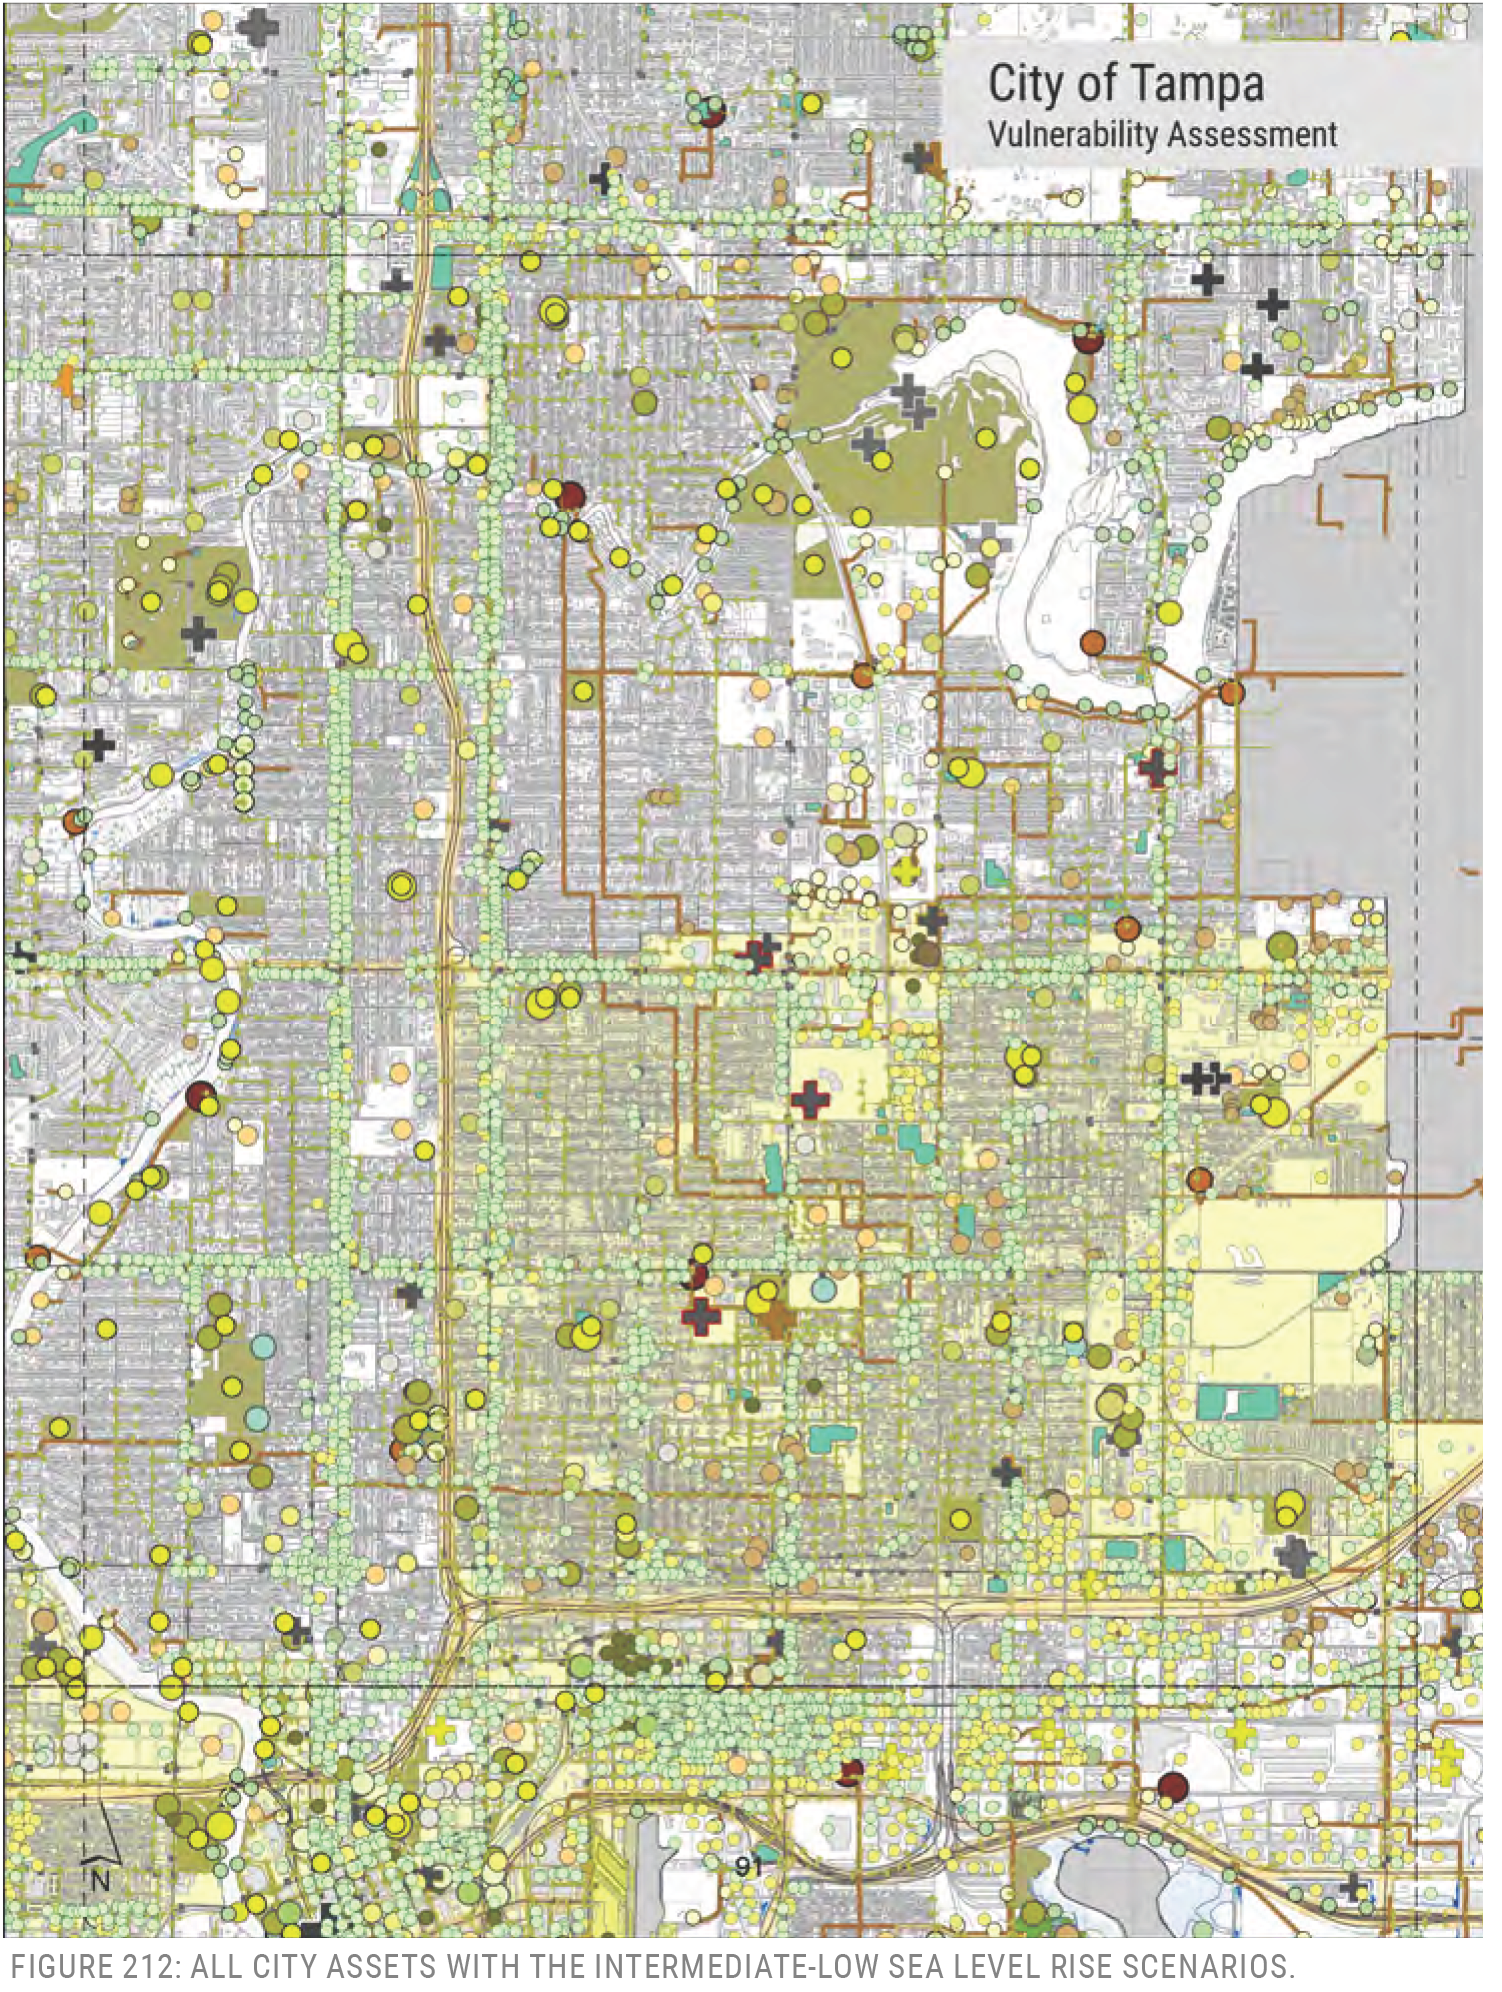
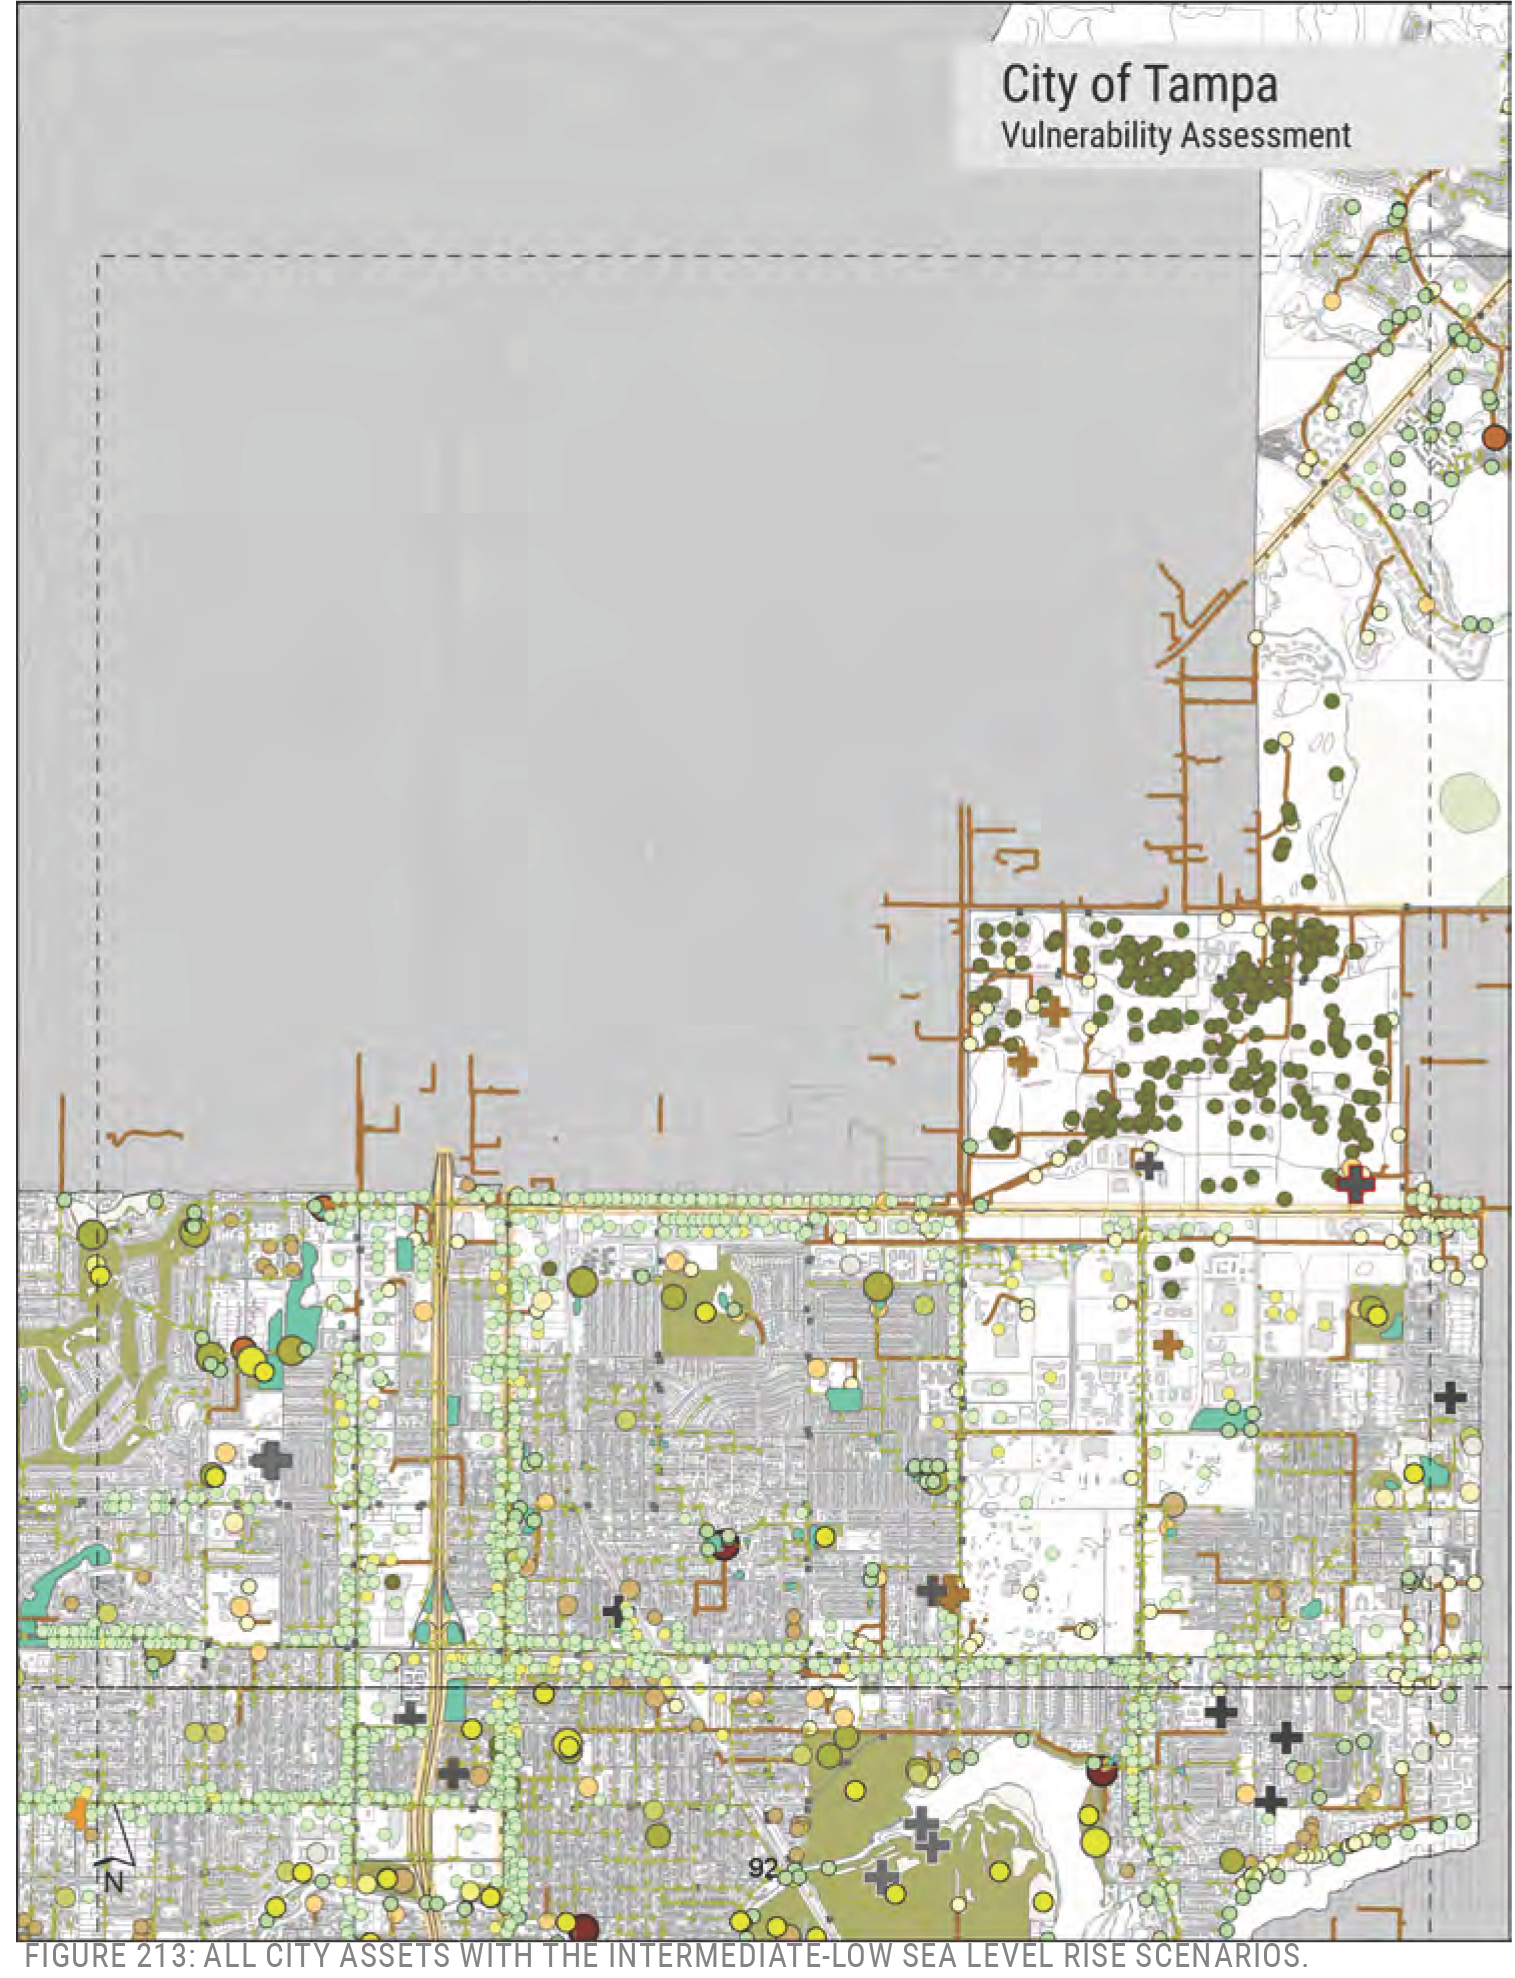
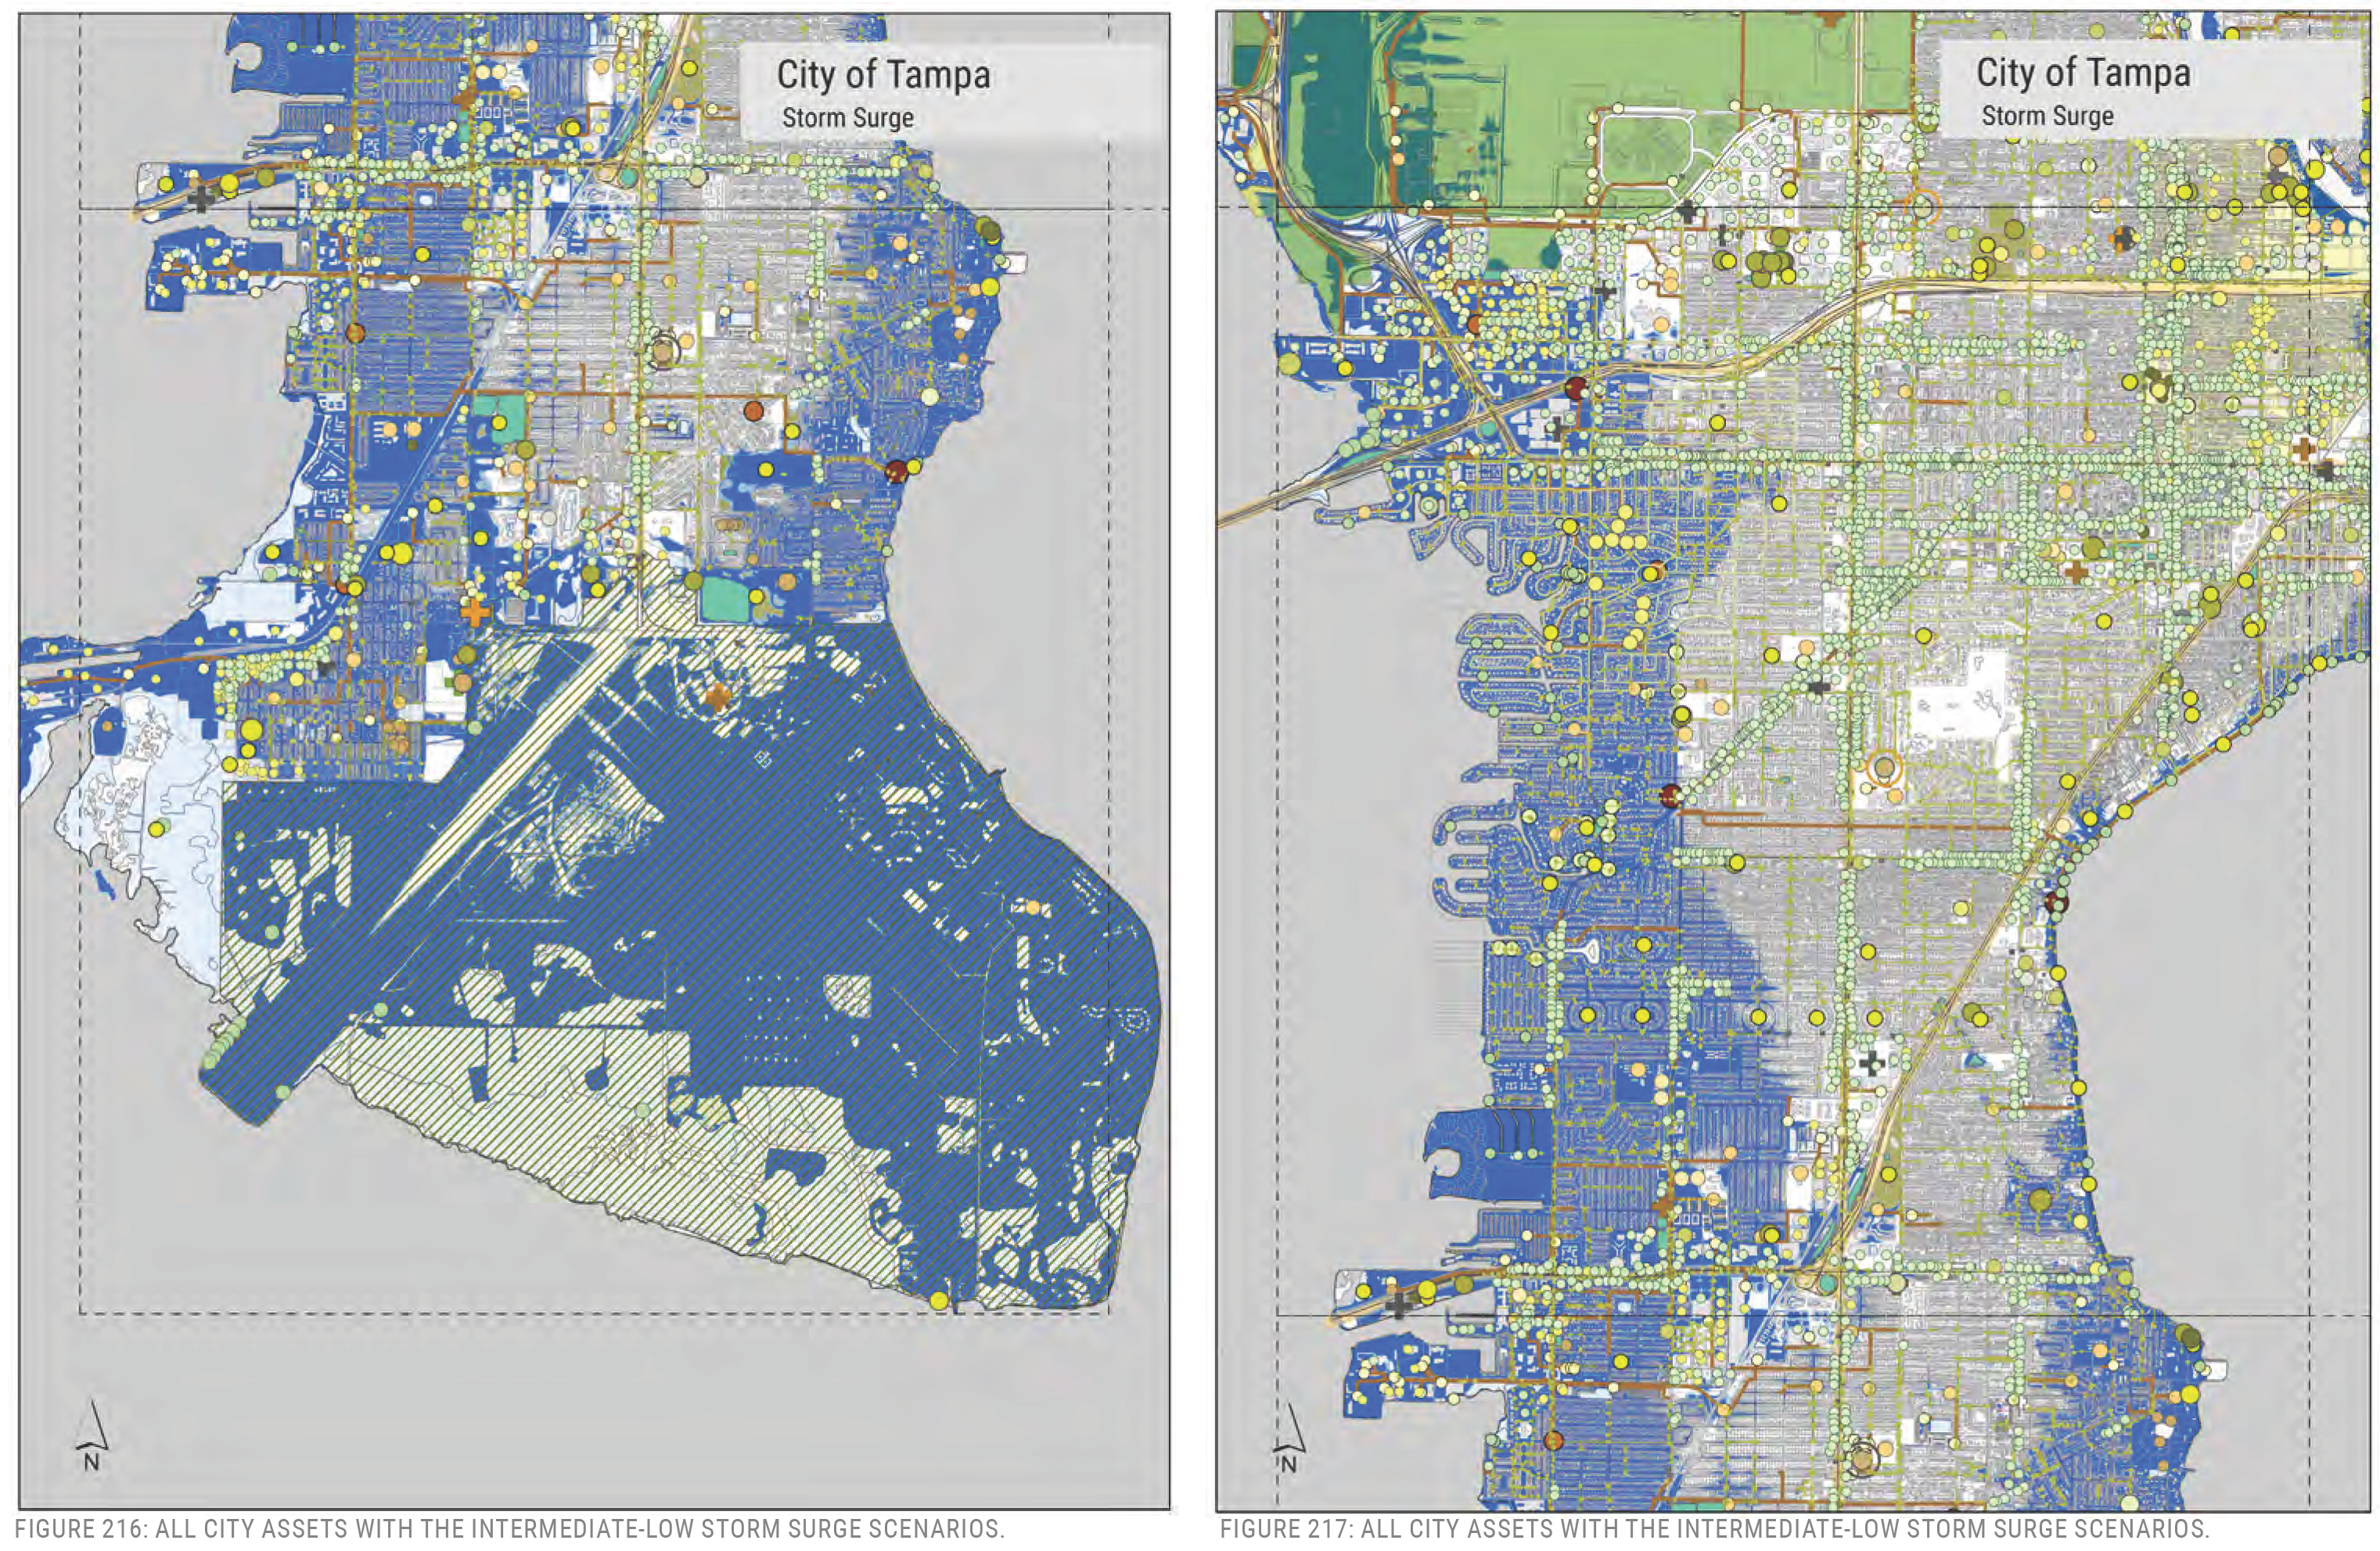
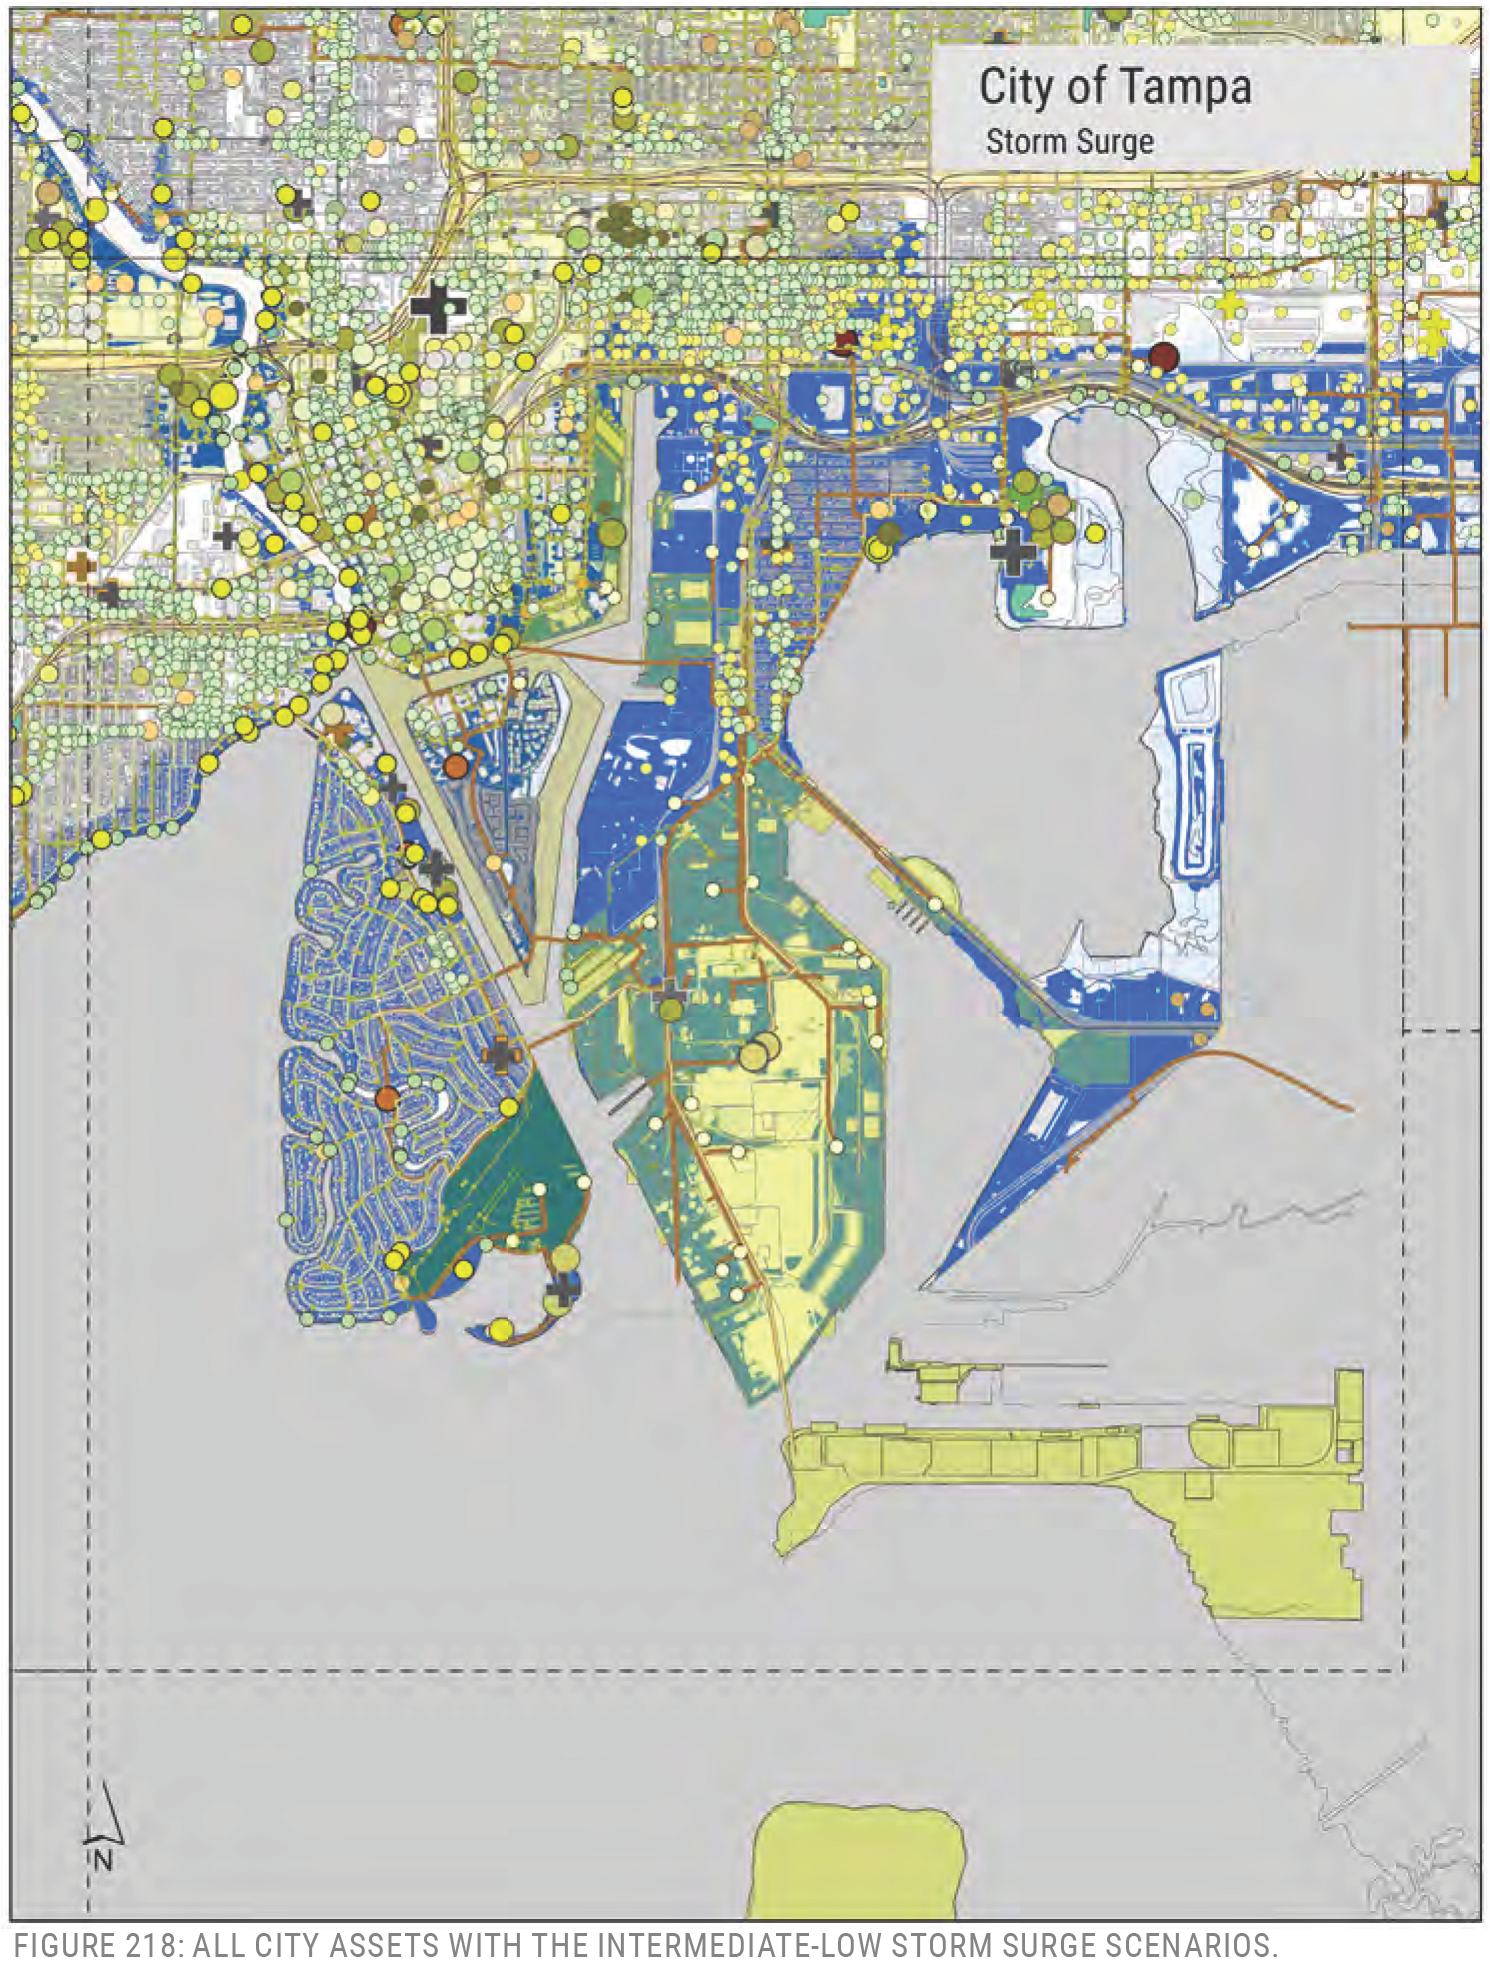
FIGURE 218: ALL CITY ASSETS WITH THE INTERMEDIATE-LOW STORM SURGE SCENARIOS.
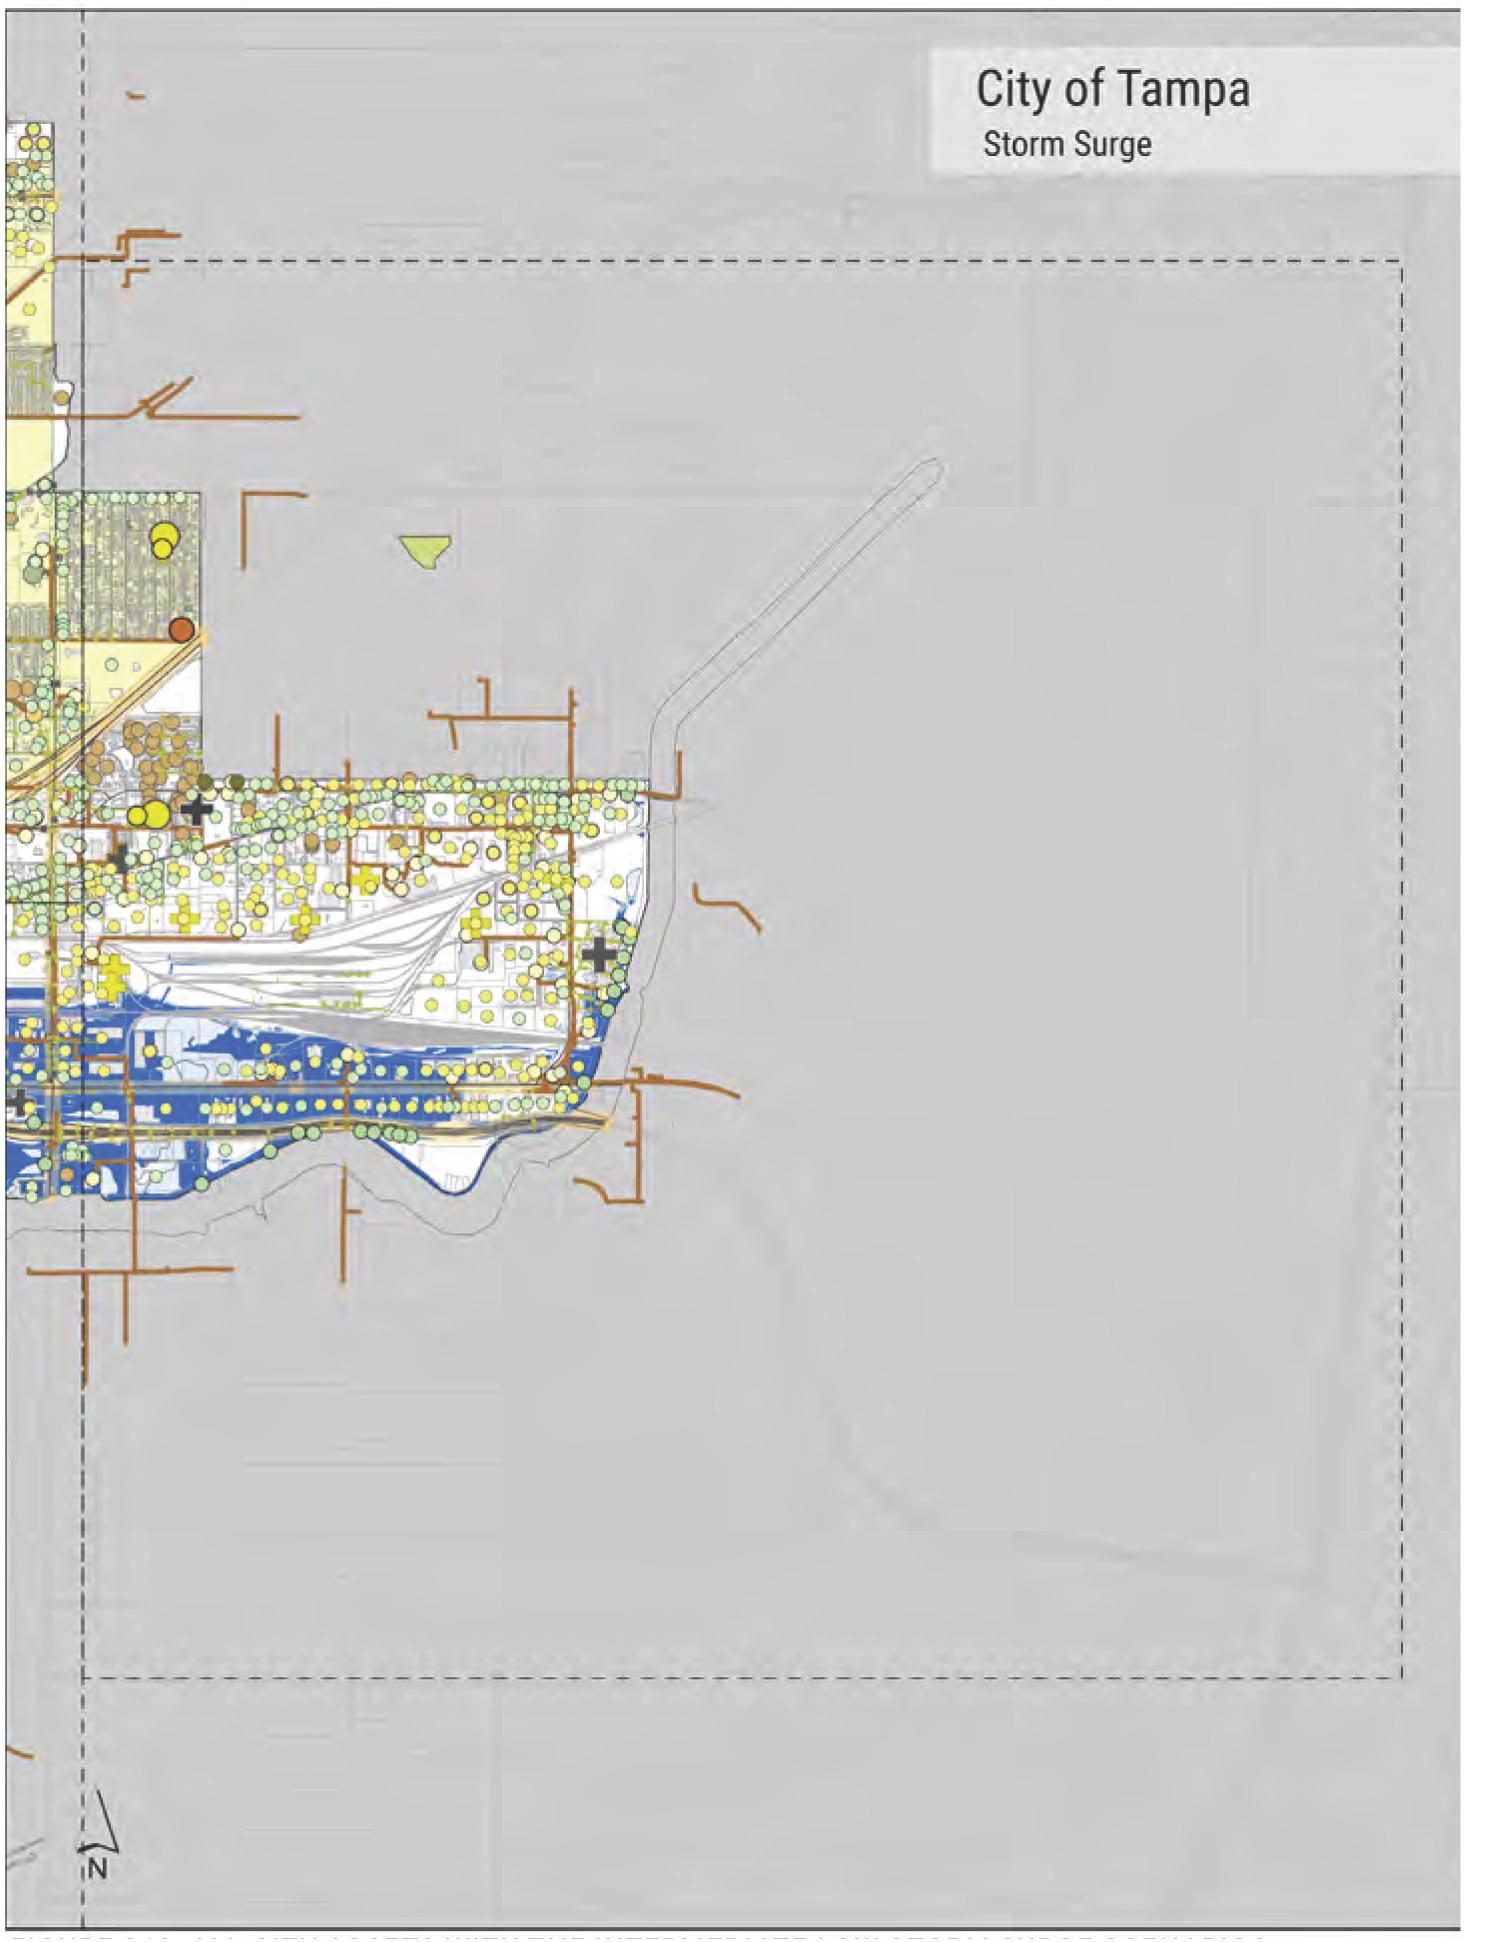
FIGURE 219: ALL CITY ASSETS WITH THE INTERMEDIATE-LOW STORM SURGE SCENARIOS.
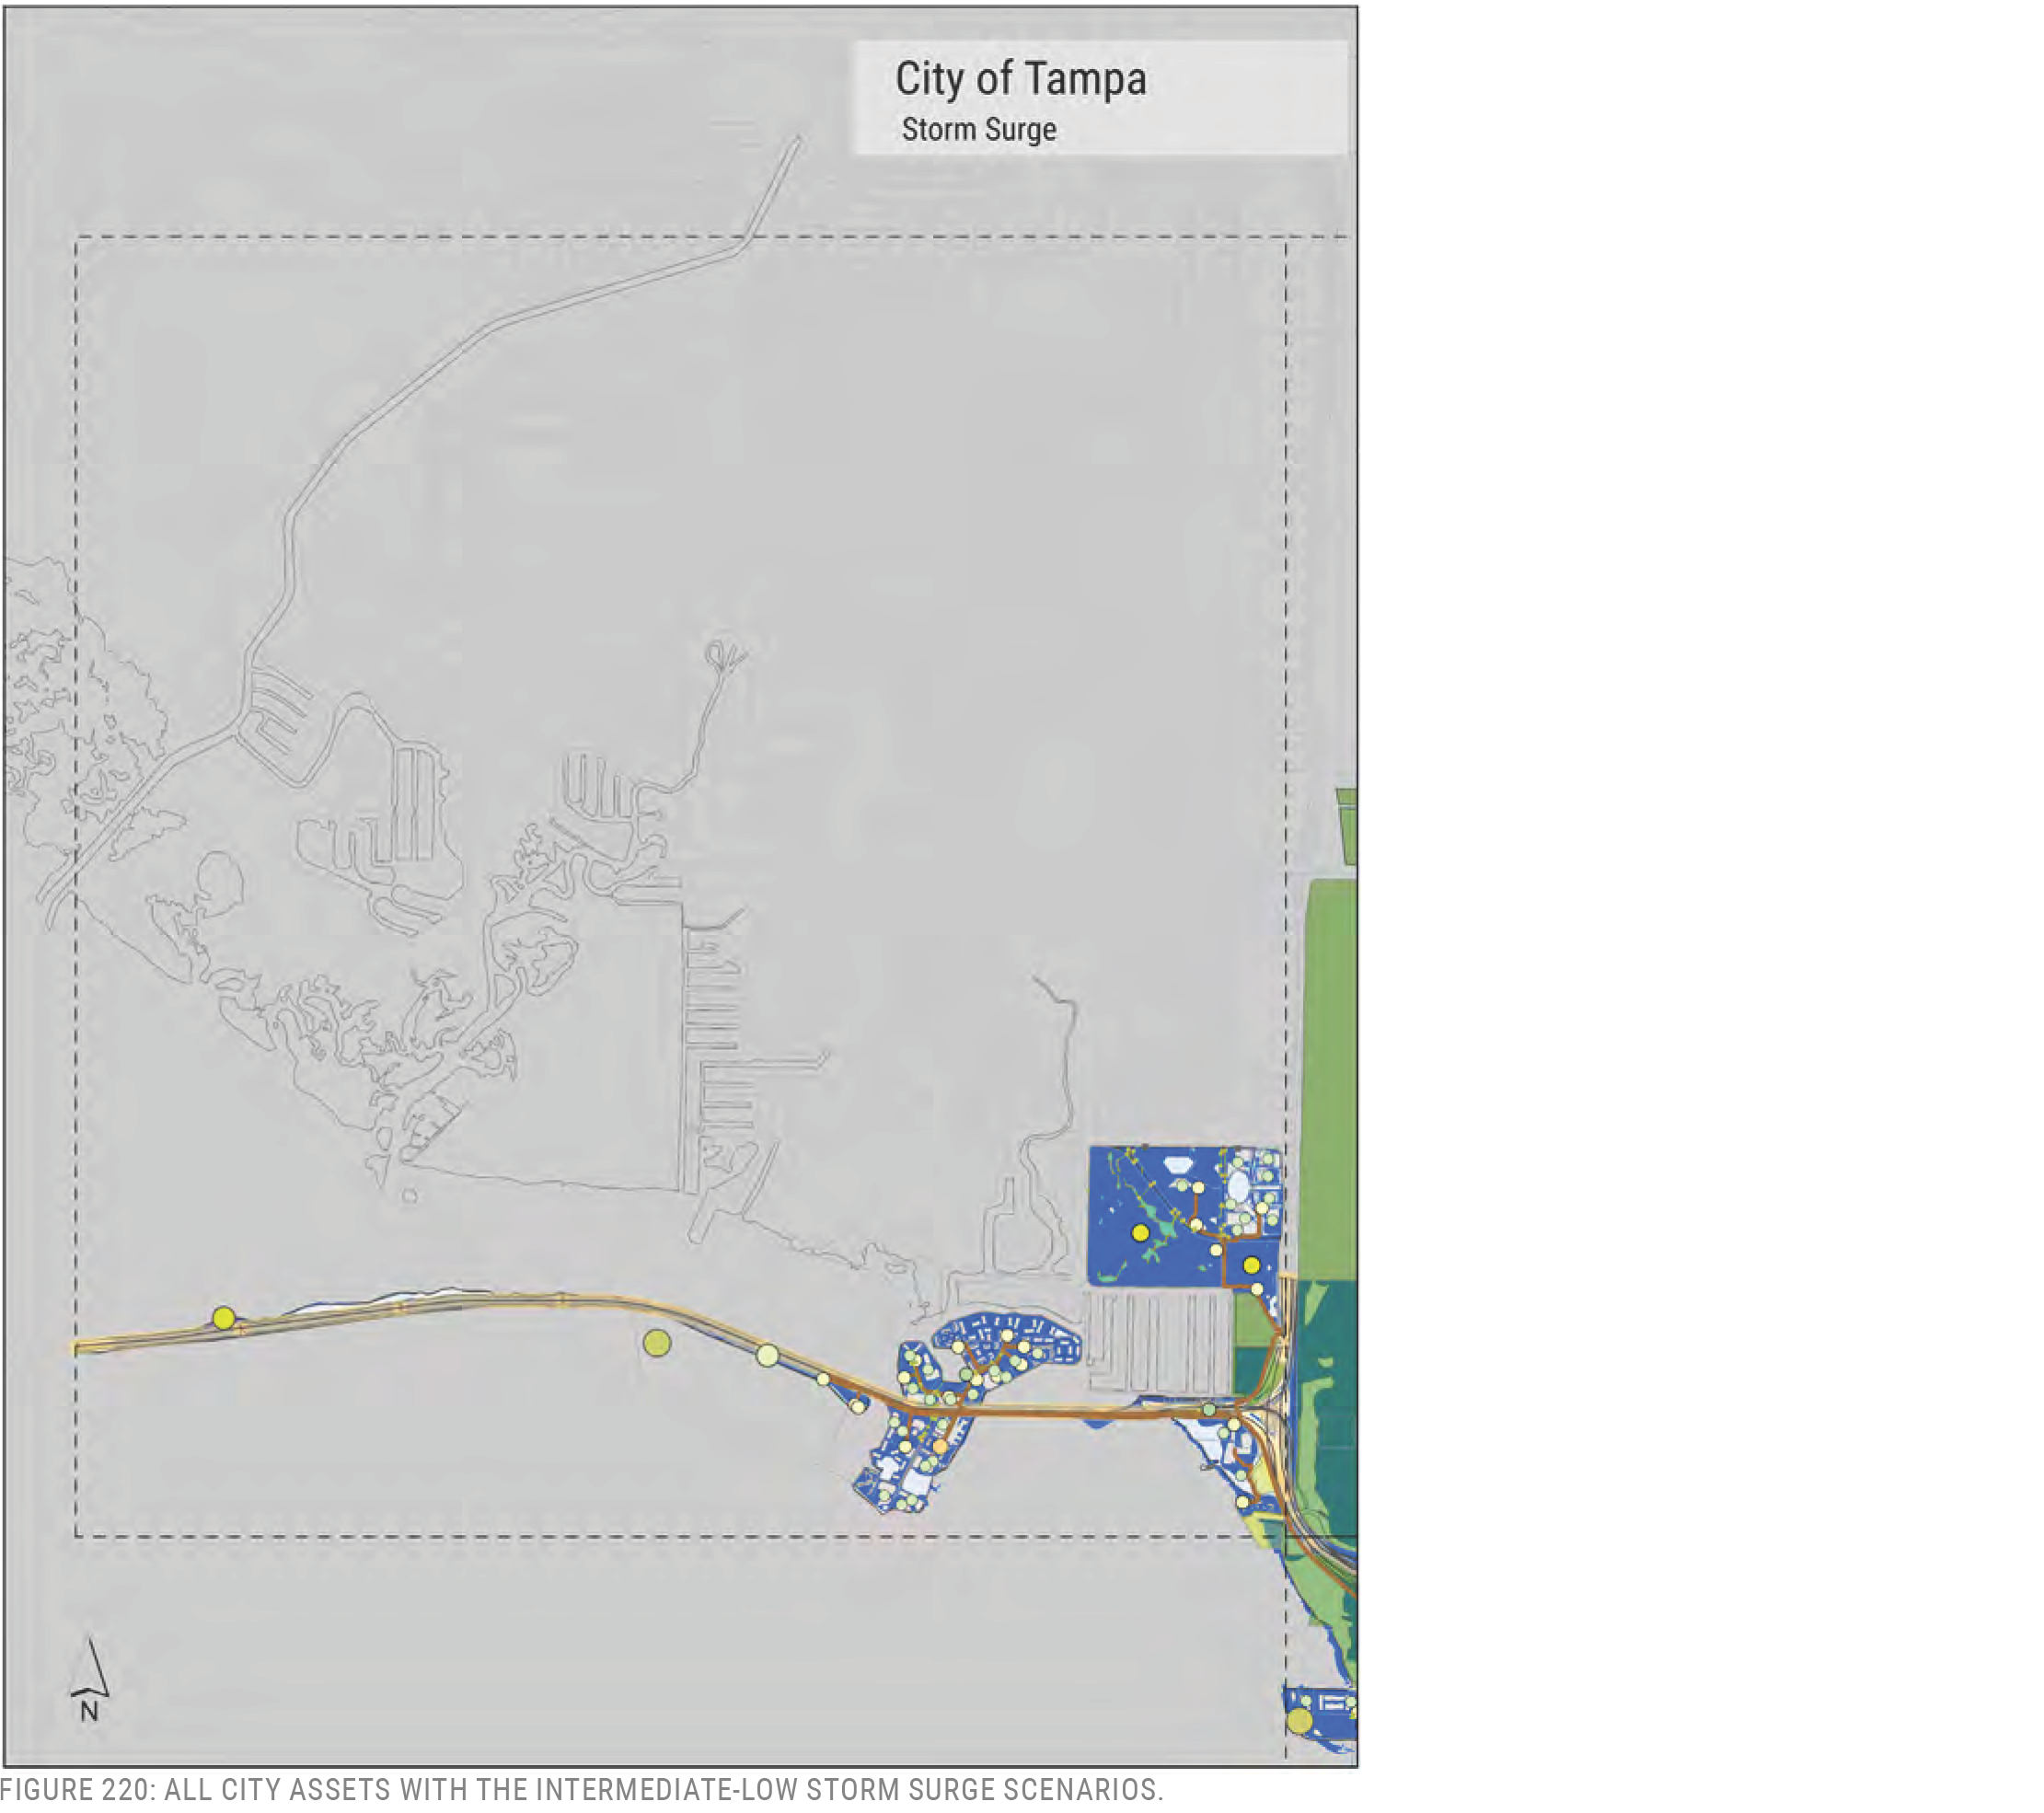
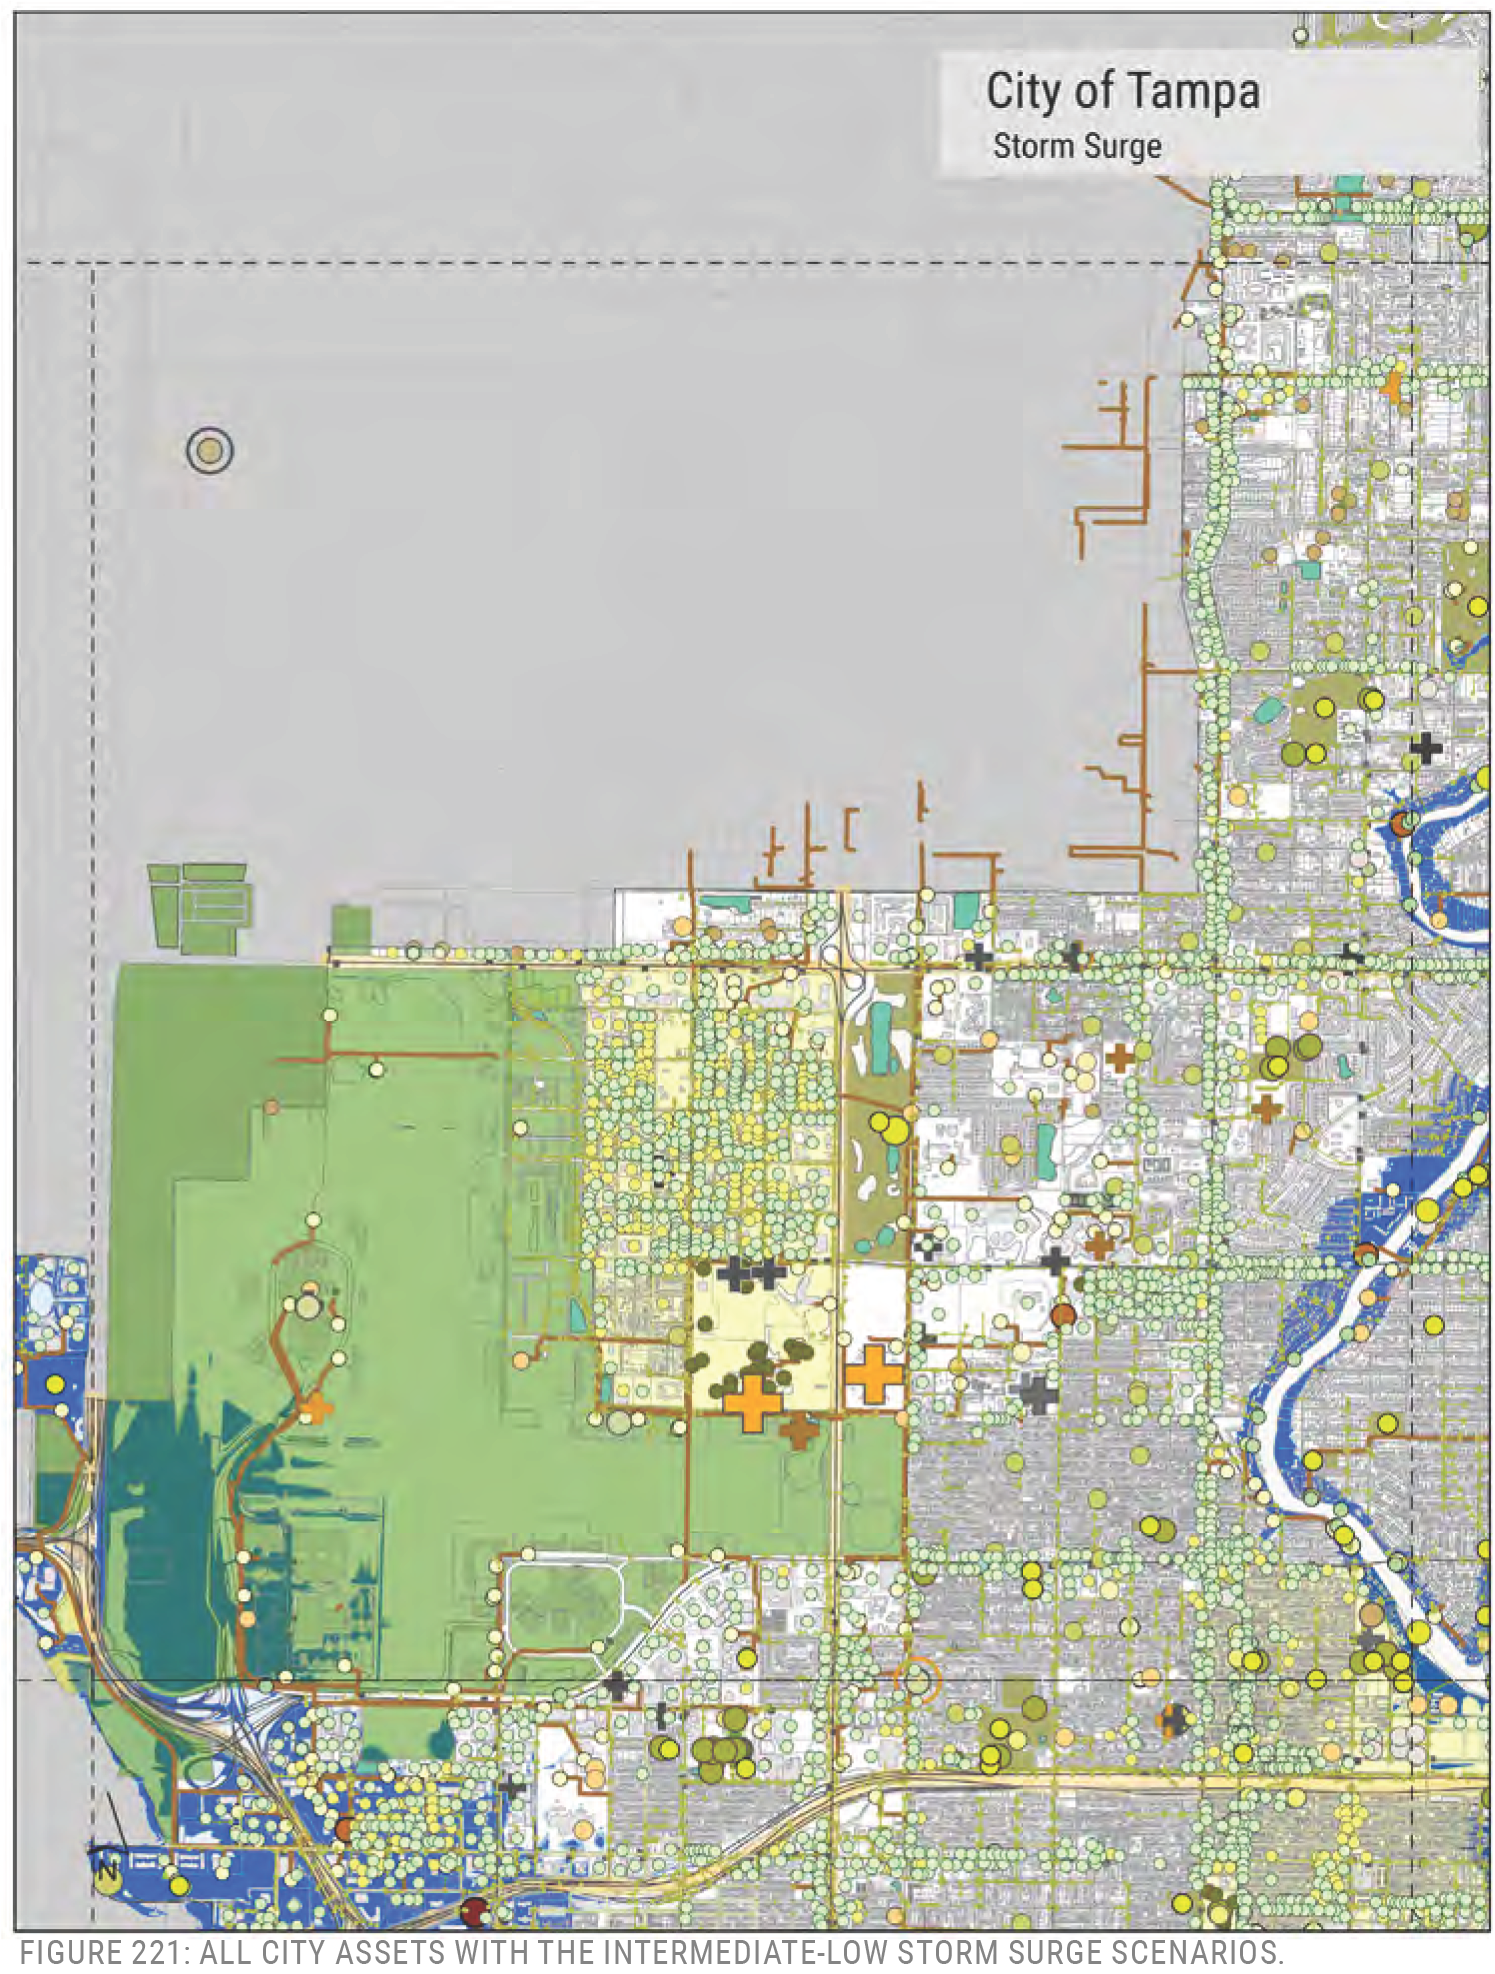
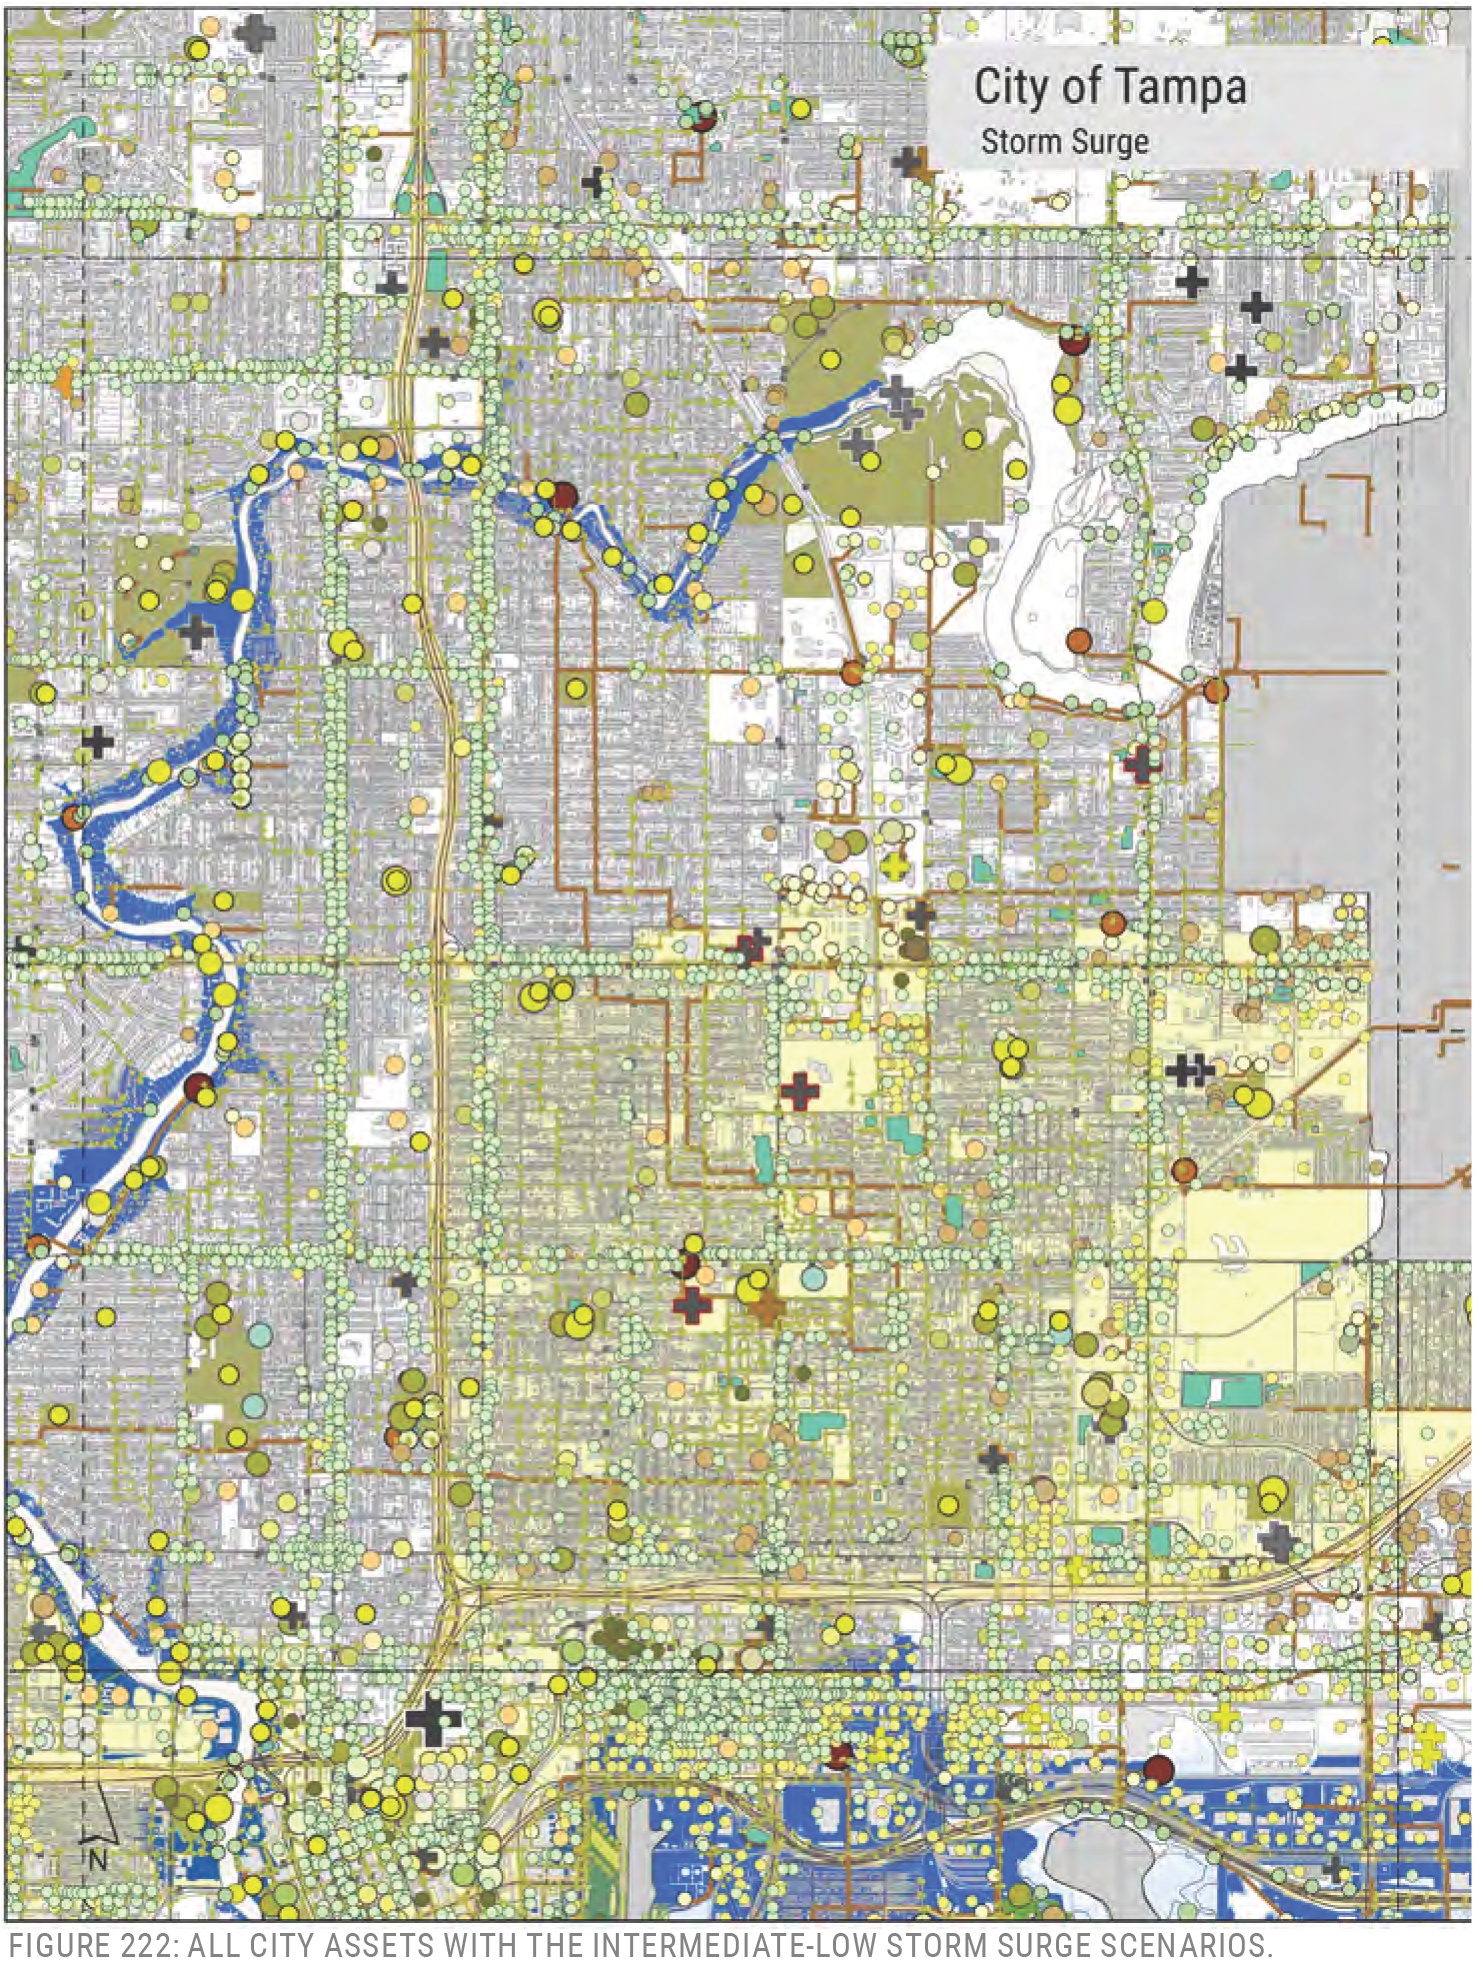
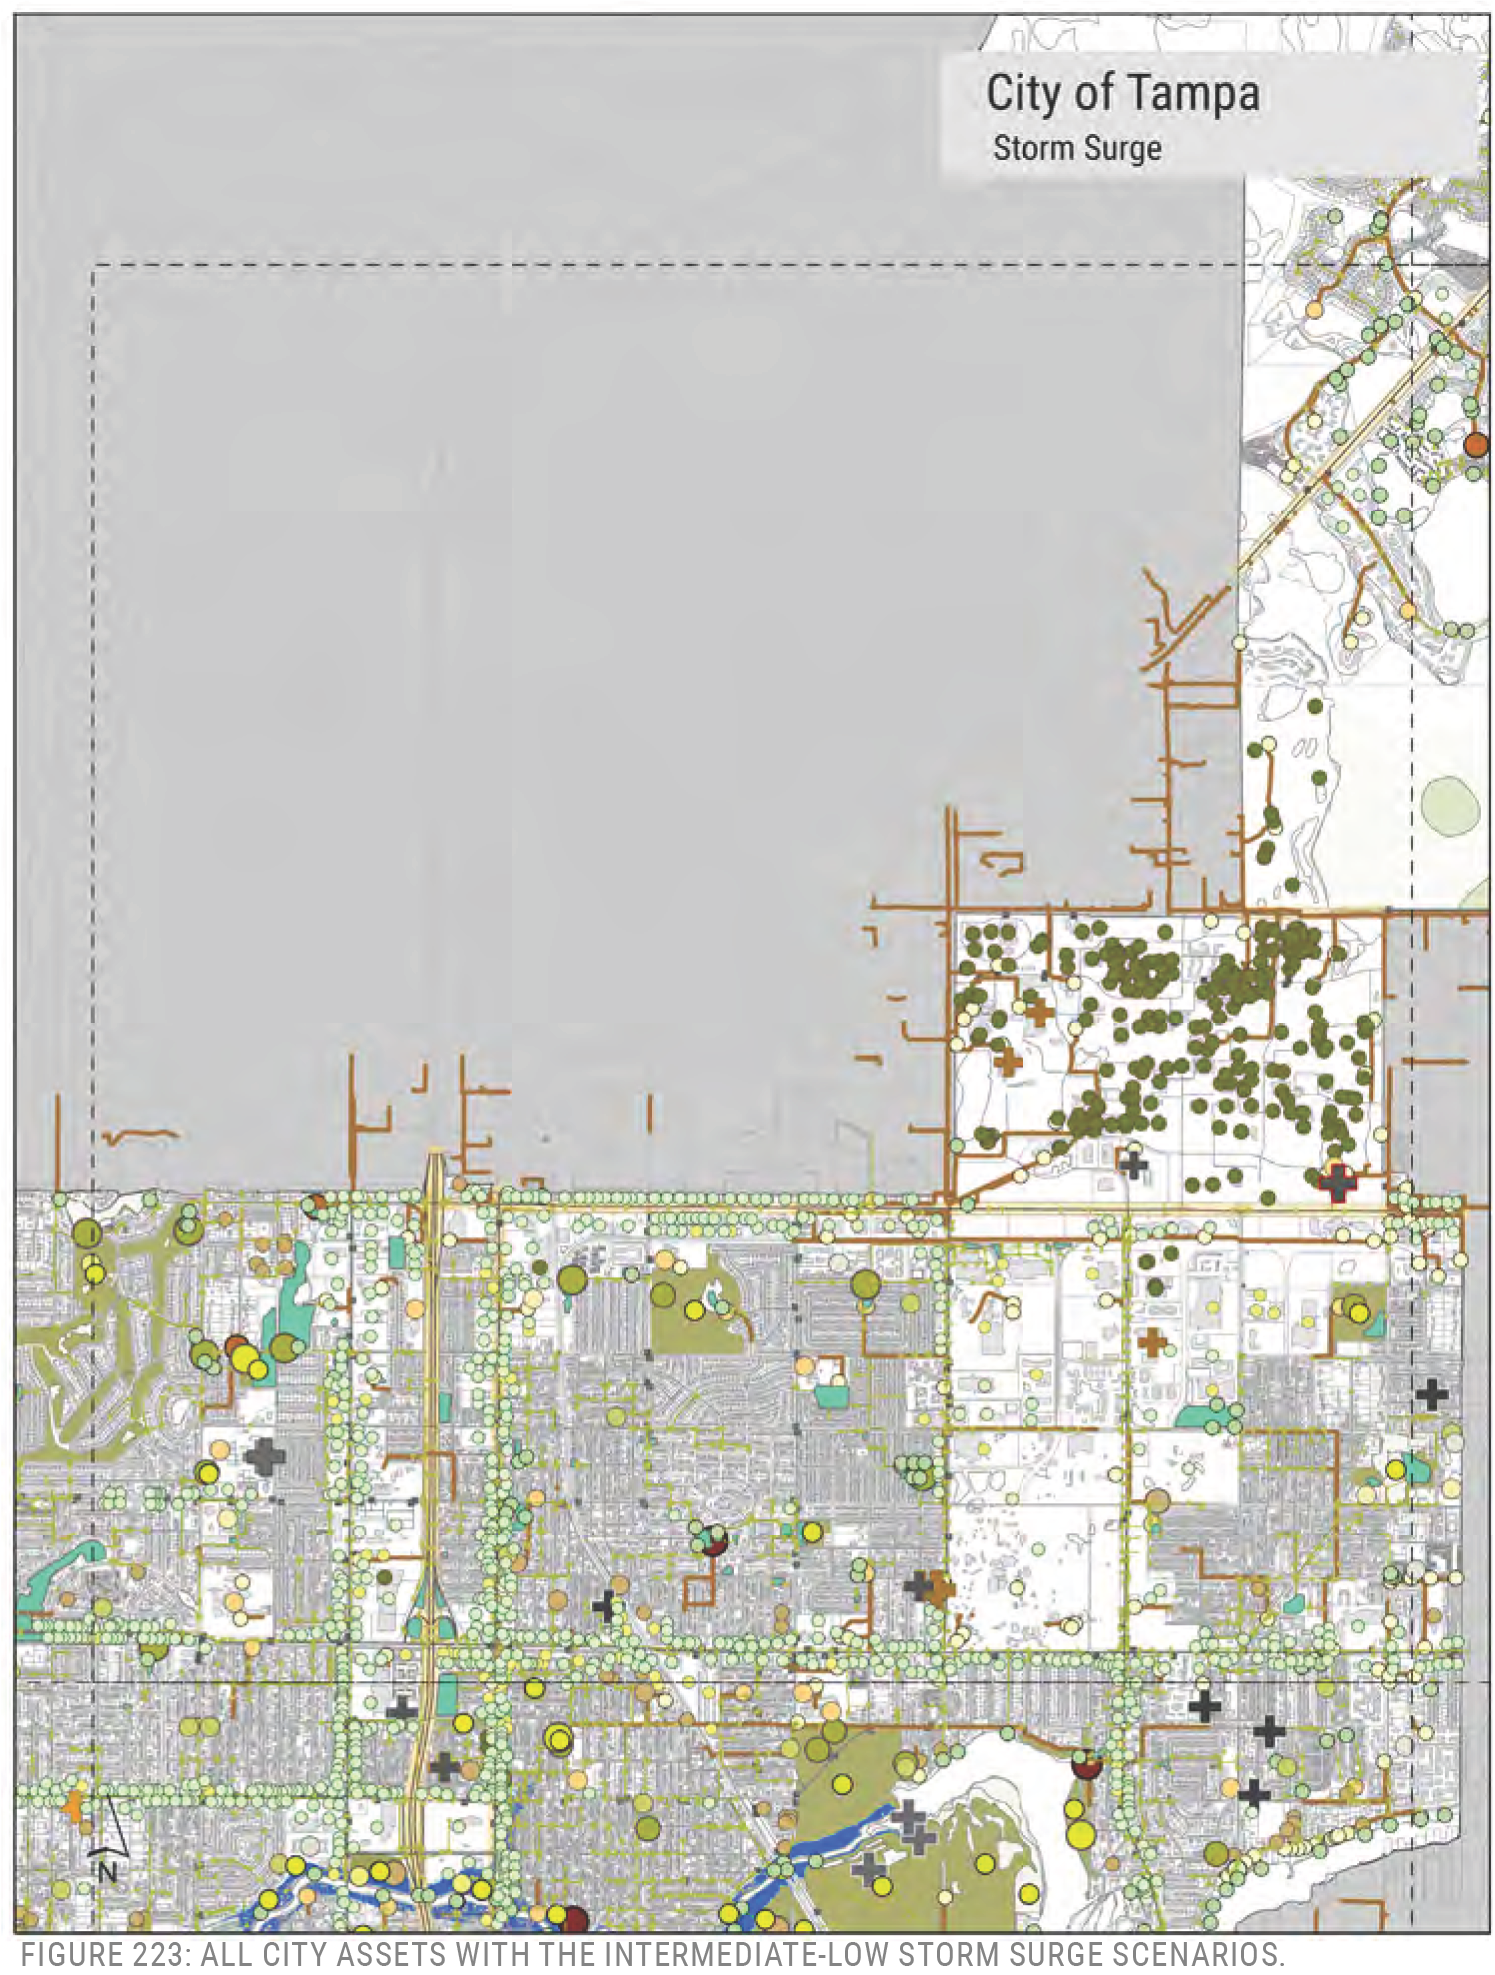
FIGURE 224: ALL CITY ASSETS WITH THE INTERMEDIATE-LOW STORM SURGE SCENARIOS.
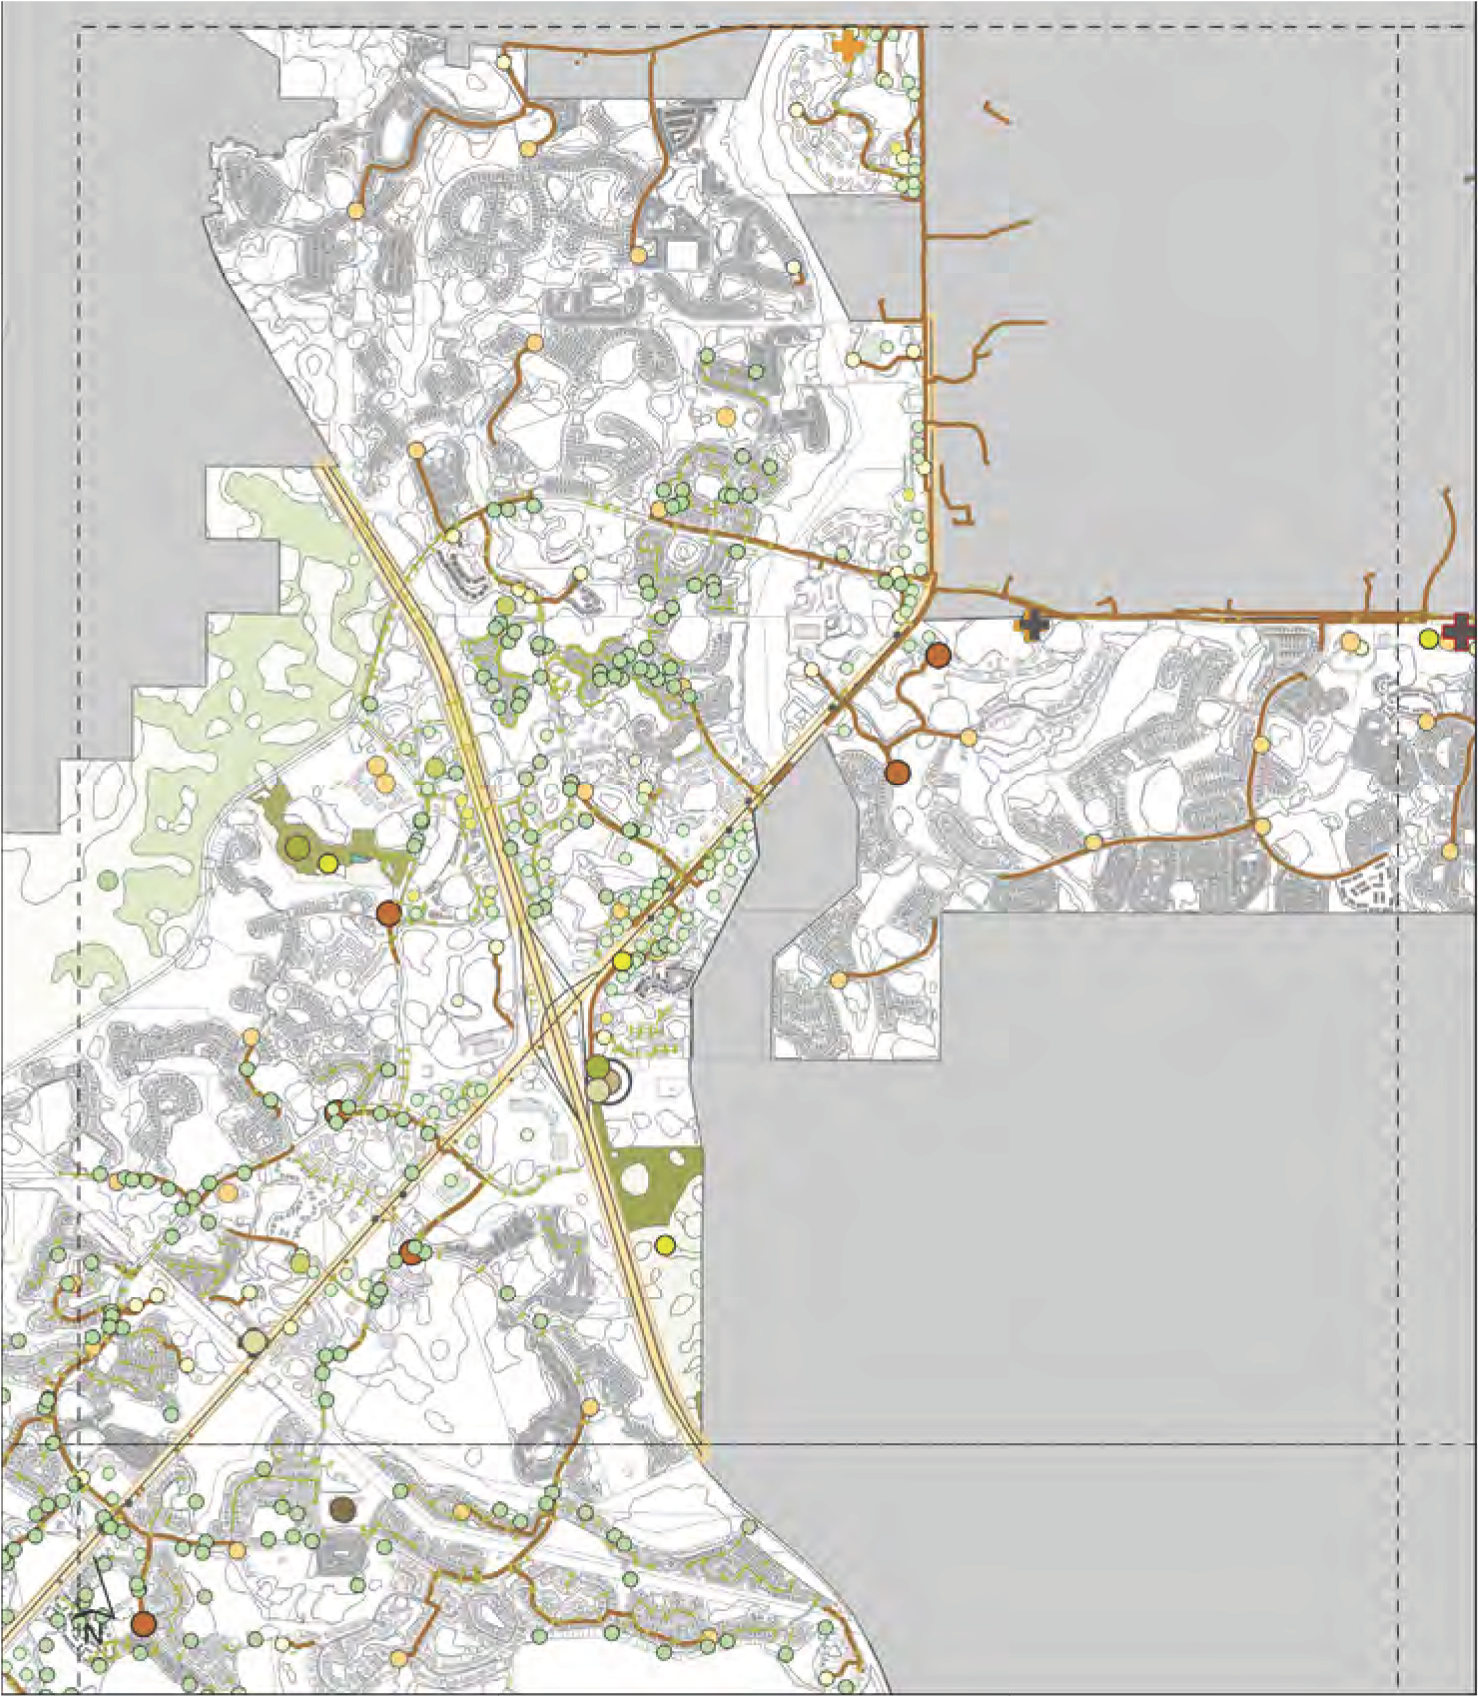
FIGURE 225: ALL CITY ASSETS WITH THE INTERMEDIATE-LOW STORM SURGE SCENARIOS.
City of Tampa Storm Surge
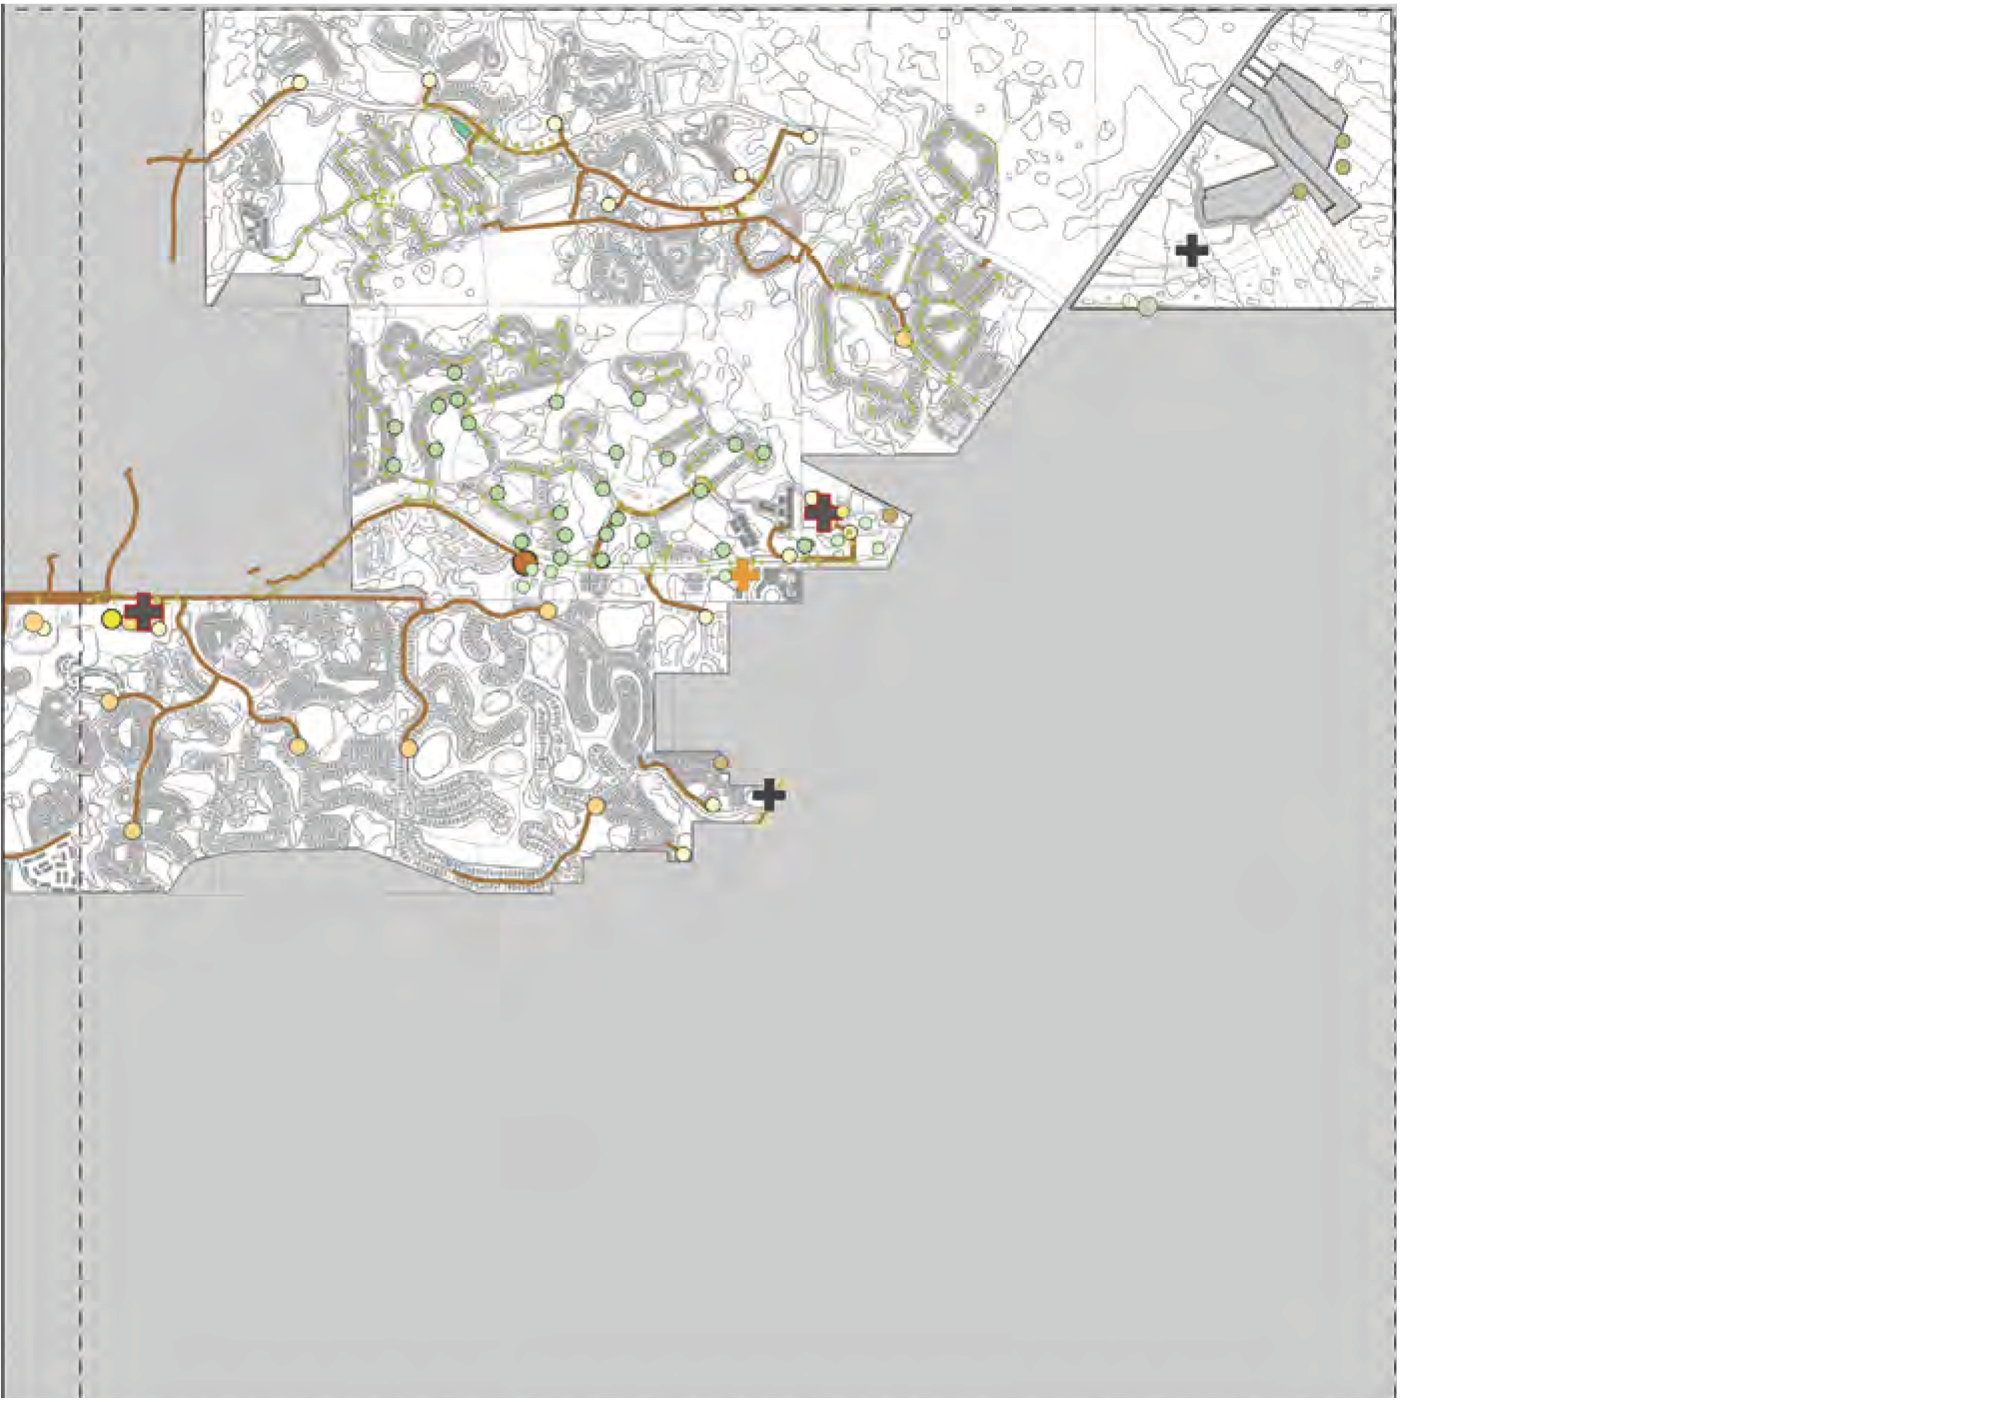
FIGURE 226: ALL CITY ASSETS WITH THE INTERMEDIATE-LOW STORM SURGE SCENARIOS.

APPLIED Ł sciENcEs
December 10, 2024
Subject: City of Tampa Vulnerability Assessment Task 4: Sensitivity Analysis
TO WHOM IT MAY CONCERN
I, Elie G. Araj, PE, hereby certify that "Task 4: Sensitivity Analysis" in the attached City of Tampa Vulnerability Assessment project report (project ID #22PLN78) was prepared under my direct supervision and is in compliance with the intent of section 380.093, Florida Statutes (F.S.) pertaining to resiliency grants.
Applied Sciences Consulting, Inc. Community Based. Regionally Skilled.
1000 North Ashley Drive, Suite 500 Ł Ł
Tampa, FL 33602
(813) 228-0900www.appliedfl.com
FIGURE 227: ENGINEER'S SEAL FOR THE VULNERABILITY ASSESSMENT, TASK 4.
CRITICAL ASSET FOCUS AREAS
In association with Tasks 5 and 6 for contract 22PLN78, between the City of Tampa and the Florida Department of Environmental Protection, three critical asset focus areas were identified and evaluated in closer detail. These three areas include:
- The Davis Islands Bridge and connections between Tampa General Hospital and Bayshore Boulevard.
- The McKay Bay Peninsula and 34th Street, which connects the facilities on the peninsula with Adamo Drive.
- Ben T. Davis Beach shoreline and Courtney Campbell Causeway.
Each of these projects are delivered as a separate addendum to this vulnerability assessment.
ACKNOWLEDGMENTS
- Mayor Jane Castor
- Office of the Chief of Staff
- Whit Remer, Sustainability and Resilience Officer
- Kayla Caselli, Sustainability Coordinator
- Revenue and Finance Department
- Hillary Paul, Senior Grants Analyst
- Carleigh Blesing, Grants Compliance Analyst
- Infrastructure Department
- Brad Baird, Deputy Administrator of Infrastructure
- Solid Waste Department
- Larry A. Washington, Director
- Steve Swan, Chief of Operations
- Regina E. Byrd, Chief of Administration
- Mike Derocher, Program Manager (WTE)
- Shelby Lewis, Recycling Coordinator
- Chuck Conklin, Waste to Energy (WTE)
- Alexis Black, Environmental Specialist III
- Mobility Department
- Vik Bhide, Mobility Director
- Nirav Patel, Asset Management Engineer
- Alex Awad, Engineer IV
- Tampa Fire Rescue – Office of Emergency Management
- John Antapasis, Emergency Management Director
- Development and Economic Opportunity
- Michelle VanLoan, Real Estate Director
- Evan Johnson, Chief Planner
- Parks and Recreation
- Brad Suder, Superintendent
- Planning Design & Natural Resources
- Tony Monk, Landscape Architect III
- Nikki Coats, Office Support Specialist IV
- Tampa General Hospital
- Tony Venezia
- Dustin Pasteur
- Erinn Skiba
- Meghan Robinson
- The Florida Department of Environmental Protection
PROJECT TEAM
- Applied Sciences Consulting, Inc.
- Brian Cook
- Taylor Lankford
- Elie Araj
- Alex Buckler
- Matthew Pleasant
- Tom Burke
- Amy Garland
- Cody Stewart
- HDR
- Sharon Wright
- Jos van Dijk
- Steve Schukraft
- Melisa Henriquez Valencia
- Alex Miller
- Black and Veatch
- Emilie Moore
- Terry Hull
- University of South Florida
- Dr. Ping Wang
- Elizabeth Royer
- Ariel Business Group
- Thomas Huggins
- Leighton Kyler
- Emily Rogers


Whit Remer
Brian Cook
Sustainability and Resilience Officer
Director of Urban Design and Resilience
City of Tampa
Applied Sciences Consulting, Inc.
Office of Chief of Staff