Introduction
- Fifth iteration of study for the City of Tampa’s strategic priorities for the community
- Can trend metrics from previous studies conducted in 2020, 2021, and 2022, and 2023
- Goal: to obtain statistically valid information that is reflective of the diverse demographics of the City and its various communities
-
Additionally, the survey explored topics pertaining to pertinent city issues including:
- Affordable Housing
- Transportation
- Bicyclist and Pedestrian Safety
- Neighborhood Parks
- Public Safety
Methodology
- Total respondents: 1,300 City of Tampa residents aged 18+
- An additional 200 residents sampled in East Tampa; additional analysis conducted on 223 East Tampa residents
- Margin of error: ±2.71% at a 95% confidence level for at-large results
- Data collection: June 21, 2024, through September 1, 2024
- Telephonic survey using both landlines and cellphones
- Five respondent demographics were controlled: age, gender, race/ethnicity, educational attainment, and homeownership status
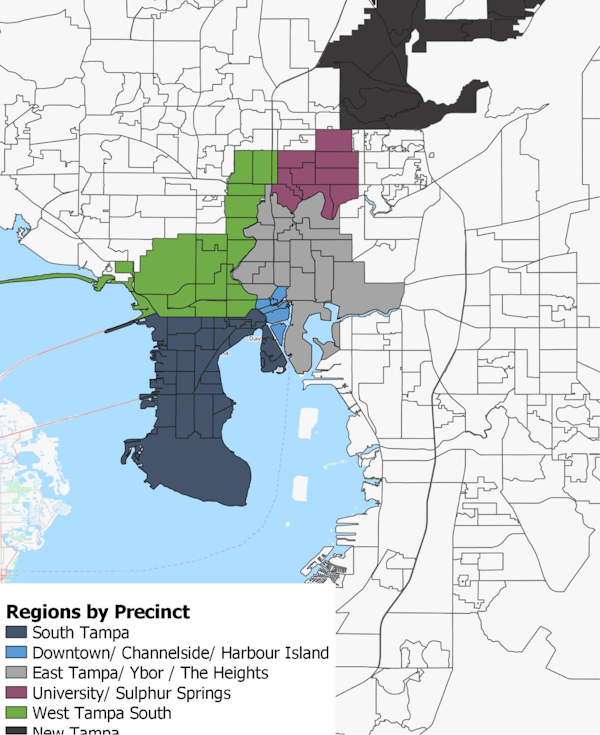
Data was segmented into six regions to provide analysis of different parts of the city.
Regional crosstabulations for all questions are available in the full report.
Trust and Confidence
How much trust and confidence do you have in the City of Tampa government when it comes to handling issues in the City?
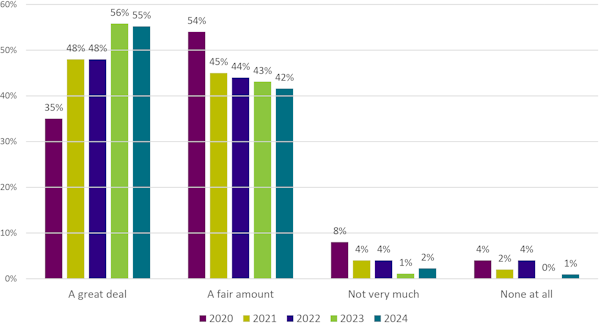
- Trust and confidence remain high within our sample
- Therefore, the difference in enthusiasm — those saying “a great deal” versus “a fair amount” — is the most salient measure
- However, there is no significant difference in enthusiasm levels between 2023 and 2024
Recommendation
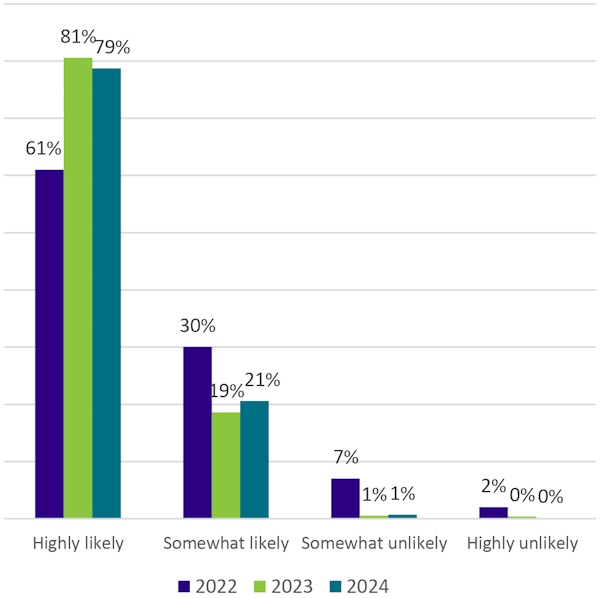
Would ("probably" + "definitely") recommend the City of Tampa to a friend, family member, or acquaintance as a place to __ :
110%
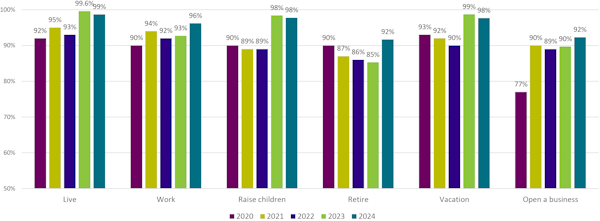
(Note: Graph Axis Begins at 50%)
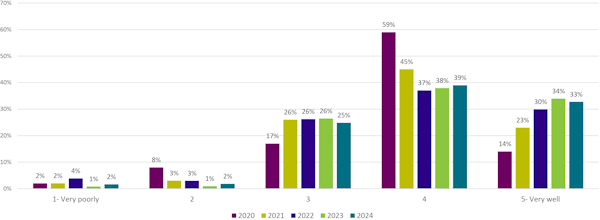
On a scale from one to five, where on is "very poorly" and five is "very well," how do you feel that the City of Tampa has handled City issues in general?
Community Characteristics
| Housing | Community and Amenities | Transportation | Jobs and Education | Public Safety |
|---|---|---|---|---|
|
|
|
|
|
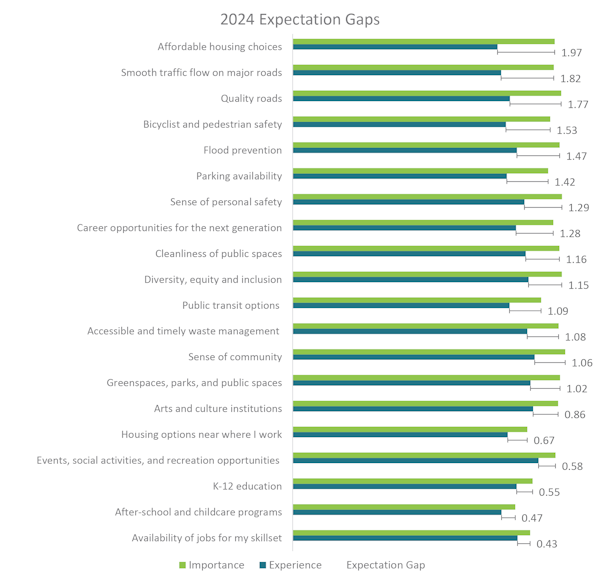
Importance Experience Expectation Gap
- Question Phrasing: How important is it to you personally, that your community possesses the following characteristics?
- The average score is 8.89 among all categories
- Question Phrasing: In your personal experience, how has the City of Tampa delivered on these characteristics?
- The average score is 7.76 among all categories
- Calculated as (Importance – Experience)
- A higher expectation gap is a bad thing
- The average expectation gap is 1.13
Study Regions
Of the top six expectation gaps, four pertained to transportation:
- Smooth traffic flow on major roads
- Quality roads
- Bicyclist and pedestrian safety
- Parking availability
Top Five Expectations Over Time
Despite the importance of transportation issues, housing affordability, which was not a top issue as recently as 2020, has been the number one expectation for the last two years.
| Rank / Expectation | 2020 | 2021 | 2022 | 2023 | 2024 |
|---|---|---|---|---|---|
| 1 | Smooth traffic flow on major roads | Smooth traffic flow on major roads | Affordable housing choices | Affordable housing choices | Affordable housing choices |
| 2 | Bicyclist and pedestrian safety | Quality roads | Smooth traffic flow on major roads | Smooth traffic flow on major roads | Smooth traffic flow on major roads |
| 3 | Parking availability | Affordable housing choices | Quality roads | Quality roads | Quality roads |
| 4 | Flood prevention | Flood prevention | Parking availability | Parking availability | Bicyclist and pedestrian safety |
| 5 | Cleanliness of public spaces | Parking availability | Accessible and timely waste management | Flood prevention | Flood prevention |
The importance of housing affordability, traffic flow, and quality roads cuts across the entire city. However, beyond that, interesting neighborhood-level distinctions emerge.
| Rank | South Tampa | Downtown/ Channelside/ Harbour Island | East Tampa/ Ybor/Heights | University/Sulphur Springs | West Tampa South | New Tampa |
|---|---|---|---|---|---|---|
| 1 | Affordable housing choices | Affordable housing choices | Affordable housing choices | Smooth traffic flow on major roads | Smooth traffic flow on major roads | Affordable housing choices |
| 2 | Quality roads | Quality roads | Smooth traffic flow on major roads | Affordable housing choices | Quality roads | Bicyclist and pedestrian safety |
| 3 | Smooth traffic flow on major roads | Flood prevention | Quality roads | Flood prevention | Bicyclist and pedestrian safety | Quality roads |
City Initiatives
Housing
Housing
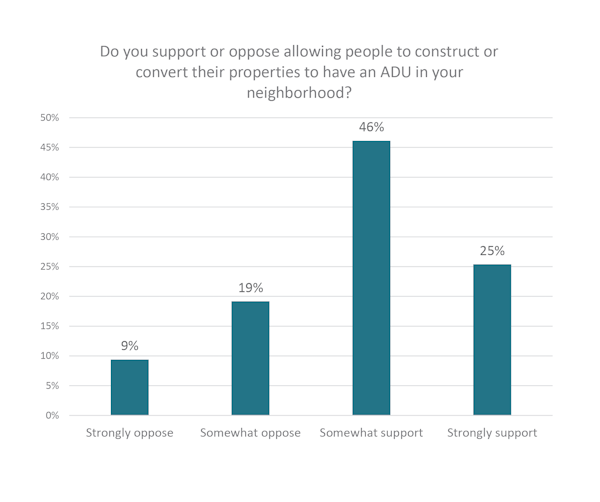
Housing: Accessory Dwelling Units
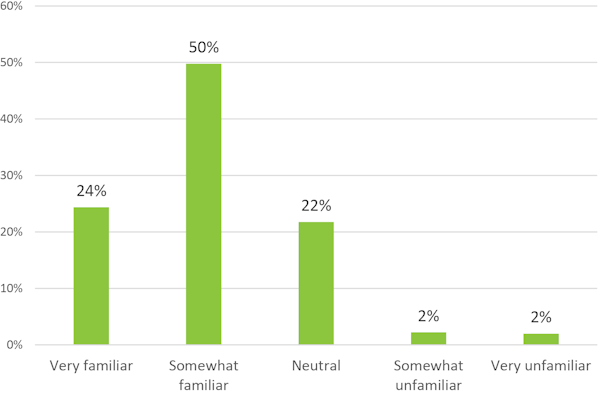
How familiar are you with the concept of accessory dwelling units (ADUs) such as garage apartments or mother-in-law suites?
Transportation (Cont.)
Do you regularly walk to run errands, visit businesses, or commute to work?
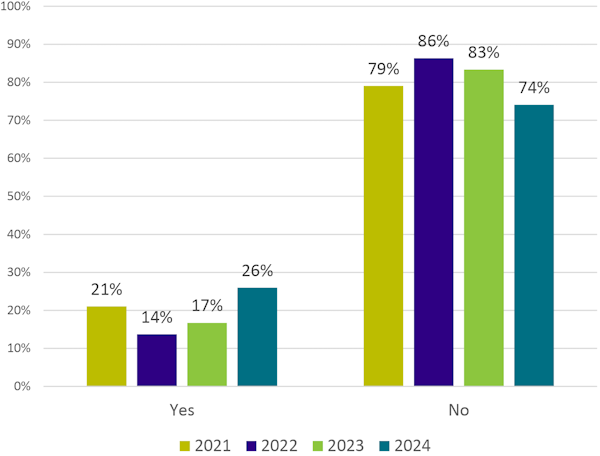
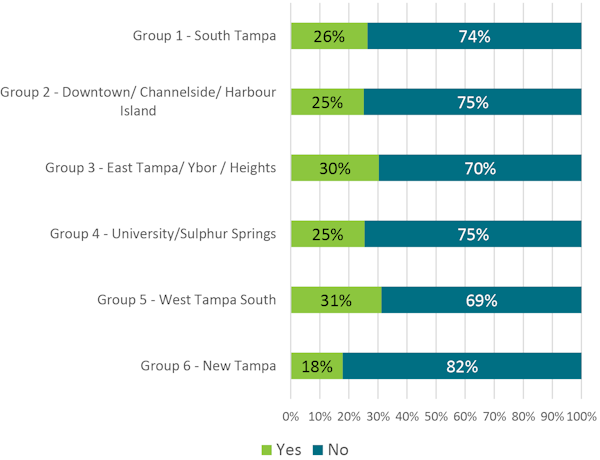
Do you regularly walk to run errands, visit businesses, or commute to work?: By Geography
Do you regularly bike or scoot to run errands, visit businesses, or commute to work?
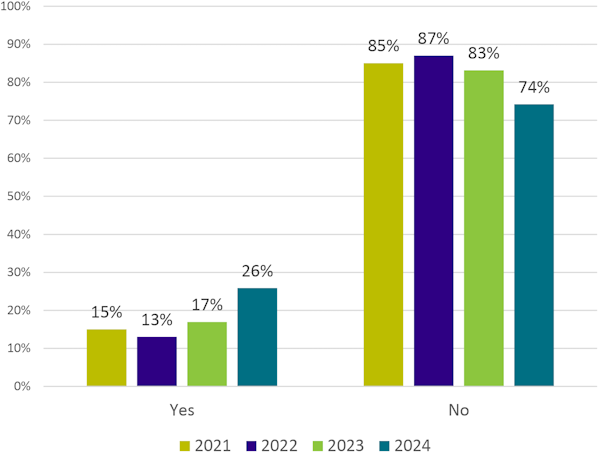
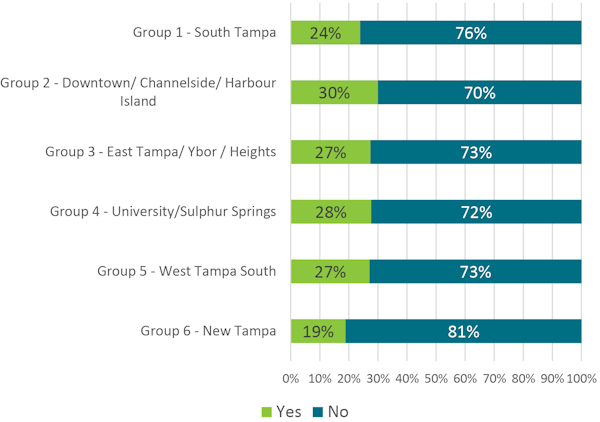
Do you regularly bike or scoot to run errands, visit businesses, or commute to work?: By Geography
Transportation
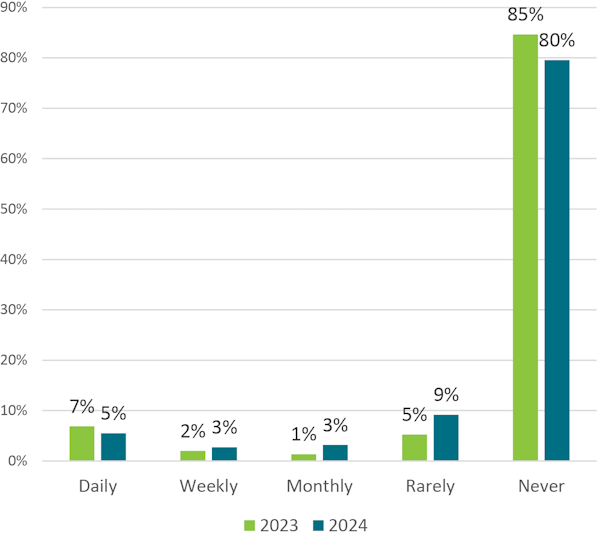
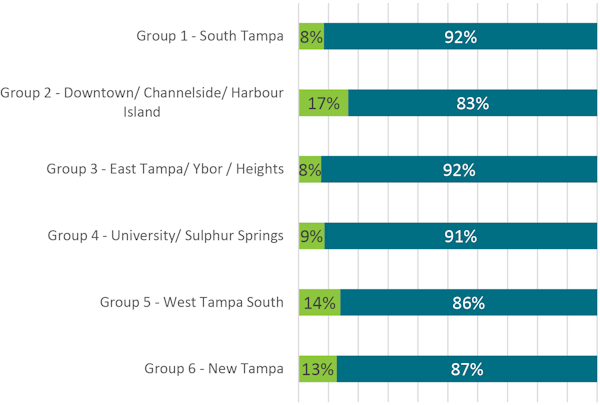
Do you use public transportation in Tampa, including buses and streetcars?: By Geography
Daily, Weekly, Monthly Rarely + Never
Conclusion
The survey results show that the residents have high levels of trust and confidence in the city government, high recommendation levels for living, working, and raising children in the city, and positive ratings for the city’s handling of issues in general.
1) Affordable housing choices, 2) smooth traffic flow on major roads, and 3) quality roads remain the three areas of greatest concern among city residents.
Only a quarter of residents are “very familiar” with accessory dwelling units and most residents do not hold strong opinions on whether they want them in their neighborhood.
Residents in the Downtown area report walking and/or biking for various reasons most often, but they also reported the lowest feelings of safety of walking/biking in their neighborhood