The David L. Tippin Water Treatment Facility Master Plan
CITY OF TAMPA, FLORIDA
DAVID L. TIPPIN WATER TREATMENT FACILITY MASTER PLAN
July 2018
FINAL


CA 8571
Carollo Engineers, Inc., Inc.
10117 Princess Palm Avenue, Suite 340
Tampa, Florida 33610
P: 813-888-9572

Printed copies of this document are not considered signed and sealed and the signature must be verified on any electronic copies.
DAVID L. TIPPIN WATER TREATMENT FACILITY MASTER PLAN
TABLE OF CONTENTS
| Section | Page No. |
|---|---|
| EXECUTIVE SUMMARY | |
| MASTER PLAN ASSESSMENT METHODOLOGY | ES-2 |
| Situational Analysis | ES-2 |
| Regulatory Evaluation | ES-2 |
| Facilities Condition Assessment | ES-2 |
| Hydraulic Evaluation | ES-4 |
| Process Evaluation | ES-4 |
| Benchmarking Study | ES-4 |
| Alternatives Development, Analysis, and Ranking | ES-4 |
| Capital Improvement Plan Cost Development | ES-5 |
| Alternative Delivery and Funding Options | ES-5 |
| Development of Master Plan | ES-5 |
| DESCRIPTION OF EXISTING FACILITIES | ES-6 |
| RAW AND FINISHED WATER QUALITY | ES-11 |
| Raw Water Quality and Characteristics | ES-11 |
| Finished Water Quality and Demand Considerations | ES-12 |
| REGULATORY EVALUATION SUMMARY | ES-13 |
| FACILITIES CONDITION ASSESSMENT SUMMARY | ES-15 |
| HYDRAULIC EVALUATION SUMMARY | ES-16 |
| PROCESS EVALUATION SUMMARY | ES-17 |
| BENCHMARKING EVALUATION SUMMARY | ES-20 |
| ALTERNATIVES EVALUATION SUMMARY | ES-21 |
| PRIORITIZED CAPITAL IMPROVEMENT PROGRAM | ES-25 |
| IMPLEMENTATION SCHEDULE | ES-29 |
| INTRODUCTION | |
| MASTER PLAN ASSESSMENT METHODOLOGY | I-2 |
| Situational Analysis | I-2 |
| Regulatory Evaluation | I-2 |
| Facilities Condition Assessment | I-2 |
| Hydraulic Evaluation | I-4 |
| Process Evaluation | I-4 |
| Benchmarking | I-5 |
| Alternatives Development and Ranking | I-5 |
| Cost Development | I-5 |
| Alternative Delivery and Funding Options | I-6 |
| Development of Master Plan | I-6 |
| DESCRIPTION OF EXISTING FACILITIES | I-6 |
| RAW AND FINISHED WATER QUALITY | I-14 |
| Raw Water Quality and Characteristics | I-14 |
| Finished Water Quality and Demand Considerations | I-15 |
CHAPTER 1 - REGULATORY EVALUATION
CHAPTER 2 - FACILITIES EVALUATION AND CONDITION ASSESSMENT
- 2.3.3 Major Pumping Systems Evaluation ........................................................... 2-6
- 2.3.4 Original Useful Life, Remaining Useful Life and Replacement ................... 2-6
- 2.3.4.1 Original Useful Life and Remaining Useful Life ............................ 2-6
- 2.3.4.2 Evaluated Remaining Useful Life ................................................. 2-8
- 2.3.5 Risk 2-8
- 2.3.6 Water Research Foundation Water Treatment Plant Infrastructure Assessment Manager Software ...................................................... 2-8
- 2.4 FACILITY INSPECTION AND FIELD OBSERVATIONS........................................ 2-9
- 2.4.1 Raw Water System ..................................................................................... 2-9
- 2.4.1.1 Plant Intake................................................................................. 2-10
- 2.4.1.2 Raw Water Conveyance and Valves .......................................... 2-12
- 2.4.2 Actiflo™ Treatment System ...................................................................... 2-13
- 2.4.2.1 Influent Valves, Piping, and Chemical Feed ............................... 2-13
- 2.4.2.2 Actiflo™ Microsand System ........................................................ 2-16
- 2.4.2.3 Train 1 ........................................................................................ 2-17
- 2.4.2.4 Train 2 ........................................................................................ 2-19
- 2.4.2.5 Actiflo™ Sludge System ............................................................. 2-19
- 2.4.3 Conventional Treatment System .............................................................. 2-21
- 2.4.3.1 Conventional Treatment Trains 5 and 6 ..................................... 2-21
- 2.4.3.2 Conventional Treatment Trains 7 and 8 ..................................... 2-25
- 2.4.4 Ozone System .......................................................................................... 2-27
- 2.4.4.1 Ozone Electrical Systems ........................................................... 2-28
- 2.4.4.2 Production System ..................................................................... 2-28
- 2.4.4.3 Contact System .......................................................................... 2-34
- 2.4.4.4 Ozone Destruct Units and Off Gas Blowers ............................... 2-36
- 2.4.4.5 Pre-Filter Junction Box (Settled water junction box) ................... 2-38
- 2.4.5 Chemical Systems .................................................................................... 2-38
- 2.4.5.1 Ferric Sulfate .............................................................................. 2-39
- 2.4.5.2 Fluoride....................................................................................... 2-40
- 2.4.5.3 Hydrogen Peroxide ..................................................................... 2-42
- 2.4.5.4 Polymer ...................................................................................... 2-43
- 2.4.5.5 Ammonia .................................................................................... 2-44
- 2.4.5.6 Caustic ........................................................................................ 2-45
- 2.4.5.7 Chlorine ...................................................................................... 2-48
- 2.4.5.8 Lime ............................................................................................ 2-51
- 2.4.6 Filtration Systems ..................................................................................... 2-51
- 2.4.6.1 Filters and Filter Gallery ............................................................. 2-52
- 2.4.6.2 Filter Backwash System ............................................................. 2-55
- 2.4.7 Residuals Handling and Thickening System ............................................ 2-57
- 2.4.7.1 Backwash Surge Tank System ................................................... 2-57
- 2.4.7.2 Thickener System ....................................................................... 2-60
- 2.4.7.3 Sludge Pumping Systems .......................................................... 2-60
- 2.4.8 Finished Water Systems........................................................................... 2-62
- 2.4.8.1 Filtered Water Flume .................................................................. 2-62
- 2.4.8.2 Clearwell Systems ...................................................................... 2-65
- 2.4.9 Pumping Systems ..................................................................................... 2-68
- 2.4.9.1 Raw Water Pumps...................................................................... 2-69
- 2.4.9.2 Low Lift Pumps ........................................................................... 2-70
- 2.4.9.3 High Service Pumps ................................................................... 2-72
- 2.4.9.4 Pump Station Summary .............................................................. 2-75
- 2.4.10 Building Systems ...................................................................................... 2-77
- 2.4.1 Raw Water System ..................................................................................... 2-9
2.4.10 Buildings
- 2.4.10.1 Old Raw Water Pump Building ................................................... 2-79
- 2.4.10.2 Lab Building................................................................................ 2-79
- 2.4.10.3 High Service and Lower Floor Pump Room Building ................. 2-79
- 2.4.10.4 Raw Water VFD and Switchgear Buildings ................................ 2-81
- 2.4.10.5 Maintenance Building ................................................................. 2-83
- 2.4.10.6 Utility Building ............................................................................. 2-83
- 2.4.10.7 Parts Building ............................................................................. 2-84
- 2.4.10.8 Basin Control Building ................................................................ 2-84
- 2.4.10.9 Material Storage Facility Building ............................................... 2-86
- 2.4.10.10 Ozone Building ....................................................................... 2-86
- 2.4.10.11 Polymer Building .................................................................... 2-86
- 2.4.10.12 E House Building.................................................................... 2-87
- 2.4.10.13 Chemical Building .................................................................. 2-87
- 2.4.10.14 Lime House ............................................................................ 2-90
- 2.4.10.15 Administration Building........................................................... 2-90
- 2.4.10.16 Filter Building and Gallery ...................................................... 2-91
- 2.4.10.17 Security Building .................................................................... 2-91
- 2.4.10.18 Generator and Switchgear Control Building........................... 2-93
- 2.4.10.19 Remote High Service Building ............................................... 2-93
- 2.4.10.20 Accelator Building .................................................................. 2-93
2.4.11 Plant Electrical Systems
- 2.4.11.1 Utility Power ................................................................................ 2-95
- 2.4.11.2 Emergency Power ...................................................................... 2-95
- 2.4.11.3 Electric Power Supply and Distribution ....................................... 2-97
- 2.4.11.4 Plant Control System Hardware and Software ........................... 2-97
2.4.12 Civil and Site Work Systems
- 2.4.12.1 Site Drainage, Stormwater and Paving ...................................... 2-97
- 2.4.12.2 Site Lighting and Security........................................................... 2-98
- 2.4.12.3 Sanitary Sewers ......................................................................... 2-98
- 2.4.12.4 Field Structures .......................................................................... 2-98
- 2.4.12.5 Yard Piping ................................................................................. 2-98
2.5 RECOMMENDATIONS AND ASSET REPLACEMENT TIMING
- 2.5.1 Mechanical Assets .................................................................................. 2-100
- 2.5.2 Electrical Assets ..................................................................................... 2-103
- 2.5.3 Structural Assets..................................................................................... 2-103
- 2.5.4 Buildings ................................................................................................. 2-103
- 2.5.5 Pump Stations ........................................................................................ 2-108
2.6 SUMMARY AND CONCLUSIONS
..................................................................... 2-109
CHAPTER 3 - PROCESS EVALUATION
- 3.1 CHAPTER SUMMARY ........................................................................................... 3-1
- 3.2 TEN STATES STANDARDS .................................................................................. 3-2
- 3.3 EXISTING PROCESS PERFORMANCE ............................................................... 3-2
- 3.3.1 Plant Intake Bar Rack, Grass Rake, and Rotating Screens ....................... 3-2
- 3.3.1.1 Description.................................................................................... 3-2
- 3.3.1.2 Existing Process Performance and Ability to Expand ................... 3-2
- 3.3.2 Actiflo™ Treatment System ........................................................................ 3-3
- 3.3.2.1 Description.................................................................................... 3-3
- 3.3.2.2 Existing Performance and Ability to Expand ................................. 3-5
- 3.3.3 Conventional Treatment Trains .................................................................. 3-5
- 3.3.3.1 Description.................................................................................... 3-5
3.3.3.2 Assumptions
................................................................................. 3-7
3.3.3.3 Rapid Mix System
....................................................................... 3-10
3.3.3.4 Flocculation System
................................................................... 3-14
3.3.3.5 Sedimentation System
................................................................ 3-24
3.3.3.6 CFD Modeling Results
................................................................ 3-28
3.3.3.7 Overall Notes on Existing Process Performance and Ability to Expand
....................................................................................... 3-31
3.3.4 Ozone System
.......................................................................................... 3-31
3.3.4.1 Description
.................................................................................. 3-31
3.3.4.2 Production System
..................................................................... 3-31
3.3.4.3 Contact System
.......................................................................... 3-32
3.3.4.4 Destruct System
......................................................................... 3-33
3.3.4.5 Existing Process Performance and Ability to Expand
................. 3-34
3.3.5 Settled Water - Pre-Filtration
.................................................................... 3-36
3.3.5.1 Chemical Feed and Settled Water Quality
................................. 3-36
3.3.5.2 Settled Water Pipelines
.............................................................. 3-40
3.3.6 Filtration Systems
..................................................................................... 3-40
3.3.6.1 Description
.................................................................................. 3-40
3.3.6.2 Filter Design and Characteristics
................................................ 3-42
3.3.6.3 Filter Backwash Design and Characteristics
.............................. 3-54
3.3.6.4 Existing Process Performance and Ability to Expand
................. 3-60
3.3.7 Chemical Systems
.................................................................................... 3-69
3.3.7.1 Ferric Sulfate
.............................................................................. 3-70
3.3.7.2 Sulfuric Acid
................................................................................ 3-72
3.3.7.3 Hydrogen Peroxide
..................................................................... 3-75
3.3.7.4 Polymer
...................................................................................... 3-76
3.3.7.5 Lime
............................................................................................ 3-77
3.3.7.6 Caustic Soda
.............................................................................. 3-79
3.3.7.7 Ammonia
.................................................................................... 3-81
3.3.7.8 Chlorine
...................................................................................... 3-83
3.3.7.9 Fluoride
....................................................................................... 3-85
3.3.7.10 Summary of Chemical Systems
................................................. 3-89
3.3.8 Waste Washwater, Sedimentation Basin Solids, and Thickening System
.......................................................................................... 3-90
3.3.8.1 Description
.................................................................................. 3-90
3.3.8.2 Existing Process Performance and Ability to Expand
................. 3-93
3.3.9 Finished Water Systems
........................................................................... 3-94
3.3.9.1 Hawkey Box and Blending Chamber
.......................................... 3-94
3.3.9.2 Clearwell Systems
...................................................................... 3-95
3.4 RECOMMENDED PROCESS IMPROVEMENTS
................................................ 3-96
3.4.1 On-site Sludge Handling Improvements
................................................... 3-96
3.4.1.1 Conventional Basin Sludge Collection
........................................ 3-98
3.4.2 Ozone Generation and Production Systems
.......................................... 3-100
3.4.3 Chemical Systems
.................................................................................. 3-105
3.4.4 Carbonate Softening
............................................................................... 3-107
3.4.5 Filtration
.................................................................................................. 3-110
3.5 SUMMARY OF RECOMMENDATIONS
............................................................. 3-111
CHAPTER 4 - HYDRAULIC EVALUATION
CHAPTER 5 - ALTERNATIVES DEVELOPMENT, ANALYSIS, AND RANKING
CHAPTER 6 - BENCHMARKING STUDY
- 6.1 CHAPTER SUMMARY ........................................................................................... 6-1
- 6.2 INTRODUCTION .................................................................................................... 6-2
- 6.3 APPROACH ........................................................................................................... 6-2
- 6.3.1 Plants Benchmarked ................................................................................... 6-4
- 6.3.1.1 Tampa Bay Regional Surface WTP .............................................. 6-4
- 6.3.1.2 Peace River WTF ......................................................................... 6-4
- 6.3.1.3 Lake Manatee WTP ...................................................................... 6-4
- 6.3.1.4 Preston and Hialeah WTPs .......................................................... 6-5
- 6.3.1.5 Santan Vista WTP ........................................................................ 6-5
- 6.3.1.6 Palm Beach County WTP No. 2 ................................................... 6-6
- 6.4 WATER QUALITY AND PROCESS PERFORMANCE .......................................... 6-6
- 6.4.1 TOC 6-6
- 6.4.2 Color 6-9
- 6.4.3 Turbidity ...................................................................................................... 6-9
- 6.5 COMPARISON OF OPERATIONS COMPONENTS ............................................ 6-14
- 6.5.1 Energy 6-14
- 6.5.2 Chemicals ................................................................................................. 6-15
- 6.5.3 Residuals Disposal ................................................................................... 6-20
- 6.5.4 Labor 6-20
- 6.5.5 Maintenance ............................................................................................. 6-24
- 6.5.6 Laboratory................................................................................................. 6-24
- 6.5.7 Overall O&M Cost..................................................................................... 6-26
- 6.6 SUMMARY AND CONCLUSIONS ....................................................................... 6-31
CHAPTER 7 - ALTERNATIVE DELIVERY METHODS
- 7.1 INTRODUCTION .................................................................................................... 7-1
- 7.2 PROJECT DELIVERY ANALYSIS ......................................................................... 7-1
- 7.2.1 Common Drivers for Method Selection ....................................................... 7-1
- 7.2.1.1 Cost .............................................................................................. 7-1
- 7.2.1.2 Level of Control ............................................................................ 7-1
- 7.2.1.3 Technical Coordination................................................................. 7-2
- 7.2.1.4 Schedule....................................................................................... 7-2
- 7.2.1.5 Risk Allocation .............................................................................. 7-2
- 7.2.1.6 Contractual and Regulatory .......................................................... 7-2
- 7.2.1 Common Drivers for Method Selection ....................................................... 7-1
- 7.3 ALTERNATIVE DELIVERY METHODS ................................................................. 7-2
- 7.3.1 Design-Bid-Build ......................................................................................... 7-2
- 7.3.1.1 Timeline and Schedule Considerations ........................................ 7-3
- 7.3.1.2 Teams ........................................................................................... 7-3
- 7.3.1.3 Risks ............................................................................................. 7-5
- 7.3.1.4 Cost Model ................................................................................... 7-5
- 7.3.1.5 Quality Considerations ................................................................. 7-7
- 7.3.1 Design-Bid-Build ......................................................................................... 7-2
7.3.1.6 Advantages and Disadvantages ................................................... 7-7
7.3.2 Construction Manager at Risk .................................................................... 7-7
- 7.3.2.1 Timeline and Schedule Considerations ........................................ 7-8
- 7.3.2.2 Teams ........................................................................................... 7-8
- 7.3.2.3 Risks ........................................................................................... 7-10
- 7.3.2.4 Cost Model ................................................................................. 7-10
- 7.3.2.5 Quality Considerations ............................................................... 7-12
- 7.3.2.6 Advantages and Disadvantages ................................................. 7-12
7.3.3 Design-Build ............................................................................................. 7-12
- 7.3.3.1 Timeline and Schedule Considerations ...................................... 7-13
- 7.3.3.2 Teams ......................................................................................... 7-13
- 7.3.3.3 Risks ........................................................................................... 7-15
- 7.3.3.4 Cost Model ................................................................................. 7-15
- 7.3.3.5 Quality Considerations ............................................................... 7-15
- 7.3.3.6 Advantages and Disadvantages ................................................. 7-17
7.3.4 Progressive Design-Build ......................................................................... 7-17
- 7.3.4.1 Timeline and Schedule Considerations ...................................... 7-17
- 7.3.4.2 Teams ......................................................................................... 7-17
- 7.3.4.3 Risks ........................................................................................... 7-18
- 7.3.4.4 Cost Model ................................................................................. 7-18
- 7.3.4.5 Quality Considerations ............................................................... 7-21
- 7.3.4.6 Advantages and Disadvantages ................................................. 7-21
7.4 SUMMARY AND CONCLUSIONS ....................................................................... 7-21
CHAPTER 8 - SUMMARY AND RECOMMENDATIONS
- 8.1 REGULATORY EVALUATION ............................................................................... 8-1
- 8.2 FACILITIES CONDITION ASSESSMENT.............................................................. 8-3
- 8.3 PROCESS EVALUATION ...................................................................................... 8-3
- 8.4 HYDRAULIC EVALUATION ................................................................................... 8-6
- 8.5 ALTERNATIVES EVALUATION ............................................................................. 8-8
- 8.6 BENCHMARKING EVALUATION ........................................................................ 8-13
CHAPTER 9 - PRIORITIZED CAPITAL IMPROVEMENT PLAN AND IMPLEMENTATION SCHEDULE
- 9.1 PRIORITIZED CAPITAL IMPROVEMENT PLAN ................................................... 9-1
- 9.1.1 Project Definition and Costs ....................................................................... 9-1
- 9.1.1.1 Project 1 – On-site Sodium Hypochlorite Generation ................... 9-2
- 9.1.1.2 Project 2 – High Service Pump Station Upgrades and Expansion ..................................................................................... 9-3
- 9.1.1.3 Project 3 - Intake Improvements and Raw Water Pump Station Upgrades .......................................................................... 9-3
- 9.1.1.4 Project 4 - Ozone Improvements 1............................................... 9-4
- 9.1.1.5 Project 5 - Yard Piping Inspection and Improvements ................. 9-5
- 9.1.1.6 Project 6 - Facility Expansion ....................................................... 9-6
- 9.1.1.7 Project 7 - Electrical Transformer Upgrades ................................ 9-9
- 9.1.1.8 Project 8 - Clearwell Expansion.................................................... 9-9
- 9.1.1.9 Project 9 - Buildings Improvements 1........................................... 9-9
- 9.1.1.10 Project 10 - Ozone Improvement 2............................................. 9-10
- 9.1.1.11 Project 11 - Chemical Systems Upgrades .................................. 9-11
- 9.1.1.12 Project 12 - Actiflo™ System Improvements .............................. 9-12
- 9.1.1 Project Definition and Costs ....................................................................... 9-1
LIST OF APPENDICES
| Appendix | Description |
|---|---|
| APPENDIX A | Comprehensive List of DLTWTF Asset Condition Scores |
| APPENDIX B | Condition Assessment Photos |
| APPENDIX C | Asset Manager Database |
| APPENDIX D | Applicable Ten States Standards |
| APPENDIX E | Hydraulix® Results: 80 MGD |
| APPENDIX F | Hydraulix® Results: 120 MGD |
| APPENDIX G | Hydraulix® Results: 140 MGD |
| APPENDIX 5A | Chlorine Storage and Feed System Alternatives Evaluation |
| APPENDIX 6H | Normalized Chemical Component Cost ($MGD/AADF) |
| APPENDIX 6I | Percent Chemical Component Cost |
LIST OF TABLES
- Table ES.1 Raw Water Quality and Characteristics ................................................. ES-11
- Table ES.2 Finished Water Quality and Characteristics ........................................... ES-12
- Table ES.3 Finished Water Quality Goals ................................................................ ES-13
- Table ES.4 Alternatives Life-Cycle Cost Comparison .............................................. ES-22
- Table ES.5 Comparison of Alternatives .................................................................... ES-23
- Table ES.6 15-Year Project Timeline ....................................................................... ES-26
- Table I.1 Raw Water Quality and Characteristics ..................................................... I-14
- Table I.2 Finished Water Quality and Characteristics ............................................... I-15
- Table I.3 Finished Water Quality Goals .................................................................... I-16
- Table 1.1 National Primary Drinking Water Regulations ............................................ 1-5
- Table 1.2 Bin Classifications and Additional Treatment Requirements for Filtered Systems Under LT2ESWTR ..................................................................... 1-10
- Table 1.3 Microbial Toolbox Components For LT2ESWTR ...................................... 1-11
- Table 1.4 Stage 1 D/DBPR TOC Removal Requirements ........................................ 1-13
- Table 1.5 National Secondary Drinking Water Regulations ...................................... 1-18
- Table 1.6 Calendar of Anticipated Future Regulatory Action .................................... 1-21
- Table 1.7 Anticipated Regulatory Updates and Potential Implications for DLTWTF ................................................................................................... 1-29
- Table 2.1 Asset Condition Ranking Scale (based on IIMM) ....................................... 2-5
- Table 2.2 Original Useful Lives based on Asset Type ................................................ 2-7
- Table 2.3 Plant Intake Bar Rack and Grass Rake Equipment .................................. 2-10
- Table 2.4 Rotating Screens No. 1 through 3 ............................................................ 2-12
- Table 2.5 Actiflo™ Sand Pumps ............................................................................... 2-16
- Table 2.6 Actiflo™ Microsand Silo............................................................................ 2-16
List of Tables
- Table 2.7 Actiflo™ Train 1 Mixers
- Table 2.8 Actiflo™ Train 2 Mixers
- Table 2.9 Actiflo™ Settling Tank Scrapers Trains 1 & 2
- Table 2.10 Actiflo™ Hydrocyclone System Train 1 & 2
- Table 2.11 Treatment Trains 5 and 6 Flocculators
- Table 2.12 Treatment Trains 5 and 6 Bridge Equipment
- Table 2.13 Treatment Trains 7 and 8 Flocculators
- Table 2.14 Treatment Trains 7 and 8 Bridge Equipment
- Table 2.15 Ozone Production LOX Tanks
- Table 2.16 Ozone Production LOX Vaporizers
- Table 2.17 Nitrogen Boost System
- Table 2.18 Ozone Generators No. 1 and No. 2 and Power Supply Units
- Table 2.19 Ozone Chillers No. 1 and No. 2
- Table 2.20 Ozone Contactors No. 1 and No. 2
- Table 2.21 Ozone Destruct System
- Table 2.22 Pre-Filter Junction Box
- Table 2.23 Ferric Sulfate System
- Table 2.24 Fluoride System
- Table 2.25 Hydrogen Peroxide System
- Table 2.26 Polymer System
- Table 2.27 Ammonia System
- Table 2.28 Sulfuric Acid System
- Table 2.29 Caustic System
- Table 2.30 Chlorine System
- Table 2.31 Lime System
- Table 2.32 Filters and Filter Gallery
- Table 2.33 Filter Air Scour System
- Table 2.34 Filter Washwater Pump System
- Table 2.35 Surge Tank System
- Table 2.36 Gravity Thickeners System
- Table 2.37 Conventional Train Sludge Pumps
- Table 2.38 Thickener Sludge Pumps
- Table 2.39 Filtered Water Flume
- Table 2.40 Hawkey Box
- Table 2.41 Blending Chamber
- Table 2.42 Finish Flow Meters and Vaults
- Table 2.43 Pump Station Summary
- Table 2.44 Asset Condition, Recommendation, and Timing for Mechanical Assets
- Table 2.45 Asset Condition, Recommendation, and Timing for Electrical Assets
- Table 2.46 Asset Condition, Recommendation, and Timing for Structural Assets
- Table 2.47 Asset Condition, Recommendation, and Timing for Buildings
- Table 2.48 Asset Condition, Recommendation, and Timing for Pumps
- Table 3.1 Raw Water Intake Equipment Design Criteria
- Table 3.2 Actiflo™ In-line Static Mixers Assumed Design Criteria
- Table 3.3 Actiflo™ Process Design Criteria
- Table 3.4 Recommended Detention Times based on Ten States Standards
- Table 3.5 Conventional Rapid Mix/Coagulation Design Criteria
- Table 3.6 Conventional Flocculation Design Criteria
- Table 3.7 Port Velocity Violations for Flocculation and Sedimentation Basins
- Table 3.8 Conventional Sedimentation Design Criteria
| Table Number | Title | Page |
|---|---|---|
| 3.9 | Conventional Sedimentation Effluent Launders Design Criteria | 3-26 |
| 3.10 | Comparison of Original Draper WTP Design Criteria and Retrofit Draper Basin Criteria | 3-27 |
| 3.11 | Ozone Production System Design Criteria | 3-32 |
| 3.12 | Ozone Contact System Design Criteria | 3-33 |
| 3.13 | Ozone Production Rates at Varying Plant Capacity | 3-34 |
| 3.14 | Ozone Contactor Capacity at Varying Plant Flows | 3-36 |
| 3.15 | Settled Water Quality Prior to Combined Flow (Trains 5-8 - based on 60/40 split) | 3-39 |
| 3.16 | Settled Water Quality Combined Flow | 3-39 |
| 3.17 | Settled Water Pipelines Observations | 3-40 |
| 3.18 | Filtration Process Design Criteria | 3-41 |
| 3.19 | Actual vs Optimal Filter Dimensions | 3-42 |
| 3.20 | Filter Box Design Requirements and Compliance | 3-46 |
| 3.21 | Filter Media Design Requirements and Compliance | 3-53 |
| 3.22 | Ferric Sulfate System Original Design Criteria | 3-70 |
| 3.23 | Sulfuric Acid System Original Design Criteria | 3-72 |
| 3.24 | Hydrogen Peroxide System Original Design Criteria | 3-75 |
| 3.25 | Polymer System Original Design Criteria | 3-76 |
| 3.26 | Lime System Original Design Criteria | 3-78 |
| 3.27 | Caustic Soda System Original Design Criteria | 3-81 |
| 3.28 | Ammonia System Original Design Criteria | 3-83 |
| 3.29 | Chlorine System Original Design Criteria | 3-85 |
| 3.30 | Fluoride System Original Design Criteria | 3-87 |
| 3.31 | Summary of Chemical Systems | 3-89 |
| 3.32 | Gravity Thickener and Surge System Original Design Criteria | 3-90 |
| 3.33 | Gravity Thickener and Surge System Intended Operation Evaluation | 3-94 |
| 3.34 | Water Quality Combined Flow After Filtration and Caustic Soda Addition | 3-95 |
| 3.35 | Chemical Storage Requirements for 30 Day Storage and Expansion | 3-105 |
| 3.36 | Chemical Storage Requirements for 15 Day Storage and Expansion | 3-106 |
| 3.37 | Summary of Process Recommendations | 3-111 |
| 4.1 | Calibrated Hydraulix® Results Compared to Field Measurements | 4-14 |
| 4.2 | Calibrated Hydraulix® Results Compared to Field Measurements: Head Loss Across Basins | 4-15 |
| 4.3 | WaterCAD Flow Split Results | 4-26 |
| 4.4 | Filter Effluent Flume WSE Comparison | 4-33 |
| 4.5 | Recommendations for Liquid Stream Flow | 4-35 |
| 4.6 | Recommendations for Solids Stream Flow | 4-37 |
| 5.1 | Finished Water Quality Goals | 5-6 |
| 5.2 | Alternative 1A Conventional System Design Criteria | 5-13 |
| 5.3 | Alternative 1A New Actiflo™ System Design Criteria | 5-14 |
| 5.4 | Alternative 1A Capital Costs | 5-16 |
| 5.5 | Alternative 1A Operating and Maintenance Costs | 5-17 |
| 5.6 | Alternative 1B Conventional System Design Criteria | 5-24 |
| 5.7 | Alternative 1B Capital Costs | 5-27 |
| 5.8 | Alternative 1B Operating and Maintenance Costs | 5-28 |
| 5.9 | Comparison of Ion Exchange Alternatives | 5-29 |
| 5.10 | Alternative 2A MIEX System Design Criteria | 5-34 |
List of Tables
- Table 5.11 Alternative 2A Capital Costs ................................................................. 5-38
- Table 5.12 Alternative 2A Operating and Maintenance Costs ............................. 5-39
- Table 5.13 Alternative 2B Fixed Bed IX System Design Criteria ....................... 5-44
- Table 5.14 Alternative 2B Capital Costs ................................................................. 5-45
- Table 5.15 Alternative 2B Operating and Maintenance Costs ............................. 5-46
- Table 5.16 Alternative 3 Existing Treatment Train Design Criteria .................... 5-52
- Table 5.17 Alternative 3 New Treatment Train Design Criteria ......................... 5-55
- Table 5.18 Alternative 3 Capital Costs ................................................................. 5-57
- Table 5.19 Alternative 3 Operating and Maintenance Costs .............................. 5-58
- Table 5.20 Alternatives Life-Cycle Cost Comparison ......................................... 5-60
- Table 5.21 Comparison of Alternatives ................................................................. 5-61
- Table 5.22 Alternatives Evaluation Matrix .......................................................... 5-63
- Table 6.1 Facilities Benchmarked ........................................................................ 6-3
- Table 6.2 Annual Total Production and Average Annual Daily Flow ................. 6-14
- Table 6.3 Energy Use and Cost.......................................................................... 6-15
- Table 6.4 Labor Staff ......................................................................................... 6-20
- Table 6.5 Laboratory Costs ................................................................................ 6-24
- Table 6.6 Normalized Overall O&M Cost and Components ............................ 6-27
- Table 6.7 Percent of Overall Normalized O&M Cost and Components ............. 6-28
- Table 7.1 Comparison of Delivery Methods ....................................................... 7-22
- Table 8.1 Regulatory Evaluation Recommendations .......................................... 8-1
- Table 8.2 Process Evaluation Recommendations ............................................... 8-5
- Table 8.3 Hydraulic Evaluation Recommendations ............................................ 8-6
- Table 8.4 Alternatives Life-Cycle Cost Comparison ............................................ 8-9
- Table 8.5 Comparison of Alternatives .................................................................. 8-9
- Table 8.6 Alternatives Evaluation Matrix ........................................................... 8-11
- Table 9.1 15-Year Project Timeline ..................................................................... 9-16
LIST OF FIGURES
- Figure ES.1 Master Plan Development Approach ................................................ ES-3
- Figure ES.2 DLTWTF Overall Site Layout ........................................................... ES-7
- Figure ES.3 DLTWTF Process Flow Diagram ..................................................... ES-8
- Figure ES.4 DLTWTF Solids Flow Diagram ....................................................... ES-9
- Figure ES.5 DLTWTF Existing Chemical Application Points ............................ ES-10
- Figure ES.6 Flow Projections for the DLTWTF (Provided by B&V) ................ ES-14
- Figure ES.7 Hydraulic Profile at Future Demand Flow (140 mgd) Part A .......... ES-18
- Figure ES.8 Hydraulic Profile at Future Demand Flow (140 mgd) Part B .......... ES-19
- Figure ES.9 15-Year Implementation Schedule .................................................. ES-30
- Figure I.1 DLTWTF Expansion Projects Timeline .............................................. I-8
- Figure I.2 DLTWTF Overall Site Layout ............................................................ I-10
- Figure I.3 DLTWTF Process Flow Diagram ....................................................... I-11
- Figure I.4 DLTWTF Existing Chemical Application Point ................................ I-12
- Figure I.5 Existing Solids Flow Diagram ............................................................ I-13
- Figure I.6 Flow Projections for the DLTWTF (Provided by B&V) .................... I-17
| Figure | Title | Page |
|---|---|---|
| 2.1 | Raw Water System Condition Photos | 2-11 |
| 2.2 | Actiflo™ Treatment System Layout | 2-14 |
| 2.3 | Actiflo™ Condition Photos 1 | 2-15 |
| 2.4 | Actiflo™ Condition Photos 2 | 2-18 |
| 2.5 | Conventional System Layout | 2-22 |
| 2.6 | Conventional Trains 5 and 6 Condition Photos | 2-23 |
| 2.7 | Conventional Trains 7 and 8 Condition Photos | 2-26 |
| 2.8 | Ozone System Condition Photos 1 | 2-29 |
| 2.9 | Ozone System Condition Photos 2 | 2-31 |
| 2.10 | Ozone System Condition Photos 3 | 2-35 |
| 2.11 | Ozone Destruct System and Pre-Filter Junction Box Condition Photos | 2-37 |
| 2.12 | Chemical Systems Condition Photos 1 | 2-41 |
| 2.13 | Chemical System Condition Photos 2 | 2-46 |
| 2.14 | Chemical Systems Condition Photos 3 | 2-47 |
| 2.15 | Chemical System Condition Photos 4 | 2-50 |
| 2.16 | Filter System Layout and Year Constructed | 2-53 |
| 2.17 | Filter Systems Condition Photos | 2-54 |
| 2.18 | Residuals Handling and Thickening Systems Layout | 2-58 |
| 2.19 | Residuals Handling and Thickening Systems Condition Photos 1 | 2-59 |
| 2.20 | Residuals Handling and Thickening Systems Condition Photos 2 | 2-63 |
| 2.21 | Finished Water Systems Condition Photos | 2-64 |
| 2.22 | Clearwell Recommendations from Previous Studies | 2-67 |
| 2.23 | Raw Water Pumps Condition Photos | 2-71 |
| 2.24 | Low Lift Pumps Condition Photos | 2-73 |
| 2.25 | High Service Pumps Condition Photos | 2-74 |
| 2.26 | DLTWTF Buildings Site Layout | 2-78 |
| 2.27 | Building Condition Photos 1 | 2-80 |
| 2.28 | Buildings Condition Photos 2 | 2-82 |
| 2.29 | Buildings Condition Photos 3 | 2-85 |
| 2.30 | Building Condition Photos 4 | 2-88 |
| 2.31 | Building Condition Photos 5 | 2-89 |
| 2.32 | Building Condition Photos 6 | 2-92 |
| 2.33 | Building Condition Photos 7 | 2-94 |
| 2.34 | Electrical Systems Condition Photos | 2-96 |
| 2.35 | Civil and Site Work System Condition Photos | 2-99 |
| 3.1 | Effluent TOC in Actiflo™ vs Conventional Train 5 | 3-6 |
| 3.2 | Rapid Mix Basin 1 Configuration | 3-12 |
| 3.3 | Rapid Mix Basin 2 Configuration | 3-13 |
| 3.4 | Flocculation Basin Configurations for Trains 5 & 6 | 3-15 |
| 3.5 | Flocculation Basin Configurations for Trains 7 & 8 | 3-16 |
| 3.6 | Recommended Mixing Energy versus Actual Mixing Energy | 3-19 |
| 3.7 | Rotational Directions of Flocculators for Trains 5-8 | 3-21 |
| 3.8 | Pitched Blade Angles and Resulting Water Flow based on Rotation | 3-22 |
| 3.9 | Basin Port Locations and Sizes for Trains 5-8 | 3-23 |
| 3.10 | Conventional System CFD Modeling Results Plan View | 3-29 |
| 3.11 | Conventional System CFD Modeling Results Profile View | 3-30 |
| 3.12 | Iron solubility versus pH | 3-38 |
| 3.13 | Existing Filter Box Dimensions | 3-43 |
| 3.14 | Critical Filter Aspects | 3-44 |
- Figure 3.15 Head loss Across Underdrain with Varying Backwash Rates ................... 3-47
- Figure 3.16 Air Losses across Underdrains with Varying Air Scour Rates with IMS Cap ........................................................................................................... 3-49
- Figure 3.17 Poor Distribution Across the Underdrain with Different Lateral Lengths and Backwash Rates ................................................................................ 3-50
- Figure 3.18 Required Backwash Rates for Sand and GAC ........................................ 3-52
- Figure 3.19 SCADA Screen for Filters ......................................................................... 3-56
- Figure 3.20 Backwash Setpoints from SCADA ............................................................ 3-57
- Figure 3.21 Filter 6 Head loss (May 22, 2016 through June 5, 2016) .......................... 3-61
- Figure 3.22 Filter 25 Head loss (May 22, 2016 through June 5, 2016) ........................ 3-62
- Figure 3.23 Filter 6 Head loss (June 13, 2016 through June 26, 2016) ....................... 3-63
- Figure 3.24 Filter 25 Head loss (June 13, 2016 through June 26, 2016) ..................... 3-64
- Figure 3.25 UFRV versus Loading Rate ...................................................................... 3-65
- Figure 3.26 Clean Bed Head Loss versus Loading Rate ............................................. 3-67
- Figure 3.27 TOC and DOC Removal Across Filters 3, 12, and 17 .............................. 3-68
- Figure 3.28 Site Plan and Chemical Application Points .............................................. 3-71
- Figure 3.29 Ferric Sulfate Storage Capacity at Current Average Dose with Varying Flows ........................................................................................................ 3-73
- Figure 3.30 Sulfuric Acid Storage Capacity at Current Average Dose and Varying Plant Flows ............................................................................................... 3-74
- Figure 3.31 Lime Storage Capacity at Current Dose and Various Flow Rates ............ 3-80
- Figure 3.32 Caustic Storage Capacity at Current Average Dose and Various Flows .. 3-82
- Figure 3.33 Ammonia Storage Capacity at Current Average Dose and Varying Flow Rates ................................................................................................ 3-84
- Figure 3.34 Chlorine Storage Capacity at Various Plant Flow Rates .......................... 3-86
- Figure 3.35 Fluoride Storage Capacity at Current Average Dose and Varying Flows . 3-88
- Figure 3.36 Existing Solids Process Flow Diagram ..................................................... 3-92
- Figure 3.37 Proposed Solids Flow Diagram ................................................................ 3-97
- Figure 3.38 Proposed Solids Facilities Site Layout ...................................................... 3-99
- Figure 3.39 Alternative Sludge Collection Systems ................................................... 3-101
- Figure 3.40 Ozone Gasketless Diffuser ..................................................................... 3-103
- Figure 3.41 Statiflo Ozone Gas Dispersion System ................................................... 3-104
- Figure 3.42 Proposed Process Flow Diagram for Carbonate Softening .................... 3-108
- Figure 3.43 Comparison of CCPP and pH for Current versus Proposed Treatment . 3-109
- Figure 4.1A Liquid Process Flow Diagram (Part A) ........................................................ 4-4
- Figure 4.1B Liquid Process Flow Diagram (Part B) ....................................................... 4-5
- Figure 4.2 Solids Process Flow Diagram .................................................................... 4-7
- Figure 4.3 Flow Paths from the Pre-Filter Junction Box ............................................ 4-12
- Figure 4.4A Hydraulic Profile Current Average Daily Flow (80 MGD) (Part A) ............ 4-17
- Figure 4.4B Hydraulic Profile Current Average Daily Flow (80 MGD) (Part B) ........... 4-18 Figure 4.5A Hydraulic Profile Current Permitted Treatment Capacity (120 MGD) (Part A) ..................................................................................................... 4-20
- Figure 4.5B Hydraulic Profile Current Permitted Treatment Capacity (120 MGD) (Part B) ..................................................................................................... 4-21
- Figure 4.6A Hydraulic Profile Future Demand Flow (140 MGD) (Part A) ..................... 4-22
- Figure 4.6B Hydraulic Profile Future Demand Flow (140 MGD) (Part B) ..................... 4-23
- Figure 4.7 Recommended Flow Path Modifications from Pre-Filter Junction Box ..... 4-27
- Figure 4.8 Recommended Disinfection Process Modifications .................................. 4-30
- Figure 4.9 Recommended Filter Effluent Flow Path Modifications ............................ 4-32
- Figure 5.1 Alternative 1A Process Flow Diagram ........................................................ 5-9
- Figure 5.2 CFD Model Results at 15 mgd per Train .................................................. 5-11
- Figure 5.3 Alternative 1A Expanded Actiflo ............................................................... 5-12
- Figure 5.4 Alternative 1B Process Flow Diagram ...................................................... 5-19
- Figure 5.5 Tapered versus Non-Tapered Flocculation Jar Tests ............................... 5-20
- Figure 5.6 CFD Model Results at 25 mgd per Train .................................................. 5-21
- Figure 5.7 CFD Model Results with Proposed Modifications ..................................... 5-23
- Figure 5.8 Alternative 1B Proposed Modifications to Existing Facilities .................... 5-26
- Figure 5.9 MIEX Process Flow Diagram .................................................................... 5-33
- Figure 5.10 Alternative 2A – MIEX ............................................................................... 5-35
- Figure 5.11 MIEX Bench Scale Testing Results .......................................................... 5-37
- Figure 5.12 Alternative 2B Process Flow Diagram ...................................................... 5-41
- Figure 5.13 Alternative 2B Fixed Bed IX ...................................................................... 5-43
- Figure 5.14 Alternative 3 Process Flow Diagram ......................................................... 5-50
- Figure 5.15 Alternative 3 MF/UF Train ......................................................................... 5-54
- Figure 6.1 Raw Water Total Organic Carbon ............................................................. 6-7
- Figure 6.2 TOC Removal ............................................................................................ 6-8
- Figure 6.3 Raw Water Color .................................................................................... 6-10
- Figure 6.4 Color Removal ......................................................................................... 6-11
- Figure 6.5 Raw Water Turbidity ............................................................................... 6-12
- Figure 6.6 Turbidity Removal.................................................................................... 6-13
- Figure 6.7 Energy Use Normalized to Production Flow ............................................ 6-16
- Figure 6.8 Energy Cost Normalized to Production Flow ........................................... 6-17
- Figure 6.9 Coagulant Use Normalized to Production Flow and Amount of TOC Removed .................................................................................................. 6-18
- Figure 6.10 Chemicals and Media Cost Normalized to Production Flow and Amount of TOC Removed ........................................................................ 6-19
- Figure 6.11 Residuals Normalized to Production Flow and Amount of TOC Removed .................................................................................................. 6-21
- Figure 6.12 Residuals Disposal Cost Normalized to Production Flow and Amount of TOC Removed...................................................................................... 6-22
- Figure 6.13 Labor Cost Normalized to Production Flow .............................................. 6-23
- Figure 6.14 Maintenance Cost Normalized to Production Flow .................................. 6-25
- Figure 6.15 Normalized Overall O&M Cost................................................................. 6-29
- Figure 6.16 Percent of Normalized Overall O&M Cost ................................................ 6-30
- Figure 7.1 Contractual and Working Relationship for DBB Project.............................. 7-4
- Figure 7.2 Cost Model Timeline for DBB Project ......................................................... 7-6
- Figure 7.3 Contractual and Working Relationship for DBB Project.............................. 7-9
- Figure 7.4 Cost Model Timeline for CMAR Project .................................................... 7-11
- Figure 7.5 Contractual and Working Relationship for D/B Project ............................. 7-14
- Figure 7.6 Cost Model Timeline for D/B Project ......................................................... 7-16
- Figure 7.7 Contractual and Working Relationship for PDB Project............................ 7-19
- Figure 7.8 Cost Model Timeline for PDB Project ....................................................... 7-20
- Figure 7.9 Alternative Delivery Method Summary .................................................... 7-23
- Figure 8.1 Facilities Condition Assessment Summary ................................................. 8-4
- Figure 8.2 Benchmark Evaluation Summary ............................................................. 8-14
- Figure 9.1 15-Year Implementation Plan ................................................................... 9-20
City of Tampa, Florida – David L. Tippin Water Treatment Facility Master Plan
EXECUTIVE SUMMARY
The City of Tampa Water Department currently owns and operates the David L. Tippin Water Treatment Facility (DLTWTF), which produced on average about 75 million gallons per day (mgd) of potable water for its customers (610,000 population; 135,000 service locations) in 2017. The primary source of water for the DLTWTF is Hillsborough River, while a secondary source is the Tampa Bypass Canal Middle Pool. DLTWTF also uses an aquifer storage and recovery (ASR) system of wells to store treated water in an aquifer during the wet season when river flows are high and recover the water when river flows are low and other supplies are limited. The DLTWTF, under its Water Use Permit (WUP) #20002062.006, is permitted to withdraw an annual average quantity of 82 mgd and a maximum daily quantity of 120 mgd. The City holds an additional WUP for Sulphur Springs, which allows the City to pump up to 5 mgd annual average and 10 mgd peak month from Sulphur Springs to either augment the reservoir during low flow periods or to maintain some minimum flow at the base of the Hillsborough River dam. Water from the Harney Canal is pumped over structure S-161 into the Hillsborough River Reservoir during low flow conditions, with an annual average limit of 20 mgd and a peak month limit of 40 mgd.
The City requested that Carollo prepare a comprehensive Master Plan (MP) including a prioritized capital improvement program (CIP) that optimizes treatment, improves treated water quality, reduces operating costs, and enhances treatment and operations through a carefully planned repair and replacement program. The Master Plan also identified improvements to accommodate future plant expansions to treat additional flows, including those from alternative water supplies. Below is a summary of the work tasks used to develop the Master Plan.
- Task 1 - Situational Analysis:
- Regulatory Evaluation
- Facilities Evaluation and Condition Assessment
- Process Evaluation
- Hydraulic Evaluation
- Task 2 - Benchmarking Study
- Task 3 - Alternatives Development, Analysis, and Ranking
- Pilot Plant Study on MIEX
Chapters 1 through 6 detail each evaluation and their resulting recommendations. Recommendations from these tasks were then prioritized and scheduled over the 15-year planning horizon (2017 through 2032). Additionally, options for construction sequencing and packaging, and alternative delivery opportunities were considered.
MASTER PLAN ASSESSMENT METHODOLOGY
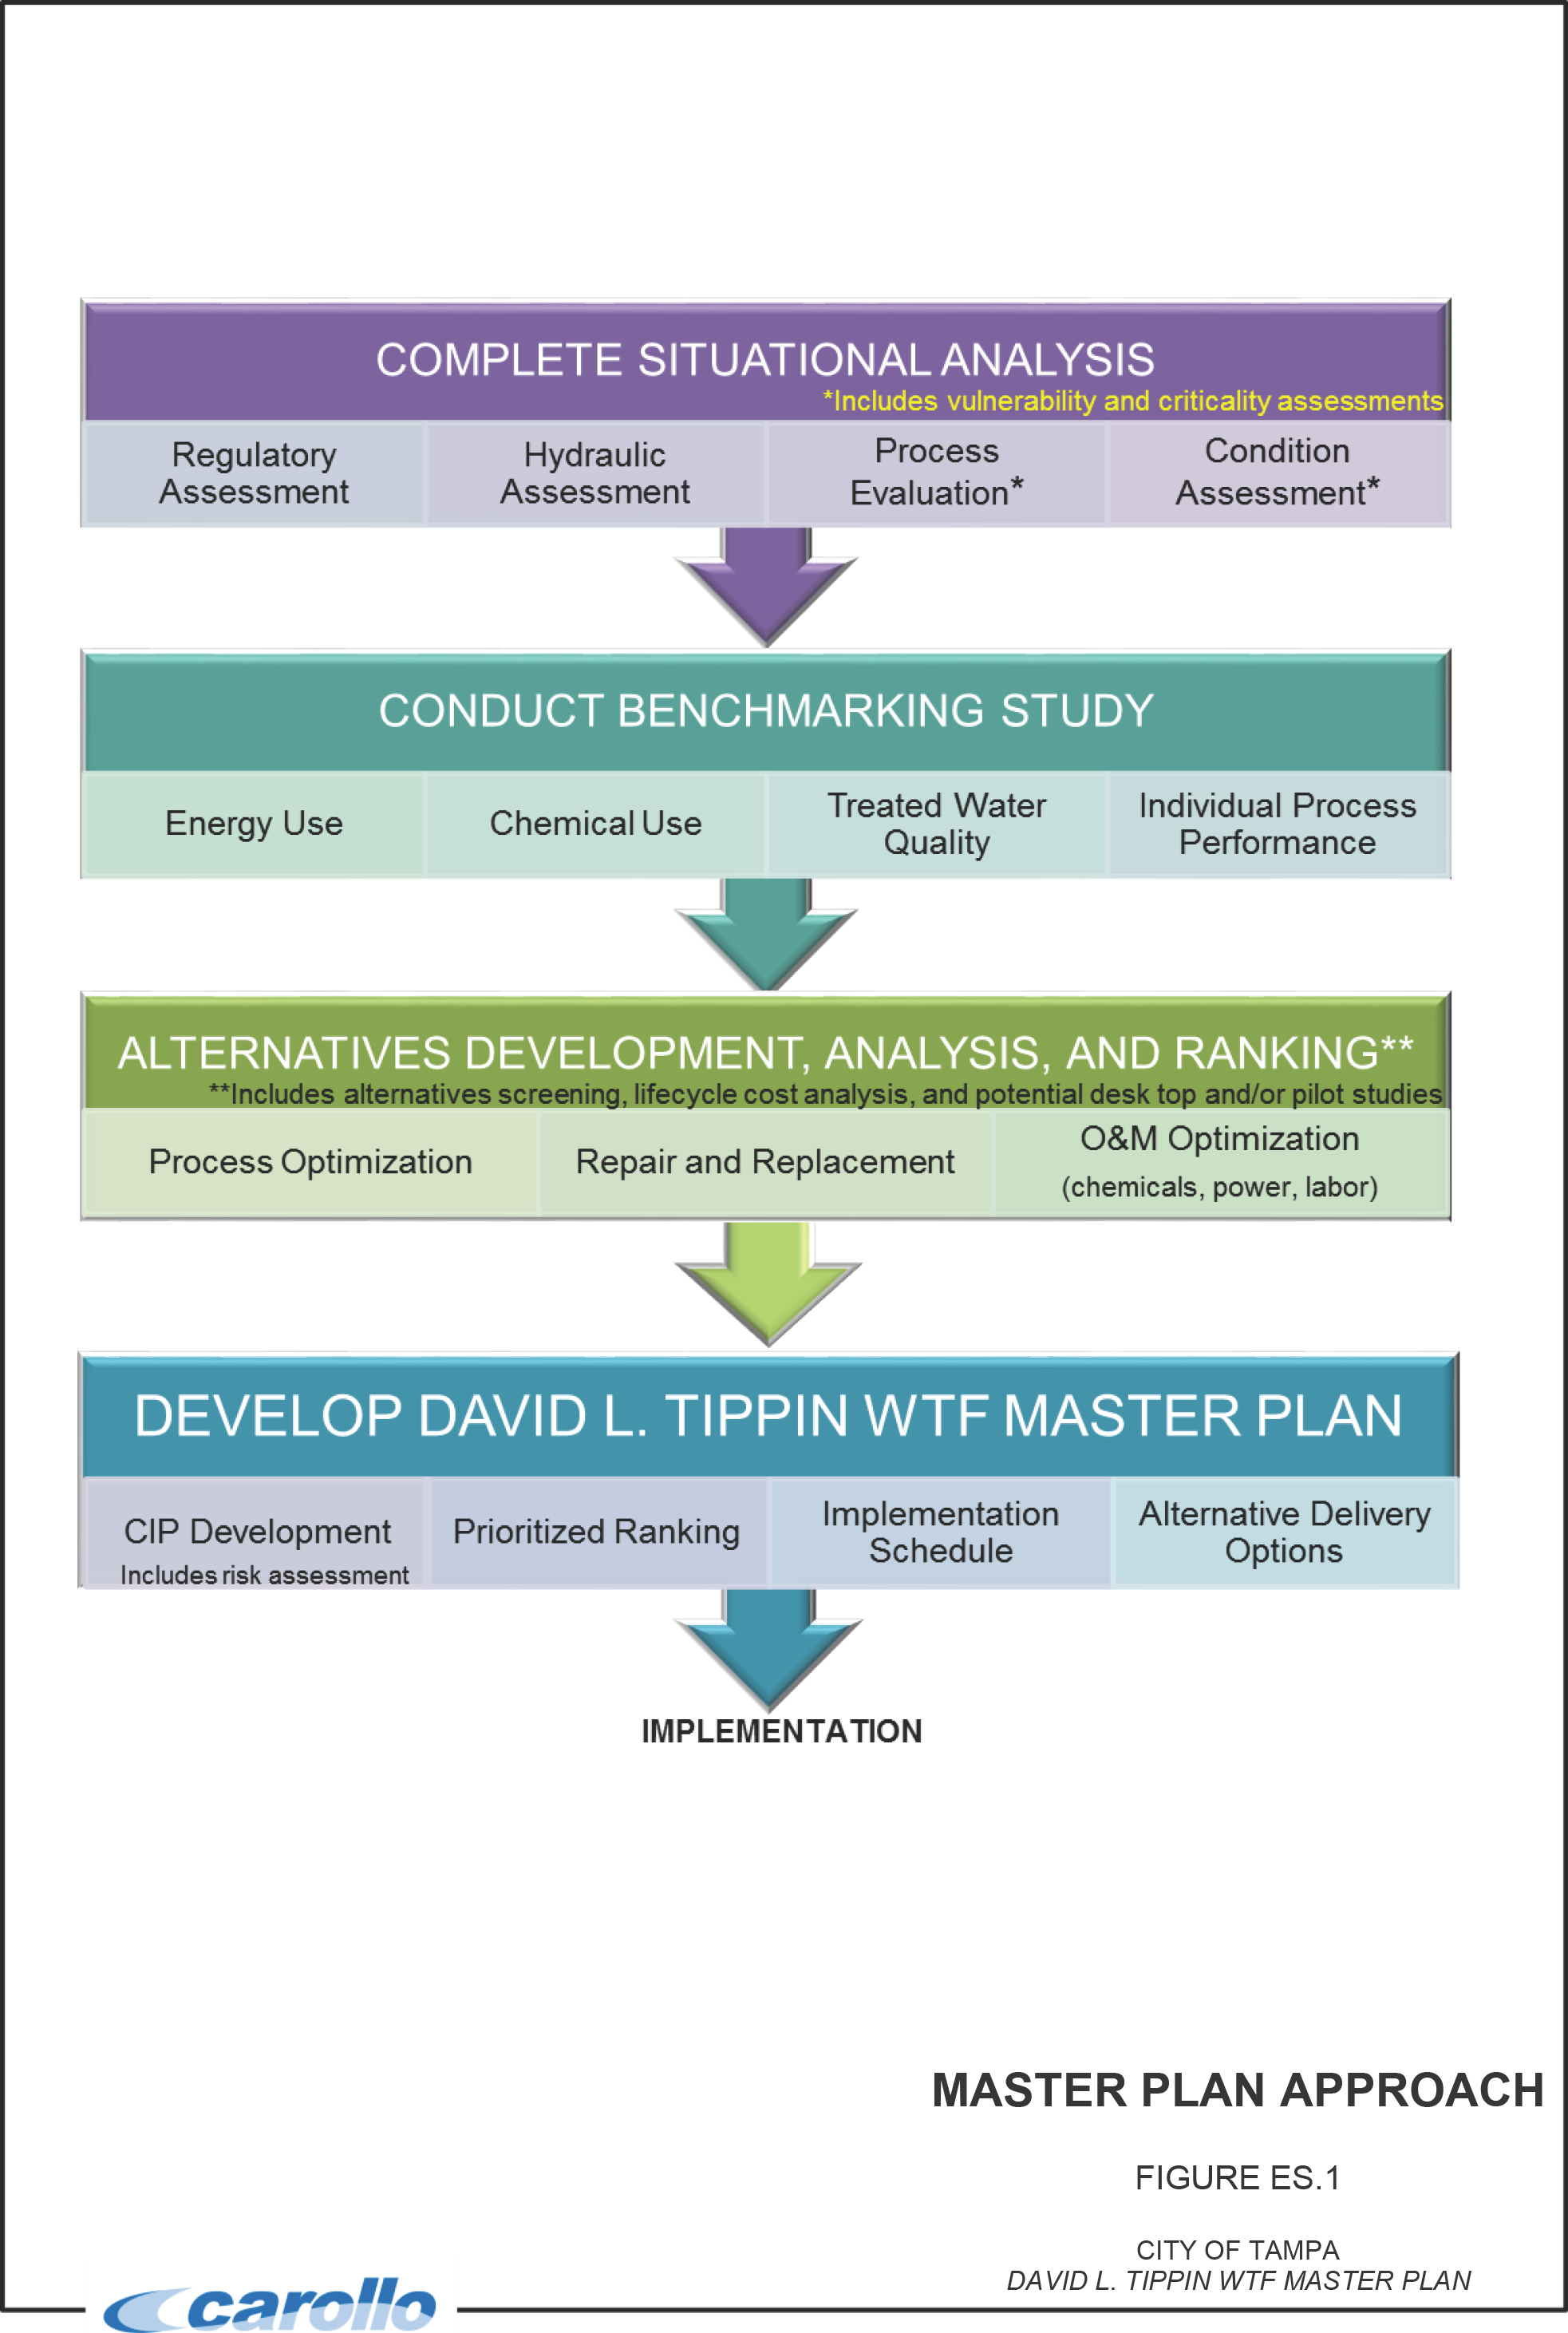
A comprehensive approach to develop this master plan was utilized and included a number of tasks, assessments, and analyses. Figure ES.1 illustrates this approach, and the details of each component are described herein. This approach is based on the idea of conducting multiple engineering assessments at the plant that represent stand-alone efforts (and subsequent technical memorandums), yet can be assimilated into a single engineering study that considers the facilities needs from multiple vantage points. In essence, this approach incorporates tools and methods to sort through and organize a myriad of data to create, analyze, and select solutions ideally suited to the plant from the standpoint of hydraulic efficiency, water quality, process optimization, regulatory compliance, and well-timed rehabilitation and repair.
Situational Analysis
The first task in the development of the master plan included a situational analysis that consisted of a regulatory evaluation, process evaluation, hydraulic evaluation, and facilities condition assessment. This approach ensured a comprehensive look at the DLTWTF in order to provide an accurate and complete set of recommendations to satisfy the DLTWTF's needs. The findings and results of these evaluations helped determine the most appropriate alternative treatment technologies to be considered for the Alternatives Development Task. The works associated with each evaluation are noted below.
Regulatory Evaluation
This evaluation included a review of current and anticipated water quality regulations to understand impacts to existing treatment processes, laboratory testing requirements, and applicability to alternative treatment processes. Upon review of the regulations, an initial assessment of the existing treatment process and alternative treatment processes for removal of applicable constituents was conducted.
Facilities Condition Assessment
The facilities condition assessment subtask included determination of the status, condition, and functionality of the existing facilities. Assets were given a condition score based on their physical condition, functionality, availability of spare parts, and reliability. These considerations and additional notes provided by plant staff were recorded in a software called Water Research Foundation Water Treatment Plant Infrastructure Assessment Manager, which organizes, and records information and scores for condition assessments.
Risk was calculated for each asset based on their condition score and criticality. Criticality scores were determined based on the consequence of asset failure. Consequences considered the ability to meet demands, impact to public health and/or environmental health, and impact on providing high quality drinking water.
The evaluated remaining useful life (EvRUL) of an asset was also determined, based on the condition of the asset and its original useful life. Used in conjunction, the EvRUL and risk helped determine when an asset should be replaced. Over 3,000 assets were consolidated (based on assets with similar function and condition) and organized into 496 line items with calculated risks and EvRUL. The results of this evaluation helped influence the timing and grouping of projects for the 15-year CIP.
Hydraulic Evaluation
The existing DLTWTF's hydraulic profile was developed as a part of the hydraulic evaluation at flows of 80, 120, and 140 mgd to determine bottlenecks that hinder facility optimization and/or expansion. Additional tasks completed consisted of a field survey to verify water surface and top of concrete elevations, identification of hydraulic deficiencies and bottlenecks with the DLTWTF, and the development of recommendations for mitigating the identified hydraulic constraints. The hydraulic evaluation results helped determine the DLTWTF's current capacities and required improvements to meet future demands.
Process Evaluation
The process evaluation included review and assessment of the existing unit treatment operations and processes employed at the DLTWTF to determine opportunities for optimization, regulatory compliance, and expansion. Raw water quality, finished water quality, and current water quality goals were considered in addition to existing process performance at 80, 120, and 140 mgd. Results of this evaluation directly influenced the alternatives treatment options selected for the Alternatives Development Task. Some recommendations made as a part of this evaluation, however, were determined to be required regardless of the selected alternative and were noted as such.
Benchmarking Study
Another task included a benchmarking study which involved comparing various criteria associated with the processes and operations at DLTWTF to other treatment plants. There were six treatment plants selected based on similar size, raw water quality, treatment objectives, and/or treatment processes. The compared criteria included cost of operations (power, chemical, O&M, solids processing, laboratory, etc.) as well as individual process and overall treatment plant performance (removal/reduction of TOC, color, turbidity, taste and odor, etc.). This task identified any shortcomings of the DLTWTF as benchmarked against other treatment plants and influenced the determination of the selected treatment alternative.
Alternatives Development, Analysis, and Ranking
Based on the results and findings of the situational analysis and benchmarking study, alternative treatment technologies and scenarios were developed, analyzed, and ranked. Each alternative was assessed for its advantages and disadvantages, costs, and overall
viability in order to optimize and/or replace the enhanced coagulation (EC) treatment process and solids handling processes at the DLTWTF. Each alternative was analyzed and ranked to determine the most feasible alternative that provides equal or improved finished water quality, while reducing operating and treatment costs.
As a result of this evaluation, piloting of one of the proposed alternative treatment processes (MIEX) was conducted from October 2017 to April 2018 as supplemental research and quantification of benefits and risks so that a final recommendation could be made in this master plan. The results of piloting are further detailed in the Pilot Plant Study Report by Carollo Engineers, Inc. dated June 2018.
Capital Improvement Plan Cost Development
Capital costs were determined for each CIP line item and project. This included direct and indirect costs, including but not limited to materials, labor, installation, contractor overhead and profit, and contingency. They were developed in accordance with a Class IV opinion of probable cost of construction as defined by the Association of Advancement for Cost Engineering (AACE) in which the expected accuracy range is within +30 percent to -15 percent. Class IV budget estimates are typically prepared for master planning and based on preliminary process flow diagrams, main process systems, plant schematic layouts, and major equipment. Recommendations that call for the rehabilitation or replacement of an asset include costs for complete replacement for conservatism within the CIP.
Alternative Delivery and Funding Options
A number of alternative delivery methods were presented including design-bid-build (DBB), construction manager at risk (CMAR), design-build (DB), and progressive design-build (PDB) and are detailed in Chapter 7. Each CIP project noted in this master plan includes an appropriate recommended delivery method based on the scope and size of the project. Funding options for each project are recommended to be discussed internally with City management to determine availability of grants, loans, and other funding opportunities to help subsidize the costs of the CIP projects.
Development of Master Plan
Upon determination of the selected alternative, the individual condition, hydraulic, process, and regulatory needs for the DLTWTF were considered and grouped into projects to provide a prioritized 15-year CIP. Projects were prioritized based on needs found in previously mentioned evaluations, in addition to considering construction sequencing, minimizing disruptions in operating the DLTWTF, maintaining balanced expenditures year to year, considering alternative funding and delivery options, and developing construction packages for projects with similar scopes and in similar process areas of the DLTWTF.
DESCRIPTION OF EXISTING FACILITIES
The main goal of the DLTWTF is to provide safe drinking water while removing the vast majority of total organic carbon (TOC) and color in order to reduce disinfection by-product (DBP) formation, improve the aesthetic quality of the water by eliminating color, and reduce taste and odor causing compounds.
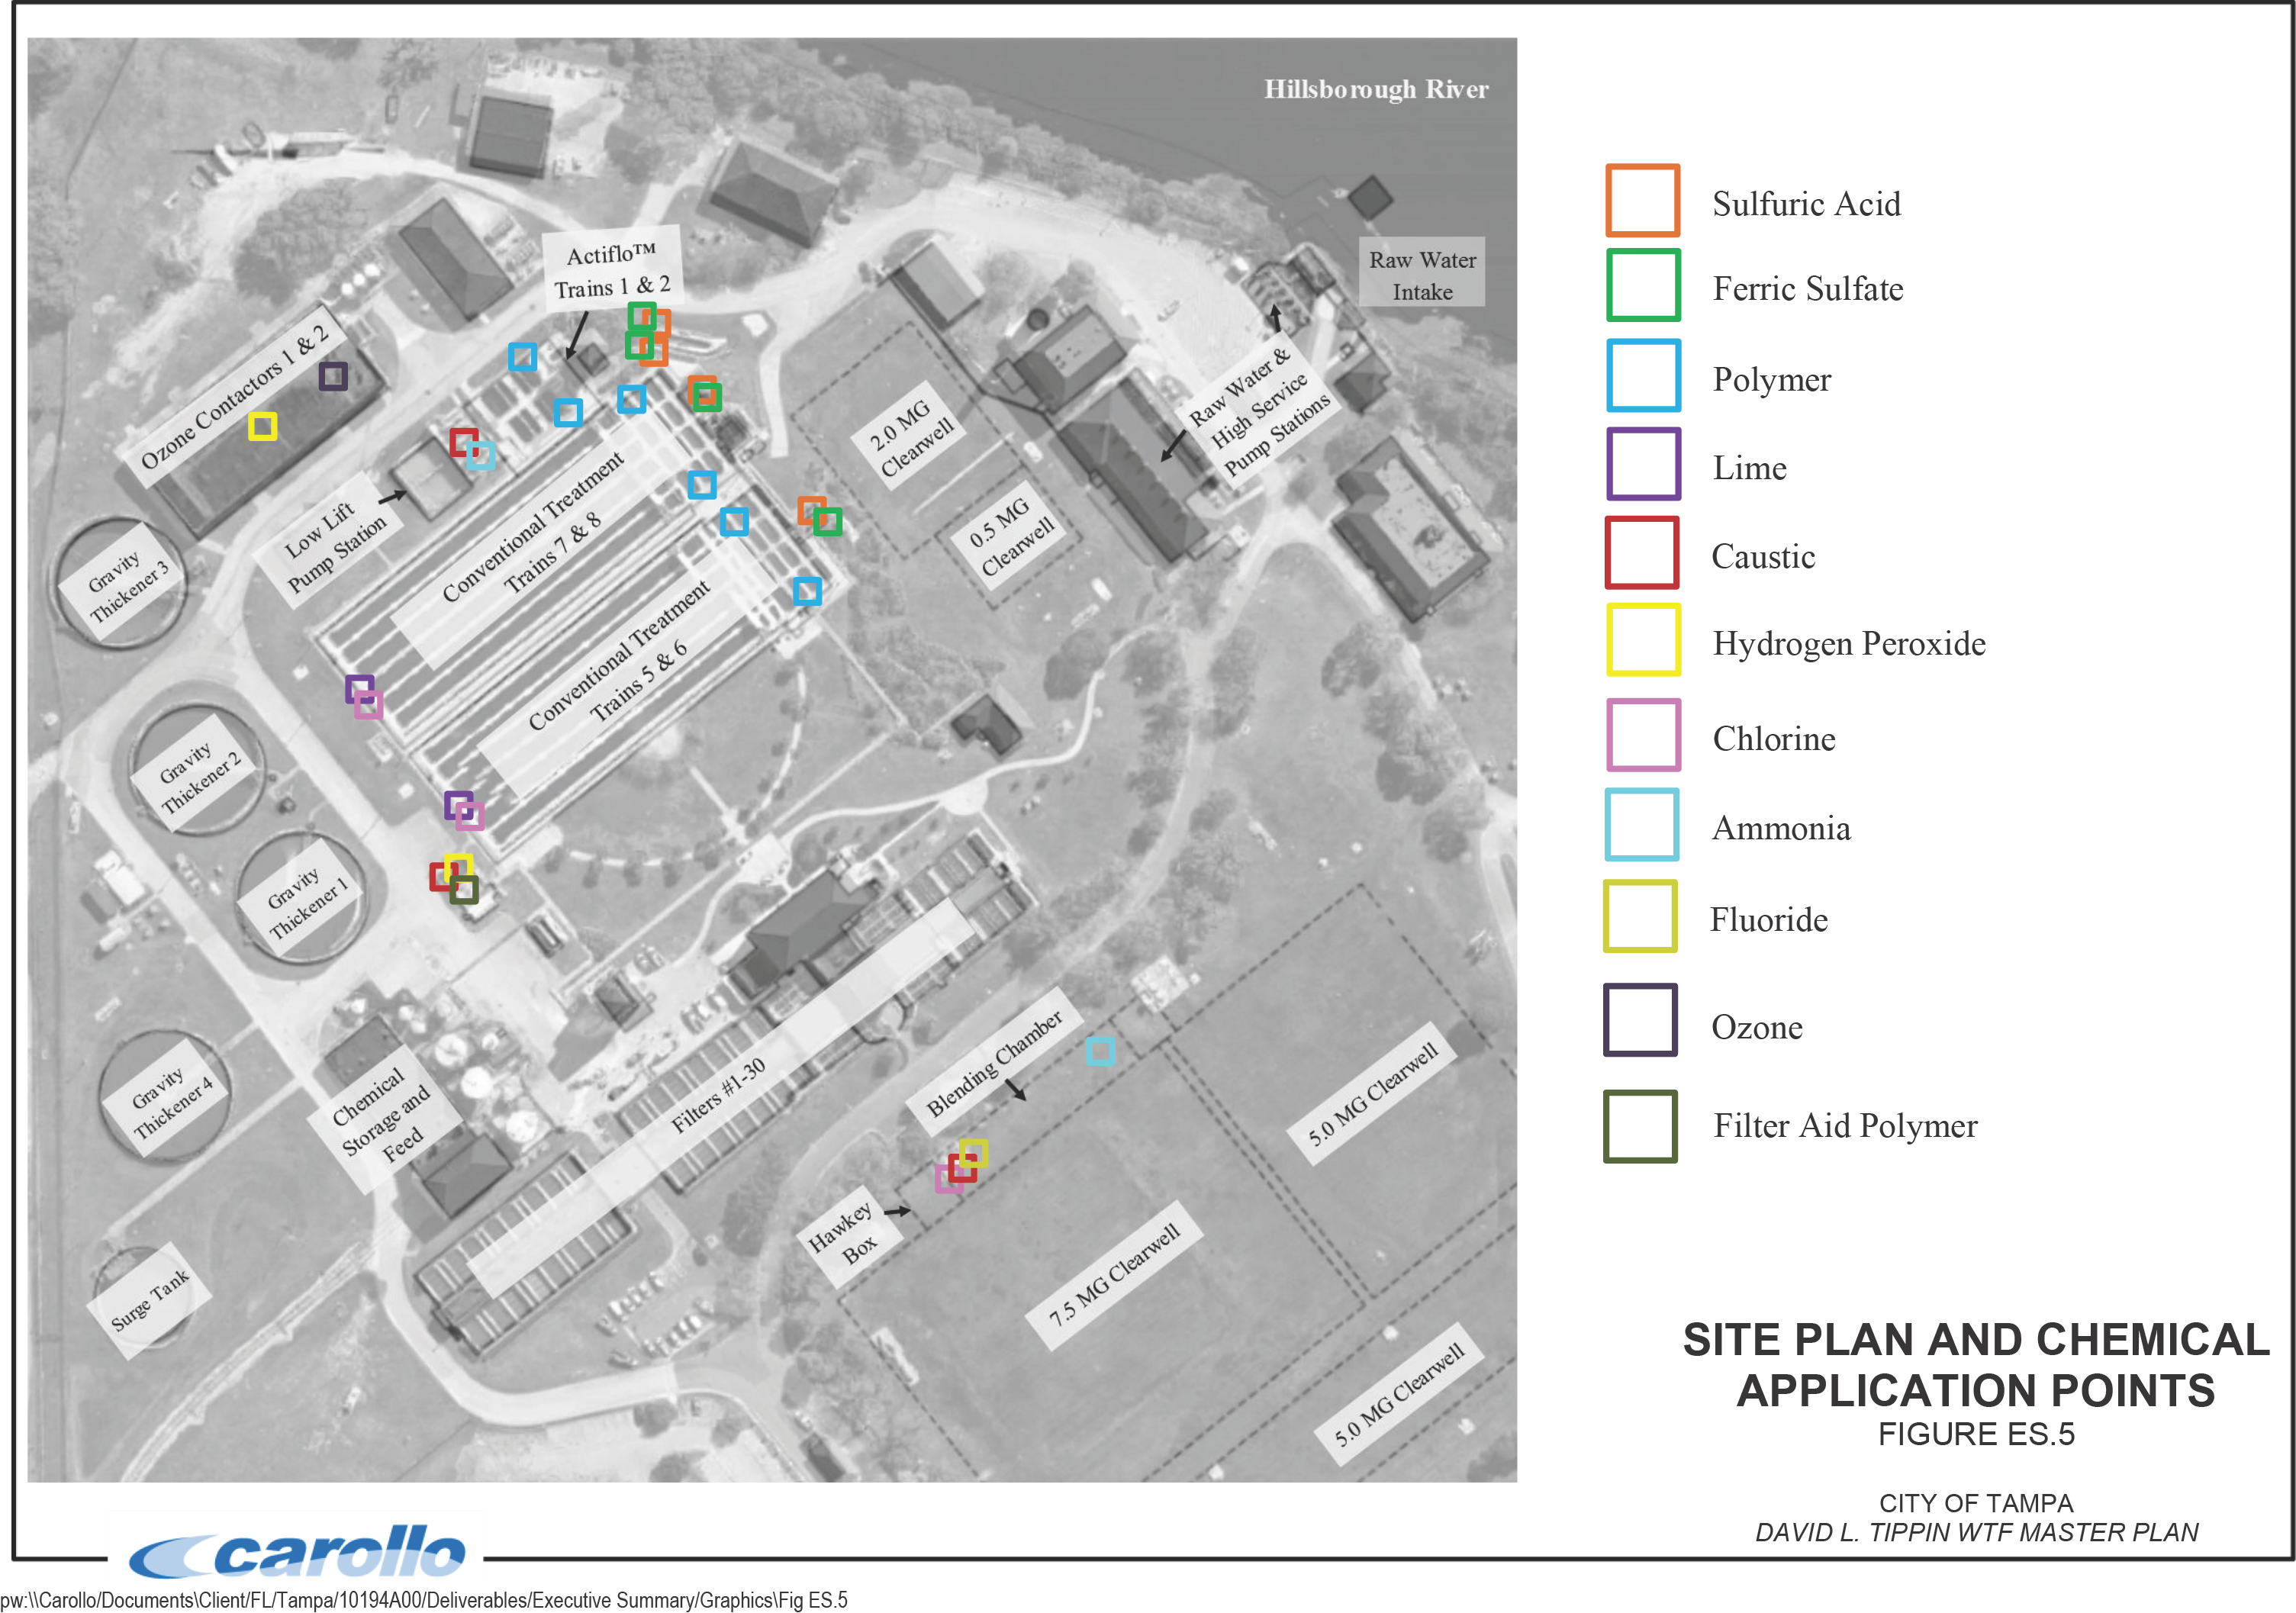
Water withdrawn from the Hillsborough River is screened through a grass bar rack followed by mechanical screens to remove finer debris. The raw water is then pumped to the DLTWTF's four conventional treatment trains: Trains 5, 6, 7, and 8 (Trains 1, 2, 3, and 4 have been partially demolished and are no longer in service). Each train includes coagulation, flocculation, and sedimentation. Together, these trains receive approximately 70 to 80 percent of the total plant flow. The remaining flow is treated through the Actiflo™ treatment Trains 1 and 2. Both systems (conventional and Actiflo™) use ferric sulfate as a coagulant and sulfuric acid for pH adjustment down to 4.5. Coagulant dosages can be up to 200 mg/L for both systems depending on time of year and raw water quality (TOC and color).
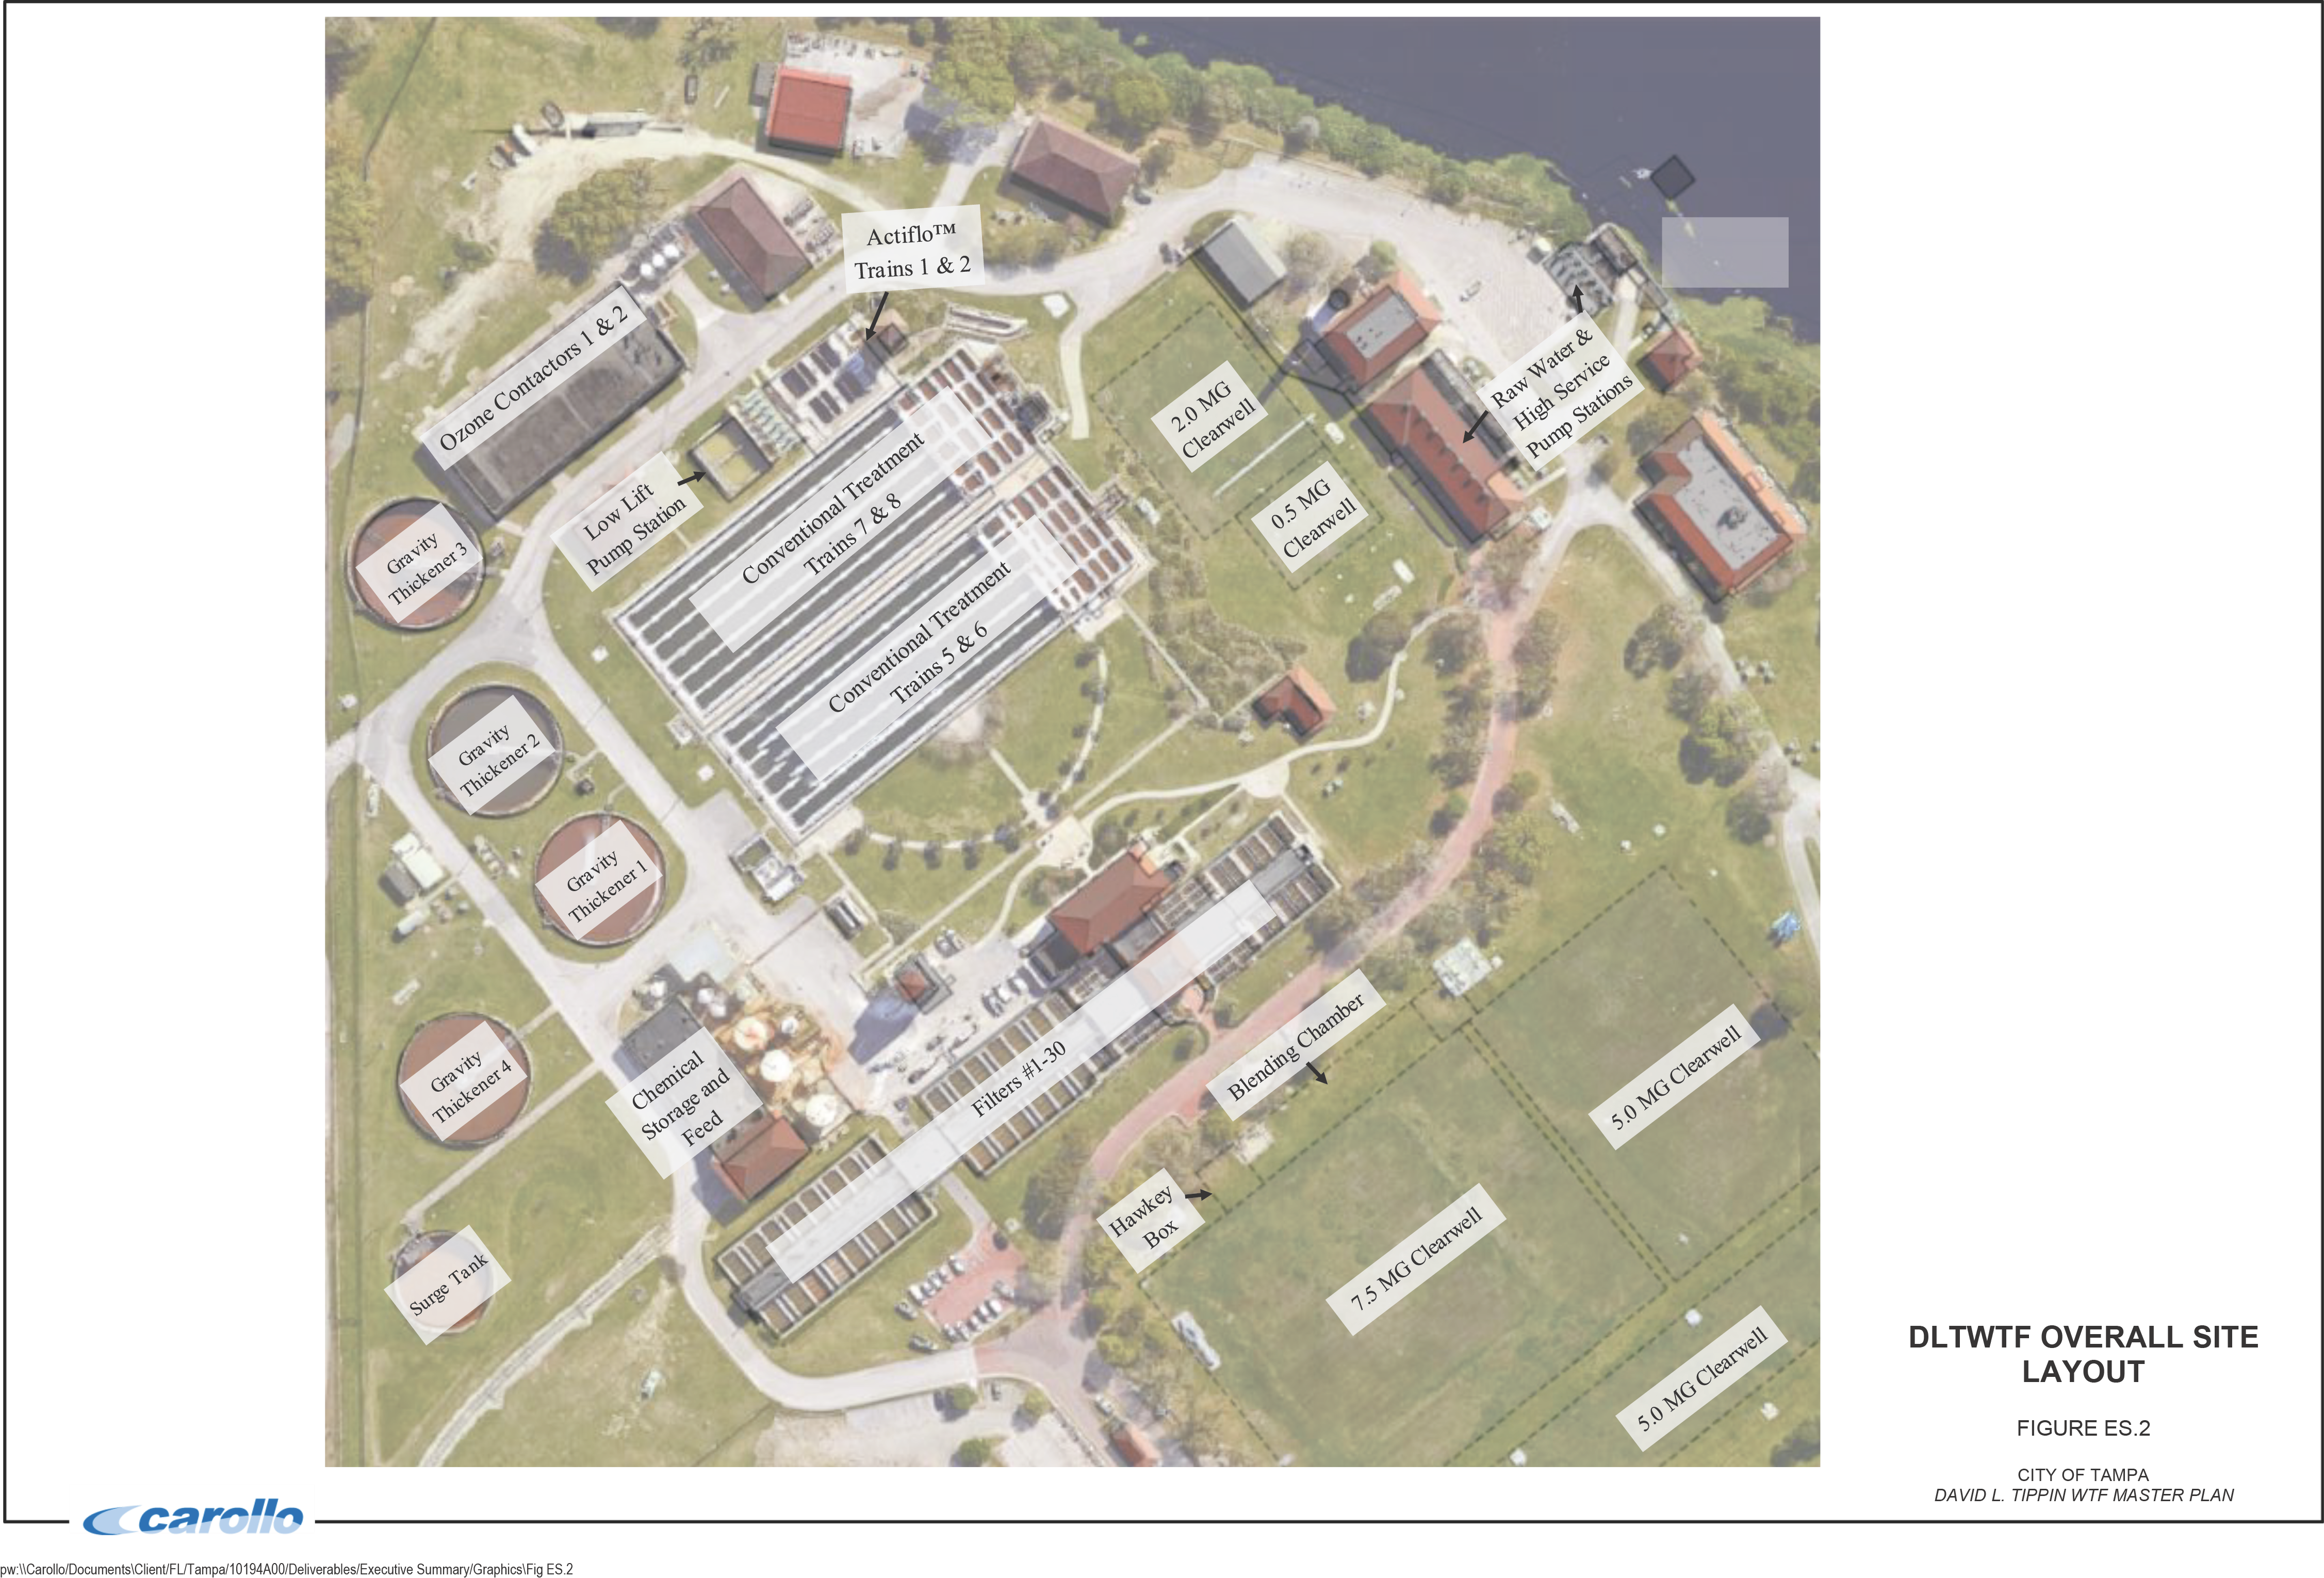
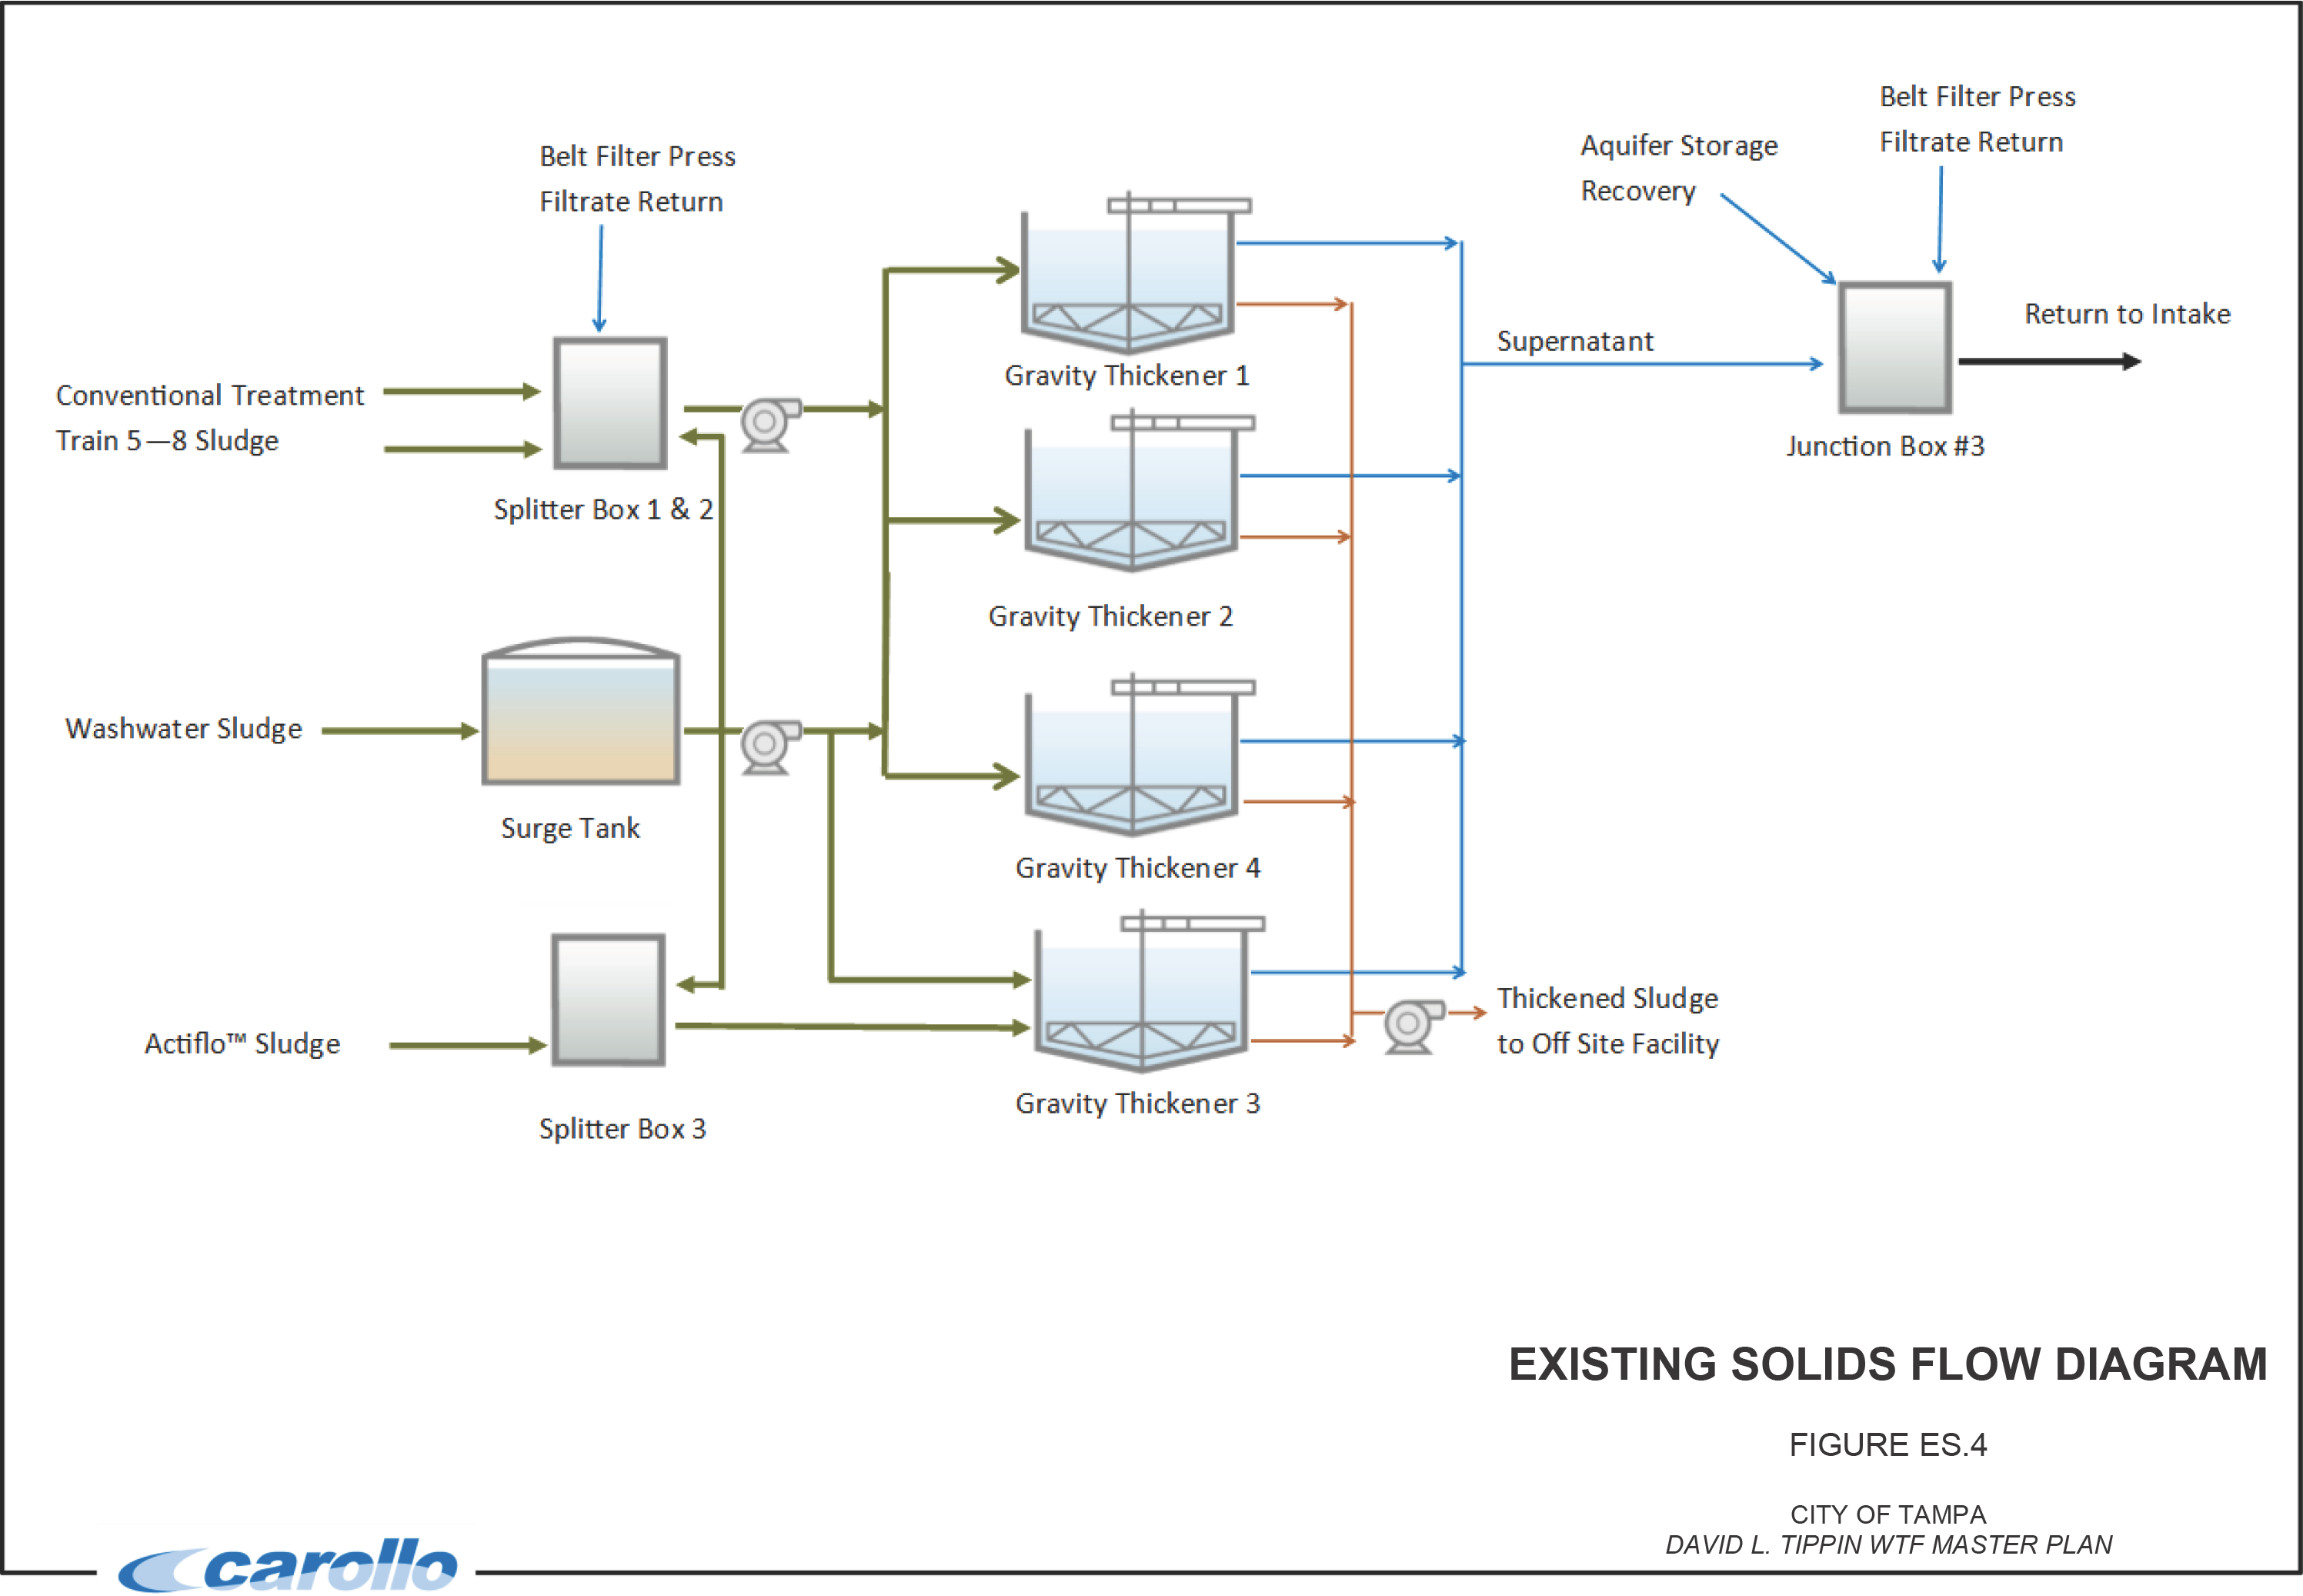
After sedimentation, lime is added to the conventional treatment trains at the combined effluent flume for pH adjustment. Additional pH adjustment occurs at the low lift intermediate pump station before ozonation using caustic soda when the target pH (6.3 to 7.0) cannot be achieved using lime alone. The flow is then directed to the ozonation process for primary disinfection. After primary disinfection, the flow is treated with caustic soda to achieve a pH of between 6.5 and 7.3 and then conveyed to the biological activated filtration (BAF) process, which consists of 30 gravity filters that utilize sand and granular activated carbon (GAC) media. The water is then treated with chlorine and ammonia before the clearwells to form chloramines for secondary disinfection. The finished water is stored in the clearwells before being sent into the distribution system. The sludge from the treatment trains (both conventional and Actiflo™) and filter waste washwater is thickened on-site. The on-site system consists of a surge tank, four gravity thickeners, two splitter boxes, and two sludge pumping stations. The supernatant from the thickeners is routed back to the head of the plant, while the thickened residuals are sent off-site for further processing and dewatering.
Figure ES.2 shows the overall site layout, and Figure ES.3 shows the process flow diagram for the DLTWTF. Figure ES.4 shows the solids process flow diagram for the DLTWTF. Figure ES.5 shows the existing chemical application points.

RAW AND FINISHED WATER QUALITY
Raw Water Quality and Characteristics
Typically, the raw water is provided by the Hillsborough River during average and high rainfall seasons, whereas the ASR well supplements flow during the dry season. Table ES.1 shows the average raw water quality data for the DLTWTF. Additional water quality parameters are included in the introduction of this Master Plan.
| Parameter | Units(4) | Value (Max/Min/Avg) |
|---|---|---|
| Alkalinity(1) | mg/L as CaCO3 | 136 / 56 /101 |
| Calcium Hardness(1) | mg/L | 141 / 70 / 117 |
| Calcium (dissolved)(1) | mg/L | 56 / 26 / 39 |
| pH(1) | units | 7.34 / 6.18 / 6.82 |
| Temperature(1) | degrees Celsius | 28.5 / 15.9 / 23.7 |
| Turbidity(2) | NTU | 2.26 / 1.19 / 1.62 |
| Total Suspended Solids(1) | ppm | 4 / <1 / 1.83 |
| Total Organic Carbon(1) | mg/L | 17.8 / 5.6 / 12.1 |
| Color (true)(1) | color units | 174 / 36.3 / 93.0 |
| Taste and Odor (Geosmin) (3) | ppb | 183 / 1.50 / 25.6 |
| Taste and Odor Methyl-Isoborneol (MIB) (3) | ppb | 53.1 / <1 / 17.6 |
Notes:
- (1) Yearly average in 2015, data provided by the City.
- (2) Yearly average in 2014, data provided by the City with no turbidity data for 2015.
- (3) Average March 2015 - June 2015, data provided by the City.
- (4) Units for most parameters were assumed since data provided by the City did not include units of measurement. Assumed units should be confirmed.
Notes and observations regarding the raw water quality are as follows:
- TOC concentration ranged from 5.1 to 20.0 mg/L in 2015 dependent on seasonal variations, where higher concentrations are experienced in the rainy months.
- Turbidity values vary seasonally but are considered low.
- Taste and odor compounds are typically lower than the odor detection threshold of 10 ng/L of MIB and Geosmin.
Finished Water Quality and Demand Considerations
The DLTWTF's current treatment processes and operations produce high quality water with key finished water quality parameters shown in Table ES.2.
| Parameter | Units | Value (Max/Min/Avg) |
|---|---|---|
| Alkalinity(2) | mg/L | 106 / 46 / 76.9 |
| Calcium Hardness(2) | mg/L | 206 / 111 / 171.5 |
| Calcium (dissolved) | mg/L | 82 / 49 / 64 |
| pH(2) | units | 7.83 / 7.65 / 7.71 |
| Turbidity(4) | NTU | 0.06 / 0.04 / 0.05 |
| Total Suspended Solids(1) | mg/L | <1 |
| Total Organic Carbon(2) | mg/L | 3.55 / 1.50 / 2.42 |
| Color (true)(2) | color units | 3.16 / 2.90 / 2.99 |
| Taste and Odor (Geosmin)(3) | ng/L | 18.2 / <1.00 / 1.99 |
| Taste and Odor (MIB)(3) | ng/L | 4.00 / <1.00 / 1.55 |
| Langelier Saturation Index (LSI) | - | 0.09 |
| Calcium Carbonate Precipitation Potential (CCPP) | mg/L as CaCO3 | 1.09 |
- (1) From the City's 2015 Water Quality Report.
- (2) Average 2015 data provided by City.
- (3) Average in March 2016 - June 2016.
- (4) Average 2014 data provided by City.
The City's finished water goals used to benchmark the performance of the plant and individual processes are shown on Table ES.3. The intent was to maintain or improve the finished water quality through the efforts of the alternatives evaluation (Chapter 5) while considering existing process deficiencies (Chapter 3).
| Parameter | Units | Value (Min - Max) |
|---|---|---|
| pH | units | 7.80 - 8.00 |
| Turbidity | NTU | 0.01 - 0.08 |
| Total Organic Carbon | mg/L | 1.00 - 3.00 |
| Free Ammonia | ppm | 0.10 - 0.18 |
| Fluoride | mg/L | 0.65 - 0.75 |
| Chlorine Residual | ppm | 4.25 - 4.75 |
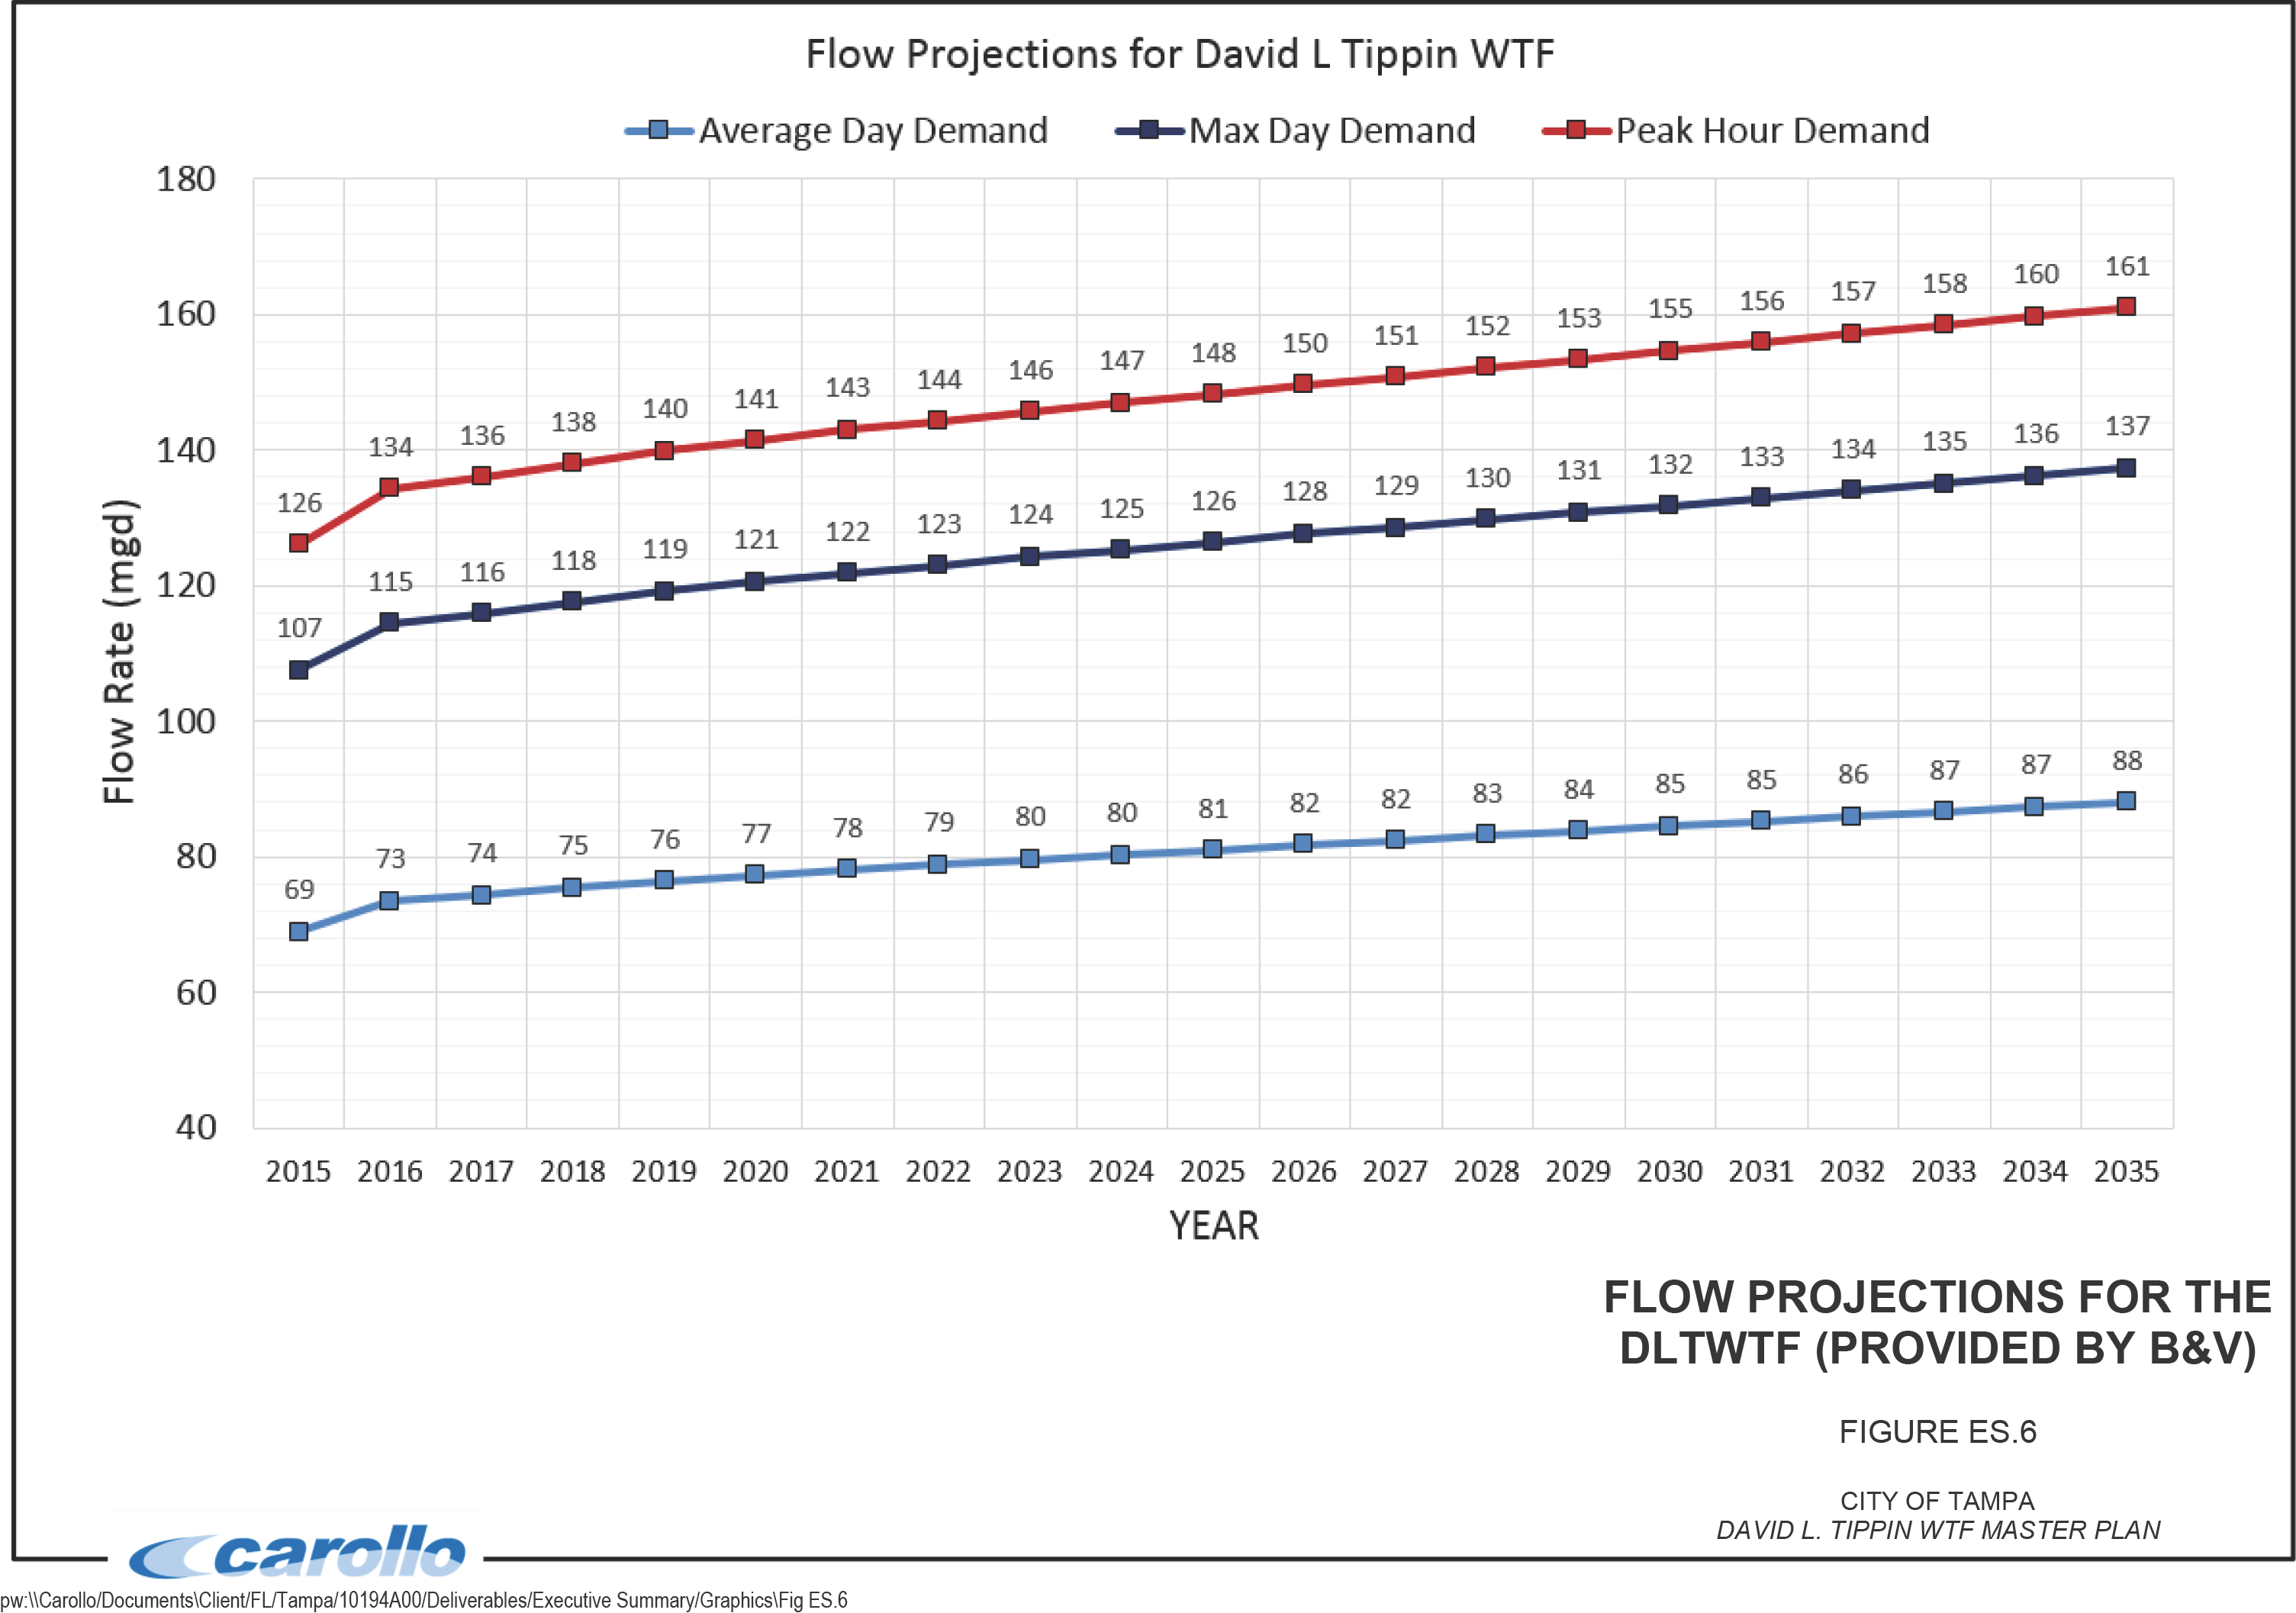
During the duration of this master plan development, Black and Veatch (B&V), as a part of their Transmission and Distribution System Master Plan work for the City, determined that the DLTWTF will need to be capable of meeting a max day demand of 134 mgd by 2032 as shown in Figure ES.6. These results indicate the need to expand the DLTWTF to a process capacity of 140 mgd in the near future in order to meet consumer and in-plant water demands assuming 96 percent efficiency (the DLTWTF has operated between 94 to 96 percent efficiency historically).
In addition to the required future plant demand, the DLTWTF may be required to process and treat up to 50 mgd of alternative water supply as part of the Tampa Augmentation Project (TAP). The current plan is for the wastewater plant effluent to be shallow well injected upstream of the reservoir, where it is then allowed to percolate (thereby receiving additional treatment), and then be recovered from a more surficial aquifer and introduced into the DLTWTF's raw water source as indirect potable reuse (IPR). However, there is a potential that at some point the reclaimed water pipeline could be routed up to the DLTWTF site, resulting in a future direct potable reuse (DPR) connection that would bypass the aquifer injection and recovery steps described above. These considerations were taken into account during the development and evaluation of alternatives in Chapter 5.
REGULATORY EVALUATION SUMMARY
The regulatory evaluation provided a review of the current and anticipated water quality regulations that may impact selection of treatment technologies for the plant optimization and expansion as part of the comprehensive master plan. While focused primarily on the 15-year planning horizon, many of the regulations discussed and incorporated into the planning effort address (as a matter of due diligence) potential regulatory drivers/impacts that may occur beyond 15 years. Review of current regulations and data show the DLTWTF to be in compliance with existing regulations.
In summary, it is anticipated that a number of new contaminants and changes to existing regulations will be forthcoming that may impact DLTWTF, including:
- Strontium
- Perchlorate
- Nitrosamines
- PFOA/PFOS - Perfluorooctanoic Acid (PFOA) and Perfluorooctanesulfonic (PFOS) Acid
- Cyanotoxins
- Fluoride
- Hexavalent Chromium (CR-6)
- TOrCs
Major recommendations included the continued or initiation of monitoring of the containment levels at the DLTWTF in addition to monitoring the regulatory developments. Impacts of the water quality changes being evaluated in the concurrent Tampa Augmentation Project (TAP) should also be considered when monitoring and bench testing is conducted for these parameters. A detailed description of each of the above contaminants and their status regarding future regulations are included in Chapter 1.
FACILITIES CONDITION ASSESSMENT SUMMARY
The facilities condition assessment included a visual inspection of the DLTWTF to inventory the aboveground assets and their current condition in order to assist in the development of the master plan. The assessment was recorded in the Water Research Foundation's Water Infrastructure Manager Software database, using the similar nomenclature and terminology already in use at the plant. Upon finalization of the master plan and further refinement of the asset data, the City may be able to integrate the database into its own computerized maintenance management system utilizing the Access database created by the software.
This assessment included, but was not limited to, structures (basins, buildings, structural components of mechanical equipment), electrical components (motor control centers, variable frequency drives, power systems), mechanical equipment, aboveground piping, pump systems, chemical systems, and assets that are valued over $5,000 or perform a critical function. Items not included in this assessment were instrumentation and controls (flow meters, sensors, SCADA, etc.), small sample pumps, piping and valves less than 6 inches in diameter, and buried/inaccessible piping, structures, or mechanical equipment.
Despite the variation of asset age plant wide, Carollo found the DLTWTF to be in overall fair condition when considering equipment, structures, and electrical systems. The DLTWTF is
very well maintained, which is why asset replacement was determined based on the condition and criticality, not on age alone. Asset replacement timing was based on the calculated EvRUL and calculated risk, which is a function of both asset condition and criticality. Criticality was determined based on an asset's impact on treatment, plant capacity, plant reliability, safety, and meeting the City's established level of service if it were to partially or completely fail.
Critical and major cost items needing replacement as a result of this condition assessment included:
- Intake bar rack and grass rake system
- Raw water pump station (Pumps #1-9)
- Conventional sludge collection system (traveling bridge)
- Ozone generation systems and contactors (generators, power supply units)
- Ferric sulfate tank and piping
- Gravity thickeners structural members
- Filtered water flume and filter gallery
- High service pump stations (Pumps #1-6)
- 240V Transformers
- Chemical Building electrical
- Old Raw Water Pump Building structure, electrical and lighting
- Raw Water Pump switchgear metal enclosure structure and electrical
- Administration and Filter Gallery Building electrical power and lightning panel boards
Detailed scopes for repair or replacement of these assets are included in Chapter 2. Additionally, Appendix A (provided electronically) details the complete list of asset condition scores, criticality scores, EvRULs, and calculated risks. Appendix B (also provided electronically) contains all the photos taken during the assessment, and Appendix C contains the electronic database generated by the software previously mentioned. The scopes of these items are captured in the 15-year CIP in their respective and appropriate projects.
HYDRAULIC EVALUATION SUMMARY
The hydraulic evaluation included development of the existing DLTWTF's hydraulic profile at flows of 80, 120, and 140 mgd, to determine bottlenecks that hinder facility optimization and/or expansion. Additionally, a field survey to verify water surface and top of concrete
Elevations was conducted. Indications from the hydraulic profile model and discussions with the City and plant staff indicated a number of hydraulic concerns plant-wide including:
- Uneven flow splitting to filters
- Pressurization of the filtered water flume
- Pressurization of the blend chamber
- Overflow of the Hawkey box (120 mgd condition)
- Overflow of the pre-filter junction box (also known as the settled water junction box) (140 mgd condition)
- Overflow of Trains 5 and 6 if the low lift pump station level is not low (140 mgd condition)
- Sludge accumulation in line feeding GT 3 from Actiflo™ system
- Ability to only use GT 3 for Actiflo™ due to overflow of Splitter Box 1/2
- Overflow of Junction Box 4 (when ASR, supernatant, and stormwater flows are high)
Figures ES.7 and ES.8 show the hydraulic profile at 140 mgd to illustrate these issues. Recommendations to correct these hydraulic bottlenecks and issues are detailed in Chapters 4 and 5 and intend to bring the DLTWTF hydraulic capacity to 140 mgd for future flows. Additionally, improvement with filter performance may be seen as a result of implementing these recommendations. The scopes of these items are captured in the 15-year CIP in their respective and appropriate projects.
PROCESS EVALUATION SUMMARY
The process evaluation included assessment of the existing unit operations and processes for the DLTWTF to determine the current process capacity. The evaluation found opportunities for optimization, regulatory compliance, and expansion. Specific treatment objectives and water quality parameters were assessed including, but not limited to, TOC, color, pH, iron, and turbidity throughout the DLTWTF. Additionally, limited bench scale testing was completed by City staff and Carollo, with additional testing planned by Carollo during times of high color and TOC (rainy season). This was conducted in conjunction with efforts to evaluate alternative treatment options and/or improve treatment using the same fundamental processes now employed.
The evaluation included a review of the Ten States Standards as presented by the Great Lakes-Upper Mississippi River Board of State and Provincial Public Health and Environmental Managers (GLUMRB) Water Supply Committee and how the standards compared against existing process performance and design criteria. In addition to considering these standards, industry standards and Carollo's experience in process design were considered plant-wide.
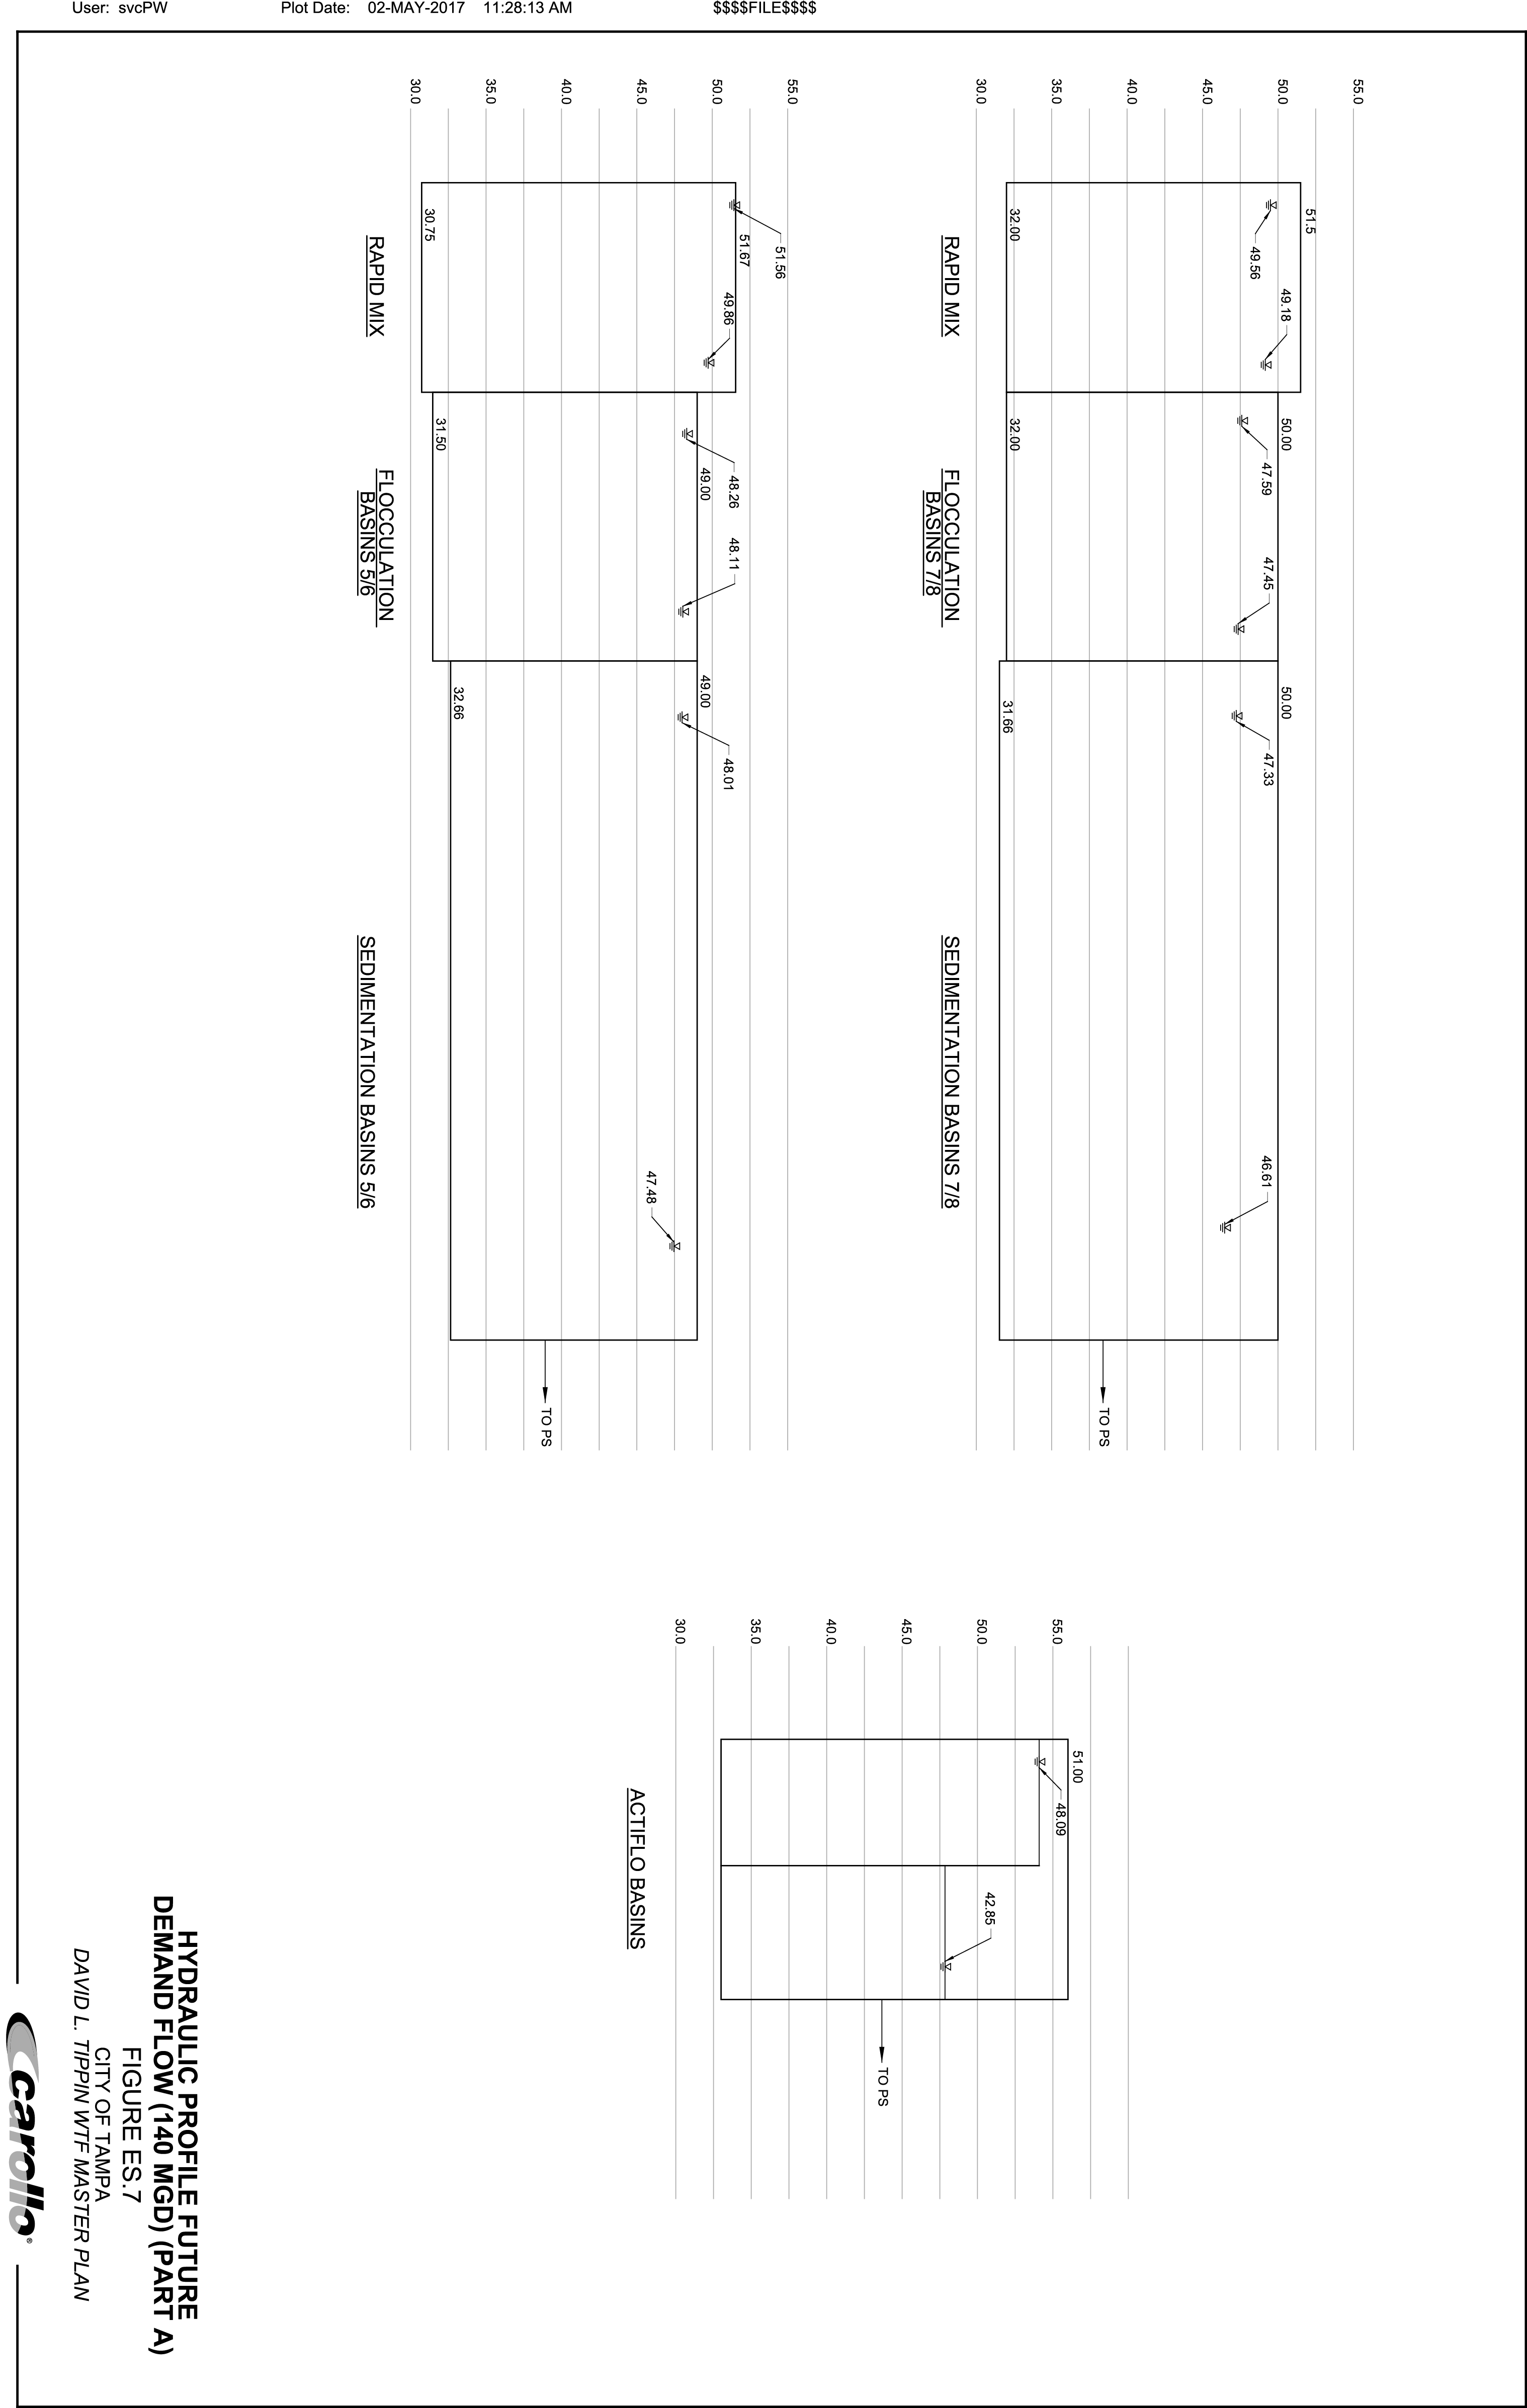
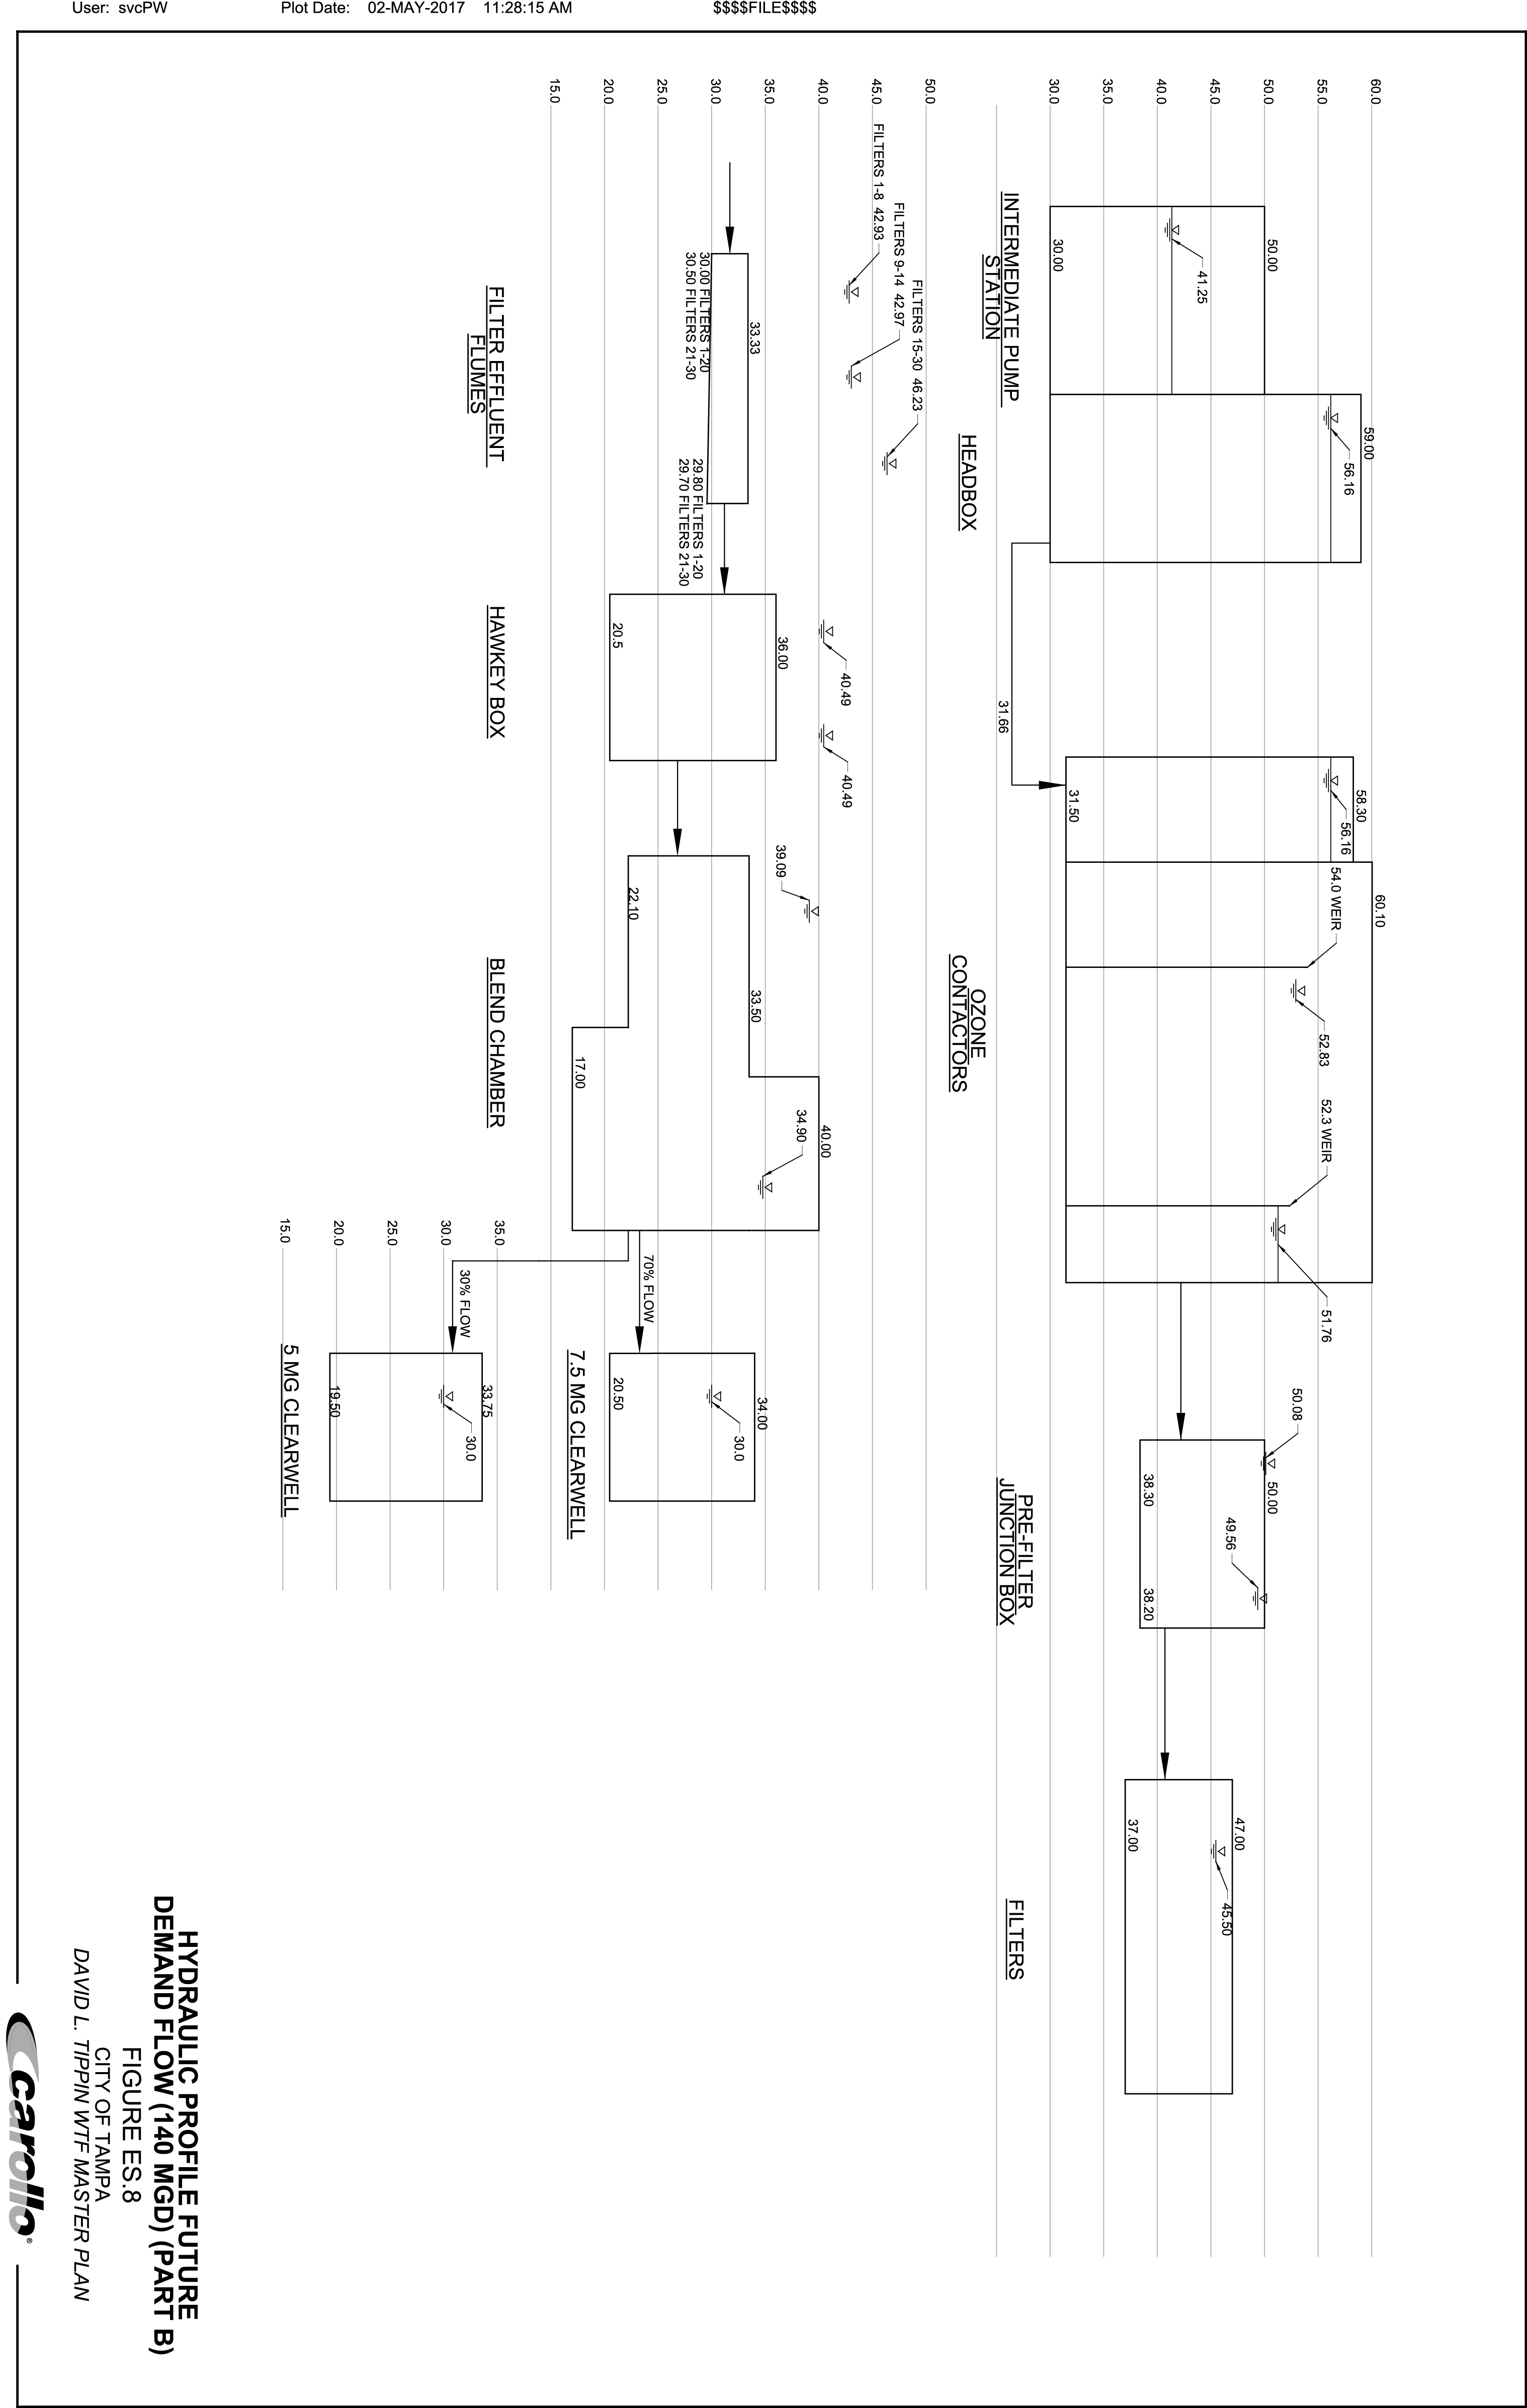
There were a number of process issues found regarding the DLTWTF's existing conventional system (Trains 5 - 8), and the majority of these issues were to be addressed by the chosen alternative as detailed in Chapter 5. However, there were also a number of process issues requiring improvement that were separate from the process alternatives as follows:
- Onsite Sludge Handling
- Inconsistent sludges between GTs
- TOC desorption due to pH differences in sludges
- Possible inability to meet future demands
- Ozone Generation and Production System
- Inability to meet existing and future production rate demands
- Chemical Systems
- Required expansion to meet 15 days of storage for ammonia, sulfuric acid, lime, polymer, and hydrogen peroxide systems (assuming chemical dosing strategy does not change)
- Calcium Carbonate Precipitation and Deposition issues downstream of conventional system
- Possible hydraulic issues due to deposition
- Filtration system and performance issues due to deposition
- Filtration System
- Short run times and low available head loss
- Non-ideal filter geometry dimensions
- Unmatched media and non-fluidization of media bed during backwash events
- Filter to waste cross connection issue
- Inability to meet future demands
Recommendations to correct these process issues are detailed in Chapter 3, and alternative treatment options to correct the conventional system's deficiencies and expand the DLTWTF to treat and process 140 mgd are included in Chapter 5 (the alternatives evaluation). The scopes of these items are captured in the 15-year CIP in their respective and appropriate projects.
BENCHMARKING EVALUATION SUMMARY
The benchmarking evaluation was performed to compare operations and performance of the DLTWTF to utilities with similarly sized plants with similar complexity, process systems, and raw water quality.
In terms of water quality, DLTWTF is characterized with TOC, color, and turbidity levels that are comparable to corresponding levels seen by other similar plants benchmarked in this study, especially the surface water treatment plants in Florida. Among these plants, the DLTWTF demonstrated the highest relative TOC removal; i.e., 80 percent versus 60 to 75 percent demonstrated by the other plants. However, other plants benchmarked reported that they do not target an absolute TOC level in the finished water. Rather, TOC removal is achieved by these plants based on the regulatory requirements that are in turn based on source water TOC and alkalinity requirements. Color and turbidity removals for DLTWTF were comparable to those of the other benchmarked plants.
In terms of normalized energy, chemical use, and overall O&M cost, the usage and costs associated with DLTWTF are comparable to the usage and costs for other similar plants benchmarked in this study, especially the surface water treatment plants in Florida. DLTWTF overall O&M cost was also found to be comparable or slightly lower than the overall cost for the Palm Beach County WTP (adjusted) that uses the MIEX process.
ALTERNATIVES EVALUATION SUMMARY
For the alternatives evaluation, five alternative options were developed and evaluated to optimize and/or replace the EC treatment process together with their advantages and disadvantages, costs, and overall viability. Consideration was given to future flows of 140 mgd and up to 50 mgd of reclaimed water as part of the TAP.
Viable process alternatives were vetted at a two-day workshop with Carollo and City staff and resulted in the following alternatives and options:
- Alternative 1 - Baseline maintaining existing EC treatment processes (Actiflo™ and Conventional)
- Alternative 1A - includes using the existing conventional trains to treat 60 mgd, retaining the existing 40 mgd of Actiflo™ trains, and installing 40 mgd of new Actiflo™ trains to meet 140 mgd future demands
- Alternative 1B - includes improving the conventional trains to treat 100 mgd and retaining the existing 40 mgd Actiflo™ train
- Alternative 2 - Ion exchange as a pretreatment step to the existing processes
- Alternative 2A - includes fluidized bed ion exchange (i.e. MIEX)
- Alternative 2B - includes fixed bed ion exchange.
- Alternative 3 - Split treatment with micro/ultrafiltration membranes to blend with existing treatment processes.
- Alternative 4 - Micro/ultrafiltration and nanofiltration treatment scheme with biological roughing filters to replace existing treatment processes.
Alternative 4 was determined to be unsuitable due to several disadvantages described in detail in Chapter 5 and therefore was not included in the alternatives analysis and ranking exercise.
The capital, operating, and life cycle costs were developed for each alternative. Table ES.4 summarizes the capital, operating, and 20-year life-cycle costs for each of the five alternatives under consideration. Items common and equivalent for all alternatives were not included in the cost and therefore do not represent the capital costs associated with the CIP budget. The costs shown are for comparative use among alternatives. As shown, Alternative 1B resulted in the lowest calculated 20-year life-cycle costs, where Alternative 3 had the highest.
When comparing longer life-cycles, however, the net present value for Alternatives 1B and 2A get much closer. There is a 10.2 percent difference in Alternatives 1B and 2A over a 20-year life-cycle and no significant difference (2.7 percent) over a 30-year life-cycle. Since much of the equipment is likely to last longer than 20 years, especially at the DLTWTF, an average 30-year equipment life is reasonable. Additionally, there is a possibility that chemical costs could increase more than 3 percent per year over the span of 30 years. Since Alternative 1B relies heavily on chemical usage, increases in costs above 3 percent annually would make Alternative 2A more attractive in regard to life-cycle costs.
| Cost Component | Alternative 1A: New Actiflo™ | Alternative 1B: Expanded Conventional | Alternative 2A: Fluidized Bed IX | Alternative 2B: Fixed Bed IX | Alternative 3: MF/UF Split Treatment |
|---|---|---|---|---|---|
| Capital ($1,000) | $78,600 | $76,700 | $166,200 | $216,600 | $285,100 |
| Amortized O&M ($1,000/yr) | $6,900 | $8,200 | $5,100 | $5,100 | $11,700 |
| 20 Year Life-Cycle Cost (Net Present Value) ($1,000) | $218,400 | $242,900 | $269,000 | $288,500 | $492,300 |
Although cost is an important consideration in determining the final recommendation, it is not the only consideration. The alternatives were also ranked and scored based on critical success factors that were developed with City staff during the project kickoff meeting. These included:
- Optimization or replacement of processes, process controls, and monitoring to provide reduced treatment costs. (6 votes)
- Provide the best water quality possible (including finished water stability), in the most efficient way possible. (5 votes)
- Select alternatives based on cost effectiveness, considering operations and maintenance costs as well as capital costs. (4 votes)
- Optimize operations and improve plant hydraulics to provide maximum (and efficient) utilization of existing facilities (2 votes)
- Maximize reliability and provide suitable redundancy. (2 votes)
- Provide the safest and most secure facility within reasonable costs. (1 vote)
- Meet future regulations. (1 vote)
Table ES.5 shows the pros and cons of each alternative to aid in scoring the alternatives relative to each critical success factor.
| Parameter | 1A | 1B | 2A | 2B | 3 |
|---|---|---|---|---|---|
| Familiar technology | Yes | Yes | No | No | No |
| Reduces treatment costs (chemicals, solids handling) | No | No | Yes | Yes | Yes |
| Uses existing infrastructure | Yes | Yes | No | No | No |
| Meets WQ goals | Yes | Yes | Yes | Yes | Yes |
| Able to treat future TAP water | Yes | Yes | Yes | Yes | Yes |
| Able to treat future TAP water in separate treatment train | No | No | No | No | Yes |
| Chemical system expansion required | Yes | Yes | No | No | No |
| Filter expansion required | Yes | Yes | Yes | Yes | No |
| Reduces infrastructure maintenance from low pH | No | No | Yes | Yes | Yes |
| Produces waste stream requiring DIW | No | No | Yes | Yes | Yes |
| Proven technology | Yes | Yes | Limited | No | Limited |
| Proprietary technology | No | No | Yes | No | No |
The cost evaluation, ranking analysis, pilot study results, and in depth discussions with the City resulted in the recommendation that the City proceed with the implementation of Alternative 2A (improving/expanding the conventional treatment trains and retaining the
existing Actiflo™ treatment trains and implementing a new 140 mgd MIEX pretreatment system). These results are summarized in the Final Pilot Study Report completed by Carollo Engineers, Inc. in June 2018. Water quality and overall process performance for the pilot and full scale systems were very similar, with MIEX at times providing lower finished water TOC concentrations. Considering this, MIEX is a viable and promising treatment option for the DLTWTF. The findings from the pilot study were utilized to update the draft version of this master plan and finalize capital, operating, and life cycle costs previously shown, and the finalized Capital Improvement Plan (CIP). Additionally, the primary disadvantage of proceeding with Alternative 1B over Alternative 2A is the non-monetary consideration of continuing to store and handle strong acids and bases on-site (sulfuric acid, caustic soda, lime, etc.).
Implementation of Alternative 2A will correct the conventional treatment trains' existing limitations and expand the overall plant capacity to 140 mgd in the existing infrastructure, in additional to a new MIEX system as a pre-treatment step. As part of this master plan, additional filters are proposed to allow treatment of the full 140 mgd, though full scale testing after certain hydraulic improvements are made upstream may allow for refinement (reduction) of the number of filters required.
The following modifications are recommended under this alternative:
- Construct a new 140 MIEX system implemented as a pretreatment step to the conventional and Actiflo systems
- Modify the rapid mix basins with a flash mix pump system
- Reconfigure the flocculation basins to a plug flow configuration with three stages of tapered energy flocculation with new flocculators
- Install of plate setters in the sedimentation basins (pending results of full-scale testing)
- Construct 22 new filters (unless hydraulic improvements can demonstrate fewer filters without compromised treatment)
However, it is also recommended that the City include an additional extended (one-year) pilot study with MIEX pretreatment in operation the entire duration. Additionally, mitigation and resolution of the risks identified and presented in the Pilot Plant Study report should be wholly resolved through piloting before the MIEX full scale system is constructed. This pilot would be operated in conjunction with the conceptual engineering design of the full scale MIEX system. As such, it is recommended to fully capture an entire year of data, not only in regard to TOC removal, but more specifically to include:
- Resin condition monitoring (RCM) analysis and organics desorption during the regeneration process throughout the year to understand degradation and decrease in organics removal performance over time.
- VSEP treatment runs multiple times per month to gather additional data to fully understand potential salt savings, in addition to multiple sample set deliveries to the third party vendor for confirmation of viable concrete stream usage.
- Collection of ozone dose and demand data, and bromate data (can be completed at bench scale), and consideration of various bromate control techniques. Testing should include blends of raw water from various DLTWTF supply sources including the reservoir and ASR recovery wells.
- Collection of DBP data to determine the impacts of prechlorination prior to MIEX (can be completed at bench scale)
- Evaluation and mitigation of air entrainment issues associated with the original pilot.
- Operation of the MIEX system at 600 bed volumes throughout the study to determine the impacts on TOC treatment, ozone demand, and filter runs.
- Piloting of the SIX process simultaneously with the MIEX process (for the last 6 months).
Additionally, IXOM should provide a performance guarantee for TOC removal as well as documentation supporting their intent to construct a resin manufacturing facility in the United States.
Without full understanding and mitigation of the identified risks, MIEX cannot be confidently recommended. By conducting additional piloting to confirm risk mitigation approaches in conjunction with the conceptual design, the City and their consultant could better understand the needed customized design of this complex system to fully meet the needs of the DLTWTF while minimizing risks and unknowns.
PRIORITIZED CAPITAL IMPROVEMENT PROGRAM
A total of 16 projects were development the for 15-year CIP. The detailed project scopes are included in Chapter 9. Table ES.6 shows the timing for projects by fiscal year for the 15-year planning horizon. Project costs are included in addition to engineering design and construction service fees. The cumulative expenditures are shown for each year and the total CIP budget is shown as approximately $415 million for the 15-year planning horizon.
Table ES.6 15-Year Project Timeline
David L. Tippin Water Treatment Facility Master Plan
City of Tampa
| Project No. | Project Title | Fiscal Year / Phase | FY 19 | FY 20 | FY 21 | FY 22 | FY 23 | FY 24 | FY 25 | FY 26 | FY 27 | FY 28 | FY 29 | FY 30 | FY 31 | FY 32 | FY 33 | All Years |
|---|---|---|---|---|---|---|---|---|---|---|---|---|---|---|---|---|---|---|
| Yearly Expenditure ($1,000s) | $36,904 | $68,184 | $57,690 | $58,872 | $56,204 | $51,388 | $47,480 | $14,915 | $7,457 | $5,947 | $5,013 | $1,333 | $1,373 | $1,414 | $1,457 | $415,630 | ||
| 1 | On-Site Sodium Hypo Generation | Construction | $5,000 | $6,270 | $11,270 | |||||||||||||
| Engineering Design | $1,001 | $1,001 | ||||||||||||||||
| Construction Services | $300 | $376 | $676 | |||||||||||||||
| 2 | High Service Pump Station Upgrades and Expansion | Construction | $13,000 | $18,000 | $12,800 | $43,800 | ||||||||||||
| Engineering Design | $3,900 | $3,900 | ||||||||||||||||
| Construction Services | $780 | $1,080 | $768 | $2,628 | ||||||||||||||
| 3 | Intake Improvements & Raw Water Pump Station Upgrade | Construction | $4,000 | $11,780 | $15,780 | |||||||||||||
| Engineering Design | $1,420 | $1,420 | ||||||||||||||||
| Construction Services | $240 | $706 | $947 | |||||||||||||||
| 4 | Ozone Improvements 1 | Construction | $12,100 | $12,100 | ||||||||||||||
| Engineering Design | $300 | $701 | $1,001 | |||||||||||||||
| Construction Services | $726 | $726 | ||||||||||||||||
| 5 | Yard Piping Inspection and Improvements | Construction | $2,300 | $2,300 | ||||||||||||||
| Engineering Design | $210 | $210 | ||||||||||||||||
| Construction Services | $138 | $138 | ||||||||||||||||
| 6 | Facility Expansion | Construction | $4,900 | $35,000 | $52,000 | $52,000 | $47,000 | $39,500 | $230,400 | |||||||||
| Engineering Design | $6,000 | $6,000 | $6,000 | $2,700 | $20,700 | |||||||||||||
| Construction Services | 294 | $2,100 | $3,120 | $3,120 | $2,820 | $2,370 | $13,824 | |||||||||||
Table ES.6 15-Year Project Timeline
David L. Tippin Water Treatment Facility Master Plan
City of Tampa
| Project No. | Project Title | Fiscal Year / Description | FY 19 | FY 20 | FY 21 | FY 22 | FY 23 | FY 24 | FY 25 | FY 26 | FY 27 | FY 28 | FY 29 | FY 30 | FY 31 | FY 32 | FY 33 | All Years | |
|---|---|---|---|---|---|---|---|---|---|---|---|---|---|---|---|---|---|---|---|
| Yearly Expenditure ($1,000s) | $36,904 | $68,184 | $57,690 | $58,872 | $56,204 | $51,388 | $47,480 | $14,915 | $7,457 | $5,947 | $5,013 | $1,333 | $1,373 | $1,414 | $1,457 | $415,630 | |||
| 7 | Electrical Transformers Upgrades | Construction | $1,400 | $1,400 | |||||||||||||||
| Engineering Design | $126 | $126 | |||||||||||||||||
| Construction Services | $84 | $84 | |||||||||||||||||
| 8 | Clearwell Expansion | Construction | $3,070 | $9,000 | $12,070 | ||||||||||||||
| Engineering Design | $1,206 | $1,206 | |||||||||||||||||
| Construction Services | $184 | $540 | $724 | ||||||||||||||||
| 9 | Building Improvements 1 | Construction | $392 | $392 | |||||||||||||||
| Engineering Design | $36 | $36 | |||||||||||||||||
| Construction Services | $24 | $24 | |||||||||||||||||
| 10 | Ozone Improvements 2 | Construction | $1,982 | $1,982 | |||||||||||||||
| Engineering Design | $180 | $180 | |||||||||||||||||
| Construction Services | $119 | $119 | |||||||||||||||||
| 11 | Chemical Systems Upgrades | Construction | $1,660 | $1,660 | |||||||||||||||
| Engineering Design | $150 | $150 | |||||||||||||||||
| Construction Services | $100 | $100 | |||||||||||||||||
| 12 | Actiflo System Improvements | Construction | $205 | $205 | |||||||||||||||
| Engineering Design | $19 | $19 | |||||||||||||||||
| Construction Services | $12 | $12 |
Table ES.6
15-Year Project Timeline
David L. Tippin Water Treatment Facility Master Plan
City of Tampa
| Project No. | Project Title | Description | Fiscal Year | FY 19 | FY 20 | FY 21 | FY 22 | FY 23 | FY 24 | FY 25 | FY 26 | FY 27 | FY 28 | FY 29 | FY 30 | FY 31 | FY 32 | FY 33 | All Years | |
|---|---|---|---|---|---|---|---|---|---|---|---|---|---|---|---|---|---|---|---|---|
| Yearly Expenditure ($1,000s) | $415,630 | |||||||||||||||||||
| 13 | Low Lift Pump Station Upgrades | Construction | $5,220 | $5,220 | ||||||||||||||||
| Engineering Design | $468 | $468 | ||||||||||||||||||
| Construction Services | $313 | $313 | ||||||||||||||||||
| 14 | Building Improvements 2 | Construction | $4,000 | $2,040 | $6,040 | |||||||||||||||
| Engineering Design | $450 | $90 | $540 | |||||||||||||||||
| Construction Services | $240 | $122 | $362 | |||||||||||||||||
| 15 | Solids Handling Improvements | Construction | $1,270 | $1,270 | ||||||||||||||||
| Engineering Design | $120 | $120 | ||||||||||||||||||
| Construction Services | $76 | $76 | ||||||||||||||||||
| 16 | General Rehabilitation and Repair | Construction | $900 | $927 | $955 | $983 | $1,013 | $1,043 | $1,075 | $1,107 | $1,140 | $1,174 | $1,210 | $1,246 | $1,283 | $1,322 | $1,361 | $16,739 | ||
| Engineering Design | $36 | $37 | $38 | $39 | $41 | $42 | $43 | $44 | $46 | $47 | $48 | $50 | $51 | $52 | $54 | $670 | ||||
| Construction Services | $27 | $28 | $28 | $30 | $30 | $31 | $32 | $33 | $34 | $35 | $36 | $37 | $39 | $40 | $41 | $502 | ||||
IMPLEMENTATION SCHEDULE
An implementation schedule was developed in order to show the complete works of this master plan in a graphical manner. Figure ES.9 shows the resulting illustration.
The schedule shows the cumulative expenditure for each fiscal year in addition to which projects are implemented each year, the number of project in design, and the number of projects in construction and the cumulative expenditures for the entire CIP. The expected plant capacity by year is shown as well as the max day and average demands to depict periods where water may need to be purchased. As shown, water will only need to be purchased when demands during project construction range between average and max day. Actual plant capacities should be confirmed by the design engineer once construction sequencing is better defined. The project information summary contains project numbers, project titles, start and end dates, the total estimated cost (construction, design fees, and construction services), the key driver(s), and the recommended delivery method for each project.
David L. Tippin Water Treatment Facility Master Plan - Proposed Capital Improvement Plan
| Fiscal Year | 15-Year Implementation Schedule | ||||||||||||||
|---|---|---|---|---|---|---|---|---|---|---|---|---|---|---|---|
| Project Number(s) | 2019 | 2020 | 2021 | 2022 | 2023 | 2024 | 2025 | 2026 | 2027 | 2028 | 2029 | 2030 | 2031 | 2032 | 2033 |
| Project Number(s) | 1,2,3,4,6,16 | 1,2,3,4,5,6,7,16 | 2,6,16 | 6,16 | 6,16 | 6,9,16 | 6,8,16 | 8,10,11,16 | 12,13,16 | 14,16 | 13,14,15,16 | 18 | 18 | 18 | 18 |
| Yearly CIP Expenditure ($1,000,000) | $36.9 | $68.2 | $57.7 | $58.9 | $56.2 | $51.4 | $47.5 | $14.91 | $7.46 | $5.95 | $5.01 | $1.33 | $1.37 | $1.41 | $1.46 |
| No. of Projects in Design | 6 | 5 | 2 | 2 | 1 | 2 | 2 | 3 | 3 | 2 | 3 | 1 | 1 | 1 | 1 |
| No. of Projects in Construction | 3 | 6 | 5 | 3 | 3 | 3 | 3 | 4 | 3 | 3 | 3 | 2 | 1 | 1 | 1 |
| Cumulative CIP Expenditures ($1,000,000) | |||||||||||||||
| Cumulative | $36.90 | $105.09 | $162.78 | $221.65 | $277.85 | $329.24 | $376.72 | $391.64 | $399.09 | $405.04 | $410.05 | $411.39 | $412.76 | $414.17 | $415.63 |

| Project No. | Project Description | Start Date | End Date | Estimated Cost | Key Driver | Delivery Method | ||||||||
|---|---|---|---|---|---|---|---|---|---|---|---|---|---|---|
| 1 | On-Site Sodium Hypo Generation | FY19 | FY20 | $12,947,200 | ①❷❸❹❺ | DB | ||||||||
| 2 | High Service Pump Station Upgrades and Expansion | FY19 | FY21 | $50,328,000 | ①❷❸❹⑤ | PDB | ||||||||
| 3 | Intake Improvements & Raw Water Pump Station Upgrade | FY19 | FY20 | $18,147,000 | ❶❷❸❹❺ | DBB | ||||||||
| 4 | Ozone Improvements 1 | FY19 | FY20 | $13,827,000 | ❶②❸❹❺ | CMAR | ||||||||
| 5 | Yard Piping Inspection and Improvements | FY20 | FY20 | $2,648,000 | ①②❸④⑤ | CMAR | ||||||||
| 6 | Facility Expansion1 | FY19 | FY25 | $264,924,000 | ❶❷❸❹❺ | PDB | ||||||||
| 7 | Electrical Transformers Upgrades | FY20 | FY20 | $1,610,000 | ①②❸④❺ | DBB | ||||||||
| 8 | Clearwell Expansion | FY25 | FY26 | $14,000,000 | ①②③❹❺ | DBB | ||||||||
| 9 | Building Improvements 1 | FY24 | FY24 | $451,520 | ①②❸④⑤ | Hard Bid | ||||||||
| 10 | Ozone Improvements 2 | FY26 | FY26 | $2,280,920 | ①②❸④⑤ | DBB | ||||||||
| 11 | Chemical Systems Upgrades | FY26 | FY26 | $1,909,600 | ①②❸④⑤ | DBB | ||||||||
| 12 | Actiflo System Improvements | FY27 | FY27 | $235,800 | ①②❸④⑤ | DB | ||||||||
| 13 | Low Lift Pump Station Upgrades | FY27 | FY27 | $6,001,200 | ①②❸④⑤ | DBB | ||||||||
| 14 | Building Improvements 2 | FY28 | FY29 | $6,942,400 | ①②❸④⑤ | DBB or DB | ||||||||
| 15 | Solids Handling Improvements | FY29 | FY29 | $1,466,200 | ①②❸④⑤ | DBB | ||||||||
| 16 | General Rehabilitation and Repair | FY19 | FY33 | $17,910,754 | ①②❸④⑤ | DBB/Hard Bid | ||||||||

- Notes: 1. The costs associated with the additional flow of 50 mgd provided by Tampa Augmentation Project for this Facility Expansion project is equivalent to approximately $38,300,000.
INTRODUCTION
The City of Tampa Water Department currently owns and operates the David L. Tippin Water Treatment Facility (DLTWTF), which produced about 75 million gallons per day (mgd) of potable water for its customers (610,000 population; 135,000 service locations) in 2017. The primary source of water for the DLTWTF is the Hillsborough River, while a secondary source is the Tampa Bypass Canal Middle Pool. DLTWTF also uses an aquifer storage and recovery (ASR) system of wells to store treated water in an aquifer during the wet season when river flows are high and recover the water when river flows are low and other supplies are limited. The DLTWTF, under its Water Use Permit (WUP) #20002062.006, is permitted to withdraw an annual average quantity of 82 mgd and a maximum daily quantity of 120 mgd. The City holds an additional WUP for Sulphur Springs, which allows the City to pump up to 5 mgd annual average and 10 mgd peak month from Sulphur Springs to either augment the reservoir during low flow periods or to maintain a minimum flow at the base of the Hillsborough River dam. Water from the Harney Canal is pumped over structure S-161 into the Hillsborough River Reservoir during low flow conditions, with an annual average limit of 20 mgd and a peak month limit of 40 mgd.
The City requested that Carollo prepare a comprehensive Master Plan (MP) including a prioritized capital improvement program (CIP) that optimizes treatment, improves treated water quality, reduces operating costs, and enhances treatment and operations through a carefully planned repair and replacement program. The Master Plan also identifies improvements to accommodate future plant expansions to treat additional flows, including those from alternative water supplies. Below is a summary of the completed work tasks used to develop the Master Plan.
- Task 1 - Situational Analysis:
- Regulatory Evaluation (Chapter 1)
- Facilities Evaluation and Condition Assessment (Chapter 2)
- Process Evaluation (Chapter 3)
- Hydraulic Evaluation (Chapter 4)
- Task 2 - Benchmarking Study (Chapter 6)
- Task 3 - Alternatives Development, Analysis, and Ranking (Chapter 5)
- Pilot Plant Study on MIEX®
Chapters 1 through 6 detail each evaluation and their resulting recommendations. Completion of these tasks and recommendations were then prioritized and scheduled over the 15-year planning horizon (2018 through 2032). Additionally, options for construction sequencing and packaging and alternative delivery methods were considered.
Based on the results and recommendations of Chapter 3 and 5, a pilot plant study was conducted on the MIEX treatment process as a pre-treatment alternative option. This report was finalized and provided to the City in June 2018.
MASTER PLAN ASSESSMENT METHODOLOGY
Situational Analysis
Task 1 for the development of the master plan included a situational analysis that consisted of a regulatory evaluation, process evaluation, hydraulic evaluation, and facilities condition assessment. This approach ensured a comprehensive look at the DLTWTF in order to provide an accurate and complete set of recommendations to satisfy the DLTWTF's needs. The findings and results of these evaluations helped determine the most appropriate alternative treatment technologies to be considered for implementation. The work associated with each evaluation is noted below.
Regulatory Evaluation
This evaluation included a review of current and anticipated water quality regulations to understand impacts to existing treatment processes, laboratory testing requirements, and applicability to alternative treatment processes. A number of drinking water regulations were reviewed including, but not limited to:
- The Safe Drinking Water Act
- National Primary and Secondary Drinking Water Standards
- Microbial and Disinfection Byproducts Rules
- Third Candidate Contaminant List
- Unregulated Contaminant Monitoring Rule 3
- Consumer Confidence Report updates
- Other potential future regulations
Upon review of the regulations, an initial assessment of the existing treatment process and alternative treatment processes for removal of applicable constituents was conducted. These considerations were used in the Alternatives Development Task.
Facilities Condition Assessment
The facilities condition assessment subtask included determination of the status, condition, and functionality of the existing facilities. This included, but was not limited to, structures, electrical components, mechanical equipment, aboveground piping, and assets that are
valued over $5,000 or that perform a critical function. Assets included as a part of this assessment were:
- Structural
- Water bearing structures
- Building superstructures
- Structural components of mechanical equipment
- Mechanical
- Chemical feed and storage systems
- Treatment process and non-process mechanical equipment
- Pumping systems
- Electrical
- Electric power supply and distribution systems (main switchgear, motor control center, transformers, etc.)
- Electrical components of mechanical equipment
- Building electrical systems
- Architectural
- Building superstructures, roofs, lighting, lavatories, HVAC, fire suppression systems, etc.
Items not included in this assessment were instrumentation and controls (flow meters, sensors, supervisory control and data acquisition [SCADA], etc.), small sample pumps, piping and valves less than 6 inches in diameter, and buried/inaccessible piping, structures, or mechanical equipment.
Assets were given a condition score based on their physical condition, functionality, availability of spare parts, and reliability. These considerations and additional notes provided by plant staff were recorded in a software called Water Research Foundation Water Treatment Plant Infrastructure Assessment Manager, which organizes and records information and scores for condition assessments.
Risk was calculated for each asset based on their condition score and criticality. Criticality scores were determined based the consequence of asset failure. Consequences consider ability to meet demands, impact to public health and/or environmental health, and impact on providing clean drinking water. The evaluated remaining useful life (EvRUL) of an asset was also determined based on the condition of the asset and its original useful life. Used in conjunction, the EvRUL and risk helped determine when an asset should be replaced. Over 3,000 assets were consolidated (based on assets with similar function and condition) and organized into 496 lines items with calculated risks and EvRUL.
The results of this evaluation helped influence the timing and grouping of projects for the 15-year CIP.
Hydraulic Evaluation
The existing DLTWTF's hydraulic profile was developed as a part of the hydraulic evaluation at flows of 80, 120, and 140 mgd to determine bottlenecks that hinder facility optimization and/or expansion. Additional tasks completed consisted of a field survey to verify water surface and top of concrete elevations, identification of hydraulic deficiencies and bottlenecks with the DLTWTF, and the development of recommendations for mitigating the identified hydraulic constraints. The intake system, raw water pumps, and raw water piping were not included as a part of this evaluation. The hydraulic profile was developed at the start of the Actiflo™ and conventional rapid mix basins and modeled through the DLTWTF to the clearwells. Additionally, a qualitative assessment of the on-site solids handling system was conducted to note hydraulic deficiencies within the surge tank and gravity thickeners.
The hydraulic evaluation results helped determine the DLTWTF's current capacity and the required improvements to meet future demands.
Process Evaluation
The process evaluation included review and assessment of the existing treatment operations and unit processes employed at the DLTWTF to help determine opportunities for optimization, regulatory compliance, and expansion. Raw water quality, finished water quality, and current water quality goals were considered in addition to existing process performance at 80, 120, and 140 mgd. This evaluation included review of the following systems:
- Conventional Trains 5 through 8
- Actiflo™ Trains 1 and 2
- Ozone System
- Filtration System
- Finished Water Systems
- Chemical Systems
- On-site Solids Handling Systems
The evaluation included a review of the Ten States Standards, as presented by the Great Lakes-Upper Mississippi River Board of State and Provincial Public Health and Environmental Managers (GLUMRB) Water Supply Committee, and how they compared against existing process performance and design criteria. In addition to considering these standards, industry standards and Carollo's experience in process design were considered plant wide.
Results of this evaluation directly influenced the alternative treatment options selected for the Alternatives Development Task (Chapter 5). Some recommendations made as a part of this evaluation, however, were determined to be required regardless of the selected alternative and were noted as such.
Benchmarking
Task 2 included a benchmarking study which involved comparing various criteria associated with the processes and operations at DLTWTF to other treatment plants. There were six treatment plants selected based on similar size, raw water quality, treatment objectives, and/or treatment processes. The compared criteria included cost of operations (power, chemical, operations and maintenance (O&M), solids processing, laboratory, etc.) and individual process and overall treatment plant performance (removal/reduction of total organic carbon (TOC), color, turbidity, taste and odor, etc.).
This task identified any shortcomings of the DLTWTF as benchmarked against other treatment plants and influenced the determination of the selected treatment alternative from Task 3.
Alternatives Development and Ranking
Based on the results and findings of Task 1 and Task 2, alternative treatment technologies and scenarios were developed, analyzed, and ranked. Each alternative was assessed for its advantages and disadvantages, costs, and overall viability in order to optimize and/or replace the enhanced coagulation (EC) treatment process and solids handling processes at the DLTWTF. This included the following:
- Preparation and refinement of candidate technologies in collaboration with the City
- Development of pros and cons for each alternative
- Development of capital, operating, and life-cycle costs for each alternative presented
- Bench scale testing focused on optimizing existing systems and on alternative treatment technologies
Each alternative was analyzed and ranked to determine the most feasible alternative that provides equal or improved finished water quality, while reducing operating and treatment costs.
Cost Development
Capital costs were developed for the CIP and the alternatives evaluation in the same manner. These costs included direct and indirect costs, including but not limited to materials, labor, installation, contractor overhead and profit, and contingency. They were developed in accordance with a Class IV opinion of probable cost of construction as defined by the Association of Advancement for Cost Engineering (AACE) in which the expected
accuracy range is within +30 percent to -15 percent. Class IV budget estimates are typically prepared for master planning and based on preliminary process flow diagrams, main process systems, plant schematic layouts, and major equipment.
Operating and maintenance costs were developed for the alternatives evaluation only and were based on knowledge of the DLTWTF's existing power and chemical costs in addition to annual costs incurred specific to each alternative. It was assumed that chemicals and power costs will increase at a rate of 3 percent per year, while sludge disposal costs will increase at a rate of 6 percent per year due to the reduction in land availability as population in the area grows. Operating costs were evaluated at average annual daily flows for each year based on the B&V flow projections.
Finally, life cycle costs were developed for the alternatives evaluation to determine the 20-year net present value of each alternative for comparison. The operating costs were discounted at a rate of 3 percent to net present value.
Alternative Delivery and Funding Options
A number of alternative delivery methods were presented including design-bid-build (DBB), construction manager at risk (CMAR), design-build (DB), and progressive design-build (PDB) and are detailed in Chapter 7. Each CIP project noted in this master plan includes an appropriate recommended delivery method based on the scope and size of the project. Funding options for each project are recommended to be discussed internally with City management to determine availability of grants, loans, and other funding opportunities to help subsidize the costs of the CIP projects.
Development of Master Plan
Upon determination of the selected alternative, individual condition, hydraulic, process, and regulatory needs for the DLTWTF were considered and grouped into projects to provide a prioritized 15-year CIP. Projects were prioritized based on needs found in previous tasks, in addition to considering construction sequencing, minimizing disruptions in operating the facility, maintaining balanced expenditures year to year, considering alternative funding and delivery options, and development of construction packages for projects with similar scopes of in similar areas of the DLTWTF.
DESCRIPTION OF EXISTING FACILITIES
Originally built in the 1920s, the DLTWTF has since undergone a number of expansions as shown in Figure I.1. The most recent expansion added ozone, Actiflo™, a polymer building, and other processes. The main goal of the DLTWTF is to provide safe drinking water while removing the vast majority of TOC and color in order to reduce disinfection by-product formation (DBPs), improve the aesthetic quality of the water by eliminating color, and reduce taste and odor causing compounds.
Water withdrawn from the Hillsborough River is screened through a grass bar rack (3-inch bar openings) and mechanically cleaned by a grass rake. The mechanical screens downstream of this rack remove finer debris. The raw water is then pumped to the four conventional treatment trains: Trains 5, 6, 7, and 8 (Trains 1, 2, 3, and 4 have been demolished and are no longer in service). Each train includes coagulation, flocculation, and sedimentation. Together, these trains receive approximately 70 to 80 percent of the total plant flow. The current rated capacity of Trains 5 through 8 is 20 mgd each, or 80 mgd total.
The remaining flow is treated through the Actiflo™ treatment Trains 1 and 2. The rated capacity of the two Actiflo™ Trains is 20 mgd each, or 40 mgd total. Both systems (conventional and Actiflo™) use ferric sulfate as a coagulant. Before the Actiflo™ and conventional treatment trains, the raw water pH is adjusted using 93 percent sulfuric acid in order to lower the coagulation pH. The coagulant is dosed in-line just after acid addition and static mixing within the Actiflo™ raw water lines. The conventional system is dosed with coagulant and acid in the rapid mix area of the basins. Coagulant dosages can be up to 180 mg/L for both systems depending on time of year and raw water quality (TOC and color).
In order to maximize the efficiency of the enhanced coagulation process, especially for TOC adsorption, the pH is lowered with sulfuric acid to about 4.5 prior to coagulant addition (coagulant addition depresses the pH even further). This has worked at removing the vast majority of TOC and color through the flocculation/sedimentation processes, but comes at a significant cost stemming from high chemical use, resulting in accelerated wear/corrosion on the exposed surfaces (concrete and equipment), and high volumes of solids/residuals that require processing and disposal.
After sedimentation and before intermediate pumping and ozonation, lime is added to the conventional treatment trains at the combined Trains 5 and 6 and Trains 7 and 8 effluent flumes for incremental pH adjustment. Additional pH adjustment occurs at the low lift intermediate pump station before ozonation using caustic soda when the target pH (6.3 to 7.0) cannot be achieved using lime alone. The flow is then directed to the ozonation process for primary disinfection. After primary disinfection, the flow is treated with caustic soda to achieve a pH of between 6.5 and 7.3 and then conveyed to the biological activated filtration (BAF) process, which consists of 30 gravity filters. The filters' maximum hydraulic loading rate is 3.5 gallons per minute per square foot (gpm/sq ft), and all filters have 12-inches of sand and 22-inches of granular activated carbon (GAC). The water is then dosed with chlorine in the Hawkey Box at the north end of the blending chamber, and ammonia is added at the south end of the blending chamber just before the clearwells to form chloramines for secondary disinfection. The finished water is then stored in the clearwells before being sent into the distribution system.
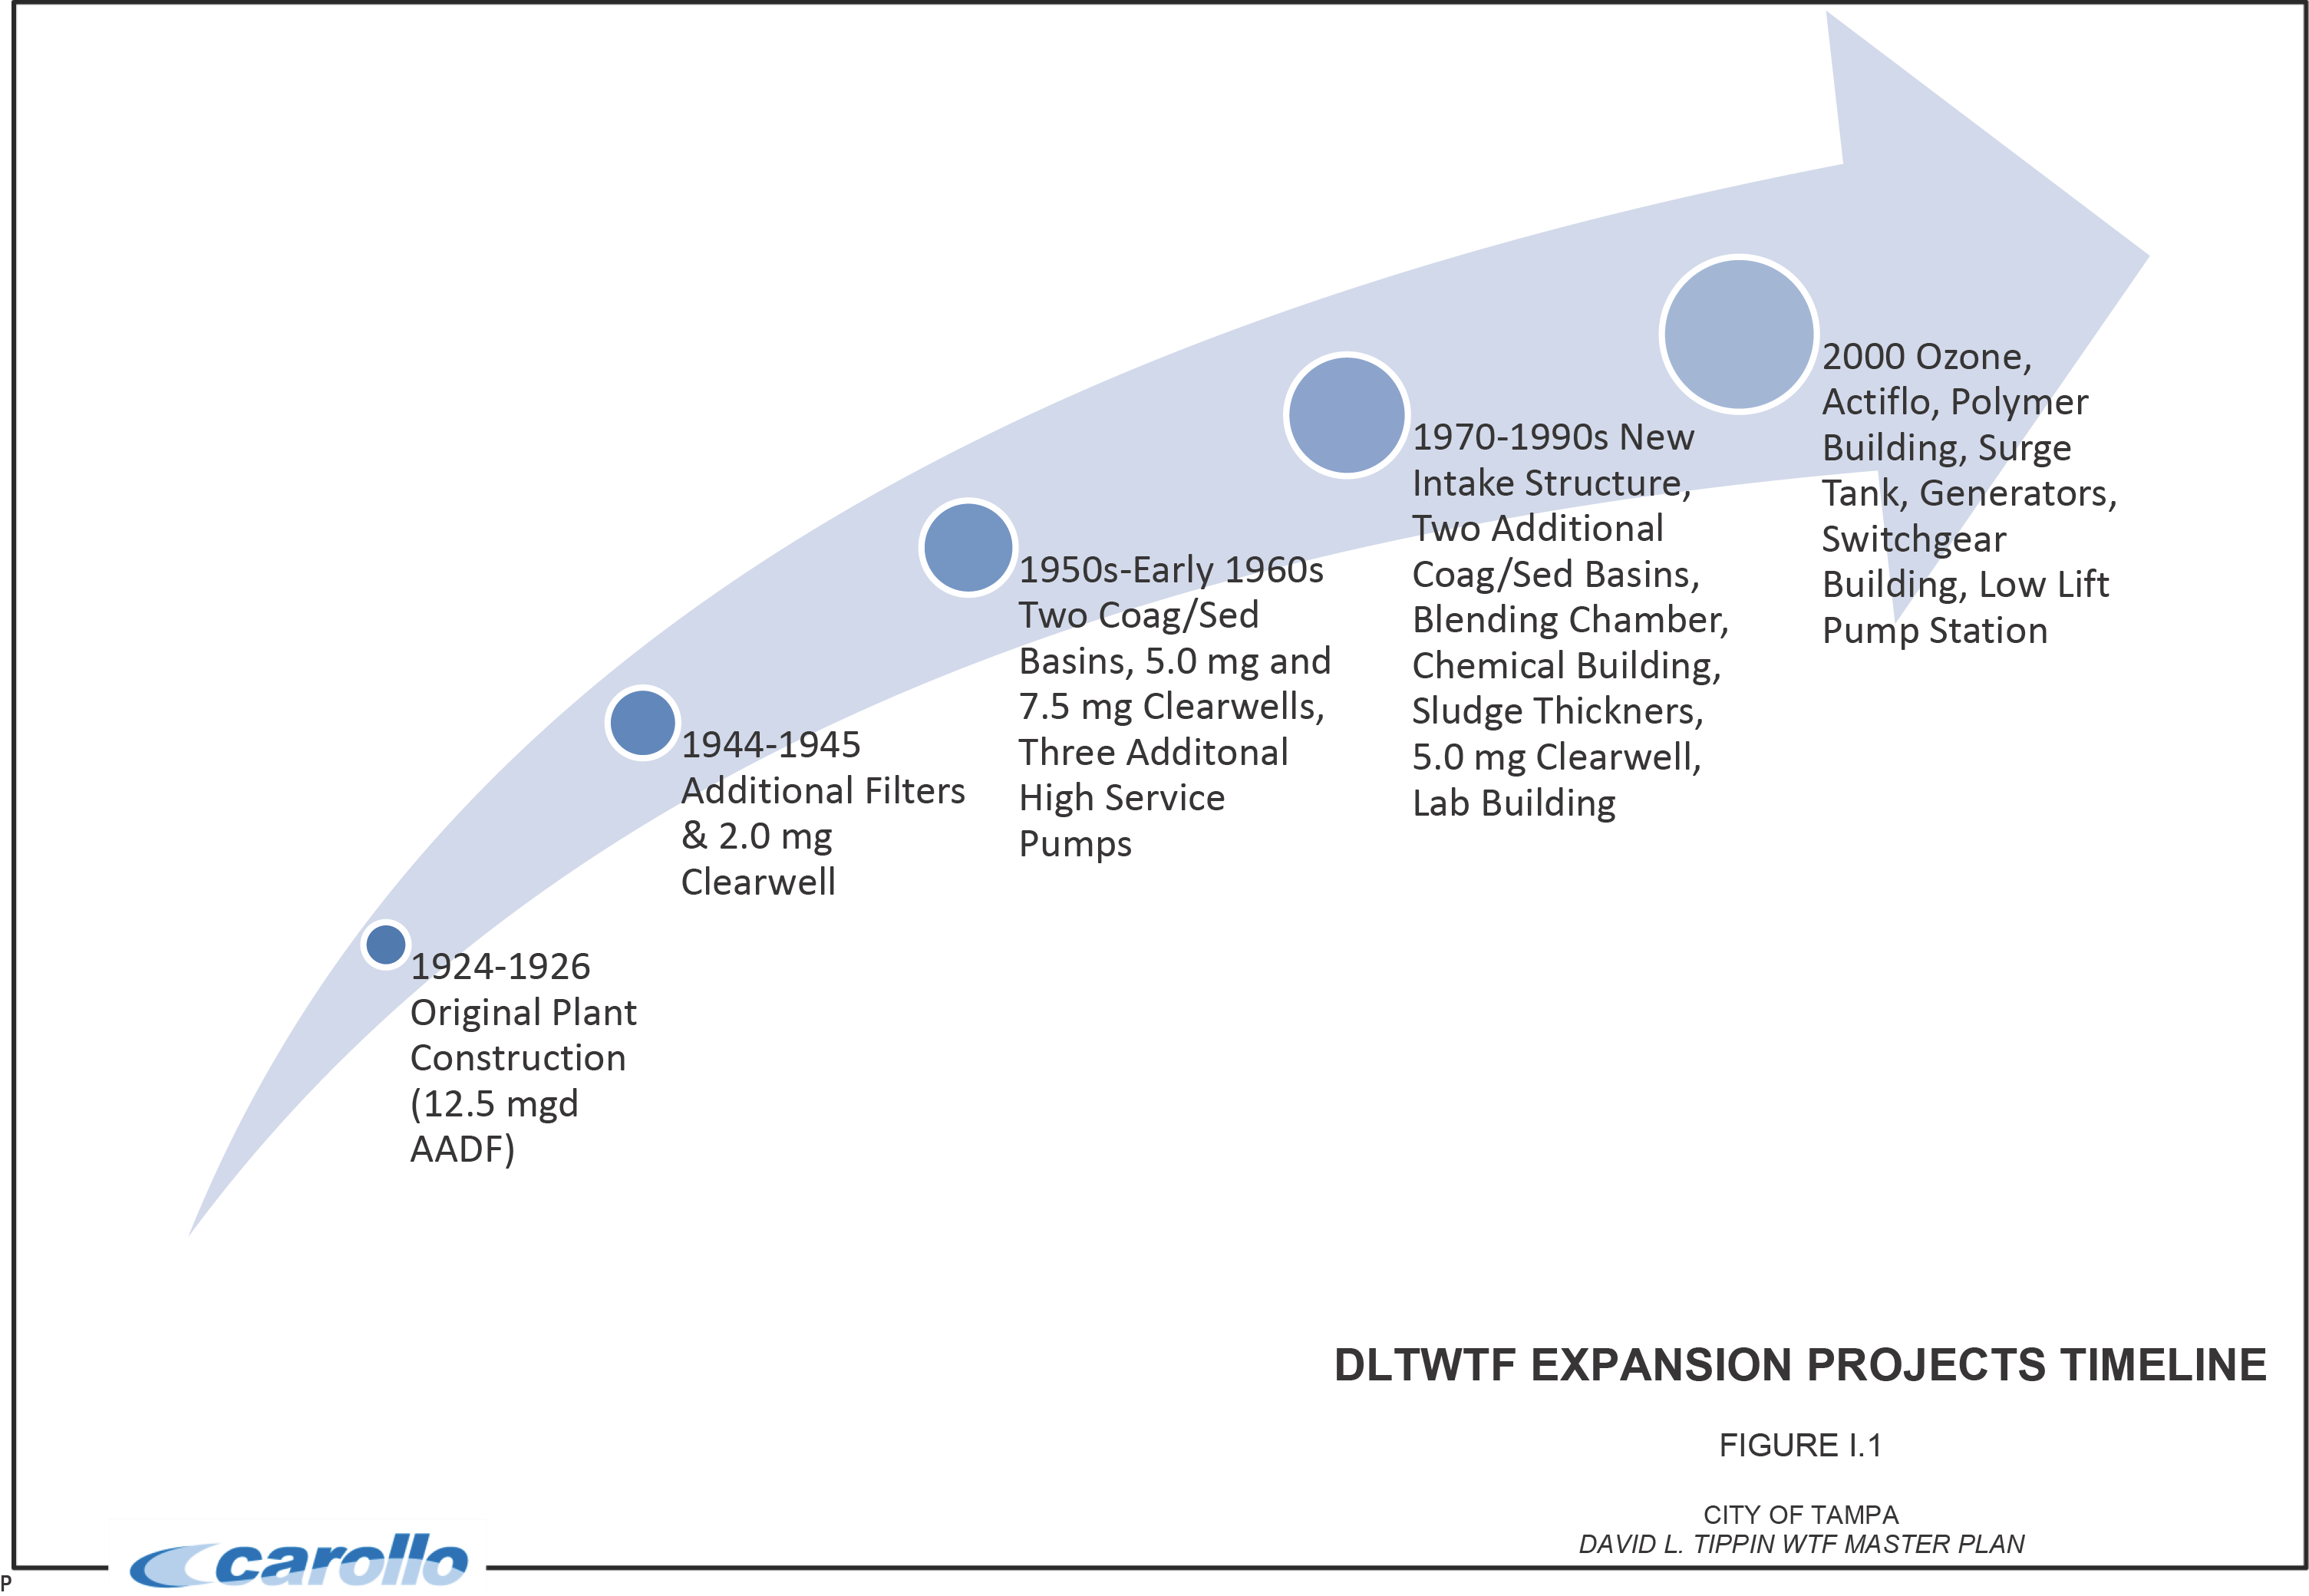
The residuals produced at the DLTWTF are preliminarily treated onsite with gravity thickeners for both sedimentation basin solids and equalized waste washwater. The DLTWTF has four gravity thickeners (GTs) for settling residuals and increasing the solids concentration. The supernatant from the thickeners is routed back to the head of the plant while the thickened residuals are sent off-site for further processing. The system consists of a surge tank, four gravity thickeners, two splitter boxes, and two sludge pumping stations.
Figure I.2 shows the overall site layout, and Figure I.3 shows the process flow diagram for the DLTWTF. Figure I.4 shows the existing chemical application points. Figure I.5 shows the solids flow diagram for the DLTWTF.
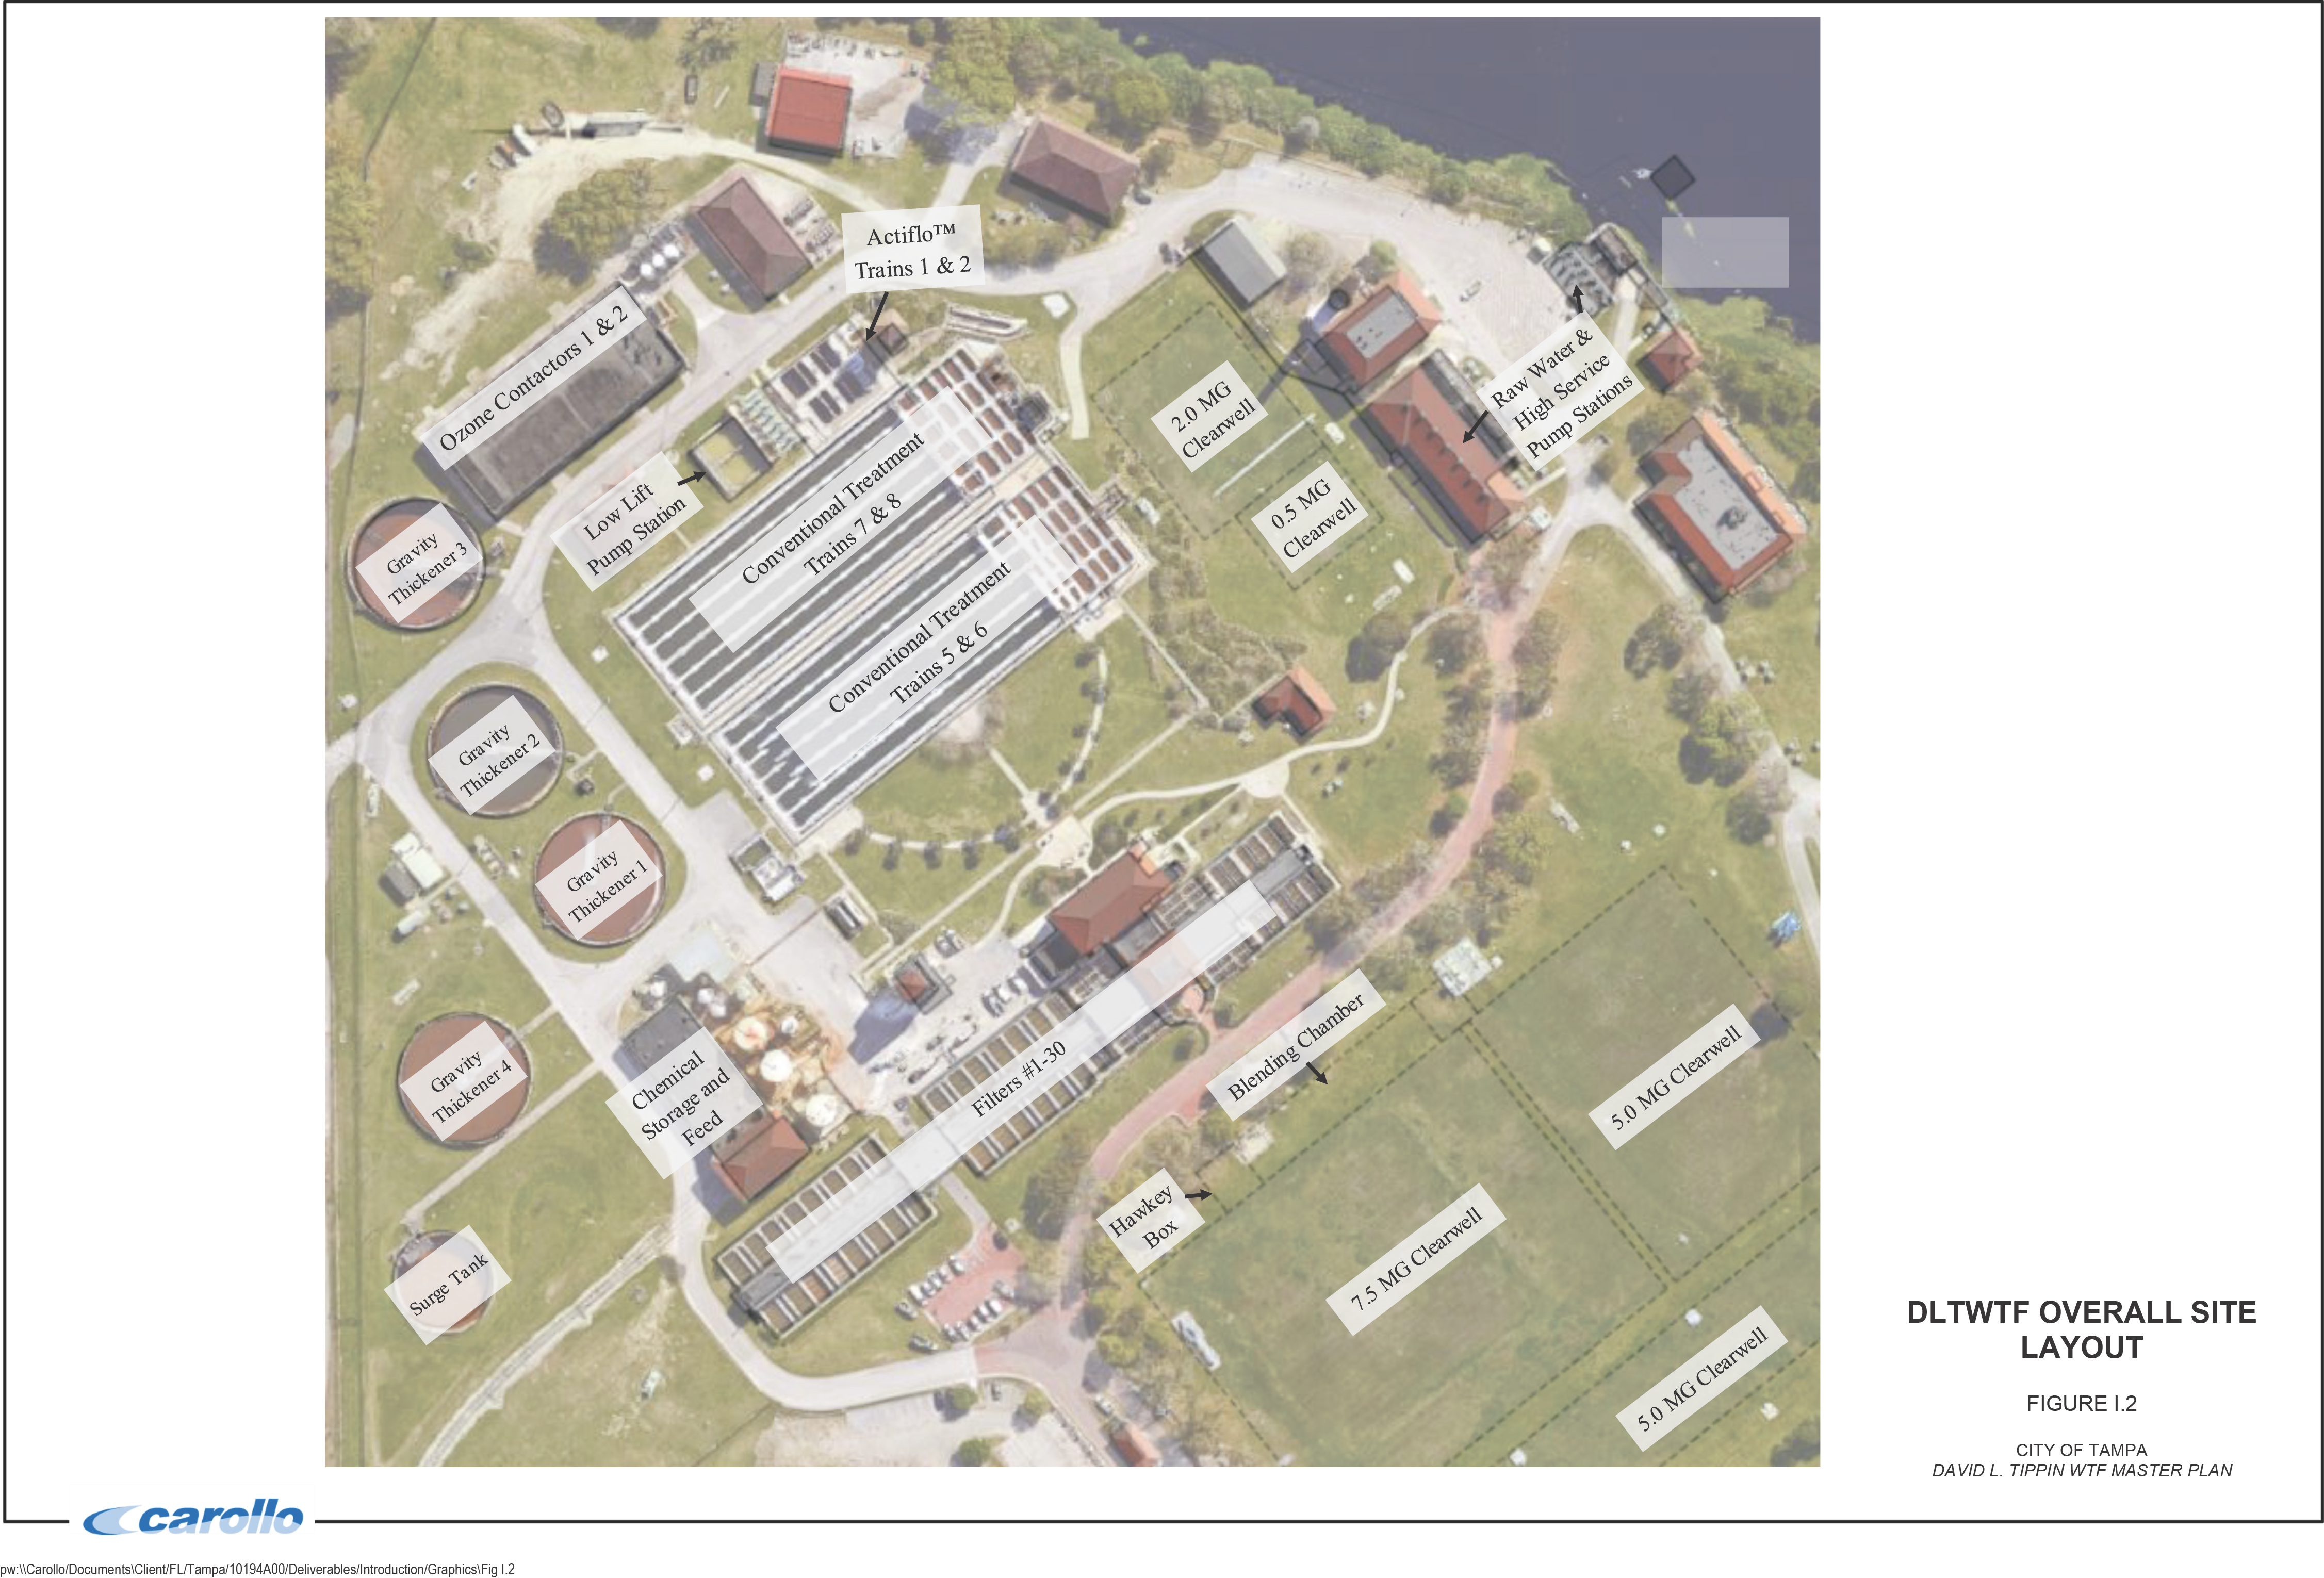
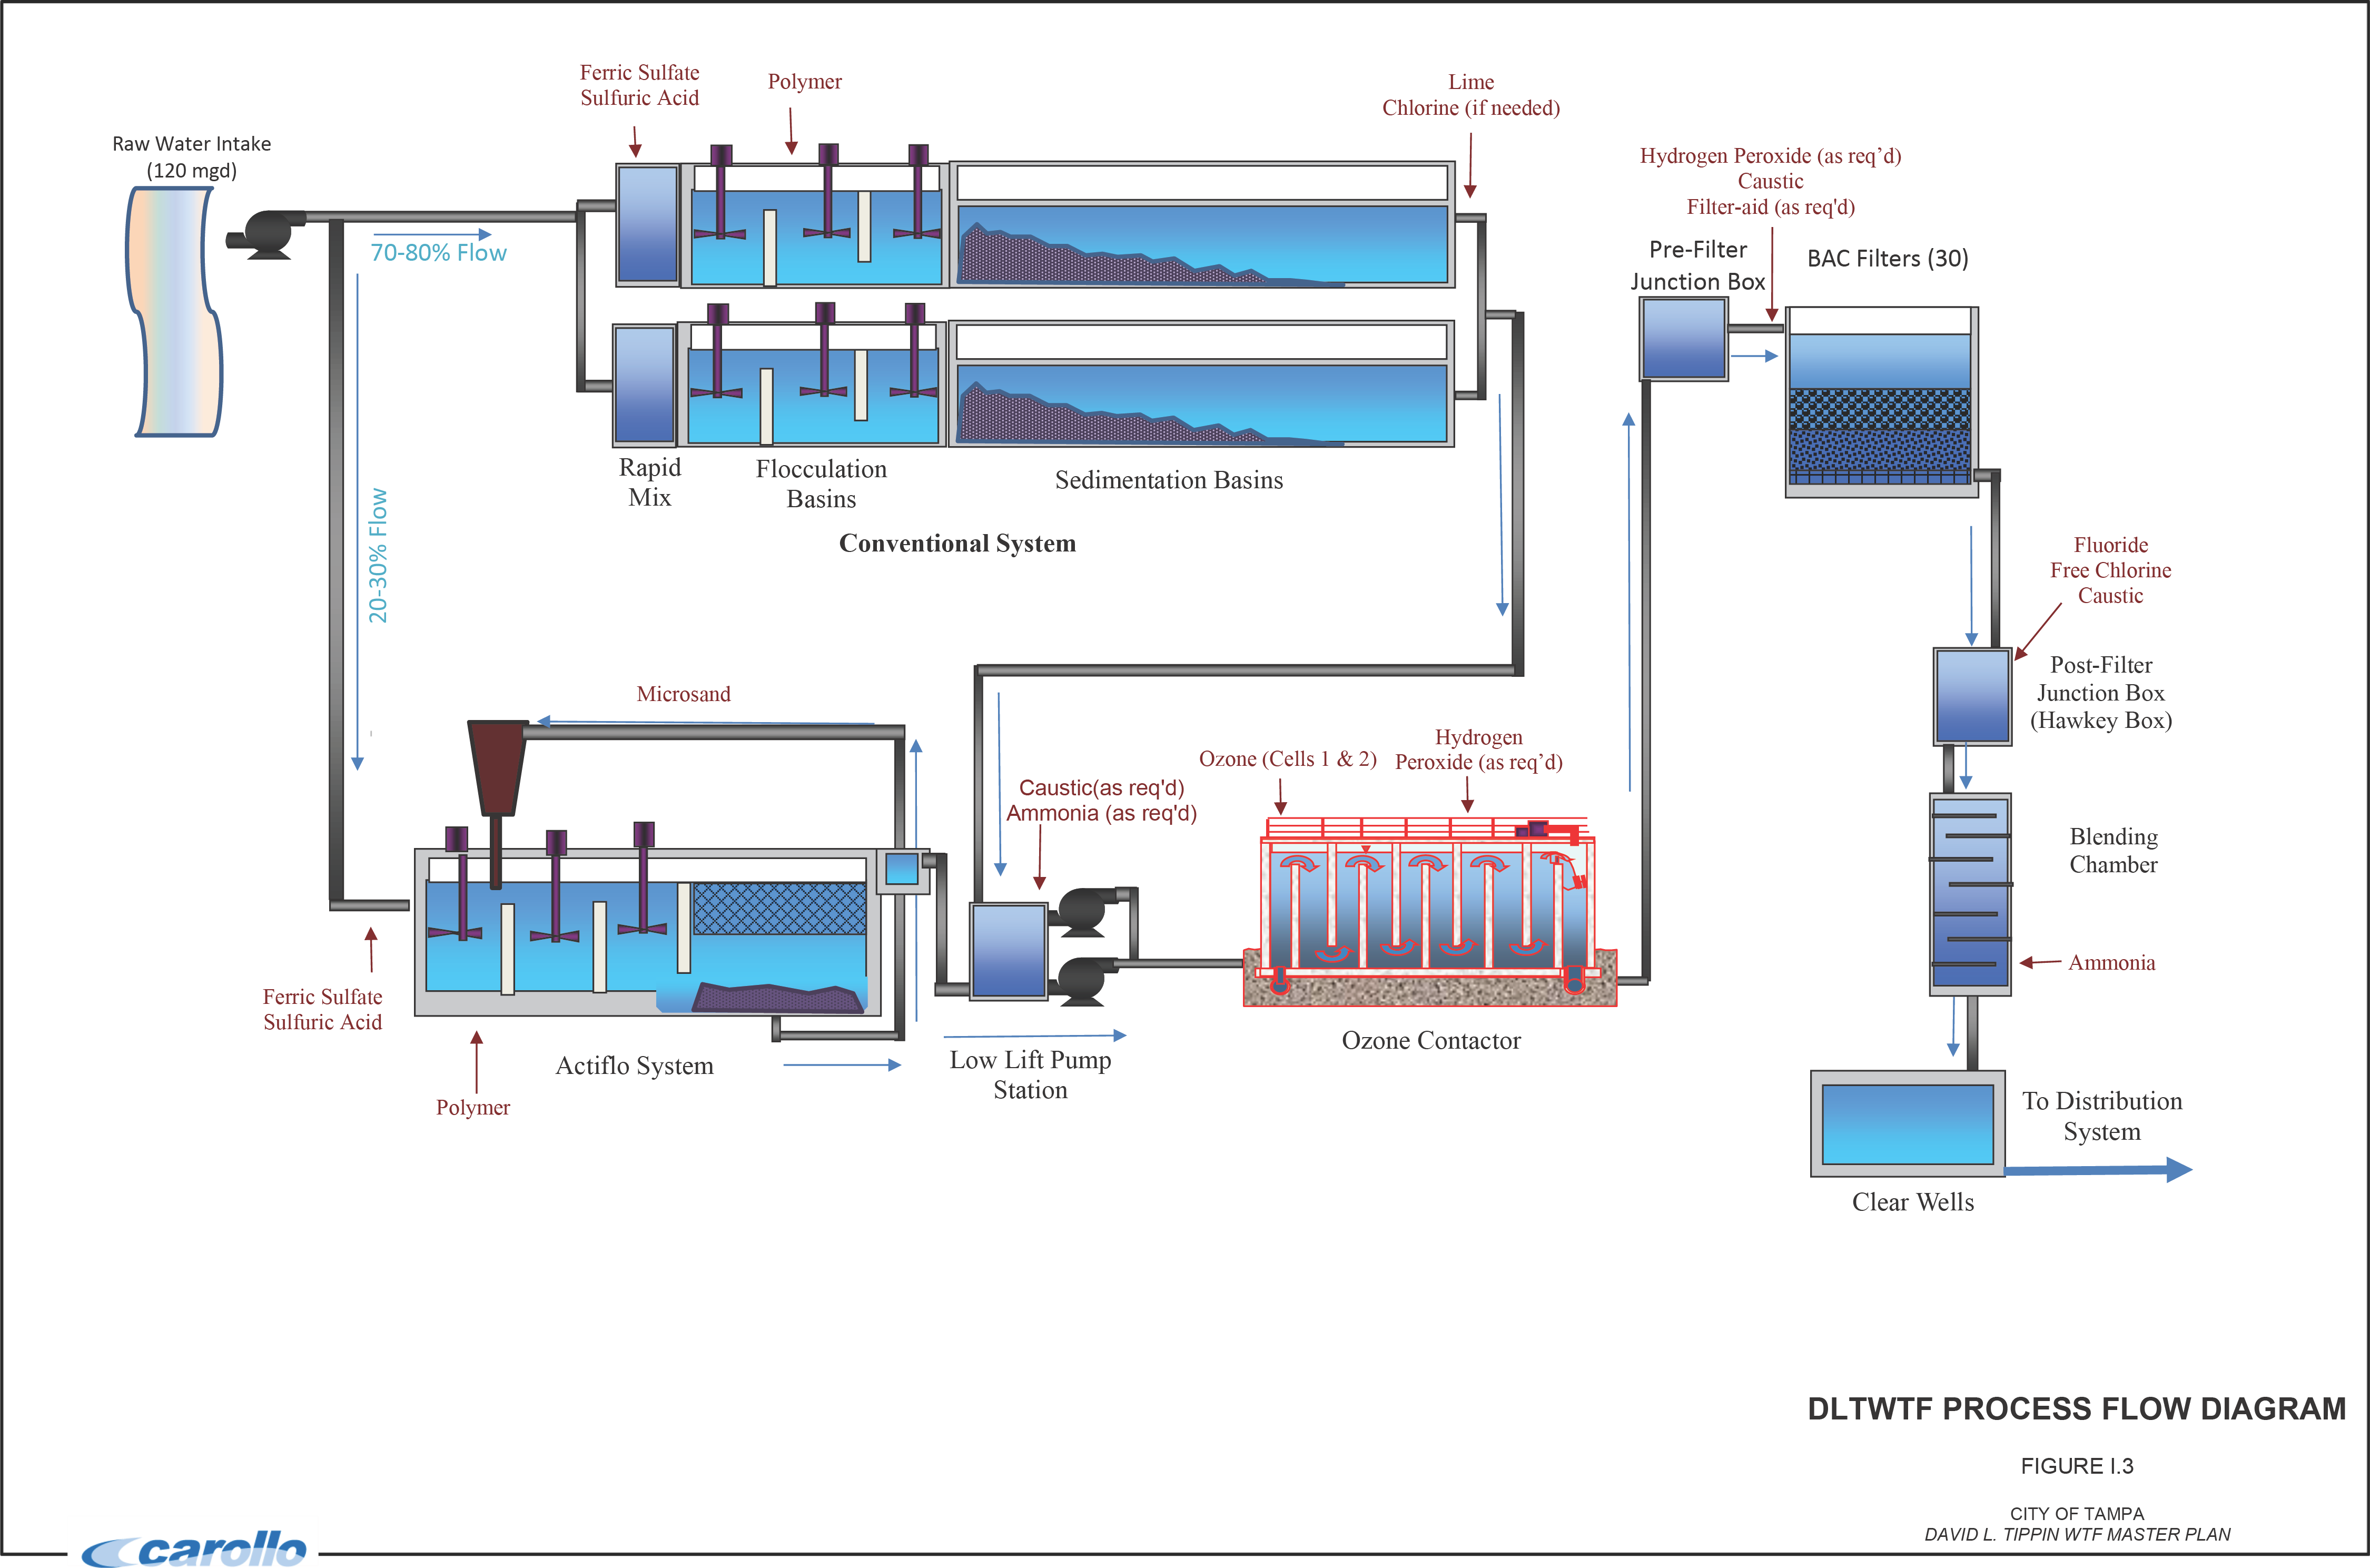

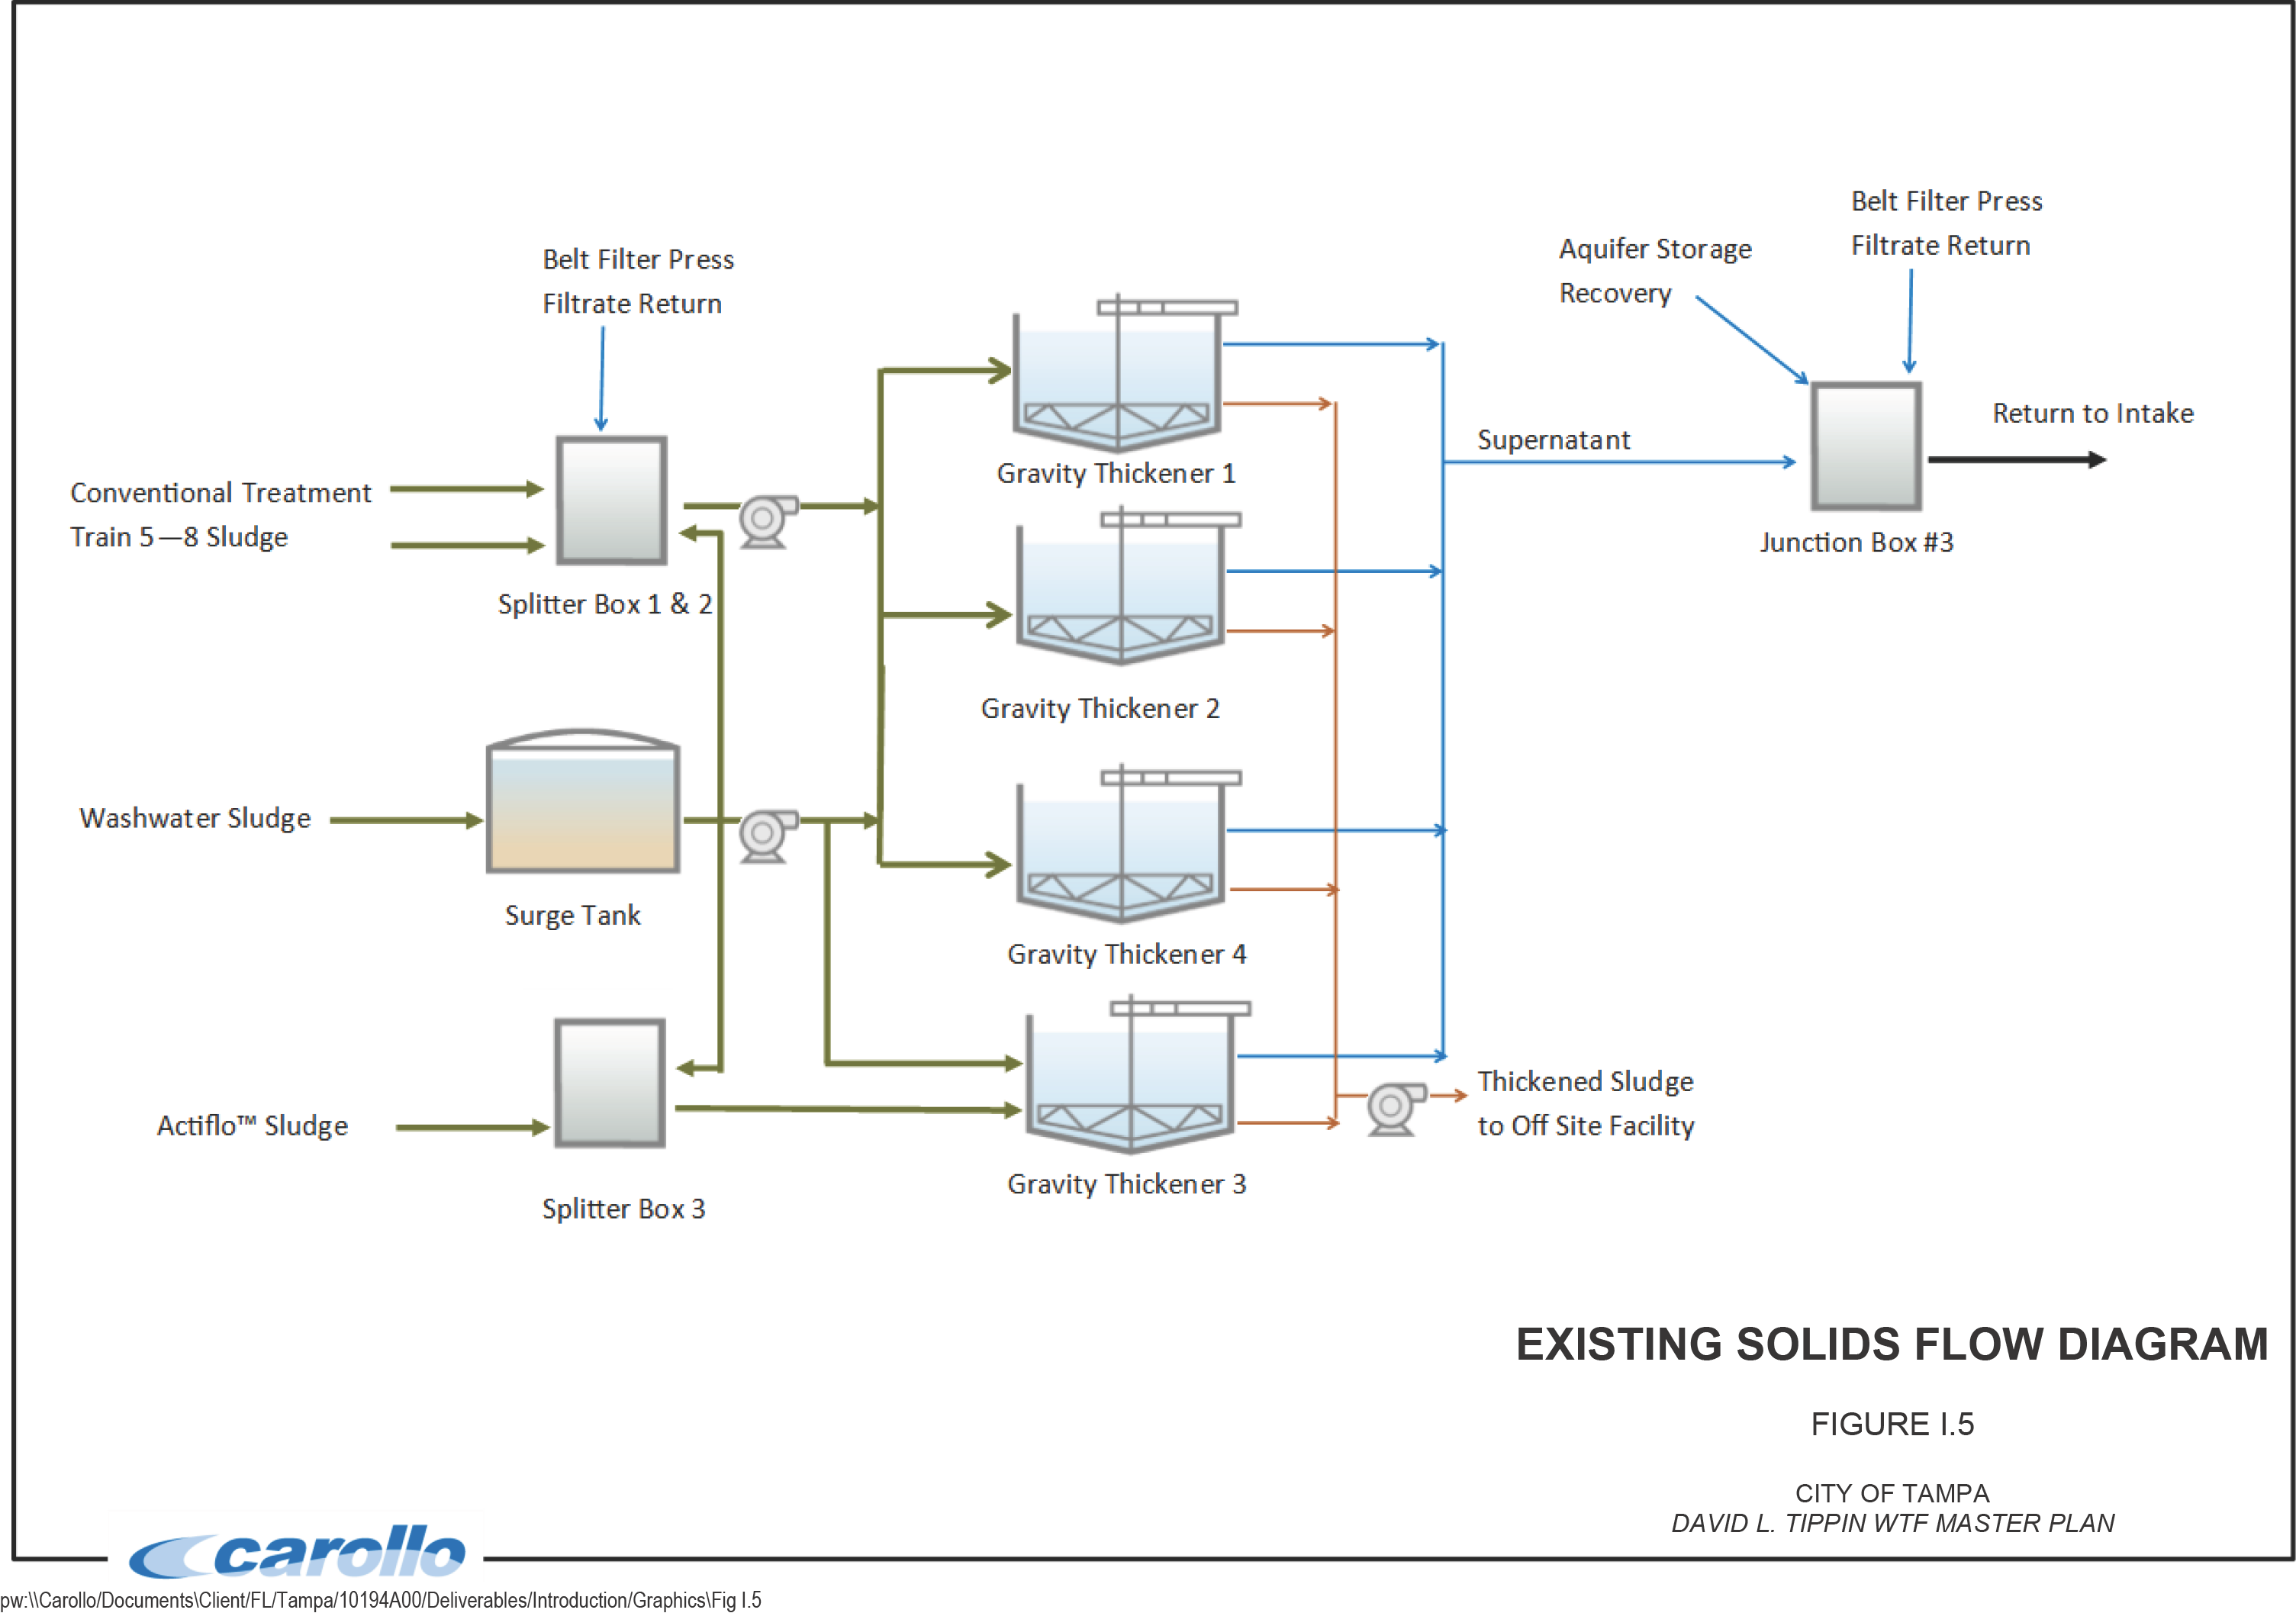
RAW AND FINISHED WATER QUALITY
Raw Water Quality and Characteristics
Typically, the raw water is provided by the Hillsborough River during average and high rainfall seasons, whereas the ASR well supplements flow during the dry season. Table I.1 shows the range and average of the raw water quality data for the DLTWTF, which shows the variability of the parameters seasonally due to weather patterns and source water.
| Parameter | Units(4) | Value (Max/Min/Avg) |
|---|---|---|
| Alkalinity(1) | mg/L as CaCO3 | 136 / 56 / 101 |
| Calcium Hardness(1) | mg/L as CaCO3 | 141 / 70 / 117 |
| Calcium (dissolved) (1) | mg/L | 56 / 26 / 39 |
| pH(1) | std. units | 7.34 / 6.18 / 6.82 |
| Temperature(1) | deg. C | 28.5 / 15.9 / 23.7 |
| Turbidity(2) | NTU | 2.26 / 1.19 / 1.62 |
| Total Suspended Solids(1) | mg/L | 4 / <1 / 1.83 |
| Specific Conductance(1) | mS/cm | 399 / 184 / 302 |
| Total Organic Carbon(1) | mg/L | 17.8 / 5.6 / 12.1 |
| Unfiltered UV254(1) | abs | 0.98 / 0.23 / 0.56 |
| Color (true) (1) | pcu | 174 / 36.3 / 93.0 |
| Iron (dissolved) (1) | mg/L | 0.58 / 0.09 / 0.21 |
| Manganese (dissolved) (1) | mg/L | 0.036 / <0.001 / 0.011 |
| Taste and Odor (Geosmin) (3) | ng/L | 183 / 1.50 / 25.6 |
| Taste and Odor (Methyl-Isoborneol (MIB)) (3) | ng/L | 53.1 / <1 / 17.6 |
| Total Phosphate(1) | mg/L | 0.283 / 0.096 / 0.181 |
| Nitrate(1) | mg/L as N | 0.24 / <0.025 / 0.113 |
| Bromide(1) | ug/L | 147 / 38.8 / 74.0 |
Notes:
- (1) Yearly average in 2015, data provided by the City.
- (2) Yearly average in 2014, data provided by the City with no turbidity data for 2015.
- (3) Average March 2015 - June 2015, data provided by the City.
- (4) Units for most parameters were assumed since data provided by the City did not include units of measurement. Assumed units should be confirmed.
Notes and observations regarding the raw water quality are as follows:
- TOC concentration ranged from 5.1 to 20.0 mg/L in 2015 dependent on seasonal variations, where higher concentrations are experienced in the rainy months
- Turbidity values vary seasonally but are considered low
- Taste and odor values typically lower than the odor detection threshold of 10 ng/L of MIB and Geosmin.
Finished Water Quality and Demand Considerations
The DLTWTF's current treatment processes and operations produce high quality water with key finished water quality parameters shown in Table I.2.
| Parameter | Units | Value (Max/Min/Avg) |
|---|---|---|
| Alkalinity(2) | mg/L as CaCO3 | 106 / 46 / 76.9 |
| Calcium Hardness(2) | mg/L as CaCO3 | 206 / 111 / 171.5 |
| Calcium (dissolved) | mg/L | 82 / 49 / 64 |
| pH(2) | std. units | 7.83 / 7.65 / 7.71 |
| Turbidity(4) | NTU | 0.06 / 0.04 / 0.05 |
| Total Suspended Solids(2) | mg/L | <1 |
| Total Organic Carbon(2) | mg/L | 3.55 / 1.50 / 2.42 |
| Color (true)(2) | pcu | 3.16 / 2.90 / 2.99 |
| Iron (dissolved) (2) | mg/L | 0.20 / 0.02 / 0.10 |
| Manganese (dissolved) (2) | mg/L | 0.008 / <0.001 / 0.002 |
| Taste and Odor (Geosmin) (3) | ng/L | 18.2 / <1.00 / 1.99 |
| Taste and Odor (MIB) (3) | ng/L | 4.00 / <1.00 / 1.55 |
| Total Phosphate | mg/L | 0.025 / 0.002 / 0.01 |
| Nitrate | mg/L as N | 0.41(1) |
| Bromate | ug/L | 2.0(1) |
| Chloramines | mg/L | 3.5(1) |
| Chloride | mg/L | 25.7(2) |
| Sulfate | mg/L | 118.5(2) |
| Langelier Saturation Index (LSI) | - | 0.09 |
| Calcium Carbonate Precipitation Potential | mg/L as CaCO3 | 1.09 |
Notes:
- (1) From the City's 2015 Water Quality Report.
- (2) Average 2015 data provided by City.
- (3) Average in March 2016 - June 2016.
- (4) Average 2014 data provided by City.
The goal of the work detailed in the master plan is to provide recommendations for the DLTWTF in order to continue to provide safe drinking water and meet established finished water quality goals, while also considering any needs for expansion. The City's finished water goals used to benchmark the performance of the plant and individual processes are shown on Table I.3. The intent is to maintain or improve the finished water quality through the efforts of the alternatives evaluation (Chapter 5) while considering existing process deficiencies (Chapter 3).
| Parameter | Units | Value (Min - Max) |
|---|---|---|
| pH | units | 7.80 - 8.00 |
| Turbidity | NTU | 0.01 - 0.08 |
| Total Organic Carbon | mg/L | 1.00 - 3.00 |
| Free Ammonia | ppm | 0.10 - 0.18 |
| Fluoride | mg/L | 0.65 - 0.75 |
| Chlorine Residual | ppm | 4.25 - 4.75 |
During the duration of this master plan development, Black and Veatch (B&V) as a part of their Potable Water Master Plan work, determined that the DLTWTF will need to be capable of meeting a max day demand of 134 mgd by 2032 as shown in Figure I.6. These results indicate the need to expand the DLTWTF to a process capacity of 140 mgd by 2032 in order to meet consumer and in-plant water demands assuming 96 percent efficiency (i.e. the percent of influent flow that reaches the distribution system after subtracting in-plant use/losses). The DLTWTF has operated between 94 to 96 percent efficiency historically.
In addition to the required future plant demand, the DLTWTF may be required to process and treat up to 50 mgd of reclaimed water as part of the Tampa Augmentation Project (TAP). The current plan is for the wastewater plant effluent to be shallow well injected upstream of the reservoir, where is it then allowed to percolate (thereby receiving additional treatment), and then be recovered from a more surficial aquifer and introduced into the DLTWTF's raw water source as indirect potable reuse (IPR). However, there is a potential that at some point the reclaimed water pipeline could be routed up to the DLTWTF site, resulting in a future direct potable reuse (DPR) connection that would bypass the aquifer injection and recovery steps described above. These considerations were taken into account during the development and evaluation of alternatives in Chapter 5.
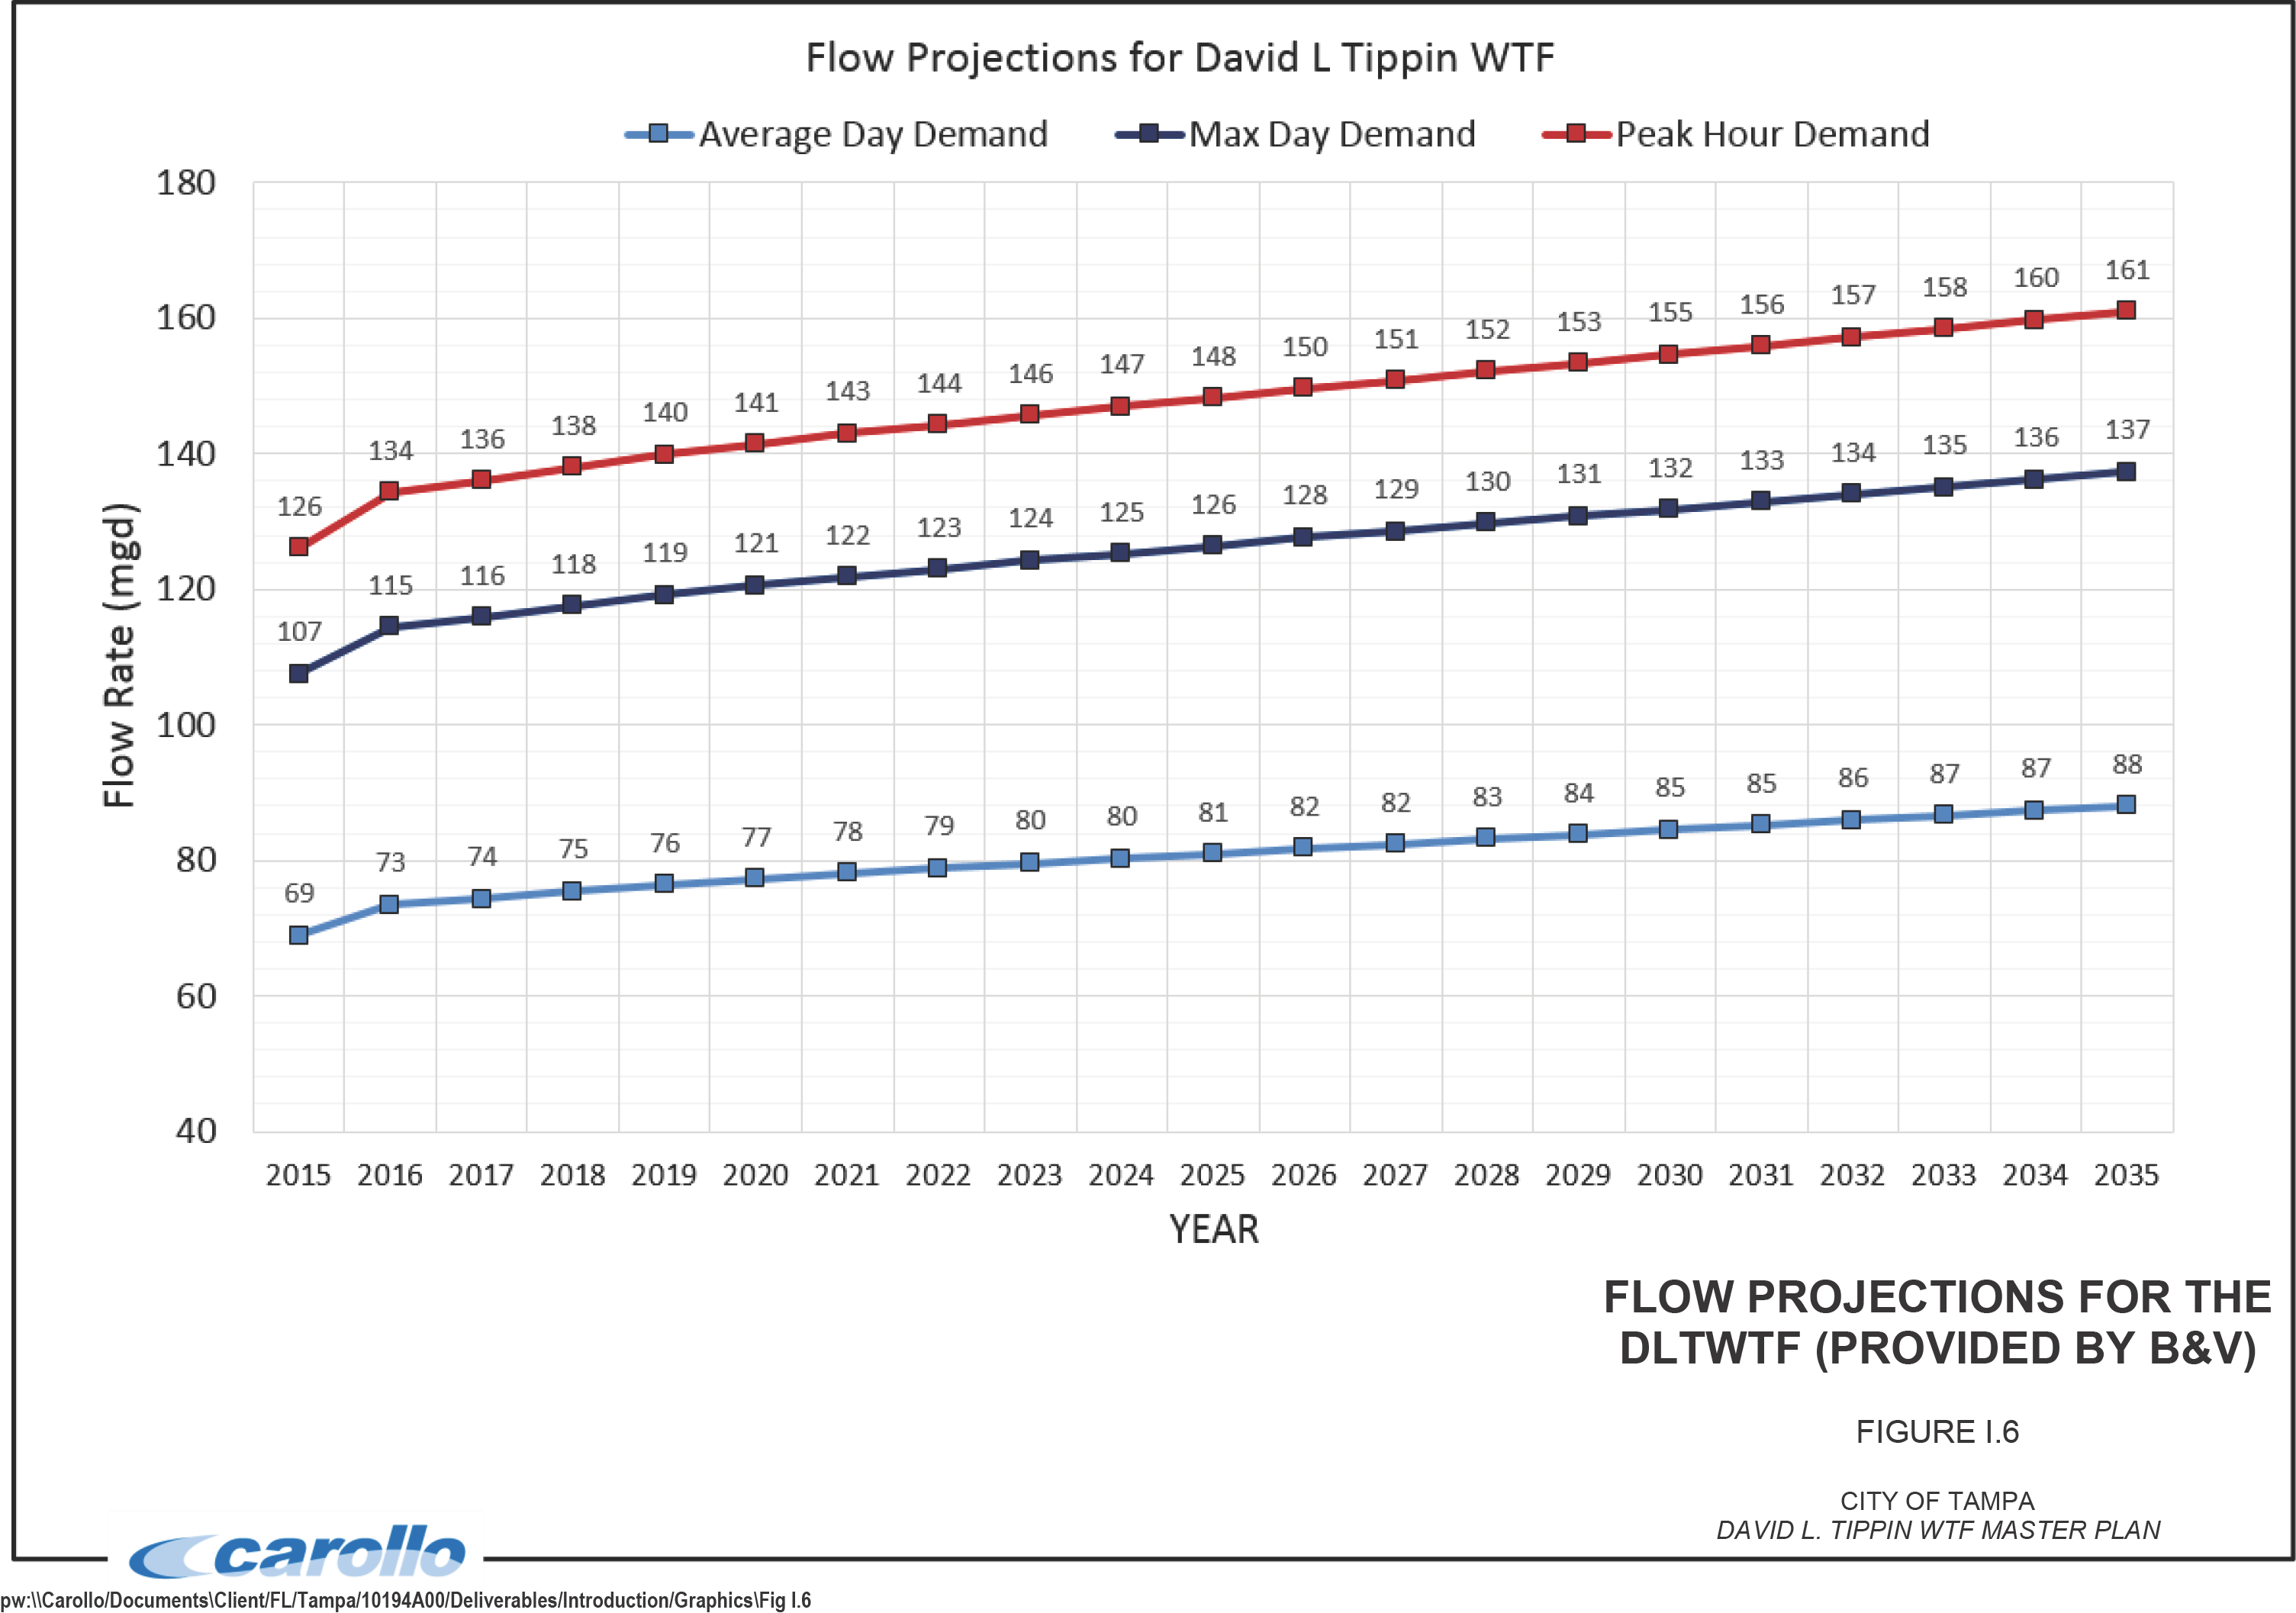
Chapter 1
REGULATORY EVALUATION
1.1 CHAPTER SUMMARY
The comprehensive master plan for the David L. Tippin Water Treatment Facility (DLTWTF) focuses on a 15-year planning horizon. Nonetheless, many regulations discussed and incorporated into the master plan address potential regulatory drivers and impacts that could occur beyond the planning horizon.
As such, this chapter reviews all current and anticipated water quality regulations that could affect the selection of treatment technologies for plant optimization and expansion. Review of the current regulations and data from the City of Tampa Water Department's DLTWTF shows the facility complies with existing regulations.
A number of new contaminants and changes to existing regulations possibly affecting DLTWTF are anticipated. When conducting monitoring and bench testing for these parameters, the impacts of water quality changes evaluated in the concurrent Tampa Augmentation Project (TAP) should also be considered. These parameters include:
- Strontium - Strontium has a health reference level of 1.5 mg/L. The Environmental Protection Agency (EPA) has postponed the decision to regulate while collecting additional occurrence data. The City has historically monitored strontium and found levels as high as 0.27 mg/L. Since strontium removal via coagulation with ferric sulfate is limited, alternative technologies, such as nanofiltration, reverse osmosis, or ion exchange, may be required. While well below the current health reference level, the City should continue to monitor strontium levels at DLTWTF and the EPA's regulatory developments.
- Perchlorate - The EPA established a health advisory level of 15 µg/L for perchlorate. Although some states have set more stringent drinking water regulations, Florida has not established any. In June 2016, the EPA issued a request for nominations to peer review the approach for deriving a maximum contaminant level goal (MCLG) for perchlorate. Biofiltration via granular activated carbon is shown to remove perchlorate at the pilot scale. The City should continue to monitor the regulatory development for perchlorate and begin monitoring concentrations at DLTWTF with bench-scale testing to measure removal as needed.
- Nitrosamines - Regulatory Determination 4 is anticipated to address nitrosamines as a group (including N-nitrosodimethylamine - NDMA). NDMA occurs frequently in chloraminated systems, and ozonation may increase NDMA formation potential. However, Biofiltration is shown to remove more than 80 percent of NDMA. The City should continue to monitor the regulatory development of nitrosamines and begin monitoring concentrations at DLTWTF with bench-scale testing to measure removal as needed.
- PFOA/PFOS - Perfluorooctanoic acid (PFOA) and perfluorooctanesulfonic acid (PFOS) have a health advisory level of 70 parts per trillion (ppt) combined. The EPA is investigating both through its Contaminant Candidate List 4 (CCL). Given that the source of PFOA and PFOS is typically industrial, DLTWTF is not expected to identify significant levels. However, monitoring PFOA and PFOS in the source water and TAP is warranted to confirm occurrence, since removal via existing treatment processes is unlikely.
- Cyanotoxins - Cyanotoxins as a group are included in CCL4. Furthermore, drinking water health advisories are published for microcystins and cylindrospermopsin at 0.3 and 0.7 micrograms per liter (µg/L), respectively, for preschool age and younger children. In 2015, the City conducted a sampling campaign for these algal toxins, finding them below the noted health advisory levels. Although the existing treatment processes at DLTWTF can remove cyanotoxins, oxidants may also lyse the cells and release toxins. The City should continue to monitor the regulatory development for cyanotoxins and optimize existing processes for cyanotoxin removal as needed.
- Fluoride - The federal Department of Health recently changed the recommended optimal fluoride concentration in drinking water from a range of 0.7 to 1.2 to mg/L to a target of 0.7 mg/L. The EPA will likely revise the existing fluoride regulations at the end of the current six-year review. Data from 2016 show that the City occasionally approaches this level (maximum of 0.69 mg/L in January through June 2016). The City should continue to monitor this regulatory development. Treatment protocols at DLTWTF may need to be adjusted accordingly.
- Hexavalent Chromium (CR-6) - EPA is developing a final risk assessment and Maximum Contaminant Level (MCL) for Cr-6, most likely during the current six-year review. California has established an MCL for Cr-6 of 10 µg/L, but no level has been established nationally or for any other state at this time. The City has historically monitored for Cr-6 and found levels as high as 0.11 µg/L, two orders of magnitude lower than the California MCL. The City should continue to monitor the Cr-6 regulatory development.
- TOrCs - Toxic Organic Chemicals (TOrCs) include pharmaceutical and personal care products as well as endocrine-disrupting compounds, which have been highly investigated and researched for several years. Although the EPA has not yet regulated any of these products, it may do so as further research is developed. TOrCs are of particular concern in direct and indirect potable reuse applications. Thus, the City should continue to monitor the regulatory development over the coming years and should consider any impacts from investigations during TAP.
1.2 INTRODUCTION
This chapter's reviews current and anticipated water quality regulations possibly affecting the selection of treatment technologies for plant optimization or expansion. Also included is
an initial assessment of the technologies that may be applicable if future regulations affect the City. This analysis is limited to treatment technologies at DLTWTF and does not consider the impacts of the existing distribution system on those regulations.
1.3 REGULATORY AGENCIES
1.3.1 Environmental Protection Agency
The EPA establishes legal limits for contaminants in drinking water at the federal level and determines the methods for testing these contaminants. When establishing limits, the EPA considers the protection of human health along with available treatment technologies and the contaminant levels that water treatment facilities can achieve. The EPA regulatory process is summarized below:
- Potential contaminants of concern are identified based on possible health concerns. Identified contaminants are listed on the EPA drinking water CCL.
- Contaminants on the CCL are evaluated by collecting information related to health, occurrence, and exposure for a preliminary risk assessment. The EPA then evaluates the adverse health effects the contaminant may cause and the extent it occurs in drinking water to determine whether an opportunity exists to reduce public health risks with a regulation.
- Regulation elements are developed by:
- Risk assessments to determine potential standards and quantify benefits.
- Analytical methods for the levels of concern.
- Treatment methods to achieve compliance.
- Cost analyses for compliance and enforcement.
- The EPA and the Office of Management and Budget (OMB) draft and review an MCL, which is then proposed.
- Public comments are considered and addressed, and the EPA and OMB review the final National Primary Drinking Water Regulation (NPDWR) a second time. The finalized regulation is promulgated.
- The regulation is implemented and enforced according to schedule.
The EPA currently has drinking water regulations for more than 90 contaminants.
1.3.2 Florida Department of Environmental Protection
The Florida Safe Drinking Water Act (SDWA; Florida Statutes Section 403.850 through 403.864) provides the primary regulations that govern drinking water treatment to protect public health in the state. The Florida Statutes direct the Florida Department of Environmental Protection (FDEP) to create and enforce rules regarding drinking water within the Florida Administrative Code (FAC). Chapters 62-550, 62-555, and 62-560, FAC
1.4 CURRENT REGULATIONS
The drinking water regulations discussed in this section include the Safe Drinking Water Act (SDWA), the Surface Water Treatment Rules, and other applicable rules to the DLTWTF. The DLTWTF is currently in compliance with all existing regulations.
1.4.1 Safe Drinking Water Act
The SDWA was established in 1974 to protect the quality of drinking water in the United States. The SDWA authorizes the EPA to establish minimum standards to protect tap water that all owners/operators of public water systems (PWSs) are required to comply with. Some state governments, including Florida, have been approved to implement these rules for the EPA and are encouraged to attain secondary standards related to nuisance/aesthetics.
The EPA establishes Maximum Contaminant Level Goals (MCLGs) under the SDWA at levels with no known anticipated adverse effects on human health to create an adequate margin of safety. While not enforceable themselves, these MCLGs direct MCL selection.
The national primary drinking water standards, which are enforceable limits, are set as close to the MCLGs as feasible. Feasibility is based on available treatment technologies and analytical methods. EPA can also adjust the MCLGs for cost reasons.
1.4.2 Surface Water Treatment Rules
The Surface Water Treatment Rules (SWTRs) were established to protect public health by establishing MCLGs for disease-causing pathogens and treatment requirements for filtrations and disinfection.
1.4.2.1 Primary Drinking Water Standards
Table 1.1 summarizes the national primary drinking water standards (NPDWS) and lists specific treatment requirements of existing regulations applicable to the DLTWTF, including references to the specific rule.
Table 1.1 National Primary Drinking Water Regulations
| Contaminant | MCLG(1) (mg/L) | MCL or TT(1) (mg/L) | Regulation(3) | Notes |
|---|---|---|---|---|
| Microorganisms | ||||
| Cryptosporidium | 0 | TT(2) | LT2 | - |
| Giardia lamblia | 0 | TT(2) | SWTR | - |
| Heterotrophic plate count | -- | TT(2) | SWTR | - |
| Legionella | 0 | TT(2) | SWTR | - |
| Total Coliforms | 0 | ≤ 5.0% | TCR | - |
| Turbidity | -- | TT(2) | LT1 | - |
| Viruses (enteric) | 0 | TT(2) | SWTR | - |
| Disinfection Byproducts | ||||
| Bromate | 0 | 0.010 | Stage 1 D/DBPR | - |
| Chlorite | 0.8 | 1.0 | Stage 1 D/DBPR | - |
| Haloacetic acids (HAA5) | -- | 0.060 | Stage 2 D/DBPR | LRAA(4) |
| Total trihalomethanes (TTHMs) | -- | 0.080 | Stage 2 D/DBPR | LRAA(4) |
| Chloramines (as Cl2) | 4 | 4.0 | Stage 1 D/DBPR | - |
| Chlorine (as Cl2) | 4 | 4.0 | Stage 1 D/DBPR | - |
| Chlorines Dioxide (as Cl2) | 0.8 | 0.8 | Stage 1 D/DBPR | - |
| Volatile Organic (VOCs) | ||||
| Benzene | 0 | 0.005 | SDWA | - |
| Carbon Tetrachloride | 0 | 0.005 | SDWA | - |
| Dichloroethane (1,2-) | 0 | 0.005 | SDWA | - |
| Dichloroethylene (1,1-) | 0.007 | 0.007 | SDWA | - |
| Dichloroethylene (cis-1,2-) | 0.07 | 0.07 | SDWA | - |
| Dichloroethylene (trans-1,2-) | 0.1 | 0.1 | SDWA | - |
| Dichloromethane | 0 | 0.005 | SDWA | - |
| Dichloropropane (1,2-) | 0 | 0.005 | SDWA | - |
| Ethylbenzene | 0.7 | 0.7 | SDWA | - |
| Monochlorobenzene | 0.1 | 0.1 | SDWA | - |
| o-Dichlorobenzene | 0.6 | 0.6 | SDWA | - |
| p-Dichlorobenzene | 0.075 | 0.075 | SDWA | - |
| Styrene | 0.1 | 0.1 | SDWA | - |
| Tetrachloroethylene (PCE) | 0 | 0.005 | SDWA | - |
| Toluene | 1 | 1 | SDWA | - |
David L. Tippin Water Treatment Facility Master Plan City of Tampa
Table 1.1 National Primary Drinking Water Regulations
David L. Tippin Water Treatment Facility Master Plan City of Tampa
| Contaminant | MCLG(1) (mg/L) | MCL or TT(1) (mg/L) | Regulation(3) | Notes |
|---|---|---|---|---|
| Trichlorobenzene (1,2,4-) | 0.07 | 0.07 | SDWA | - |
| Trichloroethane (1,1,2-) | 0.003 | 0.005 | SDWA | - |
| Trichloroethane (1,1,1-) | 0.2 | 0.2 | SDWA | - |
| Trichloroethylene (TCE) | 0 | 0.005 | SDWA | - |
| Vinyl Chloride | 0 | 0.002 | SDWA | - |
| Xylenes (Total) | 10 | 10 | SDWA | - |
| Synthetic Organic Compounds (SOCs) | ||||
| 2,3,7,8-TCDD (Dioxin) | 0 | 3x10⁻⁸ | SDWA | - |
| 2,4,5-TP (Silvex) | 0.05 | 0.05 | SDWA | - |
| 2,4-D | 0.07 | 0.07 | SDWA | - |
| Acrylamide | 0 | TT | SDWA | - |
| Adipates | 0.4 | 0.4 | SDWA | - |
| Alachlor (Lasso) | 0 | 0.002 | SDWA | - |
| Atrazine (Atranex, Crisazina) | 0.003 | 0.003 | SDWA | - |
| Benzo(a)pyrene (PAH) | 0 | 0.0002 | SDWA | - |
| Carbofuran (Furadan 4F) | 0.04 | 0.04 | SDWA | - |
| Chlordane | 0 | 0.002 | SDWA | - |
| Dalapon | 0.2 | 0.2 | SDWA | - |
| Dibromochloropropane (DBCP) | 0 | 0.0002 | SDWA | - |
| Diethylhexyl Phthalate (DEHP) | 0 | 0.006 | SDWA | - |
| Dinoseb | 0.007 | 0.007 | SDWA | - |
| Diquat | 0.02 | 0.02 | SDWA | - |
| Endothall | 0.1 | 0.1 | SDWA | - |
| Endrin | 0.002 | 0.002 | SDWA | - |
| Epichlorohydrin | 0 | TT | SDWA | - |
| Ethylene Dibromide | 0 | 0.00005 | SDWA | - |
| Glyphosate | 0.7 | 0.7 | SDWA | - |
| Heptachlor Epoxide | 0 | 0.0002 | SDWA | - |
| Heptachlor (H-34, Heptox) | 0 | 0.0004 | SDWA | - |
| Hexachlorobenzene | 0 | 0.001 | SDWA | - |
| Hexachlorocyclopentadiene | 0.05 | 0.05 | SDWA | - |
| Lindane | 0.0002 | 0.0002 | SDWA | - |
| Contaminant | MCLG(1) (mg/L) | MCL or TT(1) (mg/L) | Regulation(3) | Notes |
|---|---|---|---|---|
| Organic Chemicals (selected rows) | ||||
| Methoxychlor (Marlate) | 0.04 | 0.04 | SDWA | - |
| Oxyamyl (Vydate) | 0.2 | 0.2 | SDWA | - |
| Pentachlorophenol | 0 | 0.001 | SDWA | - |
| Picloram | 0.5 | 0.5 | SDWA | - |
| Polychlorinated Biphenyls | 0 | 0.005 | SDWA | - |
| Simazine | 0.004 | 0.004 | SDWA | - |
| Toxaphene | 0 | 0.003 | SDWA | - |
| Inorganic Chemicals (IOCs) | ||||
| Antimony | 0.006 | 0.006 | SDWA | - |
| Arsenic | 0 | 0.010 | Arsenic Rule | - |
| Asbestos (fibers > 10µm) | 7 million fiber/liter (MFL) | 7 (MFL) | SDWA | - |
| Barium | 2 | 2 | SDWA | - |
| Beryllium | 0.004 | 0.004 | SDWA | - |
| Cadmium | 0.005 | 0.005 | SDWA | - |
| Chromium | 0.1 | 0.1 | SDWA | - |
| Copper | 1.3 | TT, Action Level 1.3 | SDWA | Per Lead and Copper Rule |
| Cyanide | 0.2 | 0.2 | SDWA | - |
| Fluoride | 4 | 4 | SDWA | Secondary Std. is 2.0 mg/L |
| Lead | 0 | TT, Action Level 0.015 | SDWA | Per Lead and Copper Rule |
| Mercury | 0.002 | 0.002 | SDWA | - |
| Nitrate (as N) | 10 | 10 | SDWA | - |
| Nitrite (as N) | 1 | 1 | SDWA | - |
| Selenium | 0.05 | 0.05 | SDWA | - |
| Thallium | 0.0005 | 0.002 | SDWA | - |
| Contaminant | EPA | Notes | ||
|---|---|---|---|---|
| MCLG(1) (mg/L) | MCL or TT(1) (mg/L) | Regulation(3) | ||
| Radionuclides | ||||
| Combined Radium (226/228) | 0 | 5 pCi/L | Radionuclide Rule | - |
| Gross Alpha | 0 | 15 pCi/L | Radionuclide Rule | Excludes radon and uranium |
| Beta particles and Emitters | 0 | 4 mrems/ year | Radionuclide Rule | - |
| Uranium | 0 | 0.030 | Radionuclide Rule | - |
| Filter Backwash Recycling | TT | Filter Backwash Recycling Rule(5) | - | |
(1) MCLG = Maximum Contaminant Level Goal MCL = Maximum Contaminant Level TT = Treatment Technique
(2) The EPA's SWTRs require DLTWTF to:
a. Disinfect their water, and
b. Filter their water or meet criteria for avoiding filtration so that the following contaminants are controlled at the following levels: Cryptosporidium: 3-log removal. Giardia lamblia: 3-log removal. Viruses: 4-log removal. Legionella: No limit, but EPA believes that if Giardia and viruses are removed/inactivated, Legionella will also be controlled. Turbidity: ≤ 0.3 NTU 95 percent of the time, never to exceed 1 NTU. HPC: No more than 500 bacterial colonies/mL.
(3) MRDLG = Maximum Residual Disinfectant Level Goal MRDL = Maximum Residual Disinfectant Level SWTR = Surface Water Treatment Rule IESWTR = Interim Enhanced Surface Water Treatment Rule LT1 = Long-Term 1 Enhanced Surface Water Treatment Rule LT2 = Long-Term 2 Enhanced Surface Water Treatment Rule TCR = Total Coliform Rule D/DBPR = Disinfectants/Disinfection By-Products Rule SDWA = Safe Drinking Water Act and Amendments
(4) Levels based on location running annual average (LRAA) of four quarterly sample events.
(5) Includes self-assessment, monitoring, recycle returned to the head of the plant.
1.4.2.2 Interim and Long-Term 1 Enhanced Surface Water Treatment Rules
The Interim Enhanced Surface Water Treatment Rule (IESWTR) strengthened combined filter effluent (CFE) turbidity performance standards and individual filter turbidity provisions. The Long-Term 1 Enhanced Surface Water Treatment Rule (LT1) established similar requirements for PWSs serving less than 10,000 people. For the CFE (measured every 4 hours), turbidity standards were lowered to the following:
- Average turbidity less than 0.3 Nephelometric turbidity unit (NTU) in 95 percent of samples.
- Maximum allowable turbidity of 1.0 NTU.
For process control, monitoring individual filter effluents is required every 15 minutes.
According to the City of Tampa's 2014 and 2015 Water Quality Reports, the highest CFE turbidity level was 0.17 NTU in 2014 and 0.2 NTU in 2015. One hundred percent of the samples met regulatory limits each month in 2014 and 2015.
1.4.2.3 Long-Term 2 Enhanced Surface Water Treatment Rule
The Long-Term 2 Enhanced Surface Water Treatment Rule (LT2) is intended to improve the microbial pathogen control in drinking water, in particular the protozoan Cryptosporidium, and to address the risk trade-offs with disinfection byproduct (DBP) formation. The LT2 supplements previous surface water treatment rules and targets systems at higher potential risk from Cryptosporidium.
Filtered systems serving a population of 10,000 or greater, including the City of Tampa, were required to conduct monthly sampling of Cryptosporidium, E. coli, and turbidity for 24 months at each raw water intake location. Based on the monitoring results, filtered systems were classified into one of four possible risk categories (bins).
As Table 1.2 shows, a filtered system’s bin classification determines the extent of additional Cryptosporidium treatment requirement beyond current regulations. The City of Tampa is classified in Bin 1, which carries no additional treatment requirements. If future Cryptosporidium monitoring moves the City to another Bin classification, 1.0 to 2.5 log of additional Cryptosporidium removal will be required.
| Bin Classification | Average Cryptosporidium Concentration (oocysts/L) | Additional Treatment Requirements(1) | |
|---|---|---|---|
| Conventional Filtration Treatment | Direct Filtration(2) | ||
| 1 | < 0.075 | No additional treatment | No additional treatment |
| 2 | ≥ 0.075 - < 1.0 | 1-log treatment(3) | 1.5-log treatment(3) |
| 3 | ≥ 1.0 - < 3.0 | 2-log treatment(4) | 2.5-log treatment(4) |
| 4 | ≥ 3.0 | 2.5-log treatment(4) | 3.0-log treatment(4) |
| Approach (to be used in addition to existing treatment) | Potential Log Credit(4): 0.5 | Potential Log Credit(4): 1 | Potential Log Credit(4): 2 | Potential Log Credit(4): >2.5 |
|---|---|---|---|---|
| Watershed Control | ||||
| Watershed Control Program(1) | X | |||
| Reduction in Oocyst Concentration(3) | As measured | |||
| Reduction in Viable Oocyst Concentration(3) | As measured | |||
| Alternative Source | ||||
| Intake Relocation(3) | As measured | |||
| Change to Alternative Source of Supply(3) | As measured | |||
| Management of Intake to Reduce Capture of Oocysts in Source Water(3) | As measured | |||
| Managing Timing of Withdrawal(3) | As measured | |||
| Managing Level of Withdrawal in Water Column(3) | As measured | |||
| Pretreatment | ||||
| Pre-Settling Basin w/Coagulant | X | |||
| Two-Stage Lime Softening(1) | X | |||
| In-Bank Filtration(1) | X | |||
| Improved Treatment | ||||
| Lower Finished Water Turbidity (0.15 NTU 95% tile CFE) | X | |||
| Lower Finished Water Turbidity (0.15 NTU 95% tile individual filter performance) | X | |||
| Slow Sand Filters(1) | X | |||
| Membranes (MF, UF, NF, RO)(1) | X | |||
| Bag Filters or Cartridge Filters(1) | X | |||
| Approach (to be used in addition to existing treatment) | 0.5 | 1 | 2 | >2.5 |
|---|---|---|---|---|
| Improved Disinfection | ||||
| Chlorine Dioxide(2) | X | X | ||
| Ozone(2) | X | X | X | |
| UV(2) | X | |||
| Peer Review / Other Demonstration / Validation or System Performance | ||||
| Peer Review Program (ex. Partnership Phase IV) | X | |||
| Performance studies demonstrating reliable specific log removals for technologies not listed above. This provision does not supersede other inactivation requirements. | As demonstrated | |||
- Notes:
- (1) Criteria specified in guidance to determine allowed credit.
- (2) Inactivation depends on dose and source water characteristics.
- (3) Additional monitoring for Cryptosporidium after this action would determine new Bin classification and whether additional treatment is required.
- (4) X indicates potential log credit based on proper design and implementation in accordance with EPA guidance.
1.4.2.4 Filter Backwash Recycling Rule
The Filter Backwash Recycling Rule requires PWSs to monitor and assess recycled filter backwash and return it to the head of the plant to pass through all treatment processes. This is done to avoid compromising microbial control.
1.4.3 Disinfectants and Disinfection By-Product Rule
1.4.3.1 Stage 1 Disinfectants and Disinfection By-Product Rule
The Stage 1 Disinfectants and Disinfection Byproducts Rule (Stage 1 D/DBPR) applies to all community and non-transient community water systems that add a chemical disinfectant, such as chlorine, chlorine dioxide, chloramines, or ozone, to the drinking water at any point in the process. The Rule establishes maximum residual disinfectant levels (MRDLs) for chlorine, chloramines, and chlorine dioxide as well as the MCLs for total trihalomethanes (TTHMs), haloacetic acids (HAA5), chlorite, and bromate.
DLTWTF uses chloramine as the final chemical disinfectant. The City of Tampa reports chloramine residuals as part of the Monthly Operating Reports (MORs) and summarizes daily samples in a water quality report published annually. According to the 2014 Water
Quality Report, the running annual average (RAA) for chloramines in 2014 was 3.2 mg/L. In 2015, the RAA for chloramines was 3.5 mg/L. Concentrations ranged from 1.0 mg/L to 3.9 mg/L in both 2014 and 2015, which complies with the MRDL of 4 mg/L.
The City also measures bromate every month. The RAA for bromate was 2.6 µg/L in 2014 and 2.0 µg/L in 2015. Maximum detected bromate levels were 5.6 µg/L and 3.5 µg/L in 2014 and 2015, respectively. These results indicate that, during this period, the City complied with the regulatory requirements for bromate (less than 10 µg/L).
In the dry season, DLTWTF uses ASR to augment supplies. During this time, higher levels of bromide are present, which are oxidized to bromate in the ozonation process. When the ASR wells are in use, DLTWTF's treatment process can be modified slightly by adding chloramines upstream of ozonation. With this change, the DLTWTF can maintain compliance with the bromate regulatory requirements. If future supplies come from groundwater sources, such as additional ASR or via TAP, adding chloramines upstream of ozonation may be used more frequently. Section 1.4.3.2 discusses City of Tampa data for TTHM and HAA5.
The Stage 1 D/DBPR also establishes rules for disinfectant byproduct precursor removal. The Rule requires that the total organic carbon (TOC) reductions listed in Table 1.4 be achieved with enhanced coagulation unless certain raw water or finished water quality criteria are met.
Conventional treatment plants must monitor TOC concentrations by taking one “paired sample” per month. A paired sample involves measuring the TOC in a treated water sample (before the point of combined filter effluent turbidity monitoring) and the TOC in a source water sample (before any treatment) simultaneously. One source water alkalinity sample per month is also taken at the same time and location as the source water TOC sample.
Compliance with the TOC requirement is calculated with a running annual average, computed quarterly. Reduced monitoring (per quarter) is permitted if the average annual treated water TOC is <2.0 mg/L for two consecutive years or <1.0 mg/L for one year.
| Raw Water TOC (mg/L) | TOC Reduction Requirements (%) for Given Raw Water Alkalinity | ||
|---|---|---|---|
| <60 mg/L | 60 – 120 mg/L | >120 mg/L | |
| >2 to 4 | 35 | 25 | 15 |
| >4 to 8 | 45 | 35 | 25 |
| >8 | 50 | 40 | 30 |
The City of Tampa monitors TOC weekly. These results are included in the MORs and are summarized in annual water quality reports. In 2014 and 2015, the City removed a greater percentage of TOC than required. The ratio of actual to required TOC removal ranged from 1.92 to 2.84 in 2014 and 1.76 to 2.63 in 2015.
1.4.3.2 Stage 2 Disinfectants and Disinfection Byproduct Rule
The EPA promulgated Stage 2 D/DBPR simultaneously with the LT2ESWTR to address risks from microbial pathogens and DBPs. The Stage 2 D/DBPR applies to water systems that add or deliver water treated with a primary or residual disinfectant other than ultraviolet light.
Key provisions of the Stage 2 D/DBPR consist of an Initial Distribution System Evaluation (IDSE) and a change in compliance calculation to a locational running annual average. Compliance for Tampa began April 1, 2012. The IDSE is the first step in Stage 2 D/DBPR compliance.
In 2006, the City completed and received approval for 40/30 certification because Stage 1 compliance monitoring showed individual samples less than 0.040 mg/L for TTHMs and 0.030 mg/L for HAA5. With this certification, the PWS could skip IDSE monitoring requirements. The purpose of the IDSE was to identify sampling locations for Stage 2 D/DBPR compliance monitoring that represented distribution system sites with high TTHM and HAA5 levels.
Stage 2 D/DBRPR compliance monitoring began on April 1, 2012, for cities such as Tampa that serve populations greater than 100,000. Compliance with TTHM and HAA5 operational evaluation levels (OEL) began January 2013.
The MCLs for TTHMs and HAA5s remain unchanged from the Stage 1 D/DBPR at 80 and 60 µg/L, respectively. However, instead of system-wide running annual averages (RAAs), site-specific locational running annual averages (LRAAs) are now used to calculate compliance data. LRAAs are intended to strengthen public health protection by eliminating the potential of the same customers consistently receiving elevated levels of DBPs.
TTHM and HAA5 are measured quarterly at twelve locations within the City of Tampa distribution system. The 2014 and 2015 Water Quality Reports reported OELs, minimum, and maximum detected levels based on the LRAAs for TTHM and HAA5. Average TTHM concentrations were 25.6 µg/L and 19.3 µg/L in 2015 and 2014, respectively. TTHM concentrations ranged from 12.0 µg/L to 33.1 µg/L in 2015 and from 8.4 µg/L to 30.3 µg/L in 2014. HAA5 levels in 2015 ranged from 3.30 µg/L to 14.41 µg/L with an average concentration of 11.4 µg/L according to the 2015 Water Quality Report. In 2014, HAA5 levels ranged from 5.14 µg/L to 12.3 µg/L and were 11.2 µg/L on average. The MCLs of 80 µg/L and 60 µg/L for TTHM and HAA5, respectively, were not exceeded within the last two years.
1.4.4 Lead and Copper Rule
The Lead and Copper Rule (LCR) was developed in 1991 to limit lead and copper exposure and to reduce potential health risks to drinking water customers. Health problems associated with exposure to these contaminants ranges from stomach distress to brain damage. The main source of lead and copper in drinking water systems is from older fixtures corroding or from solders connecting pipes.
The LCR established action levels for lead and copper as 0.015 mg/L and 1.3 mg/L, respectively (also shown in Table 1.1). Exceeding the action level is not considered a violation. However, if more than 10 percent of sampled taps exceed the action level, the utility may need to comply with other requirements of water quality parameter monitoring, corrosion control treatment, source water monitoring/treatment, public education, and lead service line replacement (LSLR).
Under the LCR, the City must sample household taps for lead and copper and the distribution system for certain water quality parameters, including pH and alkalinity. Initial sampling should also include calcium, conductivity, and temperature.
As a large PWS that serves a population of over 100,000, the City of Tampa Lead and Copper sampling plan must include 100 tap sample sites and 25 water quality parameter distribution system sample sites. To comply with the LCR, the City maintains a list of target sampling locations, conducts a monitoring program, and promotes treatment operations that reduce the exposure to lead and copper.
In 2014 and 2015, no action levels were exceeded for lead or copper. The 90th percentile for copper samples was 0.04 mg/L in both 2014 and 2015. Lead was not detected at the 90th percentile in 2014 or 2015.
1.4.5 Arsenic Rule
On January 22, 2001, the EPA proposed a reduction in the arsenic standard from 50 µg/L to 10 µg/L. Due to delays in announcing the proposed rule, the final rule was published on February 22, 2002, with a compliance date for all drinking water systems by January 23, 2006.
Arsenic levels were well below the MCL in 2014 (1.8 µg/L) and 2015 (1.9 µg/L) in the City of Tampa.
1.4.6 Radionuclides Rule
On December 7, 2000, the EPA announced updated standards for radionuclides and a new standard for uranium. The standards are as follows:
- Combined Radium: 226/228 - 5 pCi/L.
- Beta/Photon Emitters: 4 mrem/yr *.
- Gross Alpha MCL: 15 pCi/L.
- Uranium MCL: 30 µg/L.
*A total of 168 individual beta particle and photon emitters may be used to calculate compliance with the MCL.
This rule became effective on December 8, 2003.
1.4.7 Total Coliform Rule
The EPA revised the 1989 TCR, a National Primary Drinking Water Regulation (NPDWR). The new “Revised Total Coliform Rule” (RTCR) was published in the Federal Register on February 13, 2013, with the goals of reducing implementation burden and using advances in scientific understanding to improve public health protection against waterborne pathogens in public drinking water distribution systems.
This new rule requires public water systems vulnerable to microbial contamination to identify and fix problems and establishes criteria for public water systems to qualify for and maintain reduced monitoring. The second requirement is intended to reduce water system burden and provide incentives for better system operation.
The RTCR retains the TCR's basic monitoring requirements and now links monitoring frequency to water quality and system performance as follows:
- Monitoring frequency requirements have changed for small systems.
- An MCLG and MCL have been set for E. coli, and the MCLG and MCL for total coliforms have been eliminated. E. coli is believed to be a better indicator of fecal contamination than total coliform.
The new MCLG for E. coli is zero. The MCL for E. coli is based on the monitoring results for total coliforms and E. coli.
- A treatment technique for total coliforms that requires assessment and corrective action replaces total coliform limits. The need for assessment is determined based on the results of repeat samples:
- Three repeat samples must be taken within 24 hours of a positive total coliform sample: one repeat sample from the same location, one sample from within five upstream service connections, and one sample within five downstream service connections.
- If one or more repeat samples are positive for total coliforms, the sample(s) must be analyzed for E.coli. If the sample is E.coli positive, the result must be reported to the state the same day the PWS is notified. An additional set of repeat samples must be collected unless an assessment has been triggered.
A PWS that exceeds a specified frequency of total coliform occurrence must conduct an assessment to determine if any sanitary defects exist. If any are found, the system must correct them. In addition, under the treatment technique requirements, a PWS
that incurs an E. coli MCL violation must conduct an assessment and correct any sanitary defects found.
- The EPA removed the 1989 MCLG and MCL for total coliform. Many of the organisms that total coliform methods detect are not of fecal origin and do not have any direct public health implication. The “acute” total coliform MCL violation under the 1989 TCR has been maintained as the MCL for E. coli under the RTCR.
- Under the new treatment technique for coliforms, total coliforms serve as an indicator of a potential pathway of contamination into the distribution system. A PWS that exceeds a specified frequency of total coliform occurrence must conduct an assessment to determine if any sanitary defects exist and must correct them if found. Under the new treatment technique requirements, a PWS that incurs an E. coli MCL violation must also assess and correct any sanitary defects found.
- The RTCR establishes an E. coli MCL violation, a treatment technique violation, a monitoring violation, and a reporting violation. For each type of violation, public notification is required, with the type of notification depending the degree of potential public health concern.
As with the 1989 TCR, PWSs will continue to monitor for total coliforms and E. coli according to a sample siting plan and schedule specific to the system. Compliance with this new rule was required April 1, 2016. Since then, the City has had a number of positive total coliform samples, which were followed up with the required repeat samples. Since the new rule was in effect, no positive E.coli samples were collected, meaning the City has complied with the RTCR since.
1.4.8 National Secondary Drinking Water Requirements
National Secondary Drinking Water Regulations (NSDWRs or secondary standards) are non-enforceable guidelines regulating contaminants that may cause aesthetic effects in drinking water, such as taste, odor, or color. The FDEP adopted most of these standards exactly as the EPA wrote them. However, they consider them regulatory guidelines and require that any system failing to meet these requirements contact the FDEP. Table 1.5 lists the secondary standards.
1.4.9 Consumer Confidence Reports
On January 3, 2013, the EPA announced a new interpretation of the Consumer Confidence Report (CCR) Rule. According to the agency, community water systems will now be considered compliant with federal CCR delivery requirements if they publish their report on a public website, notify customers of the report’s availability (such as with a notice printed on water bills), and provide a direct URL to the online report. Utilities only have to mail hard copies to customers who request them; any water system that prefers to distribute all CCRs by mail or other hardcopy means may continue to do so. Water systems can start using electronic communication of CCRs this year.
| Contaminant | Secondary Standard |
|---|---|
| Aluminum | 0.2 mg/L |
| Chloride | 250 mg/L |
| Color | 15 (color units) |
| Copper | 1.0 mg/L |
| Fluoride | 2.0 mg/L |
| Foaming Agents | 0.5 mg/L |
| Iron | 0.3 mg/L |
| Manganese | 0.05 mg/L |
| Odor | 3 Threshold Odor Number (TON) |
| pH | 6.5-8.5 |
| Silver | 0.10 mg/L |
| Sulfate | 250 mg/L |
| Total Dissolved Solids | 500 mg/L |
| Zinc | 5 mg/L |
Once listed, the EPA evaluates the health effects, occurrence, and analytical methods of each contaminant. At the end of the evaluation period for a CCL, the EPA can decide to eliminate a contaminant for consideration, regulate a contaminant, delay the promulgation of a regulation pending additional data, or, in most cases, continue to incorporate the contaminant in the subsequent CCLs for future consideration. For each CCL, decisions to regulate, not regulate, or postpone the decision to regulate contaminants are reported in the Regulatory Determinations (Reg-Det).
The primary source of occurrence data to identify emerging contaminants is collected via the UCMR. The data are used to support regulatory decision making about the contaminants.
1.5.1.1 CCL1 and UCMR1
The first CCL was issued in 1998 and included 60 chemical and microbial candidates. In 2003, the EPA determined that no regulatory action was required for Acanthamoeba, aldrin, dieldrin, hexachlorobutadiene, manganese, metribuzin, naphthalene, sodium, and sulfate. The remaining 51 contaminants remained under consideration.
1.5.1.2 CCL2 and UCMR2
Released in 2005, the CCL2 included the 51 contaminants not eliminated from CCL1. In 2011, the EPA decided to regulate perchlorate. The regulation process is still in progress and is described in more detail in Section 1.5.2.2.2.
The EPA decided that another contaminant included in the CCL2, methyl tertiary-butyl ether (MTBE), required further research on its health effects and additional occurrence data before a possible regulation could be determined. MTBE was placed onto the UCMR2 list to collect occurrence data in large, medium, and small public water supply systems. MTBE remains on CCL4 (Section 1.5.1.4).
1.5.1.3 CCL3 and UCMR3
The method for developing the CCL was modified for CCL3 based on National Drinking Water Advisory Council (NDWAC) recommendations. The process began with identifying 7,500 potential chemical and microbial contaminants in the “CCL3 Universe.” This list was narrowed to 560 potential contaminants on the preliminary CCL (PCCL) based on their potential to occur in public water systems and to create a public health concern. The final published version of CCL3, released in 2009, included 104 chemicals or chemical groups and 12 microbiological contaminants.
In June 2011, the EPA presented occurrence data for 32 chemicals from the CCL3. The final Reg-Det 3 was published in early 2016. The EPA decided not to regulate dimethoate, 1-3-dinitrobenzene, terbufos, and terbufos sulfone. The decision to regulate strontium was delayed to allow more time to consider additional data.
UCMR3 was published in the Federal Register on May 2, 2012. Two contaminants, sec-butylbenzene and n-propylbenzene, were removed to make room for Cr-6 and total chromium on the final list of 30 contaminants (28 chemicals and 2 viruses). Large water systems (serving >100,000 people) were required to provide location and inventory information to EPA by October 1, 2012, to prepare for 12 months of UCMR3 monitoring required between January 1, 2013, and ending in December 2015. However, the dataset is not yet complete. Data are expected to be reported to EPA through the summer of 2016.
1.5.1.4 CCL4 and UCMR4
The CCL4 was finalized on November 17, 2016. The final list includes 97 chemicals or chemical groups and 12 microbial contaminants. Among them are chlorate, NDMA and four other nitrosamines, perflurooctanesulfonic acid (PFOS), and perfluorooctanoic acid (PFOA). Section 1.5.2 discusses these contaminants in more detail, since they are likely candidates for future regulations. Potential Fourth Regulatory Determinations (Reg-Det 4) are also discussed.
The fourth UCMR was proposed on December 11, 2015 and contains 30 chemical contaminants to be monitored between 2018 and 2020. Ten cyanotoxins, which have become an EPA concern in recent years due the increased frequency of algal blooms, are included in UCMR4. Cyanotoxins are also included as a group within the Final CCL4. Section 1.5.2 presents additional details relating to cyanotoxins.
1.5.2 Anticipated Future Regulatory Action
As of June 2015, the EPA is expected to complete a number of new drinking water regulations in the near future. Scheduled regulatory actions include the Fourth Regulatory Determination (Reg-Det 4), Reg-Det 4 Regulations (if the EPA decides to regulate), and the Third 6-Year Review. Table 1.6 lists these regulatory actions.
Table 1.6 also lists the specific contaminants that future regulations are anticipated for as well as existing rules expected to be revised. The following sections discuss these potential future regulations and other related areas of potential future regulatory action.
1.5.2.1 Regulatory Reviews In-Progress
1.5.2.1.1 Fourth Regulatory Determination
Every five years, the SDWA requires the EPA to make regulatory determinations about whether to promulgate a new regulation on at least five contaminants. In Reg-Det 1, Reg-Det 2, and Reg-Det 3, the EPA decided not to regulate 24 contaminants under consideration. A new national regulation was deemed unable to provide the “meaningful opportunity for risk reduction” that the SDWA requires. The EPA can make “off-cycle” determinations, as was done when considering a new perchlorate MCL in 2011.
The most likely candidates for positive regulatory action in Reg-Det 4 or off-cycle action are nitrosamines, chlorate, and PFOA, and PFOS. Strontium is also a possible candidate for
regulation in the near future; it was included in CCL3 and selected for further analysis to determine if regulation would be beneficial. Section 1.5.2.2 discusses each of these contaminants in greater detail.
| Regulatory Action | Proposal Date(1) | Final Date(1) |
|---|---|---|
| Reg-Det 4 | 2015 (Draft) | 2019 or 2020 |
| Reg-Det 4 Regulations (if EPA makes positive determination to regulate) | ----------- | 2019 or 2020 |
| Third Six-Year Review | 2016 | 2017 |
| Strontium | 2017 or 2018 | 2018 or 2019 |
| Perchlorate | 2015 or 2016 | 2017 or 2018 |
| Nitrosamines | 2019 or 2020 | 2022 or 2023 |
| Chlorate | 2019 or 2020 | 2022 or 2023 |
| PFOA/PFOS | 2019 or 2020 | 2022 or 2023 |
| Cyanotoxins | 2019 or 2020 | 2022 or 2023 |
| LT-LCR | 2016 or 2017 | 2018 or 2019 |
| Fluoride | ||
| Hexavalent Chromium | ||
| The Radon Rule | ||
| cVOCs | 2015 or 2016 | 2018 |
| Toxic Organic Chemicals | ||
| Emerging DBPs | ||
| Notes: | ||
| (1) Dates based on currently available regulatory information and are subject to change. | ||
1.5.2.1.2 Third Six-Year Review
The EPA will propose the Third Six-Year Review of existing drinking water regulations in 2016. To determine whether revisions are needed, the SDWA requires the EPA to review its drinking water regulations every six years in light of advances in the fields of health effects, analytical methodologies, treatment, and occurrence data.
In a separate but related effort, the EPA issued a plan in August 2011 to review of all of its regulations to comply with Executive Order 13563. This order requires retrospective review of regulations to ensure that regulations are up to date and serve their intended purpose.
The EPA listed the Long-Term LCR Revisions and the LT2 Rule in this plan for a potential review. Other chemicals that could also be revisited include fluoride, a revision of total
1.5.2.2 Anticipated Regulatory Changes
This section describes the specific contaminants and rules likely receiving regulatory action in the future.
1.5.2.2.1 Strontium
Used in pyrotechnics and fertilizers, strontium is naturally occurring and can enter waterways through rock and soil weathering. Strontium has shown to impair bone growth in rats and has been used as a surrogate for calcium in human osteoporosis patients.
Because higher calcium levels are required during human development, strontium is expected to accumulate more aggressively in the bones of children. Therefore, exposure risks are expected to be greater for children than adults. The health reference level (HRL) established for strontium is 1.5 mg/L, which was lowered from 4.2 mg/L in 2014. The HRL is a non-regulatory level in drinking water at which no adverse health effects occur over a period of time.
Between 1984 and 1985, the National Inorganics and Radionuclides Survey (NIRS) sampled over 900 PWSs with groundwater. The results from the Tampa Bay area indicate strontium concentrations between 2.2 and 4.2 mg/L. Strontium was included and shortlisted in CCL3. However, UCMR3 monitoring results indicated relatively low occurrence, with only 5.7 percent of PWSs reporting concentrations greater than the reference concentration of 1.5 mg/L. As such, in Reg-Det 3, the EPA postponed the decision to regulate strontium to gain more occurrence data. If a regulation is proposed, publication is expected by early 2019.
1.5.2.2.2 Perchlorate
Perchlorate is both a naturally occurring and manmade chemical used to manufacture fireworks, explosives, flares, and rocket propellant. Perchlorate primarily targets the thyroid in humans that have ingested it.
The perchlorate MCLG development has several complex scientific issues. EPA’s Physiologically Based Pharmacokinetic (PBPK) model and the EPA’s “life-stages” analysis could set a precedent for future regulations considering infants and toddlers consume more water per body weight than adults.
Until the regulation specifics are determined, the EPA issued an interim lifetime drinking water health advisory of 15 µg/L. State-specific enforceable drinking water regulations for perchlorate have been established by Massachusetts (2 µg/L) and California (6 µg/L). Florida has not developed a regulation.
In 2011, the EPA reversed its initial determination from 2008 to not regulate perchlorate. The Science Advisory Board (SAB) Perchlorate Advisory Panel finalized its review of the basis for a perchlorate MCLG. On June 3, 2016, a request for nominations was sent for peer review of the approaches to deriving the MCLG.
1.5.2.2.3 Nitrosamines
Nitrosamines are a group of compounds that form from reactions of nitrate and secondary amines, some of which are carcinogens. Current regulatory discussions have focused on regulating nitrosamines as a group; if so, NDMA would almost certainly be included.
Nitrosamines meet the first two of the three SDWA criteria for regulating a new contaminant: one, NDMA and other nitrosamines are carcinogens, and two, UCMR2 data show that NDMA and other nitrosamines occur frequently enough to warrant considering regulatory action. Significant debate remains over whether this suite of chemicals meets the third criterion of regulation meaningfully reducing the health risk.
Chloraminated systems make up over half of the PWSs that would be affected by a nitrosamine rule. Although numerous potential treatment options exist, many conflict with other regulations. Also, new treatment research at pilot- or full-scale is needed before the risk assessment (which would include a cost component) can be completed. More information on this topic is anticipated to become available over the next few years as Reg-Det 4 progresses.
1.5.2.2.4 Chlorate
Chlorate can form during liquid hypochlorite storage and after disinfection with chlorine dioxide. Ingesting chlorate can cause methemoglobin and decreased thyroid function.
The EPA shortlisted chlorate for CCL3 and included it in the Draft CCL4. In 2014, the AWWA found that a future regulation for chlorate is likely. Though no positive regulatory actions were included in Reg-Det 3, chlorate remains a likely candidate for regulation in Reg-Det 4.
1.5.2.2.5 PFOA/PFOS
PFOS and PFOA are fluorinated organic chemicals used to produce water-, grease-, stain-resistant carpets, clothing, furniture fabrics, food packaging, etc. PFOS and PFOA have also been used in various industrial processes. Between 2000 and 2002, the primary PFOS manufacture, 3M, volunteered to phase out production with these chemicals. However, drinking water can still be contaminated if industries using them are nearby.
Health impacts from exposure to PFOS and PFOA can cause developmental, cancer, liver effects, immune, and thyroid effects, among others. In 2016, the EPA published a lifetime health advisory of 70 ppt for PFOA and PSOS. The EPA has included PFOA and PFOS in CCL4 and will investigate their health effects and occurrence data to determine whether there's an opportunity for regulation. Nonetheless, City of Tampa will not likely have
1.5.2.2.6 Cyanotoxins
Algal blooms can release algal toxins, known as cyanotoxins, in drinking water treatment plants and, subsequently, distribution systems and are becoming more frequent in temperate regions. The health effects from cyanotoxin exposure vary based on the type of toxin but can include gastrointestinal effects, rashes and other irritant effects, liver damage, kidney damage, and others.
On June 17, 2015, the EPA published drinking water health advisories for two toxins: microcystins (preschool age and younger: 0.3 µg/L, school-age children through adults: 1.6 µg/L) and cylindrospermopsin (preschool age and younger: 0.7 µg/L, school-age children through adults: 3.0 µg/L). On the same date, the EPA also published Recommendations for Public Water Systems to Manage Cyanotoxins in Drinking Water.
On August 7, 2015, the SDWA (Section 1459) was amended for Algal Toxin Risk Assessment and Management. The EPA was directed by Section 1459 to develop a strategic plan for assessing and managing risks from algal toxins in public drinking water systems. In November of 2015, the EPA submitted the Algal Toxin Risk Assessment and Management Strategic Plan for Drinking Water to Congress.
Ten cyanotoxins are included in the EPA's UCMR4; occurrence data for raw and finished water will be collected between 2018 and 2020. Cyanotoxins as a group are included in the Draft CCL4. The EPA is collaborating with states, utilities, and laboratories to evaluate analytical methods. The EPA will also continue to evaluate the health effects from cyanobacteria.
In May of 2015, the City of Tampa conducted an algal toxin sampling campaign to test for microcystin/nodularin (MCs), cylindrospermopsin (CYN), and anatoxin-a (ANTX-a). Sampling locations included the Hillsborough River raw water intake, two locations within the river, and finished water sampled at the operations tap. None of these toxins were found above the reporting limits (MCs: 0.15 ug/L, CYN: 0.05 ug/L, ANTX-a: 0.10 ug/L) at any location tested.
1.5.2.2.7 Lead and Copper Rule Revisions
The EPA is developing a proposal to modify the current Lead and Copper Rule to address a number of long-term issues and new health research data, such as that from the Centers for Disease Control (CDC). Requirements the EPA is considering include:
- Modifying partial LSLR requirements; issues include control versus ownership and potentially supplying filters to households with partial LSLR.
- Optimizing corrosion control and water quality parameters.
- Changing sample site selection criteria; the EPA is considering shifting the focus on sampling to homes, schools, and daycare centers with lead service lines (LSL) as opposed to the homes with lead service lines or lead solder.
- Changing the sampling protocol; systems with lead LSLs may have to collect a LSL water sample, and the flushing interval could depend on LSL length.
- Changing tap sampling and sampling protocols; the EPA is considering sampling for water in the LSL (i.e., the compliance sample would capture water from the LSL rather than the current “first flush” sampling).
Sample site selection could potentially affect all systems. Revising all LCR sampling plans and getting primacy agency approval for the revisions would be a significant effort for both systems and states. Tightening the range of allowable water quality parameters is one possible outcome of the revisions. Revisions to the Lead and Copper Rule are under development.
1.5.2.2.8 Fluoride
In 2015, the federal Department of Health (DOH) recommended changing the optimal fluoride concentration in drinking water from a range of 0.7 mg/L to 1.2 mg/L to 0.7 mg/L. The EPA is evaluating the existing primary and secondary drinking water regulations for fluoride, which are 4 mg/L and 2 mg/L, respectively. Revisions to the existing fluoride regulations may be proposed after the SY3 Review.
The City of Tampa adds and monitors fluoride concentrations every day and reports the values in MORs. From January to June 2016, fluoride concentrations ranged from 0.20 mg/L to 0.69 mg/L, averaging 0.65 mg/L. This means the City has maintained fluoride concentrations below the recommended level of 0.7 mg/L in 2016. However, the City should be cautious not to exceed this level if regulations change.
1.5.2.2.9 Hexavalent Chromium
In 1991, total chromium was regulated at 100 µg/L. Over the past few years, the EPA has been developing a draft risk assessment for hexavalent chromium (Cr-6), although an MCL is still in the early stages. Total and Cr-6 monitoring were also included in UCMR3, the results of which indicate widespread occurrence of total and Cr-6. Of the reporting PWSs, 74 percent had chromium results greater than the minimum reporting level (MRL) of 0.2 µg/L, and 89 percent had hexavalent chromium results greater than the MRL of 0.03 µg/L. However, chromium exceeded the MCL of 100 µg/L at only one PWS.
The oral reference dose for hexavalent chromium is listed as 0.003 mg/kg-day, which corresponds to a drinking water equivalent level (DWEL) of 105 µg/L. Initial draft risk assessments prepared by the State of California (2009) and by the EPA (2010) indicated that Cr-6 is a carcinogen at very low oral exposures.
In July 2011, California finalized its Public Health Goal (PHG) with a 1 in a million risk level of 20 ng/L based in part on its potential risks to children. California also established an MCL of 10 µg/L for Cr-6, which became effective on July 1, 2014. These assessments were based on animal studies using Cr-6 doses several orders of magnitude higher than that found in drinking water.
Once the final risk assessment is published, the EPA will determine whether to promulgate a Cr-6 MCL. This could be part of the Third Six-Year Review decision or could be done off-cycle.
1.5.2.2.10 The Radon Rule
The Radon Rule, which will establish an MCL for radon, was proposed on November 2, 1999. The proposed MCL is 300 PCi/L, which will apply only to community water systems using groundwater or mixed ground and surface water. No significant additional action on this potential rule has occurred.
1.5.2.2.11 Carcinogenic Volatile Organic Compounds
The EPA announced that Carcinogenic Volatile Organic Compounds (cVOCs) would be the first group regulated under the agency’s new Drinking Water Strategy to regulate contaminants as groups. In its fact sheet, the EPA listed eight currently regulated cVOCs that would likely be included in this regulation and eight unregulated cVOCs that could also be included.
The number or type of unregulated cVOCs included in this regulation is not yet known. The EPA is still collecting occurrence and treatment data to determine this. Potential co- occurrence, as well as common treatment, will likely be factored into the decision.
This group regulation also links with EPA’s efforts to revise the MCLs for trichloroethylene (TCE) and tetrachloroethylene (PCE) as part of its second Six-Year Review of existing drinking water regulations (74 FR 15500). In this notice, the EPA showed its analysis of the potential impacts of lowering both MCLs from the current standard of 5 ng/L to 1 ng/L and 0.5 ng/L. At this point, these should be considered regulatory “targets” that the EPA is seriously considering.
Thus, any groundwater system detecting either TCE or PCE -- even if they are below the current standards -- should follow the cVOC regulation's development. This regulation will not likely affect the City of Tampa. However, these compounds should be considered when evaluating TAP in the future.
1.5.2.2.12 Toxic Organic Chemicals
It is still not fully understood whether toxic organic chemicals (TOrCs), such as pharmaceutical and personal care products (PPCPs) and endocrine-disrupting compounds (EDCs), pose a significant exposure risk to humans or wildlife. Significant debate continues
over the use and subsequent release of antibiotics and natural/synthetic steroids to the environment. These compounds have been researched since the 1990s. However, numerous other drug classes, bioactive metabolites, transformation products, and personal care products have yet to be examined. For over 20 years, certain physiologically active compounds, such as caffeine, aspirin, and sex steroids, have been known to enter the environment, primarily via treated and untreated sewage effluents. The EPA is studying the effects of PPCPs and has not proposed regulations yet. However, as more information emerges over the next five to ten years, the EPA may regulate these products. Much of the ongoing research is over where and how TOrCs should be treated. Options include drug take-back programs to keep them out of the water, treatment at wastewater treatment plants, and treatment at drinking water plants. Research suggests that advanced oxidation processes, such as ultraviolet irradiation with peroxide (UV/H2O2), remove many PPCPs. TOrCs are of particular concern in direct and indirect potable reuse applications. While the City does not currently use direct potable reuse (DPR) or indirect potable reuse (IPR), TAP is evaluating options for IPR. Section 1.6 discusses TAP in more detail.
1.5.2.2.13 Emerging Disinfection Byproducts
Numerous potential significant disinfection byproducts continue to be researched. For example, iodo-substituted HAAs and THMs have shown to form under certain conditions when drinking water is chloraminated. Bromate has also been the subject of research. Although no regulations are currently proposed, the EPA may regulate some of the emerging DBPs as more information emerges.
1.6 ABILITY TO ADDRESS REGULATIONS IN THE FUTURE
This section evaluates the DLTWTF's ability to address future regulations and other anticipated changes as well as current compliance with existing regulations. This section also evaluates the removal of contaminants that are unregulated or have regulations under review and are monitored by the City. Anticipated challenges are evaluated according to the treatment technologies used at DLTWTF, upcoming regulations, and the possible implications of TAP.
1.6.1 Current Compliance
The City complies with the existing applicable regulations, including the most recent regulatory updates.
1.6.2 Anticipated Challenges
This section highlights specific anticipated events, including regulations and upcoming projects that may affect the DLTWTF. Since the City is not required to monitor all unregulated contaminants, further analysis is needed to fully assess the expected implications of anticipated regulations. This section discusses areas of concern given the existing information.
1.6.2.1 DLTWTF Data Related to Anticipated Regulations/Regulatory Changes
Data are available for select contaminants included in EPA monitoring plans as well as for contaminants with existing regulations that are expected to change.
As part of the EPA occurrence evaluation study, the City monitored total chromium and three unregulated contaminants (UCs) in 2014 and 2015: hexavalent chromium, strontium, and vanadium. Each contaminant was measured in July 2014, October 2014, January 2015, and April 2015. The results of the sampling campaign were published in the 2015 Water Quality Report.
The highest detected levels were 0.51 µg/L for total chromium, 0.110 µg/L for hexavalent chromium, 270 µg/L for strontium, and 0.26 µg/L for vanadium. Chromium levels were well below the current MCL of 100 µg/L. Detected hexavalent chromium levels were below the DWEL of 105 µg/L and also below the MCL established in California of 10 µg/L. Similarly, detected strontium levels were below the HRL of 4.2 mg/L. In the final CCL3 information sheet, the EPA includes a HRL of 21 µg/L for vanadium. DLTWTF's concentrations were substantially lower than this HRL.
The EPA is evaluating primary and secondary fluoride recommendations. Fluoride concentrations at the DLTWTF are consistently well below the existing regulations and will likely continue to be below a revised regulation.
However, the new DOH recommended an optimal fluoride concentration of 0.7 mg/L, which poses a possible concern for DLTWTF. While concentrations at DLTWTF are typically below this level, concentrations from January to June 2016, ranging from 0.20 mg/L to 0.69 mg/L averaging 0.65 mg/L, do approach this level. Thus, the City should continue to monitor this regulation and adjust operations if needed to remain in compliance.
1.6.2.2 The Tampa Augmentation Project
TAP is evaluating options for using natural treatment systems to enhance the quality of effluent from the Howard F. Curran Advanced Wastewater Treatment Plant (HFCAWWTP) to deliver as a source of potable water. These options include: 1) using manufactured wetland treatment systems and rapid infiltration basins to deliver additional water to the Tampa Bypass Canal and 2) using a recharge/recovery system to store and recover reclaimed water in the Florida Aquifer System (FAS) for subsequent delivery to the Hillsborough River Reservoir. Each alternative will supplement water sources that currently
1.7 SUMMARY AND CONCLUSIONS
Anticipated regulations and regulatory changes were evaluated for their potential impacts on existing treatment processes at DLTWTF and for any considerations to account for when evaluating future treatment process changes. Table 1.7 lists the anticipated regulations and describes the expected implications at DLTWTF.
| Contaminant | Considerations for DLTWTF |
|---|---|
| Strontium | As discussed in Section 1.5.2.2.1, measured concentrations in surface water on a national level are typically below 1.5 mg/L, while concentrations measured in PWSs with groundwater sources in the Tampa Bay area were found to be above the current HRL of 1.5 mg/L. Occurrence data collected for UCMR3 indicate low strontium occurrence within PWSs. Despite the low occurrence, the City should consider monitoring to better assess their situation, especially before and after implementing TAP. For treatment, removals of only 12 percent have been shown for alum or ferrous sulfate coagulation, while lime softening has been shown to remove 73 percent. Nanofiltration (NF) and reverse osmosis (RO) have demonstrated high removals (90 to 95 percent). Ion exchange is also expected to efficiently remove strontium, though literature related to the removal of strontium from drinking water via ion exchange is limited. |
| Perchlorate | Biofiltration via granular activated carbon (GAC) filters has been shown at the pilot scale to remove >95 percent of influent perchlorate when influent nitrate concentrations are low (<0.1 mg/L). Therefore, perchlorate may be removed to low levels at DLTWTF, which employs Biofiltration within GAC filters. The City should consider monitoring and bench-scale tests to determine if these high removals can be achieved. Additional treatment technologies for perchlorate removal include ion exchange, RO, and fixed-bed biological treatment. |
| Nitrosamines | NDMA may become a greater concern after implementing TAP. Though ozonation at DLTWTF may increase NDMA formation potential levels, biofiltration has shown to remove more than 80% of influent NDMA. Additional treatment technologies used for NDMA reduction include ultraviolet (UV) radiation, microfiltration (MF), and RO. The City should be proactive in following the development of NDMA advisory levels and the possible promulgation of a regulation. Monitoring and bench- or pilot-scale work may help to assess the City's ability to meet future regulations. |
| Contaminant | Considerations for DLTWTF |
|---|---|
| PFOA/PFOS | PFOA/PFOS can be a concern where industries using PFOA/PFOS or their precursors in production are nearby. Byproducts from these industries can contaminate water sources and become a concern for utilities. Additionally, wastewater treatment can serve as an indirect source of PFOA/PFOS. At the moment, these contaminants are not expected to be an issue for DLTWTF. However, testing is recommended to evaluate the current influent and additional testing after TAP. In the unlikely event that measured concentrations are above the EPA's health advisory level, the City will need to look into advanced treatment (e.g., granular activated carbon, nanofiltration, reverse osmosis, or ion exchange), since removal via the current treatment processes is not likely. |
| Cyanotoxins | Algae are an existing problem at DLTWTF, suggesting that the City of Tampa should consider toxic algae blooms and their treatment requirements. Research has shown that a number of the treatment processes employed at DLTWTF can remove cyanotoxins, including coagulation/flocculation, ozonation, biological filtration, and possibly chlorination. However, oxidants may also lyse cyanobacteria cells and release the toxins. An effective supplemental treatment method is to add powdered activated carbon (PAC). The City should also consider optimizing existing system for cyanotoxins before deciding on alternative treatment technologies that may not remove these toxins as well. |
| Fluoride | If regulatory changes for fluoride are implemented that restrict levels to around 0.7 mg/L, the City should revise its treatment practices. Current practices result in fluoride levels well below the existing limits but close to the optimal recommended concentration of 0.7 mg/L. |
| Hexavalent Chromium | Based on the DLTWTF's testing in 2014 and 2015, the regulation hexavalent chromium will not likely require treatment operations changes, since the sampled levels were very low. However, the City should follow the regulation progress and reevaluate the situation if needed based on the selected MCL. The most effective treatment technologies for reducing hexavalent chromium (to 2 µg/L or less) are strong base anion exchange (SBA-IX), RO, and weak base anion exchange (WBA-IX). Reduction coagulation filtration (RCF) has also been shown to remove hexavalent chromium to 5 µg/L. |
| TOrCs | TOrCs may become a greater concern for the City once TAP is implemented and should be assessed thoroughly as part of that project's investigations. Ozone and biological filtration are possible treatment technologies. |
Chapter 2
FACILITIES EVALUATION AND CONDITION ASSESSMENT
2.1 CHAPTER SUMMARY
Carollo Engineers visually inspected the facility to inventory the above-ground assets and assessed their current condition to develop a 15-year comprehensive master plan.
The assessments were recorded in the Water Research Foundation's Water Infrastructure Manager Software database using similar nomenclature and terminology already in use. The City can utilize the access database and/or excel database generated by the software for integration into the City’s computerized maintenance management system.
Considering the assets vary widely in age, Carollo deemed the David L. Tippin Water Treatment Facility (DLTWTF) in overall fair condition. Nonetheless, the DLTWTF is very well maintained. Thus, the decision to replace an asset was determined using condition and criticality, not just age. The timing of replacement was based on the calculated evaluated remaining useful life (EvRUL) and calculated risk, a function of condition and criticality.
2.2 INTRODUCTION
This chapter presents the results of the facilities evaluation and condition assessment. It determines the status, condition, and functionality of the existing facilities by assessing the structural, mechanical, electrical, and architectural aspects of the DLTWTF's assets.
The facilities evaluation and condition assessment were completed alongside regulatory, hydraulic, and process evaluations to optimize and expand the DLTWTF. Depending on the process, hydraulic, or alternatives evaluation results and recommendations, assets in fair to very poor condition may not be recommended for replacement. For example, because Chapter 5 recommends a new chlorine system and new flocculation system, this chapter does not recommend improvements to these systems based on their condition. Furthermore, Chapter 5 also proposes a new high-service pump station, meaning modifications to the existing suction and discharge piping for High-Service Pumps 1 through 4 is not required.
Deficiencies are noted where they may adversely affect treatment process performance, operations, and facility expansion (capacity) and where the remaining useful life of the components would likely expire during the master plan's 15-year planning horizon.
The facilities evaluation and condition assessment assessed the following:
- Structural condition of water-bearing structures, buildings, and other structural components.
- Chemical feed and storage systems condition.
- Electric power supply and distribution systems, such as the main switchgear, motor control center, and transformers.
- Treatment process and non-process mechanical equipment, such as HVAC, plumbing, and fire suppression systems.
- The criticality and vulnerability of plant components relative to their impact on treatment, plant capacity, plant reliability, pumping, and ability to meet the City's established level of service if the asset partially or completely failed.
- Non-destructive testing, including infrared thermography, visual inspections, sound measurements (decibel readings), and ultrasonic pipe testing (limited to stainless steel piping).
The assessments were recorded using the Water Research Foundation's Water Infrastructure Manager Software database using the same nomenclature and terminology already in use. With the help of a programmer, the City can integrate this database into its own computerized maintenance management system (CMMS), MaintScape, to develop reports based on condition, criticality, unit type, or discipline. More information on the software is included in a Section 2.3.6.
2.2.1 Recently Completed, Ongoing, and Upcoming DLTWTF Improvement Projects and Studies
Where applicable, upcoming projects and studies are listed with a brief scope description based on Carollo's interpretation. These projects will be considered when making recommendations in the master plan. If an asset was rated in very poor condition but will be addressed in one of the following projects, no further project recommendation was made:
- Studies and Planning
- Sludge Processing Facility (SPF) Dewatering Improvement Study - Adding two duty and one standby belt filter presses (BFPs) sized to process up to 30 dry tons of sludge per day to replace existing three BFPs, and demolishing remaining three BFPs.
- Potable Water System Master Plan
- DLTWTF Building Improvements (Administration, Pumping House, Maintenance) and Site Improvements -
- Adding library, flex office, and small storage space within existing administration building.
- Cleaning, repainting, and repairing exterior and interior of main pump building that houses raw water and high service pumps, and updating lighting, restoring lower floor restroom, replacing exterior doors, improving signage, and replacing guard and hand rails.
- Remodeling and replacing the third floor of the maintenance building. Adding new lighting and cleaning and repainting the first floor.
- Adding new electrical receptacles and branch circuits and fire protection in administration and main pump buildings.
- Railroad Side Track Drainage and Structural Improvements
- Lime Slaker and Lime Building Improvements
- Adding a new lime slaker with new electrical building and new lime feed system and dosing points.
- Aqueous Ammonia Conversion
- Actiflo™ Mixer Motor Replacements
- Ferric and Acid Tank Rehabilitation
- Design (D) and Design/Build (D/B)
- SCADA Improvements (D/B).
- North Tampa Water System Improvements (D/B).
- Security Improvements (D/B).
- Emergency Generator No. 4 (D/B).
- To include repair and rehabilitation of existing generator assets
- Administration Building Structural Improvements (D).
- To include repairs and rehabilitation of Old Raw Water Pump Building
- SPF Site Improvements (D).
- Construction
- Blue Sink Pumping Station and Pipeline.
- Morris Bridge Re-pump Station VFD Conversion.
- Chlorine Piping and Related Improvements - Chemical Building.
- Mechanical Rotating Screens #1-3 Rehabilitation
- Clarifier Drive #4 Replacement
- Internal Initiatives and Projects
- Actiflo™ Lamella Tube Replacement
- Bio-filtration Study (with Water Research Foundation).
- Alternative Ozone Feed Protocol.
- Ferric Dosage Optimization Using UV Analyzers.
- Hydrated Lime Evaluation.
- Research Laboratory Equipment and Furnishings.
- Historian/SCADA Improvements.
- Sludge Thickener No. 4 Drive Replacement.
- Document Management Improvement Initiative (Yard Piping, Sludge System Piping, Transmission/Storage System, 3-D Modeling, As-built Drawings).
- Prospective Projects
- SPF Dewatering and Polymer System Improvements.
- Sedimentation Tank Concrete Rehabilitation.
- Raw Water MCC and VFD Improvements.
- TBC/H.R. Reservoir Basin Transfers.
2.3 ASSET MANAGEMENT ASSUMPTIONS AND METHODOLOGY
The City provided an asset inventory database that Carollo refined to include assets worth $5,000 or more and assets that perform critical functions.
A multidisciplinary team, consisting of process, mechanical, structural, and electrical engineers, completed the condition assessments. Assessment teams included an assessment coordinator that directed the team, a project engineer that took photographs of each discrete asset and supported the discipline engineers, and senior discipline engineers.
Throughout the assessment, the assessment team asked the City's designated operators, mechanics, and electricians questions to gather an anecdotal history of maintenance and performance as well as each asset's importance to the DLTWTF and entire system.
The condition assessment included a field evaluation of the DLTWTF's above-ground assets. Each asset was assigned a condition and a corresponding remaining useful life, and a vulnerability score was calculated using the industry-accepted asset management approach.
Included as a CD with this master plan report for this assessment are Appendices A, B, and C. Appendix A contains a comprehensive list of the DLTWTF's assets, assigned conditions scores, and estimated remaining useful lives. Appendix B includes photos of the condition for each asset, and Appendix C includes the database file for the asset manager software.
To some extent, assets were also assessed for their obsolescence and the availability of replacement parts or components. Although an asset may be in satisfactory condition, unavailable replacement components can cause an asset to be taken out of service longer, require total replacement, or increase costs for replacement parts.
2.3.1 Asset Condition
The condition assessment team evaluated each asset's condition with a scale of 1 to 5 in accordance with the International Infrastructure Management Manual (IIMM). In the IIMM, condition is expressed in terms of the amount (percent) of repair needed to bring an asset to like-new (perfect) condition. Table 2.1 lists the definitions of each ranking from the IIMM.
For equipment not visible during the inspection, plant staff interviews, design criteria, and installation dates were used to estimate the condition.
| Ranking/Score(1) | Description(1) | Maintenance Level | Percentage of Asset Requiring Repair(2) | Condition Fraction(3) |
|---|---|---|---|---|
| 1 | Very Good | Normal | 0% | 1 |
| 2 | Good | Minor | 1-10% | 0.7 |
| 3 | Fair | Significant | 11-20% | 0.50 |
| 4 | Poor | Renew | 21-49% | 0.20 |
| 5 | Very Poor | Replace | 50% and above | 0.10 |
2.3.2 Criticality Assessment
This condition assessment included criticality scores to help calculate risk for the DLTWTF's 15-year CIP. Criticality is a measure of the consequence of asset failure and is scored using these five rankings:
- No Impact.
- Minor Impact.
- Moderate Impact.
- Severe Impact.
- Fatal Impact.
A "no impact" rating means the asset's failure has no consequence or impact to the total plant capacity, public health and safety, or the environment. Alternatively, a "fatal impact" rating means major or total plant shut down, significant public health and safety or environmental impacts, or a threat to clean drinking water if the asset fails.
Redundancy typically reduces an asset's criticality, since a redundant asset can maintain plant capacity during failure. Conversely, if the asset's timing for repair or replacement restricts plant capacity for an extended period of time, the criticality would be increased. The criticality score of some assets was higher if the asset's failure could significantly jeopardize public health and safety or the environment, even if plant capacity or water
2.3.3 Major Pumping Systems Evaluation
Three major pumping systems were evaluated at the DLTWTF: the Low Lift, Raw Water, and High-Service Pump Stations. The methodology used to assess these systems differed from the methodology in Section 2.3.1 and 2.3.2 because of the pumping systems' complexity and multiple considerations.
Like the other assets, each pump was assessed for condition and criticality. However, pump age, the time since last rebuild, vibration, and efficiency were also considered and scored. Each factor was then assigned a weighting factor, and an overall score was calculated. The factors were weighted as follows:
- Pump age (20 percent).
- Time since last rebuild (15 percent).
- Vibration (25 percent).
- Pump Efficiency (10 percent).
- Pump Condition (20 percent).
- Pump Criticality (10 percent).
Pump age, time since last rebuild, vibration, and pump efficiency were all scored according the City's documentation and records. Pump condition and criticality were determined during the field assessments.
A pump's overall score was calculated using the individual factor scores and their respective weights. The highest possible score was 5.0, signifying very poor condition. The lowest possible score was 1.0, representing very good condition.
2.3.4 Original Useful Life, Remaining Useful Life and Replacement
When determining if and when an asset should be rehabilitated or replaced, a number of factors must be considered. A capital improvement program should be planned using information on an asset's condition, criticality, vulnerability, risk, prioritization, and detailed cost data that estimates the expense to repair, rehabilitate, or replace the asset.
The following sections describe the methodology used to determine an asset's anticipated rehabilitation or replacement timing.
2.3.4.1 Original Useful Life and Remaining Useful Life
The condition fraction associated with each condition ranking was used to estimate the EvRUL. Table 2.1 lists these condition fractions. Additionally, for each asset type, the original useful life, or "design life," estimates were made. To calculate the number of remaining years, the observed condition was used instead of the installation date.
An asset's original useful life (OUL) is the number of years it is expected to be in service given the asset type (i.e., mechanical, structural, or electrical), as detailed in Table 2.2. This score is based on industry standard guidelines.
Conversely, an asset's remaining useful life (RUL) is determined by subtracting its number of years in service from that asset type's OUL. RUL is typically considered in assessments for which the condition is not available or known.
Accordingly, an asset in good condition is expected to have a large percentage of remaining useful life, regardless of when it was installed. This reflects the logic that once an asset deteriorates to a below-average condition, its probability of failure increases, and its remaining years in service decline more rapidly than assets that are maintained.
| Asset Type | Original Useful Life (years)(1) |
|---|---|
| Civil/Site Work | 50 |
| Yard Piping | 40 |
| Structural | |
| General/Other | 50 |
| Concrete | 50 |
| Fiberglass | 25 |
| Steel | 25(2) |
| Plastic | 10 |
| Mechanical | |
| General/Other | 20 |
| Valves | 35 |
| Pumps – Water | 15-20 |
| Chemical Equipment | 15 |
| Coolers/AC/Fans | 15 |
| Ozone Equipment | 20 |
| Electrical | |
| Electrical | 30 |
| Instrumentation | 15 |
| Computer Systems/SCADA | 7 |
Notes:
(1) These values were estimated based on a combination of the IIMM, USEPA guides, other industry references, and Carollo experience.
(2) Dependent on type of coating applied.
2.3.4.2 Evaluated Remaining Useful Life
If an asset's condition is known, EvRUL is used since it considers the asset's original useful life and the condition score. The EvRUL is calculated as follows:
EvRUL = Condition Fraction * OUL
The EvRUL is then used to determine an asset's vulnerability and risk of failure. The assigned condition fraction follows the logic that an asset deteriorates faster once it is in below-average condition. For this assessment, the EvRUL was used to determine the number of years each asset is expected to remain in service before needing replacement within the 15-year planning horizon.
Vulnerability is the probability (or likelihood) of asset failure, which can occur as physical failure (such as breaking), performance failure (loss of efficacy or efficiency), capacity failure (not able to meet increased demands), or technological obsolescence. Physical failure is an asset's most basic failure mode. An asset's vulnerability is inversely proportional to the EvRUL, where:
Vulnerability= 1/(Condition Fraction * 10)
2.3.5 Risk
Risk is the mathematical product of the criticality score and the vulnerability probability and is a relative indicator of priority/need for corrective action. The equation used to determine risk is as follows:
Risk = Criticality x Vulnerability
Based on the risk calculation, the maximum risk score an asset can have is 5, assuming an asset with fatal criticality is in very poor condition. The lowest risk score an asset can have is 0.1, assuming an asset with a "no impact" criticality factor is in very good condition.
Assets with higher risk rankings must be closely monitored and targeted for corrective or preventative action, including maintenance, repair, or replacement. The exception to this approach is when an asset's failure poses a safety risk to plant personnel. In this situation, the item will automatically receive a score of 5.
2.3.6 Water Research Foundation Water Treatment Plant Infrastructure Assessment Manager Software
The City provided a complete list of the DLTWTF's assets that was then used to develop an electronic database. For this effort, a software called Water Research Foundation Water Treatment Plant Infrastructure Assessment Manager was used, which organizes and records information and scores for condition assessments. This software helped organize the final database, which contained conditions, criticality, and supplemental information for the City.


With the software, one can evaluate the physical condition of water treatment plant systems and their relationship with the plant's water production capabilities. After performing an assessment, the software can generate reports to help assess the condition of water treatment infrastructure and identify the portions in most need of rehabilitation, repair, or replacement by assigning weights and criticalities to each asset in the database.
2.4 FACILITY INSPECTION AND FIELD OBSERVATIONS
The DLTWTF inspection and condition assessment occurred between June 27, 2016, and June 29, 2016. A summary of recommendations for assets requiring rehabilitation or replacement is included at the end of this chapter.
As stated previously, assets valued under $5,000 and not critical to plant operations were not evaluated. Additionally, the following items were not considered for this condition assessment:
- Instrumentation and controls, including flow meters, level sensors, turbidimeters, and SCADA systems, etc.
- Sample pumps.
- Piping and valves less than 6'' in diameter.
- Buried/inaccessible piping and valves (overall consideration was given to piping greater than 6" diameter based on age alone).
2.4.1 Raw Water System
The raw water system was assessed and evaluated in relation to the following major components:
- Plant intake structure.
- Intake bar rack.
- Grass rake system (including rake, hopper, and guide rails).
- Rotating Screens No. 1 through 3.
- Raw water pumps No. 1 through 9 (discussed in Section 2.4.9).
- Raw water piping and valves.
Items not evaluated in this system were as follows:
- Instrumentation and controls, including flow meters, level sensors, and turbidimeters, etc.
- Vacuum priming pumps.
2.4.1.1 Plant Intake
As previously noted, the DLTWTF receives raw water from the Hillsborough River. The raw water flows through a bar rack, which removes large debris, and then flows through mechanically rotated screens that remove additional debris. Raw water pumps then send the water to the conventional and Actiflo™ treatment processes.
The plant intake's structural components are in fair condition overall, with minor to moderate corrosion and concrete spalling noted. Installed in 2000, the plant intake transformer is in fair condition, needing cleaning, new gaskets, and an oil change. More details on the condition and calculated risk for this asset are included in the Appendix A.
2.4.1.1.1 Intake Bar Rack and Grass Rake Equipment
The intake bar rack, with 3'' openings, captures large debris before the rotating screens. The grass rake equipment removes debris from the bar rack and disposes it into a hopper.
This equipment is in overall poor condition. To remove debris from the rack, the grass rake equipment and hopper must be manually started and controlled, requiring an operator every time the rack needs to be cleaned (once per day).
Because of this equipment's age and the labor required to maintain it, replacement and automation are recommended. The grass rake structure, hopper, and rail system have moderate corrosion. The anchor bolts on the rake guide rail need replacement. Replacing the rail system, hopper, and anchor bolts is also recommended.
Figure 2.1 displays the condition photos for this equipment. Table 2.3 summarizes information about its installation, useful life, and condition scores.
| Discipline | Year Installed/ Rehabilitated | Original Useful Life (years) | Criticality | Condition | Condition Fraction |
|---|---|---|---|---|---|
| Mechanical | 1973 | 20 | Moderate | Poor | 0.20 |
| Structural | 1973 | 25 | Moderate | Fair | 0.50 |
| Electrical | 1973 | 30 | Moderate | Fair | 0.50 |
RAW WATER SYSTEM CONDITION PHOTOS
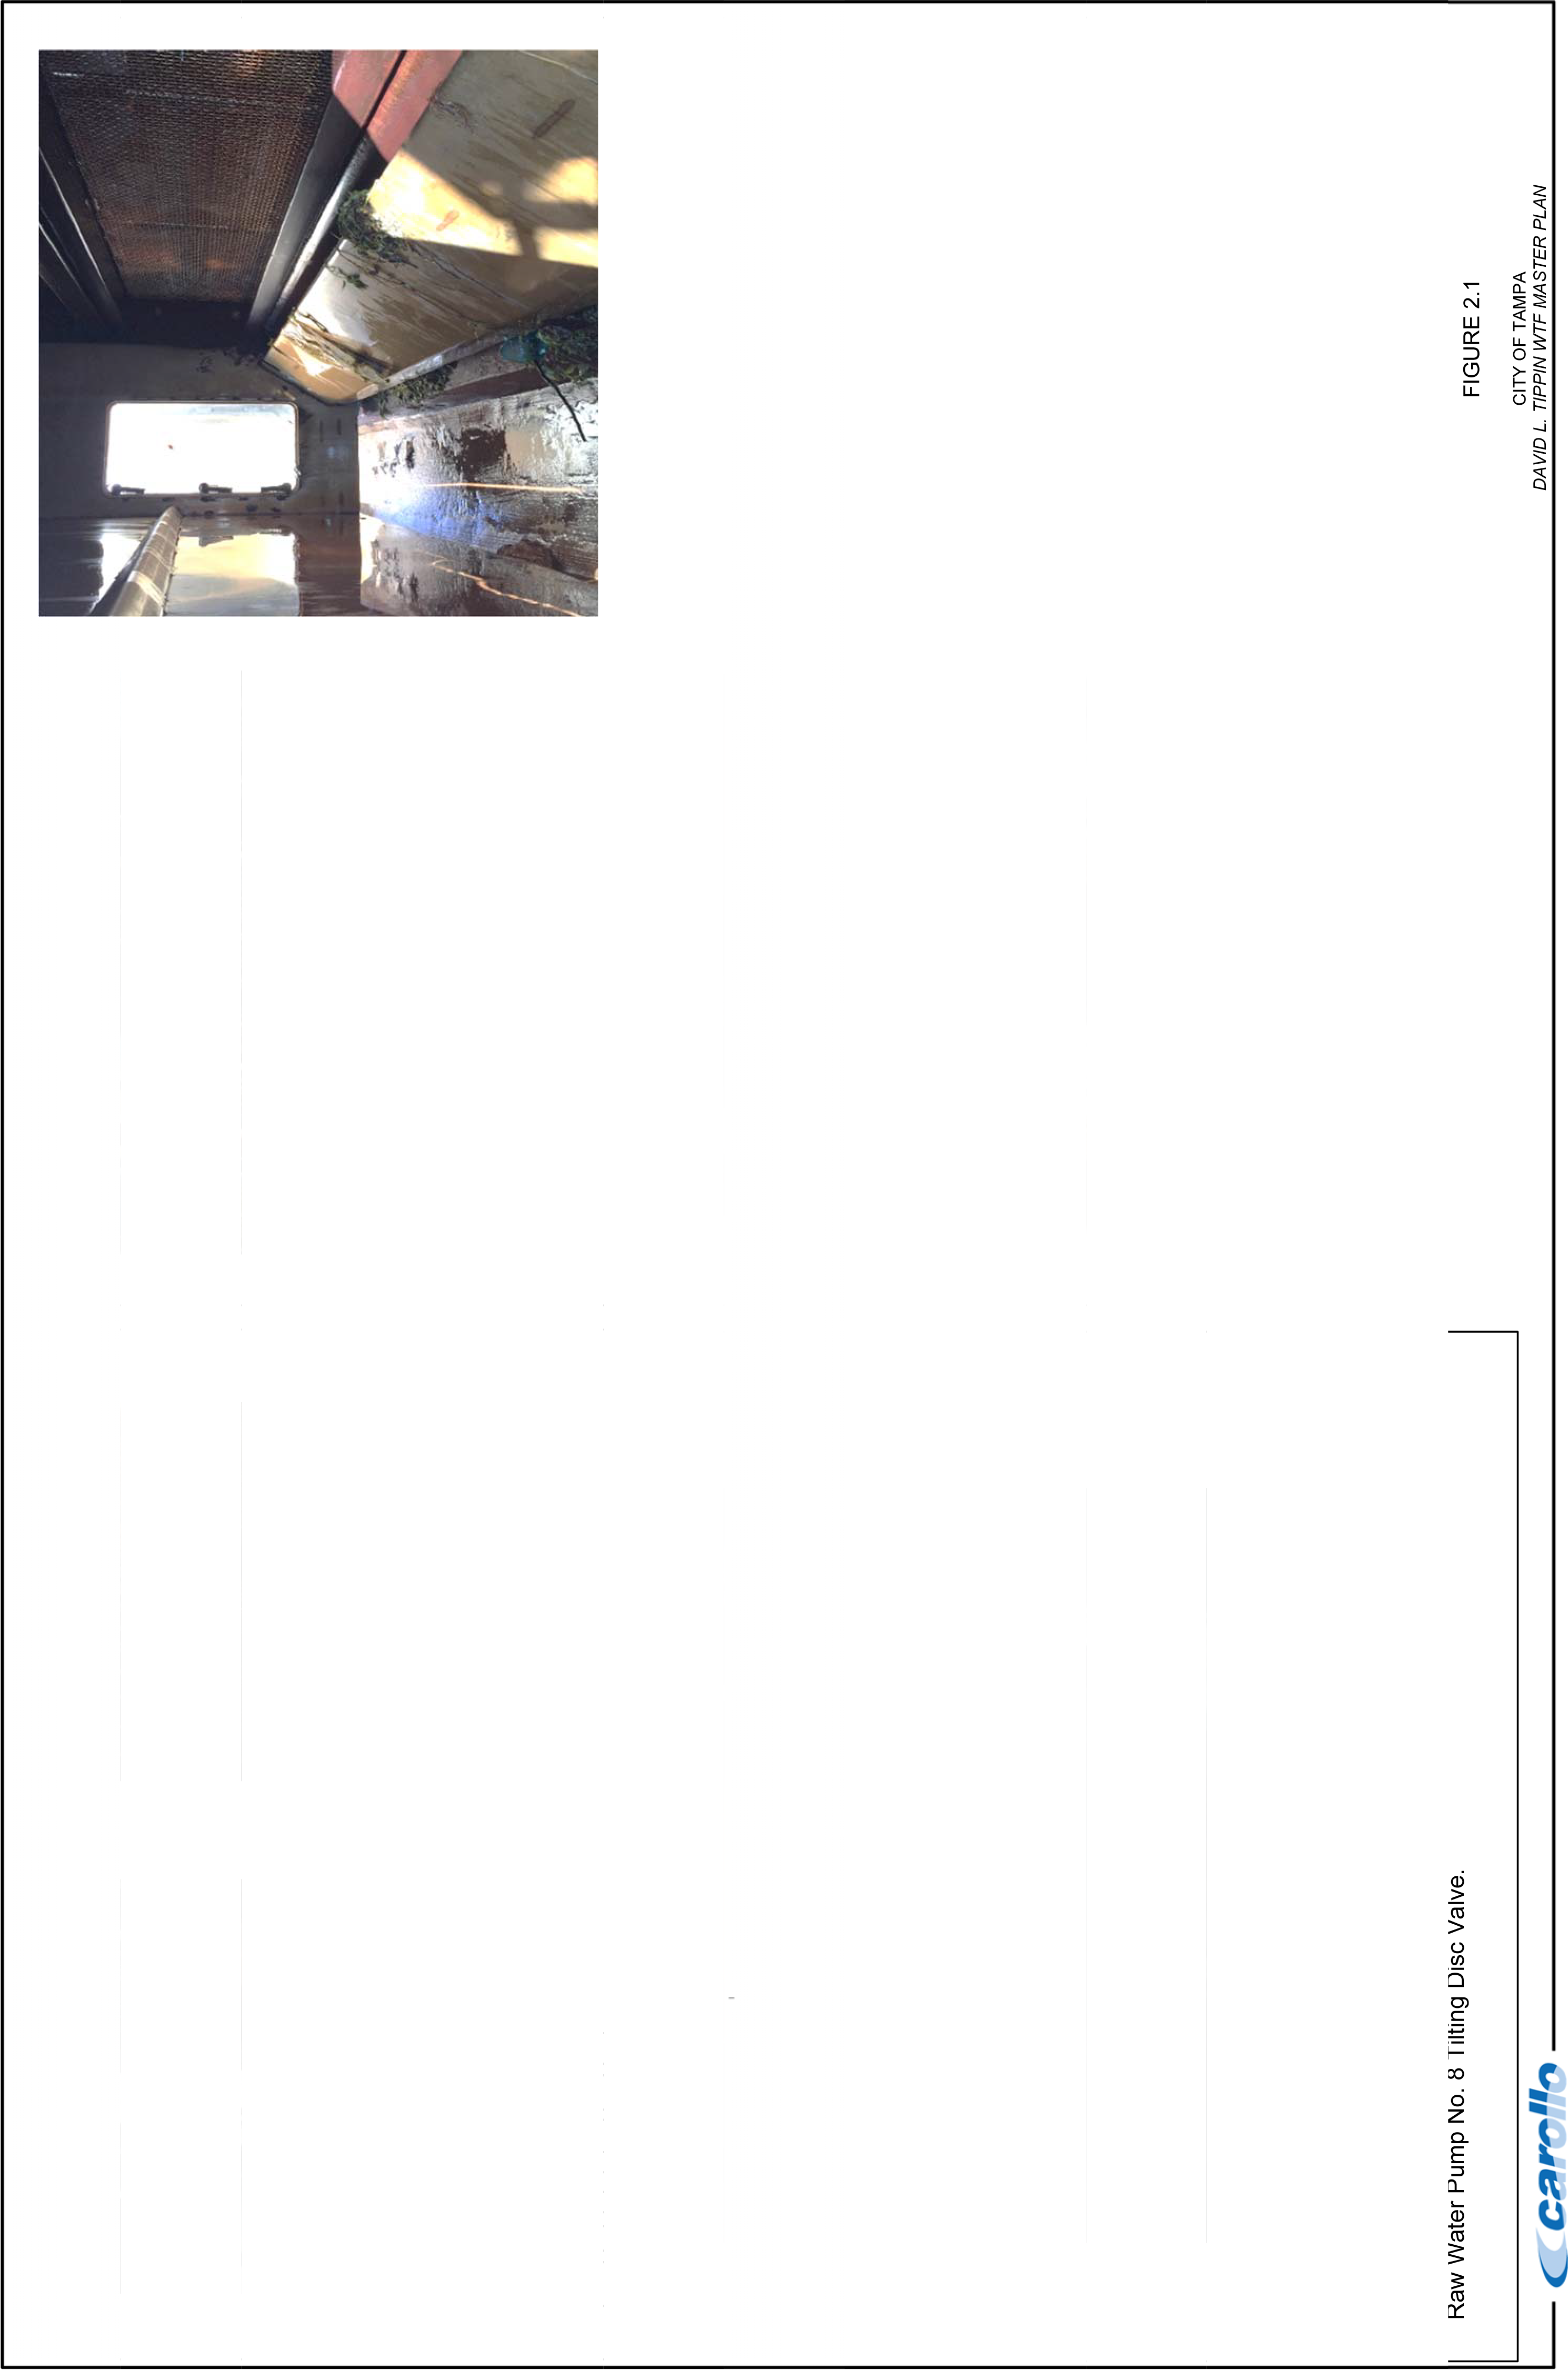
2.4.1.1.2 Rotating Screens
Raw water passes through rotating screens after the grass rake and before raw water pumping. There are two duty screens and one standby screen. The screens are nonmetallic basket type with 3/8-inch square openings between the 304 stainless steel wires. Operation and use of each screen is rotated. As a result, they are in similar condition due to similar operation durations.
The rotating screens have good overall functionality and reliability. However, operators must manually remove debris from the channel and dispose of it onto the deck. They then have to shovel the debris and transport it to a dumpster, which is labor intensive. This could be improved by reversing the direction of the screenings collection channel and placing a dumpster at the end of that channel.
The screen motors have minimal vibration but severe corrosion. The structural members for the screens are in poor condition and have significant corrosion. The drive/chain on Screens No. 2 and No. 3 need replacement. Spare parts were noted as readily available. Table 2.4 provides additional notes on the rotating screens.
The City is ordering parts and scheduling repair of Screens No. 2 and No. 3. City staff recently repaired Screen No. 1. As a result, the 15-year CIP did not include repairs of the screens. However, reevaluating the screens after year 10 is recommended to determine if replacement is required. Figure 2.1 shows the equipment's condition.
| Discipline | Year Installed/ Rehabilitated | Original Useful Life (years) | Criticality | Condition | Condition Fraction |
|---|---|---|---|---|---|
| Mechanical | 2001 | 20 | Moderate | Fair | 0.50 |
| Structural | 2001 | 25 | Moderate | Poor | 0.20 |
| Electrical | 2001 | 30 | Moderate | Good | 0.70 |
2.4.1.2 Raw Water Conveyance and Valves
The piping and valves associated with Raw Water Pumps No. 1 through 5 are in fair condition, mostly because of age. The lower level pump station tilting disc valves (shown in Figure 2.1) associated with Raw Water Pumps No. 6 through 9 are in poor condition because of limited spare parts availability and age. These valves should be replaced when the pumps are replaced.
The valves and piping associated with raw water suction and discharge for the pumps are in fair condition, as are the conduit supports in the lower level pump station. Appendix A includes more information on the scoring and calculated risks for these assets.
2.4.2 Actiflo™ Treatment System
The raw water pumps transfer flow to conventional treatment trains and the Actiflo™ treatment trains. The Actiflo™ system typically receives 20 to 30 mgd, and each train is rated for 20 mgd. The flow is split between the Conventional Trains 5 through 8 and Actiflo™ Trains 1 and 2 via a series of pipelines. Figure 2.2 shows the DLTWTF's Actiflo™ treatment system layout.
The following major components were evaluated:
- Actiflo™ Treatment Train 1 and Train 2 structures
- Microsand system
- Sand Pumps
- Sand Silo
- Mixers
- Coagulations, Injection, and Maturation
- Actiflo™ Sludge System
- Settling Tank Scrapers
- Hydrocyclone System
- Associated valves and piping
2.4.2.1 Influent Valves, Piping, and Chemical Feed
The stainless steel portions of the influent raw water piping just before the Actiflo™ treatment trains are in good condition, and ultrasonic measurements confirmed a consistent thickness of 0.4 inches throughout. However, the interior condition of the ductile iron piping is unknown. Sulfuric acid is dosed in-line, resulting in a pH of approximately 4.5. At times of low alkalinity, the water is aggressive. Thus, investigating the internal condition of this piping is recommended.
The carbon steel supports need to be replaced, and a new stainless steel coupling is needed on the pressure relief valve. Torque switch issues were reported due to non-use. The valve actuators on both feed pipes are in good condition. The sulfuric acid and ferric sulfate feed piping and valves are also in good condition. Appendix A includes more information on the scoring and calculated risks for these assets. Figure 2.3 shows a photo of the raw water piping.

ACTIFLO™ CONDITION PHOTOS 1
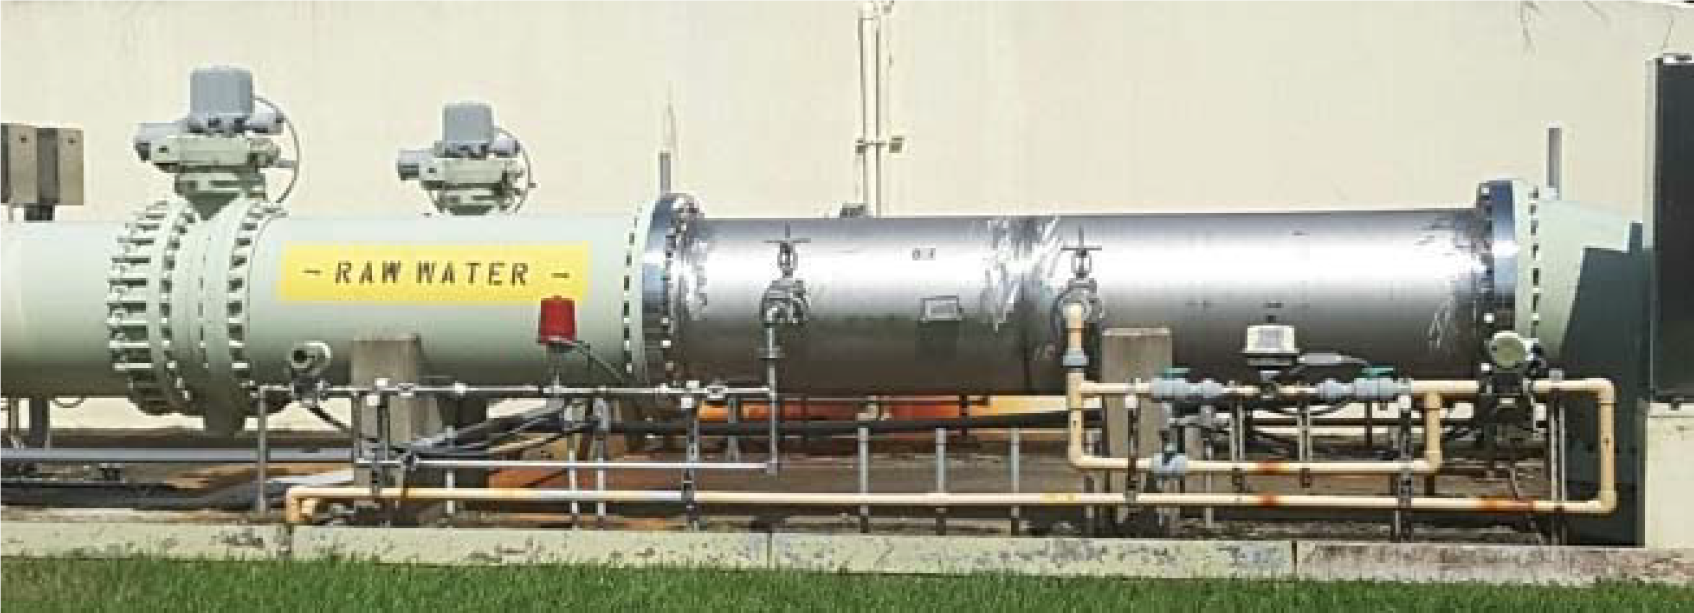
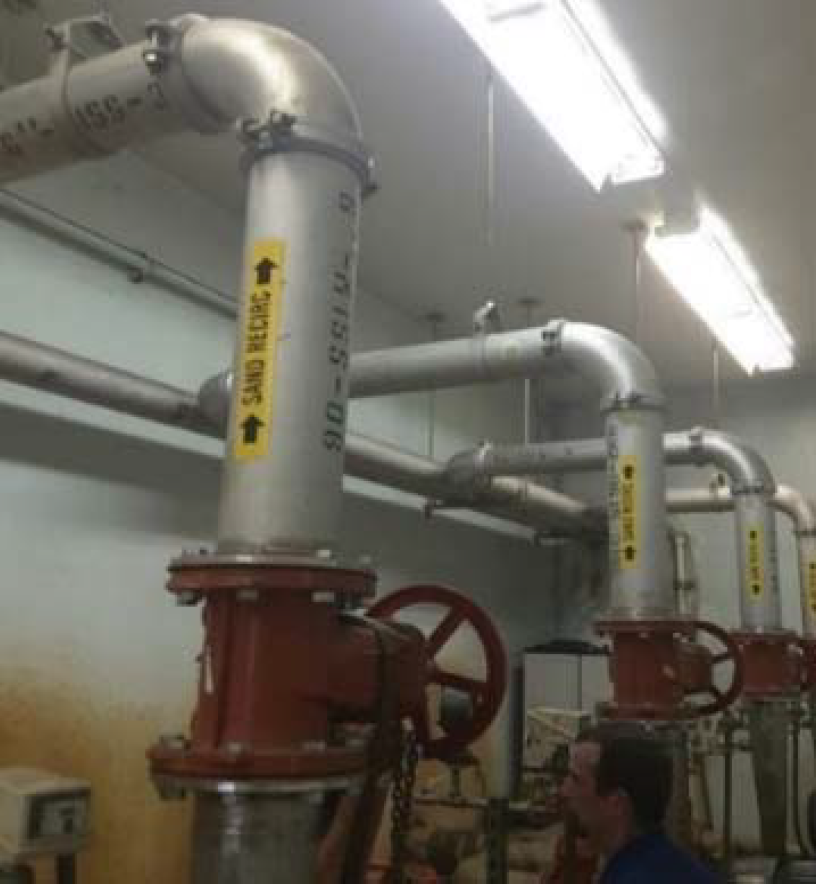
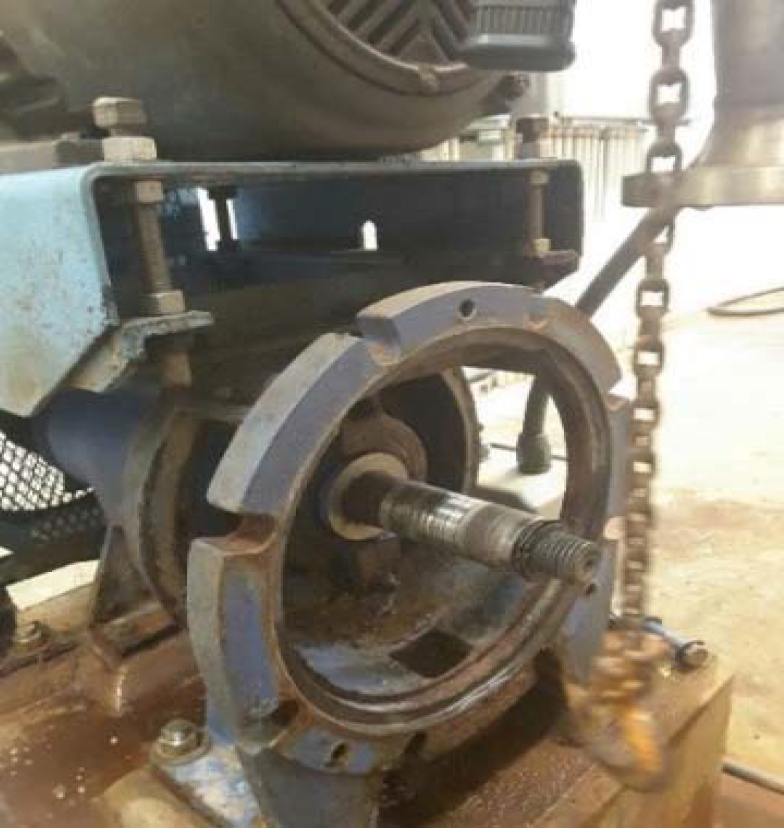
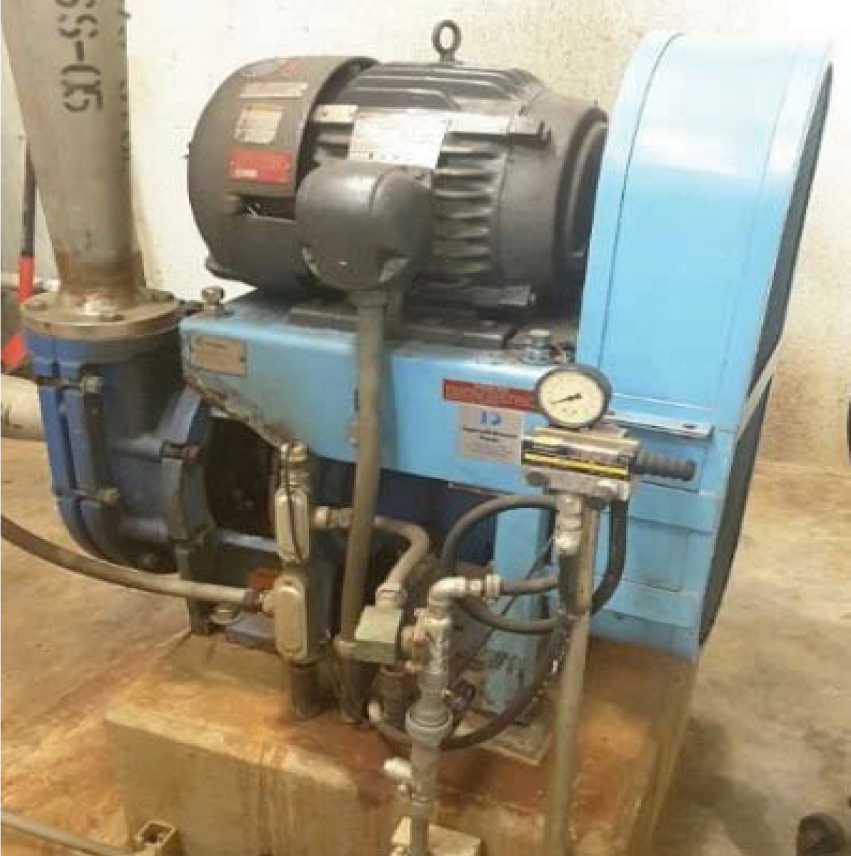
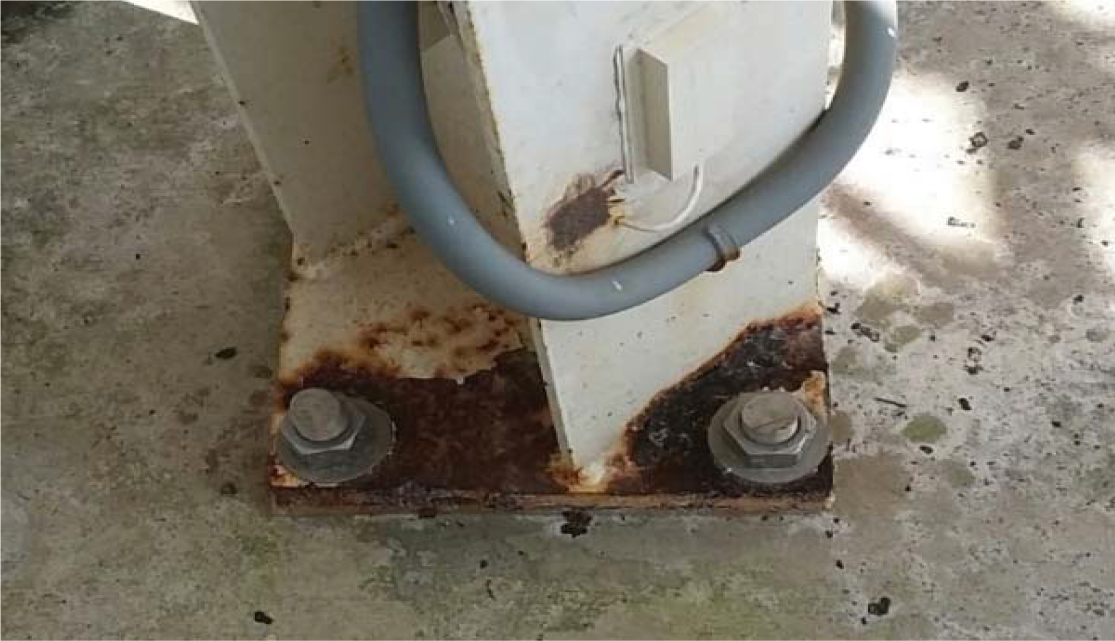
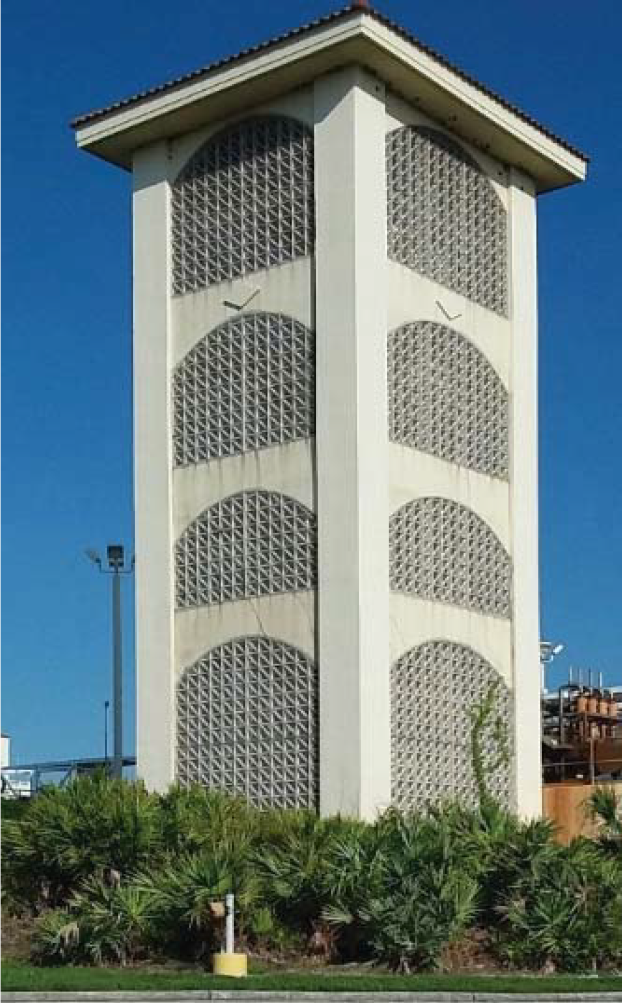
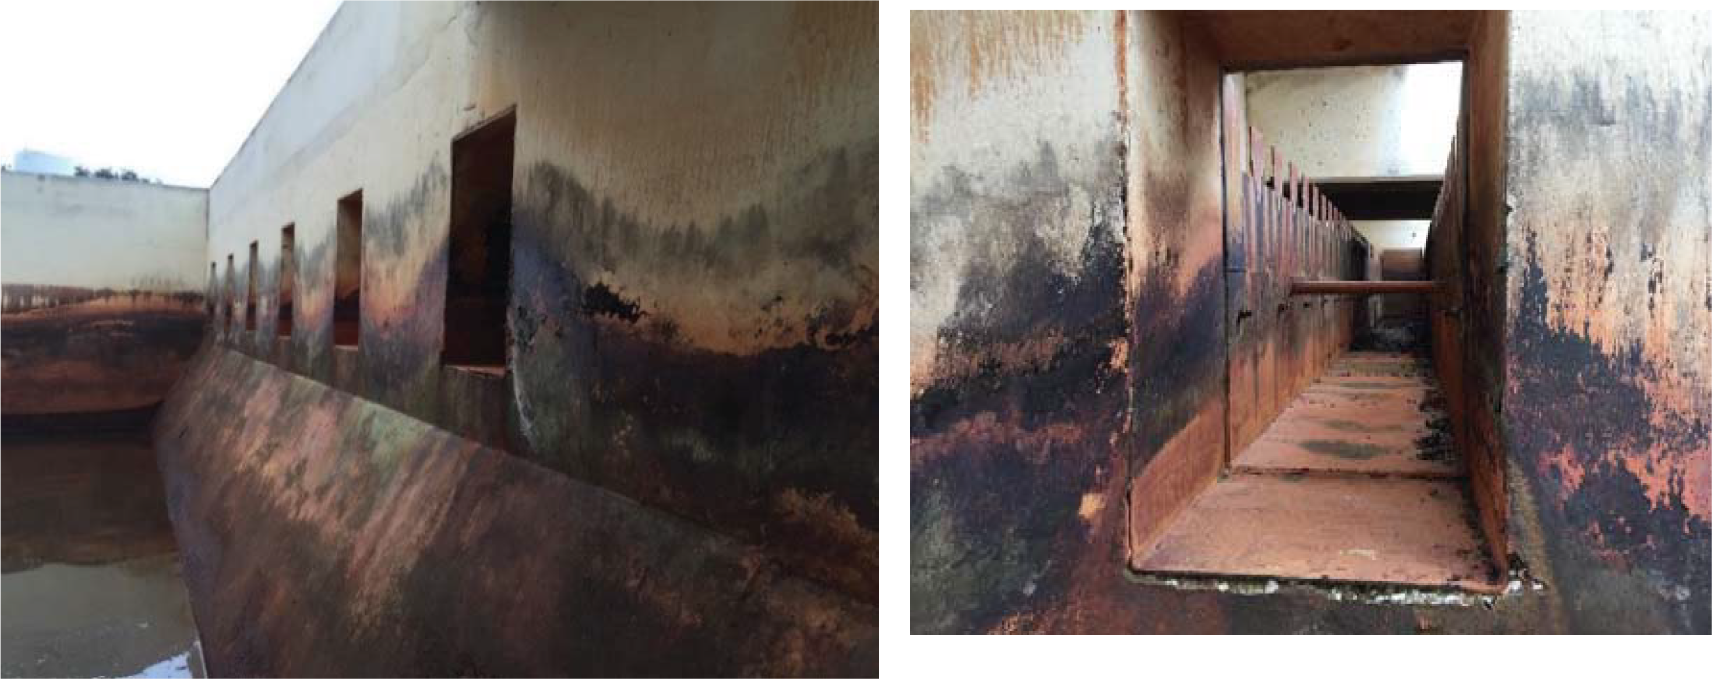
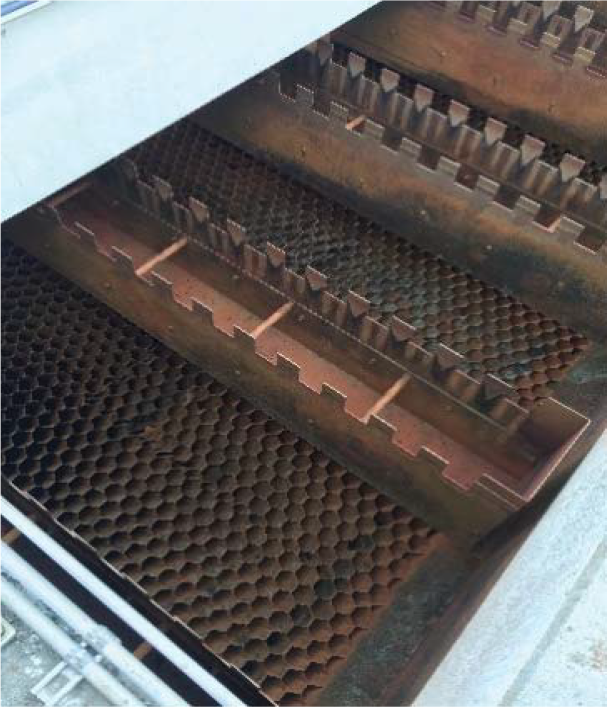
FIGURE 2.3
CITY OF TAMPA DAVID L. TIPPIN WTF MASTER PLAN
2.4.2.2 Actiflo™ Microsand System
2.4.2.2.1 Sand Pumps
Each Actiflo™ train has four sand pumps for a total of eight. All sand pumps are in similar condition, except for Sand Pump No.5, which was out of service during the assessment. The 15-horsepower (hp) pumps are designed for 300 gpm at 63 feet of total dynamic head. The suction reducers have been replaced multiple times, and the pumps' associated check valves were replaced with rubber lined epoxy coated gate valves.
The system's solenoids need to be replaced, and minor corrosion was noted in the sand pump pit area. Due to the potential wear and the short radius elbows, the stainless steel piping thickness should be monitored carefully during routine maintenance.
The pumps, piping, and valves are in fair condition with minor criticality. The concrete pit that houses the sand pumps is in fair condition, with cracking noted in the south wall. Table 2.5 includes additional information on the sand pumps. Figure 2.3 shows condition photos of the sand pumps.
| Discipline | Year Installed/ Rehabilitated | Original Useful Life (years) | Criticality | Condition | Condition Fraction |
|---|---|---|---|---|---|
| Mechanical | 2010 | 15 | Minor | Fair | 0.50 |
| Electrical | 2010 | 15 | Minor | Fair | 0.50 |
2.4.2.2.2 Sand Silo
The sand silo steel tank structure is 10 feet in diameter and approximately 46 feet in height, with 28.5 feet discharge clearance. This structure is in fair structural condition, with coating failure noted at the base plates. The aluminum railing and access and the concrete base pad are in fair condition. Table 2.6 lists the year installed, original useful life, criticality, condition, and condition fraction for this structure. Figure 2.3 shows photos of this asset.
| Discipline | Year Installed/ Rehabilitated | Original Useful Life (years) | Criticality | Condition | Condition Fraction |
|---|---|---|---|---|---|
| Structural | 2001 | 25 | Moderate | Fair | 0.50 |
2.4.2.3 Train 1
The concrete Actiflo™ tanks for Train 1 are in fair condition, with a hairline crack noted in the settling tank floor beam. Photos taken from when the Actiflo™ basins were accessed in February 2016 were used in this assessment, as shown below. Minor spalling of the concrete was observed, which should be repaired during annual dewatering and maintenance. Figure 2.3 show these details.
2.4.2.3.1 Mixers
The coagulation mixer is not in use, and Operations noted that it did not appear to affect operation. Due to the findings of the process evaluation and alternative evaluations the criticality of these mixers is considered moderate due to the proposed changes in the method of treatment (high coagulant doses) as discussed in Chapter 3 and 5. These proposed changes will require sufficient coagulant mixing and therefore re-installment of these mixers.
The 15-hp injection tank mixer and the 20-hp maturation tank mixer for Train 1 are in good condition, although the conduits are deteriorating and may need to be replaced. The mixer blades are 316 stainless steel and are in good condition. Table 2.7 lists the year installed, original useful life, criticality, condition, and condition fraction for the mixers. Figure 2.4 shows photos of these assets.
| Discipline | Year Installed/ Rehabilitated | Original Useful Life (years) | Criticality | Condition | Condition Fraction |
|---|---|---|---|---|---|
| Coagulation Tank Mixer | |||||
| Mechanical | 2001 | 20 | Moderate | Inoperable | 0.10 |
| Electrical | 2001 | 30 | Moderate | Unknown | $0 |
| Injection Tank Mixer | |||||
| Mechanical | 2001 | 20 | Severe | Fair | 0.50 |
| Electrical | 2001 | 30 | Severe | Good | 0.70 |
| Maturation Tank Mixer | |||||
| Mechanical | 2001 | 20 | Severe | Good | 0.70 |
| Electrical | 2001 | 30 | Severe | Good | 0.70 |
ACTIFLO™ CONDITION PHOTOS 2

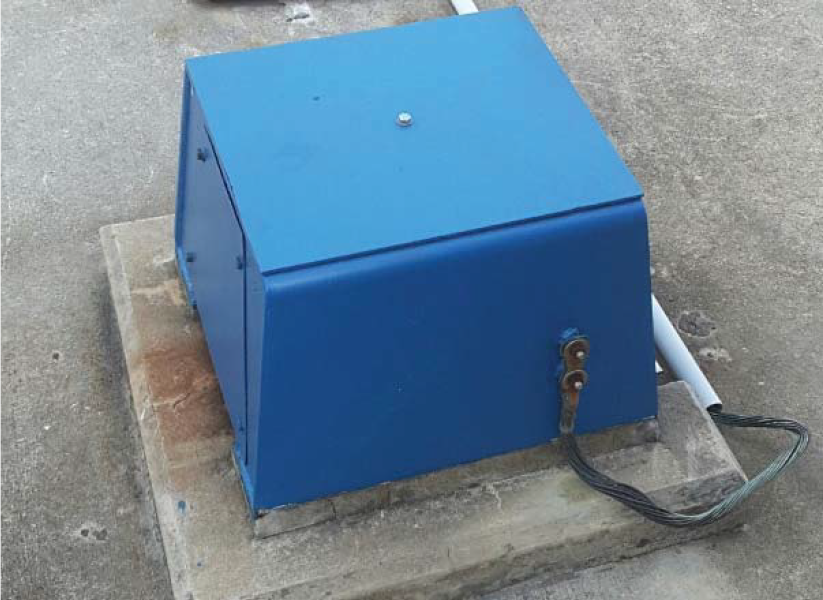
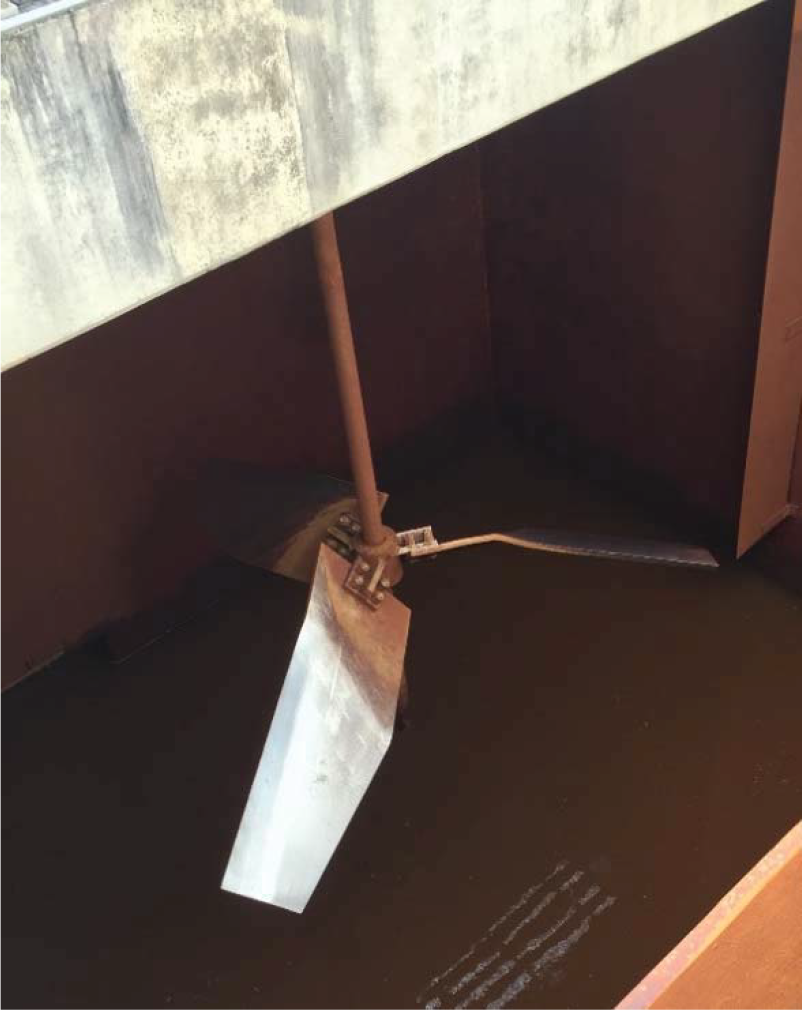
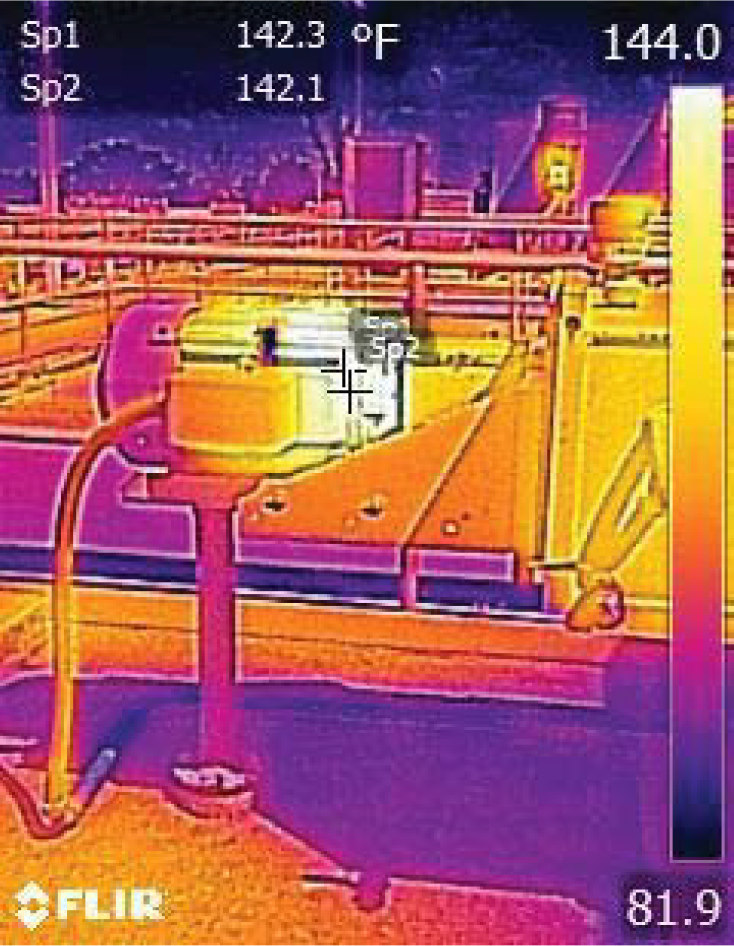
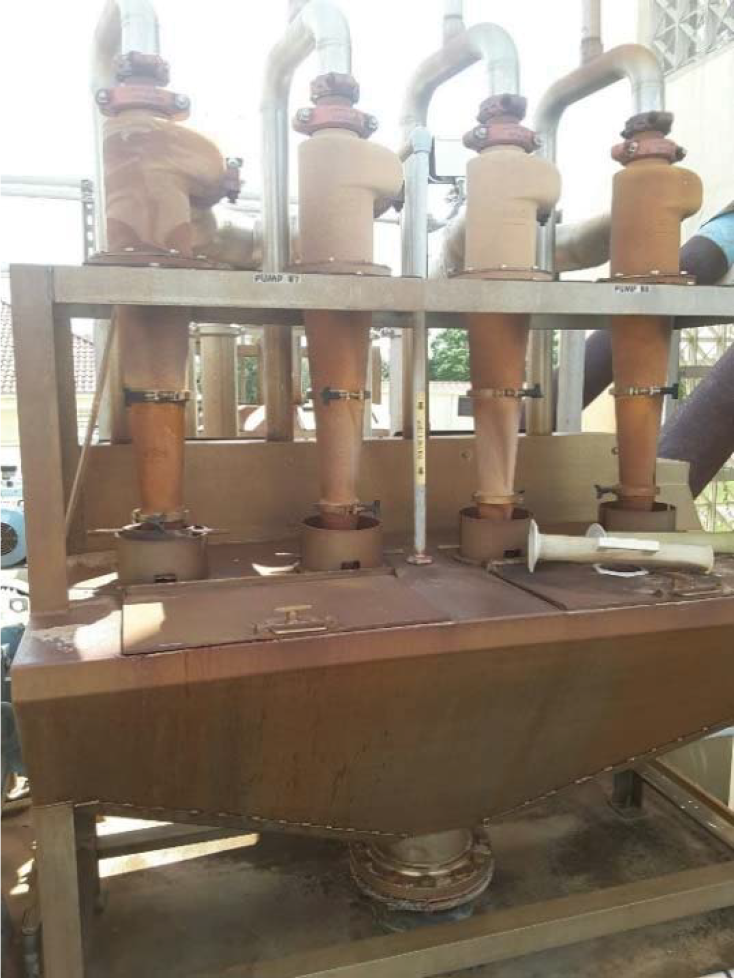
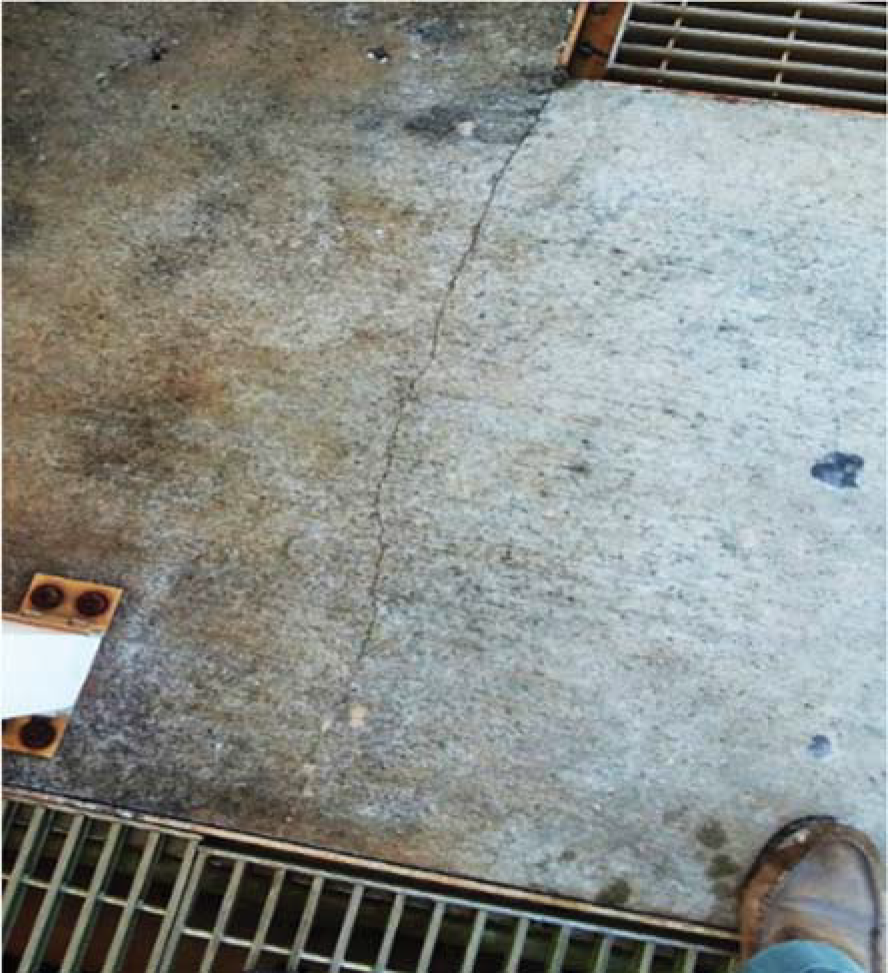
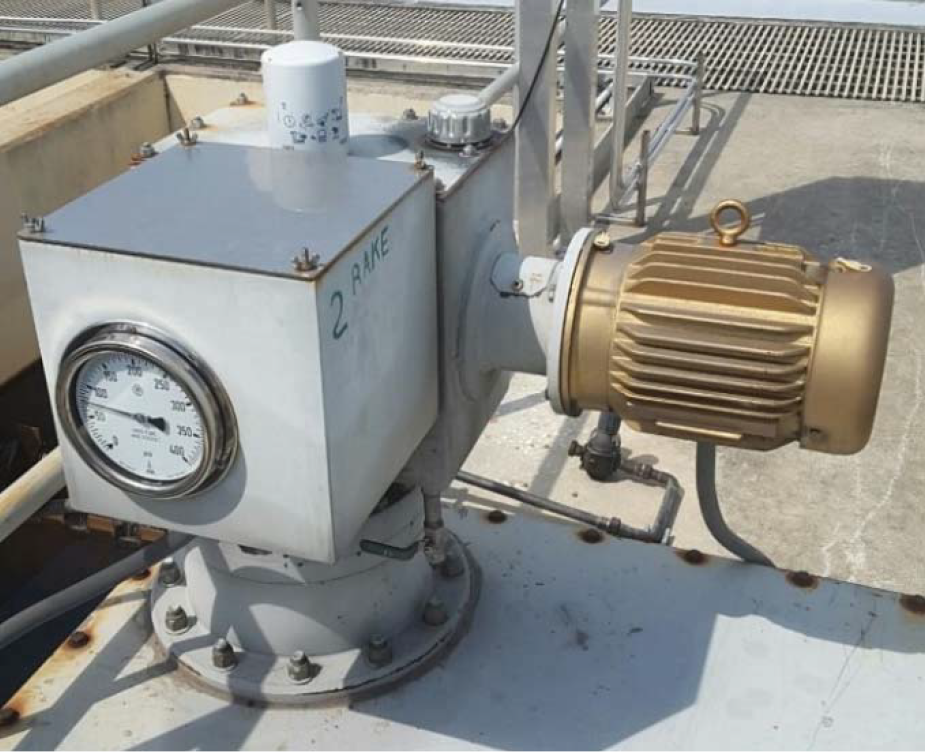
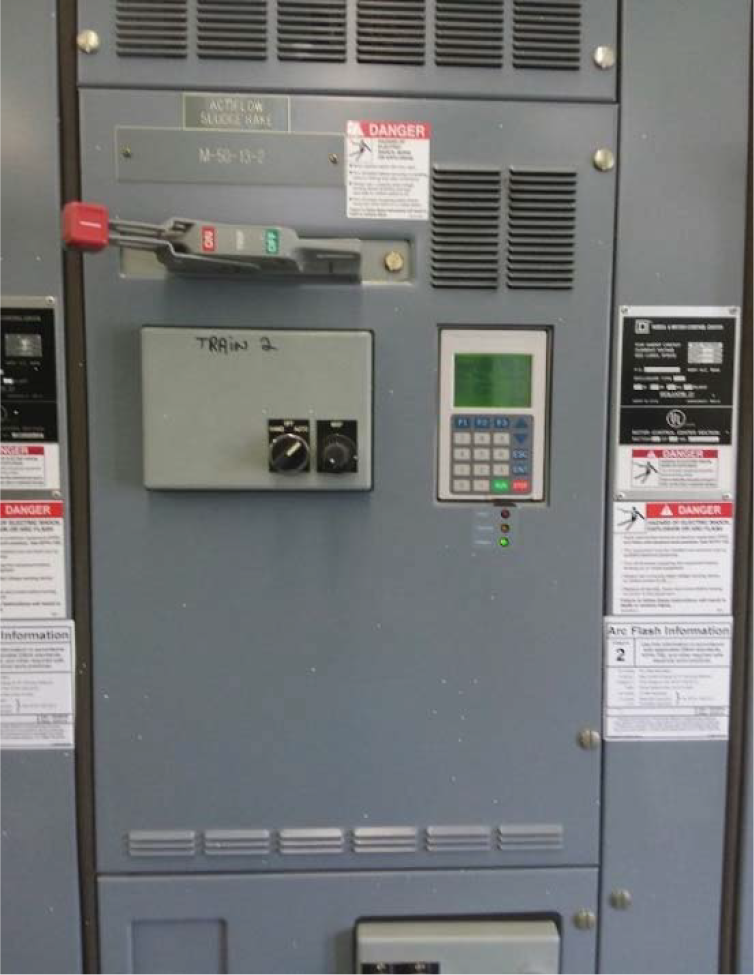
FIGURE 2.4
2.4.2.4 Train 2
As with Train 1, the concrete Actiflo™ tanks for Train 2 are in fair condition. The injection tank top concrete slab had a hairline crack, as shown in Figure 2.4.
2.4.2.4.1 Mixers
Because of a missing impeller, Train 2's coagulation mixer is also not in use. As with Train 1’s coagulation mixer, this mixer is of moderate criticality due to the results of Chapter 3 and 5 since the mode of coagulation will change.
The injection tank mixer for Train 2 is in fair condition. However, the maturation tank mixer motor is in very poor condition. Because it has a criticality rating of severe, it is recommended for repair or replacement.
The mixer is experiencing significant noise, vibration, and heat. As shown in Figure 2.4, the infrared camera noted an internal motor temperature of 144 degrees Fahrenheit. The bearings are likely in very poor condition, and the conduits feeding the mixer are deteriorating. The mixer blades are 316 stainless steel and in good condition. Table 2.8 lists the year installed, original useful life, criticality, condition, and condition fraction for these mixers.
| Category | Discipline | Year Installed/ Rehabilitated | Original Useful Life (years) | Criticality | Condition | Condition Fraction |
|---|---|---|---|---|---|---|
| Coagulation Tank Mixer | ||||||
| Mechanical | 2001 | 20 | Moderate | Inoperable | 0.10 | |
| Electrical | 2001 | 30 | Moderate | Unknown | $0 | |
| Injection Tank Mixer | ||||||
| Mechanical | 2001 | 20 | Severe | Good | 0.70 | |
| Electrical | 2001 | 30 | Severe | Good | 0.70 | |
| Maturation Tank Mixer | ||||||
| Mechanical | 2001 | 20 | Severe | Poor | 0.20 | |
| Electrical | 2001 | 30 | Severe | Good | 0.70 | |
2.4.2.5 Actiflo™ Sludge System
The Actiflo™ sludge system consists of the lamella tubes, settling tank, settling tank scrapers, and hydrocyclones. The Actiflo™ lamella tubes were assessed at a later date in
November 2016 and were in poor condition. The City is in the process of replacing these so no additional recommendations will be made with respect to the lamella tubes.
2.4.2.5.1 Settling Tank Scrapers
The Actiflo™ settling tank scrapers' VFDs are in poor condition and need to be replaced for both trains. Additionally, a vibration report prepared by Vibra Analysis in April of 2016 noted that the scraper for Train 1 experienced a fair amount of vibration.
The structural components of the scrapers were not accessible during the assessment but are made of 316 stainless steel and are thought to be in fair condition. Table 2.9 provides information on the condition of these scrapers. Figure 2.4 shows photos of the motor assembly and VFD enclosure for Scraper 2.
| Discipline | Year Installed/ Rehabilitated | Original Useful Life (years) | Criticality | Condition | Condition Fraction |
|---|---|---|---|---|---|
| Mechanical | 2001 | 20 | Severe | Fair | 0.50 |
| Electrical | 2001 | 30 | Severe | Poor | 0.20 |
2.4.2.5.2 Hydrocyclone System
The hydrocyclone system receives Actiflo™ processed microsand from the sand pumps. The hydrocyclones separate sludge from the microsand and then inject it back into the Actiflo™ process for reuse.
As Table 2.10 shows, the hydrocyclone system for Train 1 and Train 2 is in good condition, with minor criticality because of its significant redundancy. Every sand pump has two hydrocyclones. Significant ferric and microsand deposits were noted on the unit's exterior, but no significant corrosion was noted. Figure 2.4 shows a photo of a hydrocyclone's condition.
| Discipline | Year Installed/ Rehabilitated | Original Useful Life (years) | Criticality | Condition | Condition Fraction |
|---|---|---|---|---|---|
| Mechanical | 2001 | 20 | Minor | Good | 0.70 |
| Structural | 2001 | 25 | Minor | Fair | 0.50 |
The sludge is discharged out of the top of the hydrocyclone system and sent to the sludge thickeners. Although the Actiflo™ sludge piping exterior is in good condition, the interior condition is unknown and should be investigated because of the sludge's low pH. Operations also noted difficulty getting sludge to the thickeners due to the hydraulic grade, and that the pipe must be cleaned out once a year because of sand and sludge build-up. Chapter 3 contains recommendations for this issue.
2.4.3 Conventional Treatment System
Approximately 70 to 80 percent of the total plant flow is pumped to the conventional system, which uses ferric sulfate for coagulation. Originally installed in the 1950s, Treatment Trains 5 and 6 are designed to handle 20 mgd each.
Treatment Trains 7 and 8 were constructed in the 1970s and are also designed to process 20 mgd each. However, Trains 7 and 8 were constructed 1 foot higher than Trains 5 and 6. Thus, the full design capacity of Trains 7 and 8 is not expected to be used. Chapter 4 addresses flow issues in these trains.
During the time of the initial assessment, the inside of the basin could not be accessed, so the basin's age was factored into the initial condition scoring. However, these assets have since been accessed and their conditions reviewed and confirmed. Figure 2.5 shows the layout of the conventional treatment system.
The conventional treatment system assets evaluated included:
- Influent, Coagulation, Flocculation, Sedimentation Structures
- Flocculators
- Sludge Collection Bridges and Siphons
- Associated Valves and Piping
Chapters 3 and 5 detail process deficiencies and include recommendations for this system from a treatment and process efficiency standpoint.
2.4.3.1 Conventional Treatment Trains 5 and 6
2.4.3.1.1 Influent and Coagulation System
Trains 5 and 6 share a common influent box, which is in fair structural condition. The rapid mixer and Water Champ for Treatment Trains 5 and 6, respectively, are currently not in service. Because mixing is achieved hydraulically, the system does not have coagulation mixers. In the event the treatment process is modified, as detailed in Chapters 3 and 5, the rapid mixers will become more critical to process operation and therefore have been assigned moderate criticality. The influent structure has two gates that provide the ability to isolate Train 5 or 6, as shown in Figure 2.6. Appendix A includes more information on the scoring and calculated risks for these assets.

CONVENTIONAL TRAINS 5 & 6 CONDITION PHOTOS

CITY OF TAMPA DAVID L. TIPPIN WTF MASTER PLAN
2.4.3.1.2 Flocculation System
Each treatment train has a total of four flocculation basins, all of which are in fair structural condition. Because the flocculators associated with Trains 5 and 6 have routine scheduled maintenance and refurbishment, they are in similar condition.
The flocculators are approximately 30 years old but are in fair condition because the motors, VFDs, and components have been rebuilt. The original gearboxes have not been rebuilt. Staff noted the stainless steel flocculator paddles to be in good condition.
Table 2.11 provides information on the condition of these flocculators. Figure 2.6 shows pictures of Flocculators 5-4 and 6-4.
| Discipline | Year Installed/ Rehabilitated | Original Useful Life (years) | Criticality | Condition | Condition Fraction |
|---|---|---|---|---|---|
| Mechanical | 1983 | 20 | Minor | Fair | 0.50 |
| Electrical | 1983 | 30 | Minor | Fair | 0.50 |
| Structural | 1976 | 50 | Minor | Fair | 0.50 |
2.4.3.1.3 Sedimentation System
The sedimentation basins for Trains 5 and 6 were installed at the same time and are maintained concurrently. As a result, they are both in fair structural condition.
Sludge is collected via a traveling bridge and siphon system. The bridges were originally installed in the early 1980s. The motors associated with the sludge collection siphon were replaced in 2015. Replaced in 2005, the motors for the traveling bridge are in fair condition. The bridge rail system wheels are in poor condition and are recommended for replacement.
As Figure 2.6 shows, some of the bridge's structural cross members need to be replaced. The electrical cable reels for Bridge 5 and 6 are in poor condition and are obsolete technologies. Due to the condition and inefficiencies, replacing this system with a different sludge collection technology is recommended.
Technologies applicable to the DLTWTF include chain and flight type or sludge scraper type. Both systems move the sludge to the end of the basin, where is it then collected and sent to the gravity thickeners.
Additionally, MCC-S is in poor condition. It serves loads associated with the Sedimentation Basins, although a portion of the buckets is for equipment no longer in service. The dry type lighting transformer located outside the Basin Control Building should be replaced and relocated within the air conditioned space. Table 2.12 provides information on the condition of this equipment.
| Discipline | Year Installed/ Rehabilitated | Original Useful Life (years) | Criticality | Condition | Condition Fraction |
|---|---|---|---|---|---|
| Mechanical | 1983 | 20 | Moderate | Fair | 0.50 |
| Structural | 1983 | 25 | Moderate | Fair | 0.50 |
| Electrical | 1983(1) | 30 | Moderate | Poor | 0.20 |
Notes: (1) The bridge motor was replaced in 2005, and the siphon motor was replaced in 2015.
2.4.3.2 Conventional Treatment Trains 7 and 8
2.4.3.2.1 Influent and Coagulation System
The influent basin is in fair structural condition, with minor corrosion noted and minor ferric deposit build-up. The rapid mixer and Water Champ for Treatment Trains 7 and 8 are not in service. As Figure 2.7 shows, this system lacks coagulation mixers, since mixing is achieved hydraulically. In the event the treatment process is modified, as detailed in Chapters 3 and 5, the rapid mixers will become more critical to process operation and therefore have been assigned moderate criticality. The influent structure has two gates that provide the capability of isolating Train 7 or 8. Appendix A includes more information on the scoring and calculated risks for these assets.
2.4.3.2.2 Flocculation System
The flocculation basins are also in fair condition structurally. Like Trains 5 and 6, the flocculators associated with Trains 7 and 8 have rotating scheduled maintenance and are in similar condition. As Table 2.13 shows, the eight flocculators (four for each train) are in fair condition because they have rebuilt motors, VFDs, and components. The original gearboxes have not been rebuilt because they are in good condition. Staff noted the stainless steel flocculators are also in good condition. Figure 2.7 shows flocculator 8-1.
CONVENTIONAL TRAINS 7 & 8 CONDITION PHOTOS
FIGURE 2.7 CITY OF TAMPA DAVID L. TIPPIN WTF MASTER PLAN
- Photo Influent Basin servicing Trains 7 & 8
- Photo Flocculator 8-1 servicing Train 8 Flocculation Basin.
- Photo Bridge Equipment for Trains 7 & 8.
| Discipline | Year Installed/ Rehabilitated | Original Useful Life (years) | Criticality | Condition | Condition Fraction |
|---|---|---|---|---|---|
| Mechanical | 1976 | 20 | Minor | Fair | 0.50 |
| Electrical | 1976 | 30 | Minor | Fair | 0.50 |
| Structural | 1976 | 50 | Minor | Fair | 0.50 |
2.4.3.2.3 Sedimentation System
The sedimentation basins for Trains 7 and 8 are maintained concurrently and are in similar fair condition structurally, as shown in Figure 2.7.
As with Trains 5 and 6, sludge is collected via a traveling bridge and siphon system, which are in similar condition. The motors associated with the sludge collection siphon were replaced in 2015. Replaced in 2005, the motors for the traveling bridge are in fair condition. The bridge rail system wheels are in poor condition.
The motors associated with the sludge collection siphon were replaced in 2015. The electrical cable reels for Bridge 7 and 8 are in poor condition. As was stated for Trains 5 and 6, replacing these sludge collectors with a chain and flight or scraper type is recommended. See Table 2.14 for additional information.
| Discipline | Year Installed/ Rehabilitated | Original Useful Life (years) | Criticality | Condition | Condition Fraction |
|---|---|---|---|---|---|
| Mechanical | 1976(1) | 20 | Moderate | Fair | 0.50 |
| Structural | 1976 | 25 | Moderate | Fair | 0.50 |
| Electrical | 1976 | 30 | Moderate | Poor | 0.20 |
| Notes: (1) The bridge motor was replaced in 2005, and the siphon motor was replaced in 2015. | |||||
2.4.4 Ozone System
Ozone, the primary disinfectant, is located after the Actiflo™ and conventional treatment process, after sedimentation and before filtration. Ozone is also used for taste and odor control and to reduce color.
The ozone systems assets evaluated for this assessment included:
- Production System
- Three liquid oxygen tanks, four vaporizers, and associated appurtenances
- Nitrogen boost system
- Ozone Generators No. 1 and No. 2
- Contact System
- Ozone splitter box and two ozone contact structures
- Ozone destruct units and off gas blowers (three)
- Pre-filter junction box (post ozonation, also referred to as the settled water junction box)
- Ozone electrical systems
2.4.4.1 Ozone Electrical Systems
The ozone system's transformers, switchgear, and MCCs are in good condition electrically and are of moderate criticality. The HVAC systems for the PSUs, located outside of the building, are in poor condition because the HVAC units use an outdated refrigerant (R-22).
Figure 2.8 shows the switchgear, MCC, and HVAC systems. Appendix A includes more information on the scoring and calculated risks for the ozone electrical system assets.
2.4.4.2 Production System
2.4.4.2.1 Liquid Oxygen System
The three 13,000 gallon liquid oxygen (LOX) tanks are in fair condition. Because they have ample redundancy, they are of minor criticality. Paint failure and corrosion were observed at the legs of each tank, and moisture had accumulated on the concrete foundation, as shown in Figure 2.8.
OZONE SYSTEM CONDITION PHOTOS 1
FIGURE 2.8
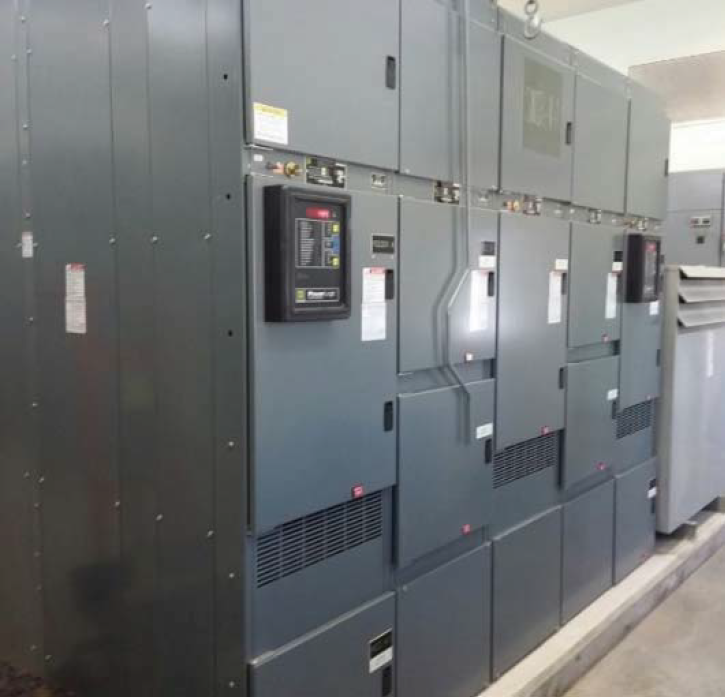
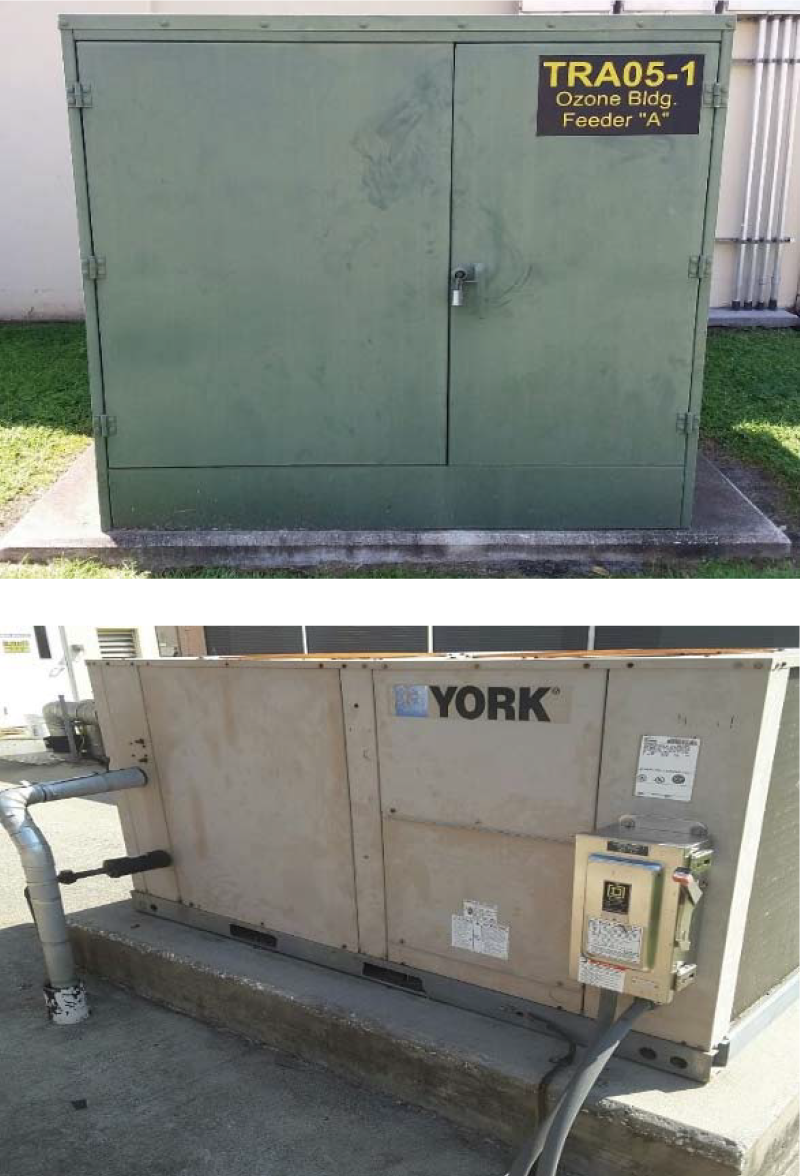
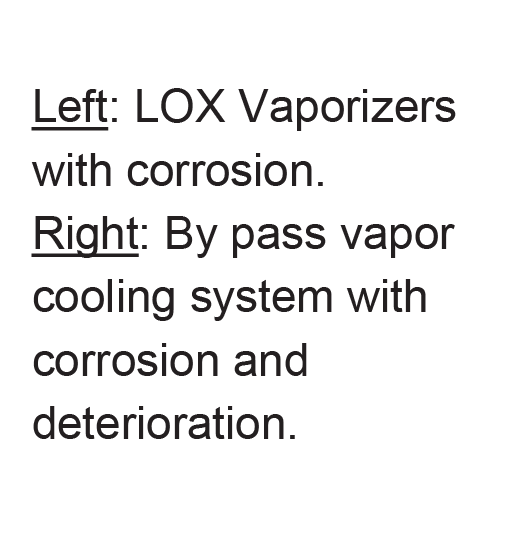
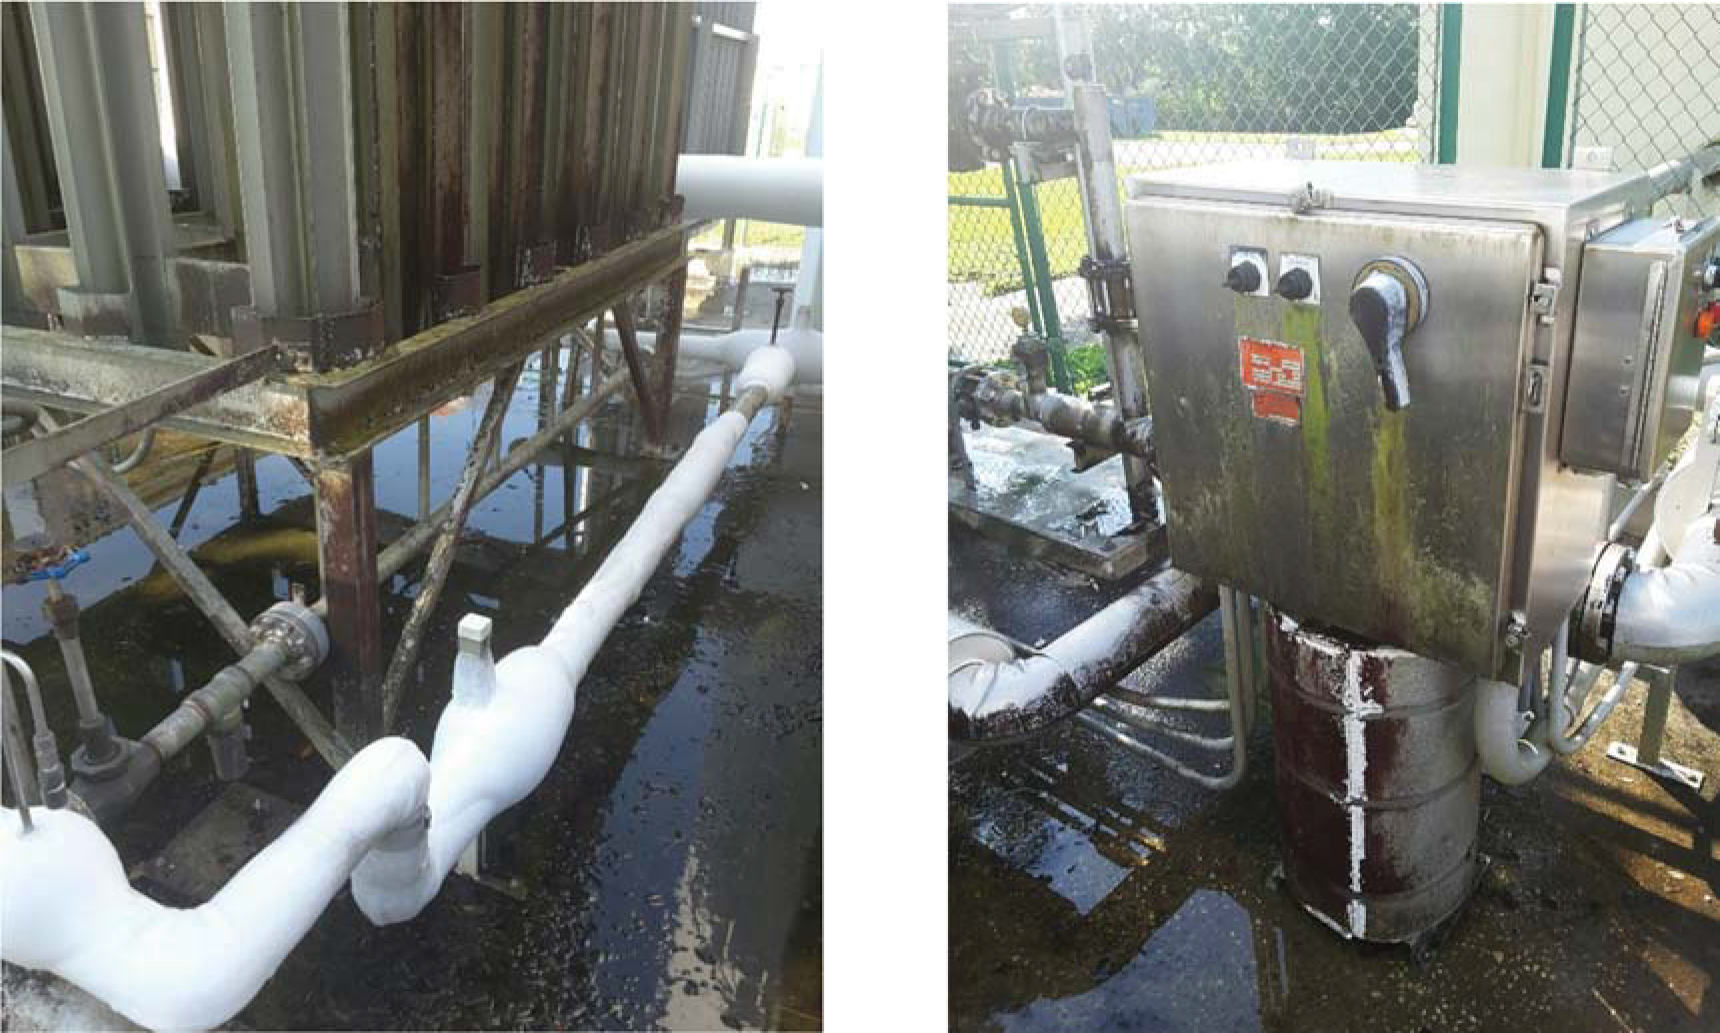
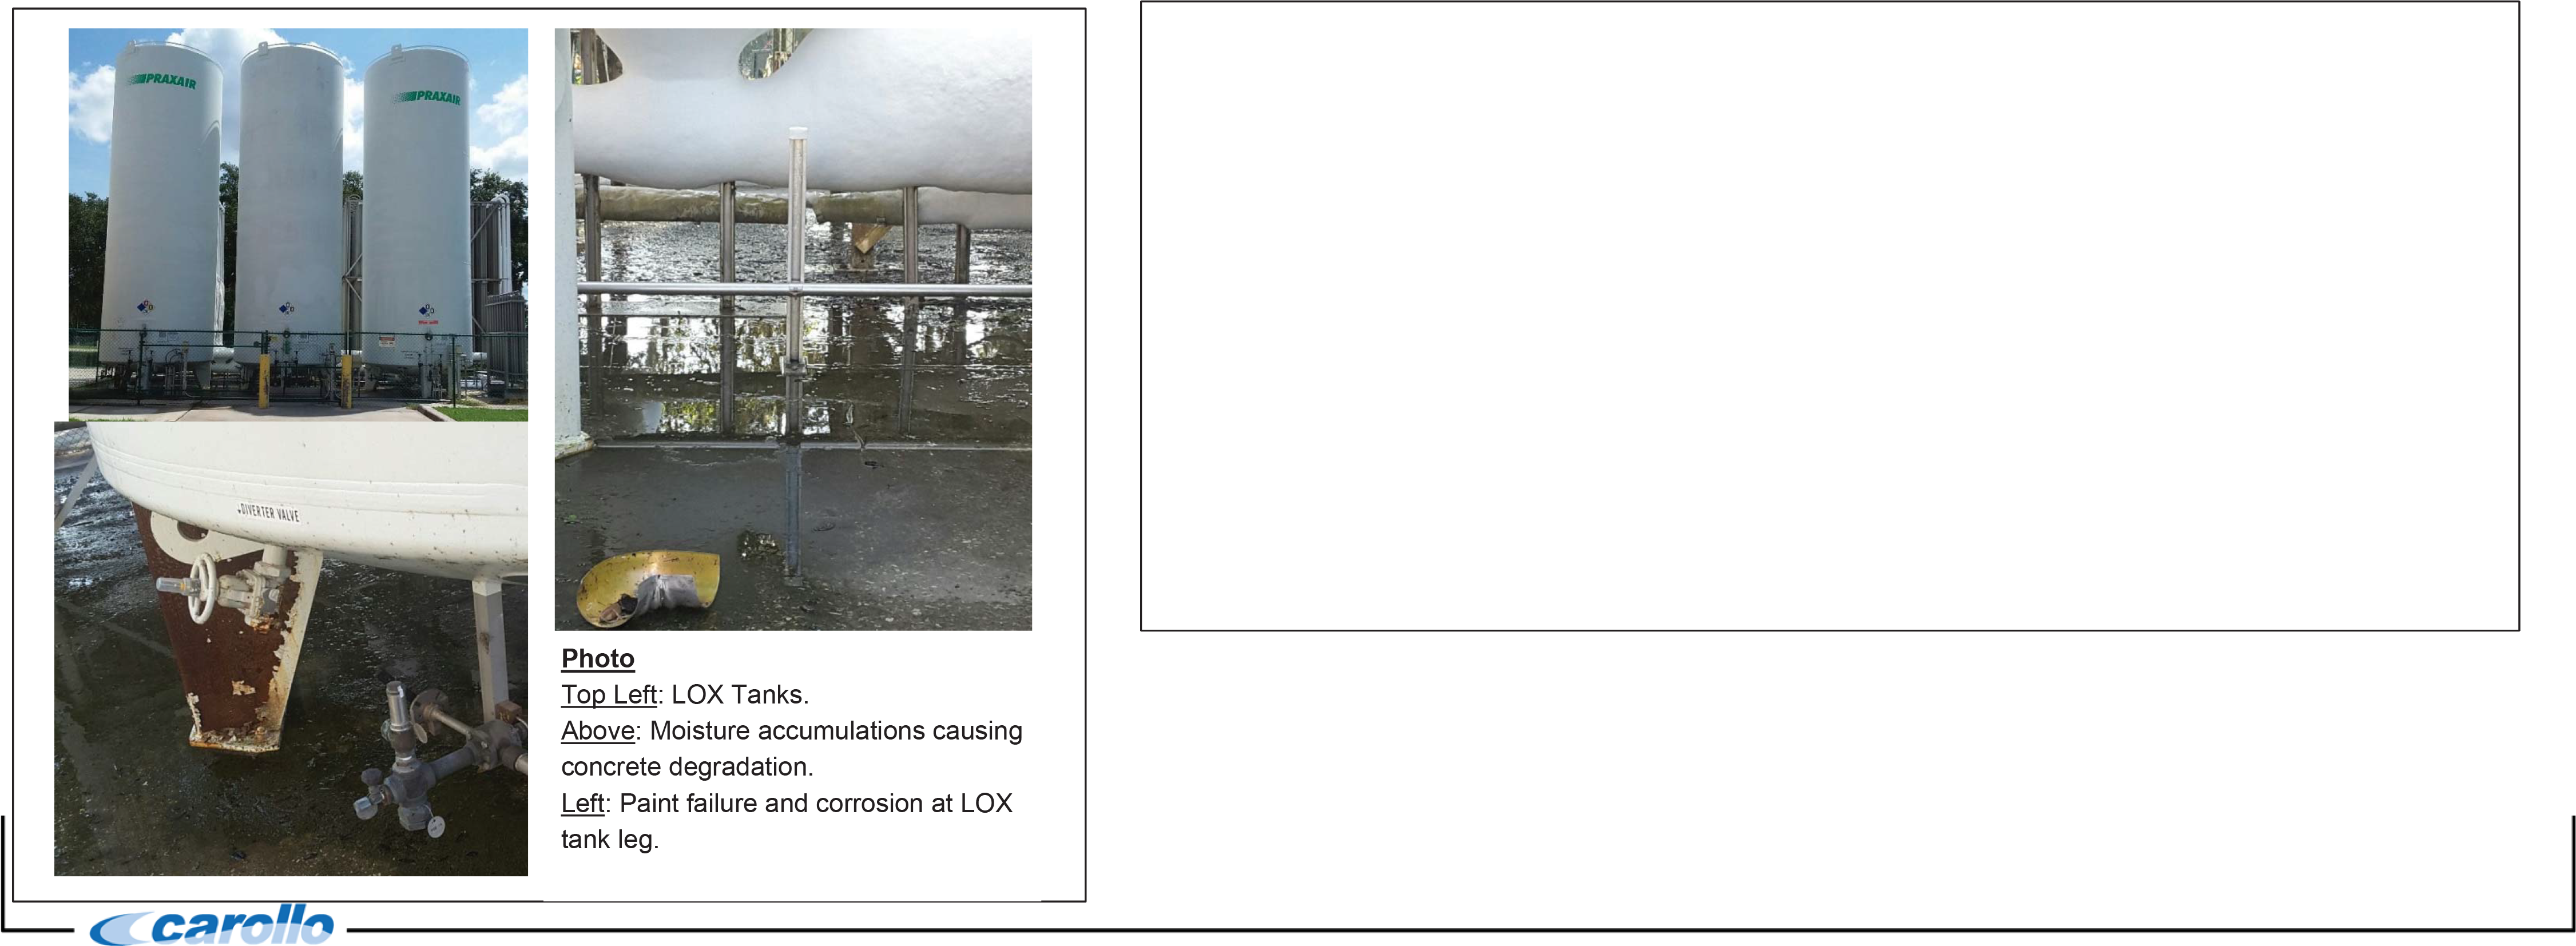
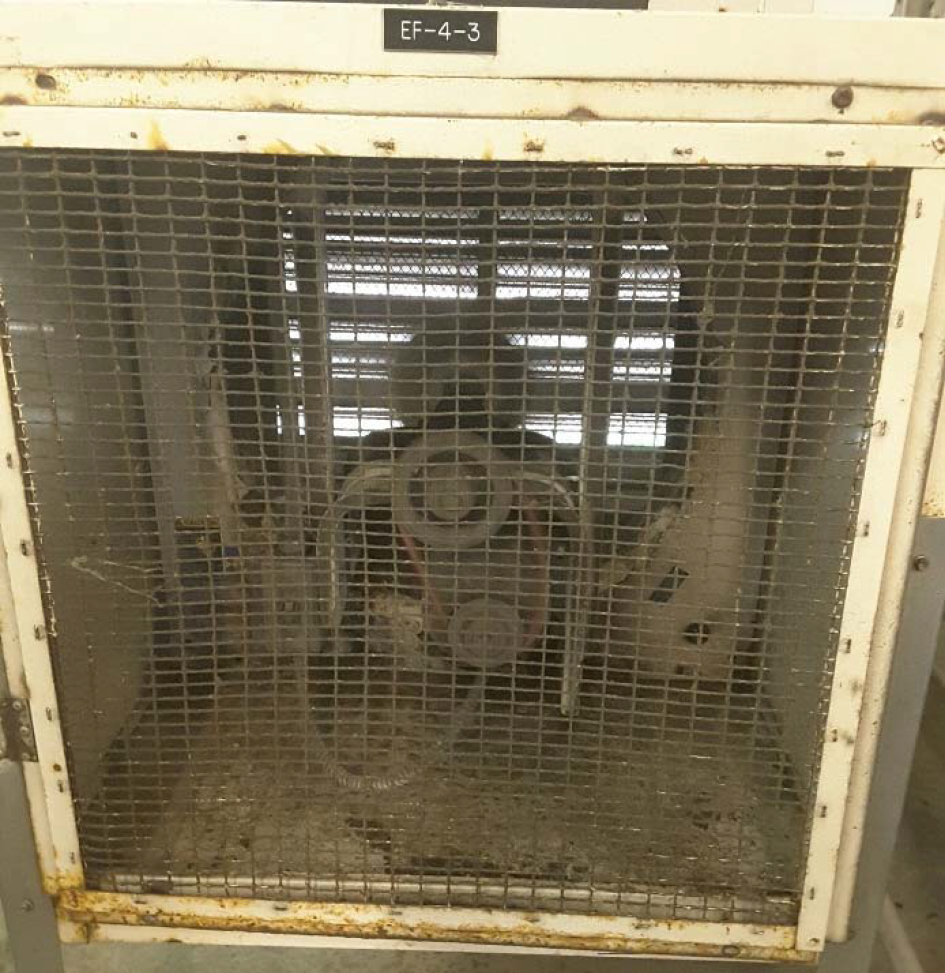
CITY OF TAMPA
DAVID L. TIPPIN WTF MASTER PLAN
Table 2.15 summarizes the condition of the LOX tanks.
| Discipline | Year Installed/ Rehabilitated | Original Useful Life (years) | Criticality | Condition | Condition Fraction |
|---|---|---|---|---|---|
| Mechanical | 2001 | 20 | Minor | Fair | 0.50 |
| Structural | 2001 | 25 | Minor | Fair | 0.50 |
| Electrical | 2001 | 30 | Minor | Good | 0.70 |
The four vaporizers associated with the LOX tanks are in fair condition because of corrosion from moisture accumulation. Because they have ample redundancy, they do not affect plant capacity. Table 2.16 includes additional information on their overall condition. As Figure 2.8 shows, the bypass vapor cooling system is in poor to fair condition due to corrosion.
| Discipline | Year Installed/ Rehabilitated | Original Useful Life (years) | Criticality | Condition | Condition Fraction |
|---|---|---|---|---|---|
| Mechanical | 2001 | 20 | No Impact | Fair | 0.50 |
| Structural | 2001 | 25 | No Impact | Fair | 0.50 |
| Electrical | 2001 | 30 | No Impact | Good | 0.70 |
The ozone room exhaust fans and louvers are important in an enclosed area where a nuisance leak of ozone can accumulate and pose risks to plant personnel.
As Figure 2.8 shows, plant staff noted that these fans are being replaced. The contractor was working on the complete system during the site inspection, including the new louvers and programming.
2.4.4.2.2 Nitrogen Boost
As Table 2.17 shows, the nitrogen boost equipment is in fair to good condition and of minor criticality because it has total redundancy except for the air receiver tank. The duplex, 10-hp air compressors are in fair condition. The compressor air tank is in fair condition structurally and electrically. The supporting foundation showed deterioration, as shown in Figure 2.9. The vibration report noted slightly rough and extremely rough vibration for the nitrogen boost motors No. 1 and No. 2, respectively.
FIGURE 2.9
OZONE SYSTEM CONDITION PHOTOS 2


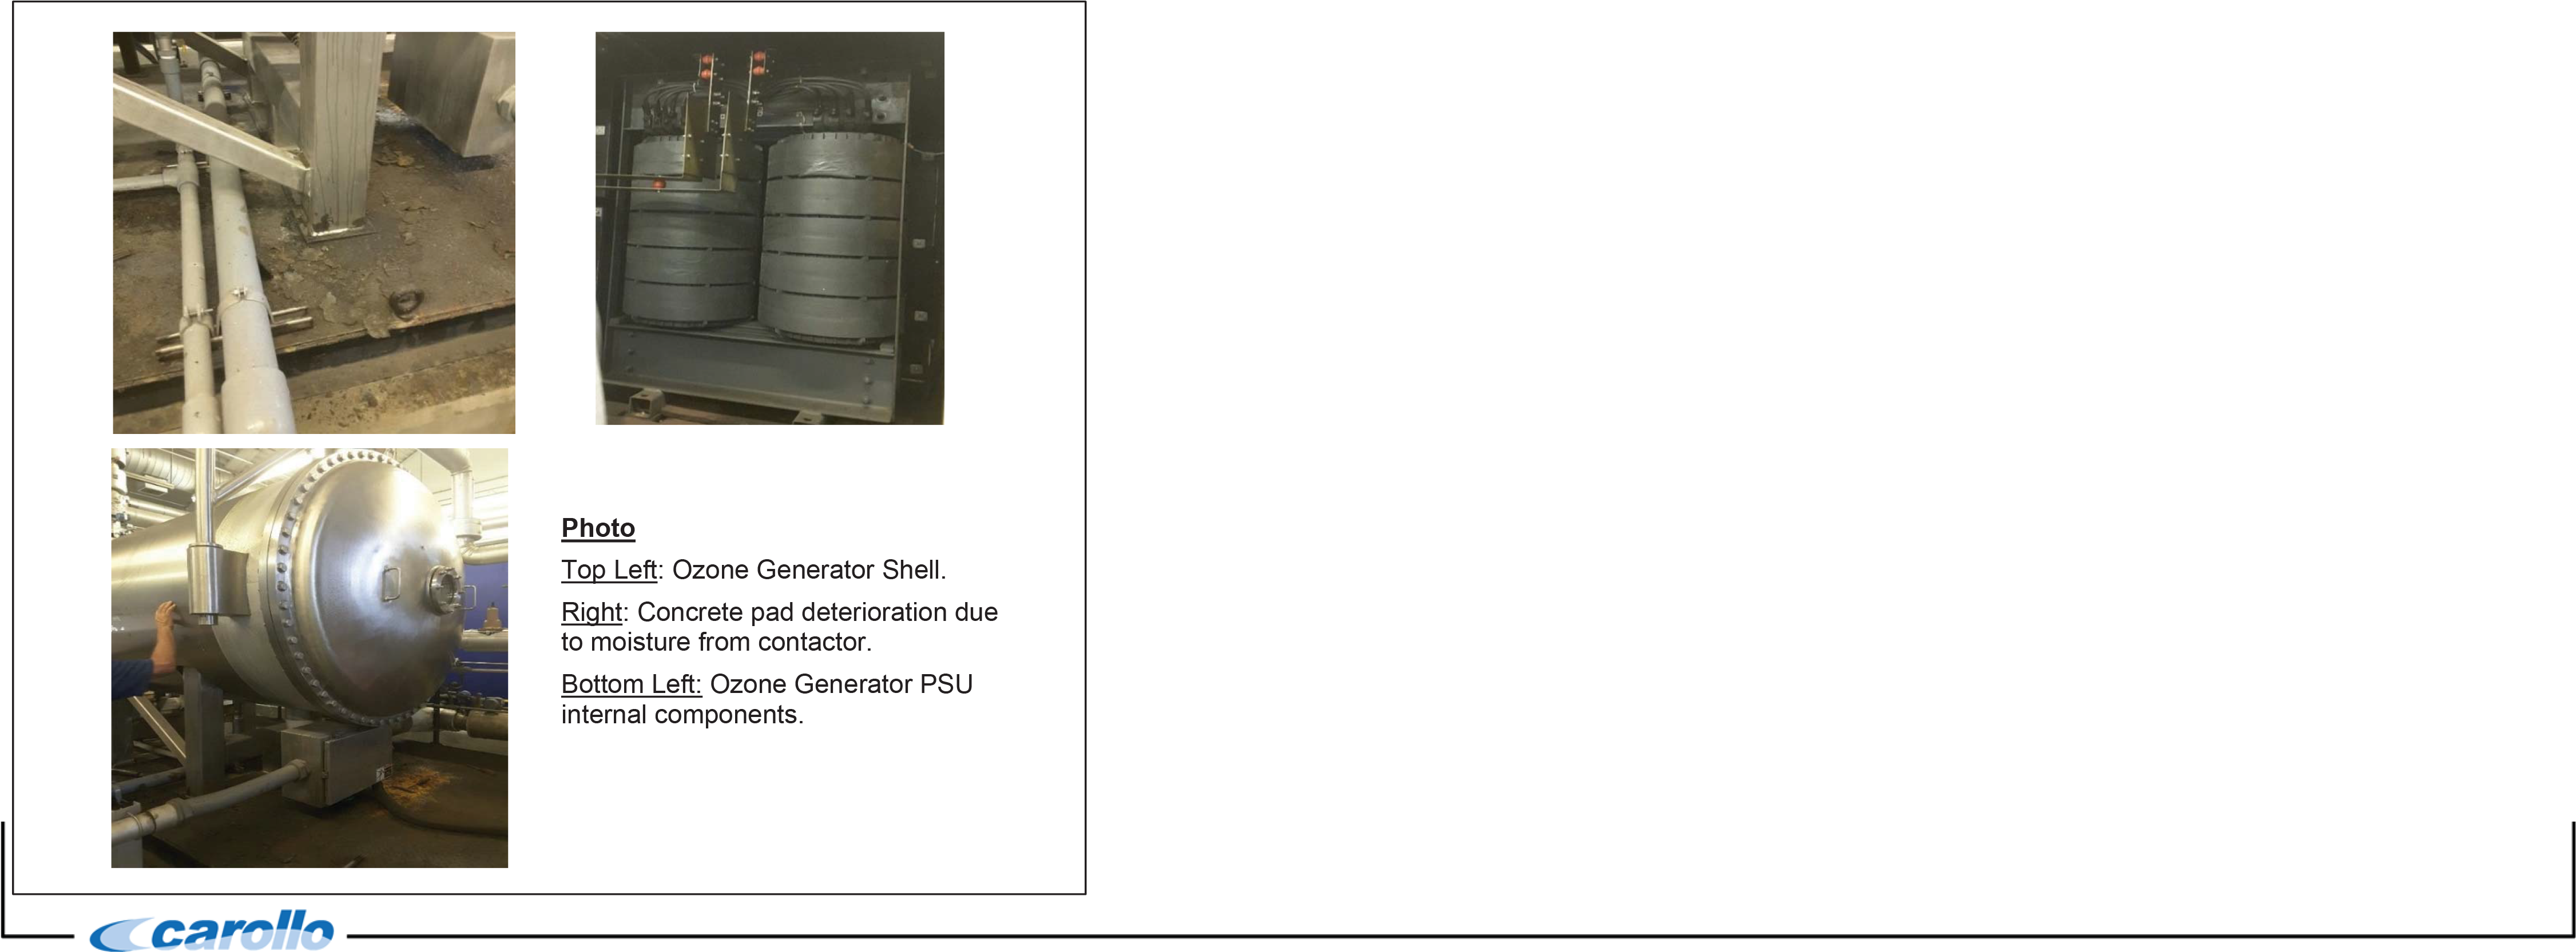
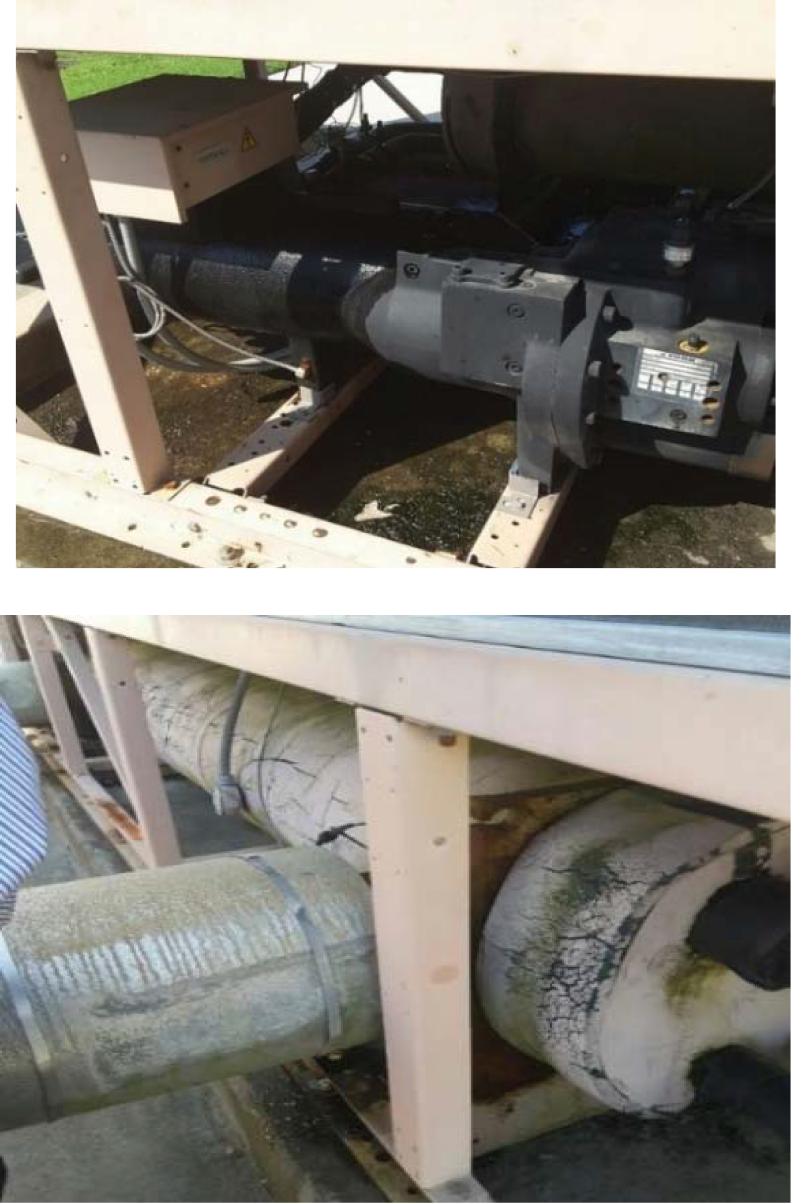
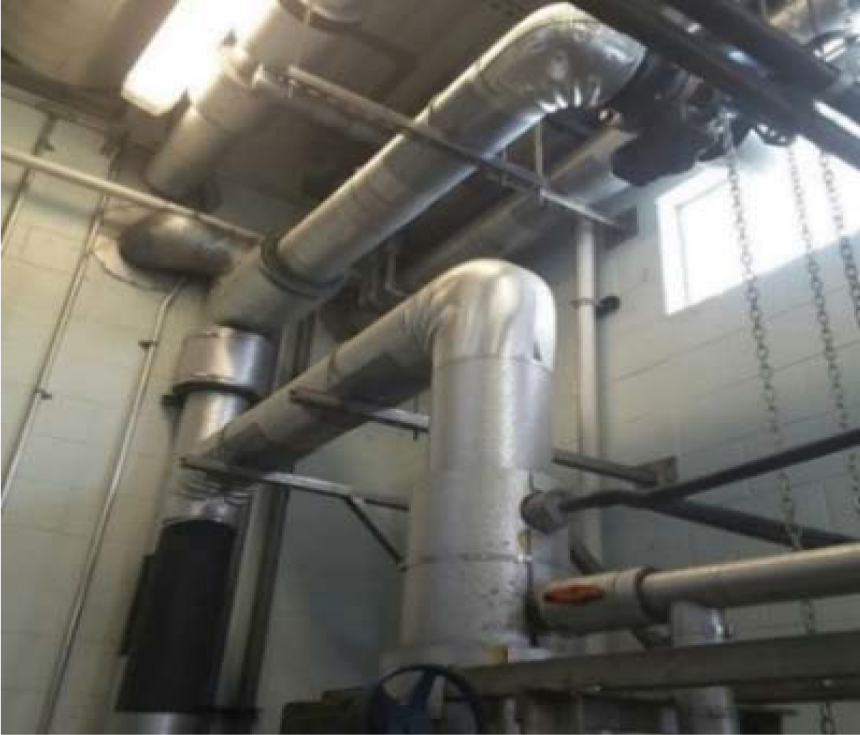
The desiccant dryer is performing well, demonstrated by the air stream's low dew point. A low dew point is critical to successful operation of the ozone generation system, since moisture inside an ozone generator can lead to frequent dielectric cleaning.
| Discipline | Year Installed/ Rehabilitated | Original Useful Life (years) | Criticality | Condition | Condition Fraction |
|---|---|---|---|---|---|
| Mechanical | 2001/2004(1) | 20 | Minor | Fair | 0.50 |
| Structural | 2001 | 25 | Minor | Fair | 0.50 |
| Electrical | 2001 | 30 | Minor | Fair | 0.50 |
Notes: (1) Nitrogen Boost Air compressor No. 2 was replaced in 2004.
2.4.4.2.3 Ozone Generators and Power Supply Units (PSUs)
The DLTWTF has two generators that can produce up to 5,100 pounds per day of ozone at an ozone-in-oxygen concentration equal to 5 percent by weight. To produce ozone, each generator is paired with a power supply unit (PSU) that transfers a high-voltage and high-frequency current to the dielectrics within the generator.
According to meetings and discussions with plant staff, the ozone generators have not performed in accordance with their designed production capacity. The PSUs have had issues with their capacitors and silicon controlled rectifiers (SCRs), affecting the distribution system's overall process performance and water quality. For this reason, the PSUs are in poor condition.
To address this issue, one of the following options is recommended:
- Replace both PSUs with new PSUs using OEM (direct purchase).
- Replace both PSUs and ozone generators with new (competitive bid).
- Replace both PSUs with new PSUs using OEM, with the goal of replacing PSUs and generators within 8 to 10 years.
All three options were evaluated for their costs, timeframe to complete, and feasibility.
Option 1 would allow for new PSU installation in 6 to 8 months (pending confirmation from Wedeco), since the equipment would be purchased directly from the OEM. This option, however, does not address the ozone generators.
Option 2 allows for a new system that can be competitively bid and would provide an overall more efficient ozone generation system, since the technology has significantly improved in the last 15 years. This option could take 1.5 to 2 years from implementation to installation.
Like Option 1, Option 3 would address immediate concerns within 6 to 8 months. However, the PSUs would be replaced again along with the generators in 8 to 10 years. This option is the most costly.
Because Option 2 is more efficient, it is recommended. The timing, costs, and scope associated with this option were used to develop the 15-year CIP in conjunction with recommendations made in Chapter 3.
The ozone generators are in overall fair condition. Because the production system is completely redundant, it is of moderate criticality. The generator shells are not insulated, causing water to collect on the concrete pad below from condensation, which causes concrete deterioration. The associated stainless steel piping is insulated and could not be assessed during the evaluation. Figure 2.9 shows the condition of these units.
Table 2.18 details the overall condition and criticality of the generator system.
| Discipline | Year Installed/ Rehabilitated | Original Useful Life (years) | Criticality | Condition | Condition Fraction |
|---|---|---|---|---|---|
| Mechanical | 2001 | 20 | Moderate | Fair | 0.50 |
| Structural | 2001 | 25 | Moderate | Fair | 0.50 |
| Electrical (PSUs) | 2001 | 20 | Severe | Poor | 0.20 |
Each generator's chiller equipment requires significant maintenance. Each one has R-22 refrigerant that is being phased out and is generally unavailable through traditional procurement means. As a result, the chillers are in poor condition.
To avoid curtailing ozone production if one chiller fails, replacing the chillers in 1 to 2 years is recommended. This project would be implemented while the PSUs are replaced, with possible cost savings because the scopes can be packaged, minimizing downtime. Since ozone production depends on these chillers and they are redundant, they have a moderate criticality rating.
The insulation on the chilled water piping was deteriorated, as shown in Figure 2.9. Table 2.19 details the ozone chillers condition.
| Discipline | Year Installed/ Rehabilitated | Original Useful Life (years) | Criticality | Condition | Condition Fraction |
|---|---|---|---|---|---|
| Mechanical | 2001 | 20 | Moderate | Poor | 0.20 |
| Structural | 2001 | 25 | Moderate | Fair | 0.50 |
| Electrical | 2001 | 30 | Moderate | Fair | 0.50 |
2.4.4.3 Contact System
2.4.4.3.1 Ozone Splitter Box
The Low Lift Pump Station conveys water to the splitter box before the ozone contactors via an 84-inch pipe. As Figure 2.10 shows, the structure is in fair condition, with minor ferric and algae build up. Staff also noted that the two 60-inch influent gates were replaced with stainless steel approximately 5 to 8 years ago and are assumed to be in very good condition.
2.4.4.3.2 Contactors
The DLTWTF has two ozone contactors that introduce ozone into the process water via diffusers for treatment. According to operations and maintenance manuals, the contactors are designed for 60 mgd each at a detention time of 23.3 minutes. However, they can handle up to 75 mgd at a shorter detention time of 20 minutes. Since the units are redundant, they are of moderate criticality.
The piping and valves associated with the system are of moderate criticality because the ozone feed capability has redundancy and is in good condition overall, as shown in Figure 2.10. For both contractors, the valve actuators in Zone E were out of service because ozone is not required at that point.
Carollo team members assessed the inside of the contactors during the spring 2016 dewatering/maintenance cycle. Figure 2.10 shows photos taken at that time. As the figure shows, the inside of the contactor is in poor condition because of notable concrete spalling and cracking.
These surfaces should be repaired before further degradation occurs and reinforcing bars become exposed. To accomplish this, sandblasting and repairing with shotcrete are recommended. Although costly, shotcrete provides added rebar protection and allows for quick return to service because of its short cure time.
The outside structure of the contactors is in fair condition, and concrete cracking was noted in the North and West walls of Contactor No. 1.
OZONE SYSTEM CONDITION PHOTOS 3
FIGURE 2.10
CITY OF TAMPA DAVID L. TIPPIN WTF MASTER PLAN

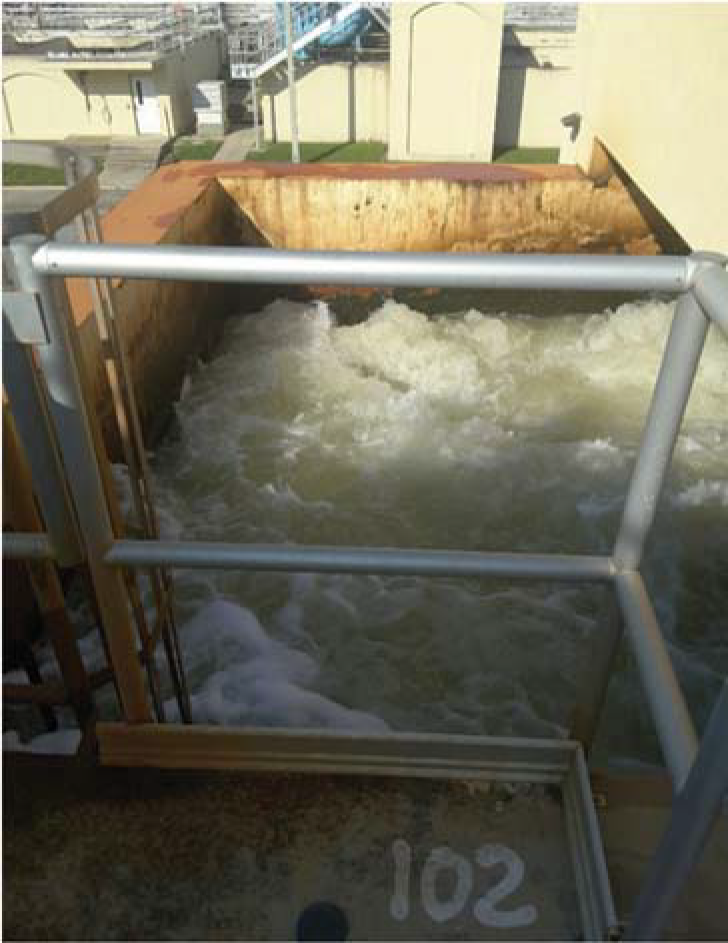
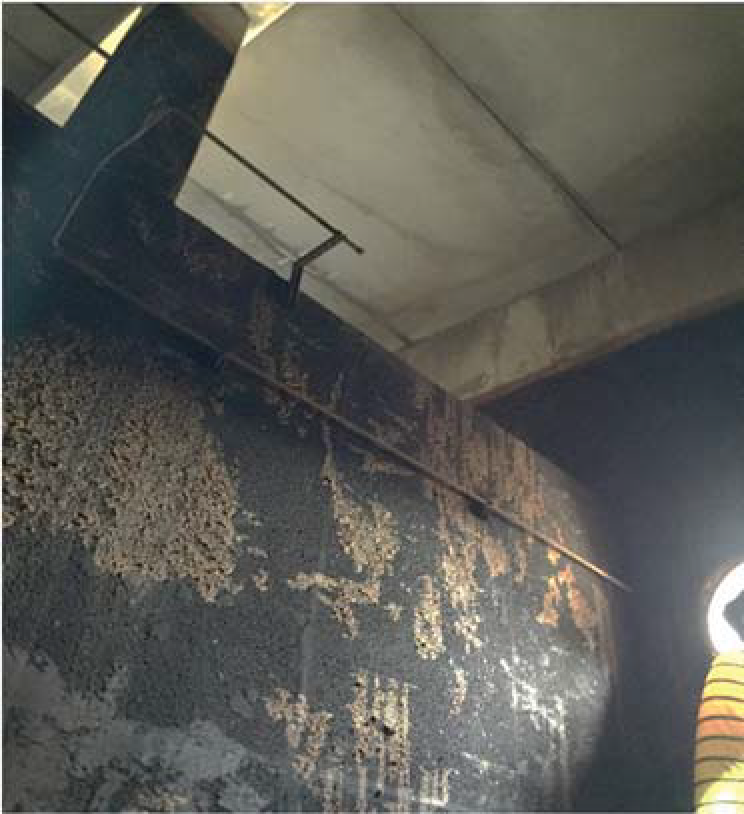
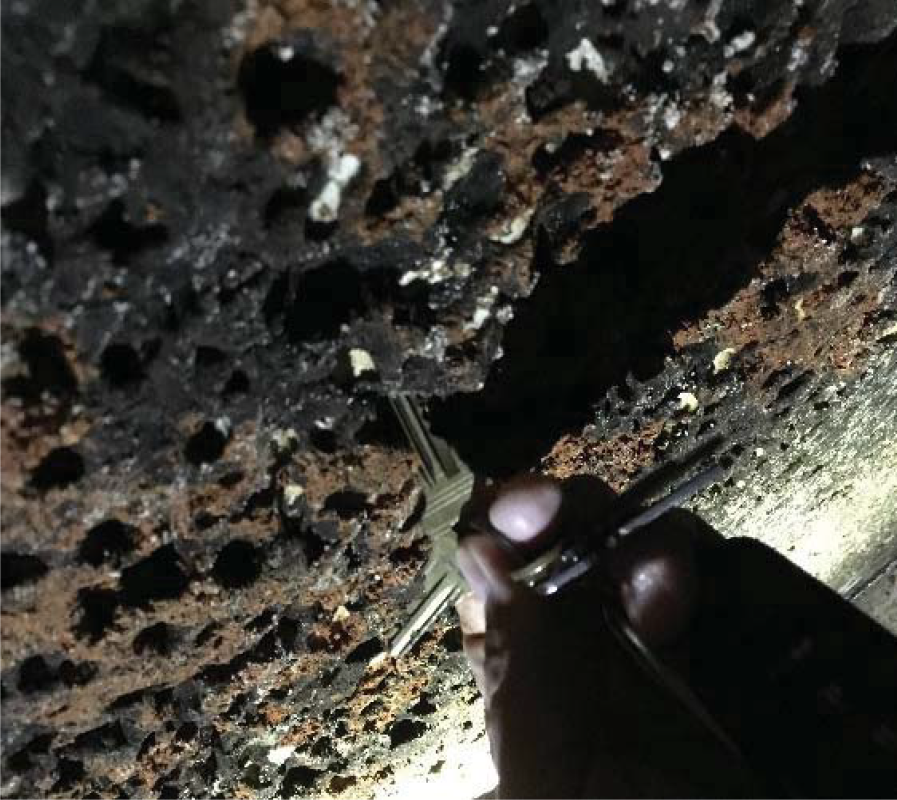
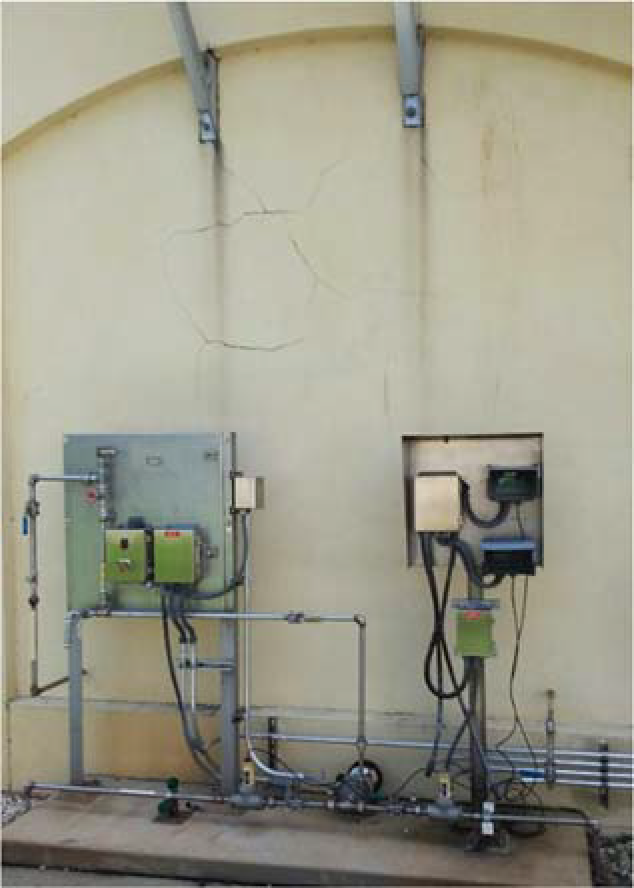
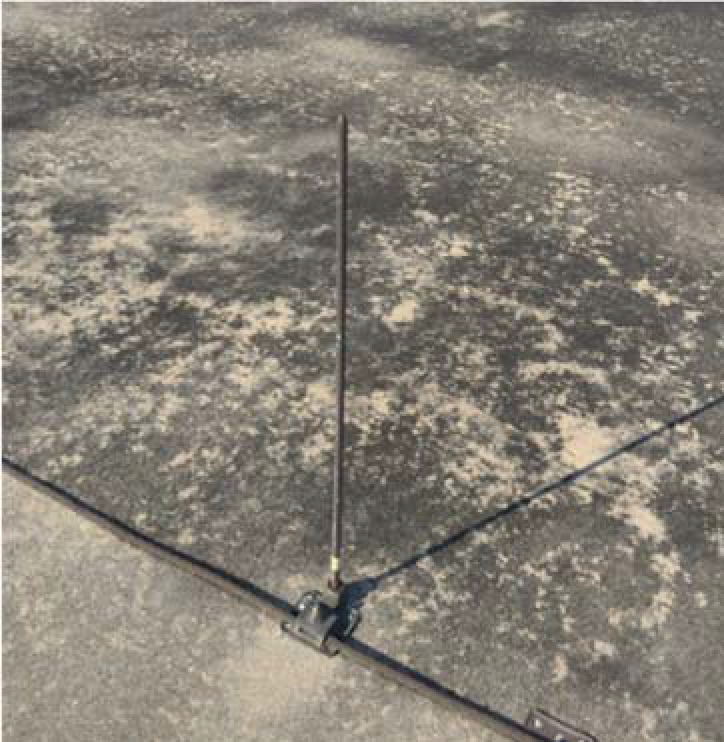
According to staff, the diffuser stones were replaced in 2016. Furthermore, sand from the Actiflo™ process had built up significantly in the contactors, with cleanings typically occurring once per year.
Since the condition assessment, it was determined that calcium carbonate was the buildup, not Actiflo™ sand. Recommendations for this issue are included in Chapters 3 and 5. For ease of maintenance, replacing the diffusers with gasketless type diffusers is recommended within 5 years. Table 2.20 contains more information on the contactors.
The lightning protection rods, shown in Figure 2.10, are installed on the contactor's roof. These rods pose a risk to plant personnel because they could impale someone that fell on top of them.
To improve safety and lightning protection, these rods should be mounted higher on the equipment of the ozone contactors. The current positioning likely offers little protection because of process equipment nearby that has a higher profile and would likely be struck by lightning first.
| Discipline | Year Installed/ Rehabilitated | Original Useful Life (years) | Criticality | Condition | Condition Fraction |
|---|---|---|---|---|---|
| Mechanical | 2001 | 20 | Moderate | Fair | 0.50 |
| Structural Interior | 2001 | 50 | Moderate | Poor | 0.20 |
| Structural Exterior | 2001 | 50 | Moderate | Fair | 0.50 |
| Electrical | 2001 | 30 | Moderate | Good | 0.70 |
2.4.4.4 Ozone Destruct Units and Off Gas Blowers
Any remaining ozone not taken up by the process water after the contactors has to be destroyed before release into the atmosphere. To complete this task, the facility has three ozone destruct units and associated off-gas blowers.
The three ozone destruct units are in fair condition, as shown in Figure 2.11. Because of their redundancy, they have minor criticality.
OZONE DESTRUCT SYSTEM AND SETTLED WATER JUNCTION BOX CONDITION PHOTOS

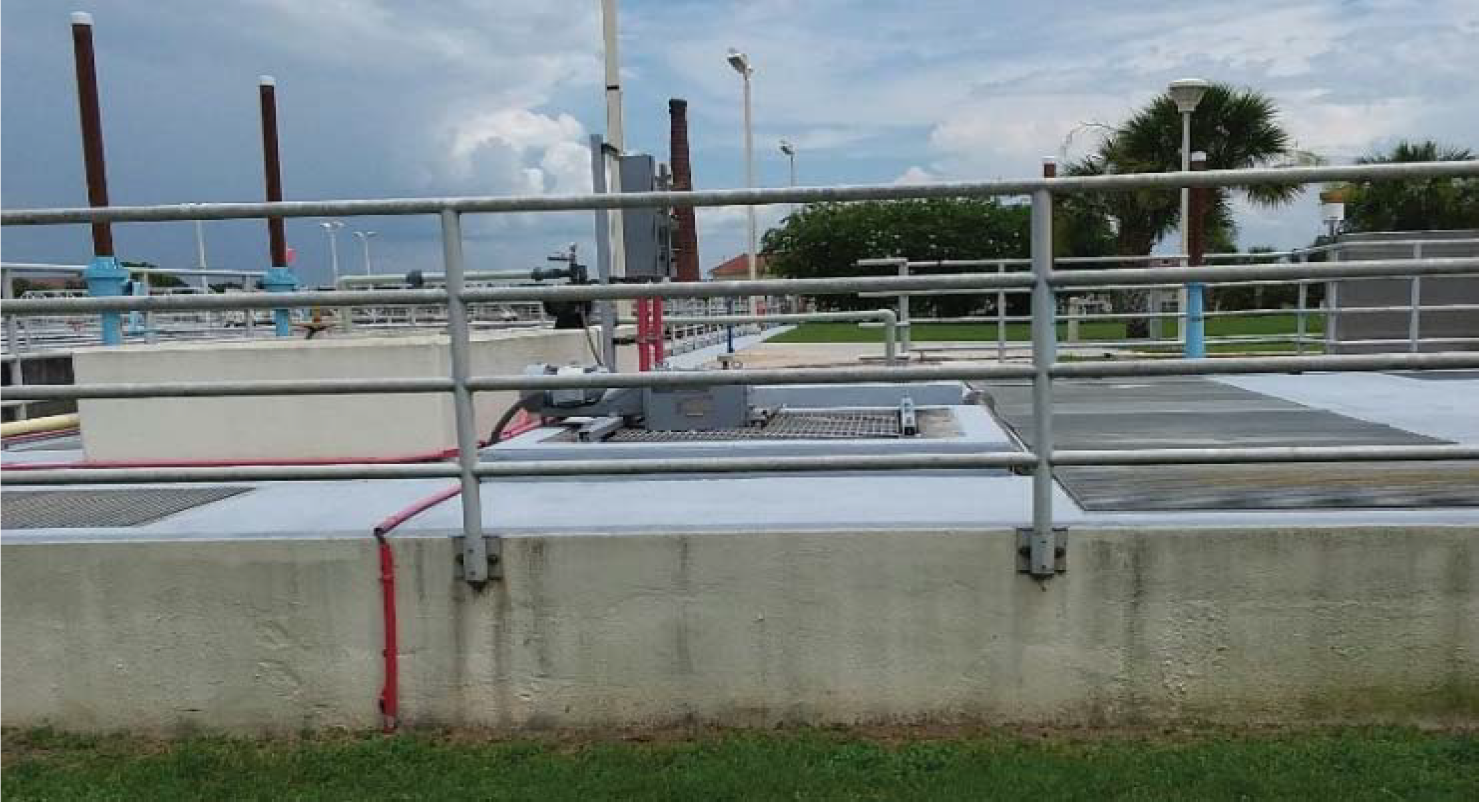
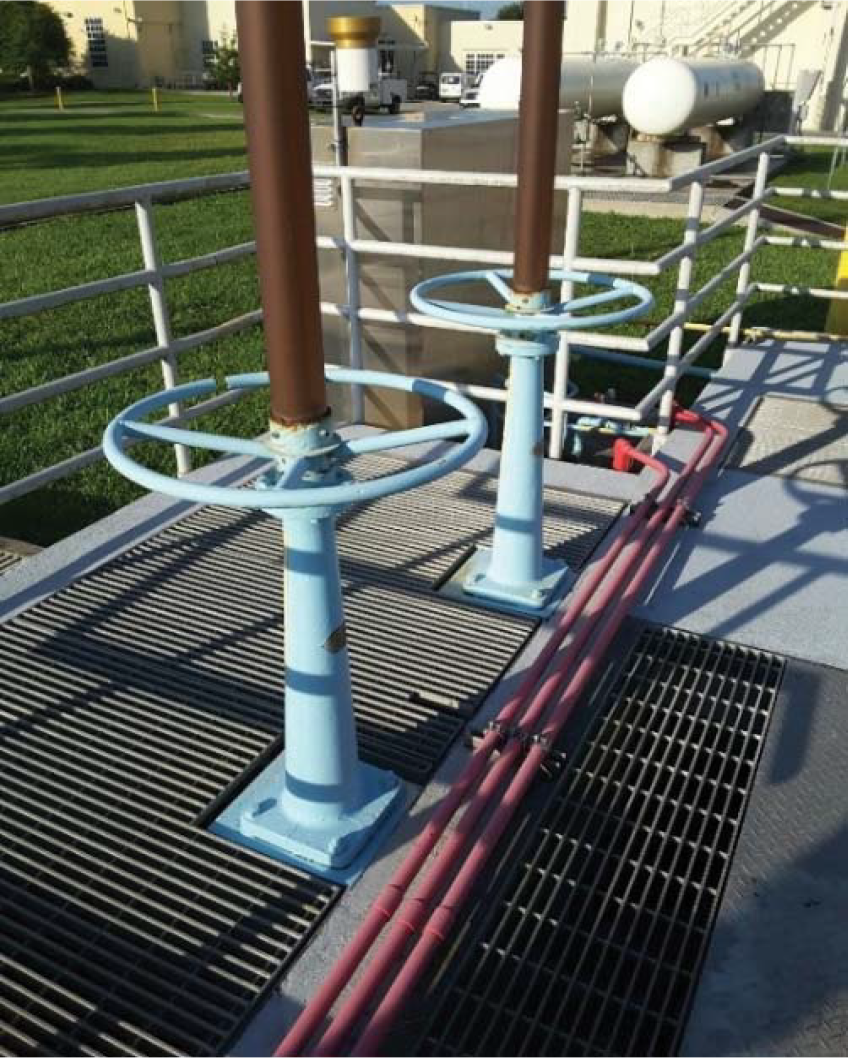
FIGURE 2.11
CITY OF TAMPA DAVID L. TIPPIN WTF MASTER PLAN
However, the exterior of the motor on ozone destruct unit No. 2 is experiencing corrosion that has caused coating delamination. Additionally, the Watlow single loop controllers for the preheaters are near the end of their useful life and are recommended for replacement; repair may not be possible due to availability of spare parts. The inlet valves on Ozone Destruct Units No. 1 and No. 3 are in poor condition and are also recommended for replacement.
The three off gas blowers are in good condition mechanically and electrically. Table 2.21 details the destruct system's overall condition.
| Discipline | Year Installed/ Rehabilitated | Original Useful Life (years) | Criticality | Condition | Condition Fraction |
|---|---|---|---|---|---|
| Mechanical | 2001 | 20 | Minor | Fair-Good | 0.50 - 0.70 |
| Structural | 2001 | 25 | Minor | Good | 0.70 |
| Electrical | 2001 | 30 | Minor | Good | 0.70 |
2.4.4.5 Pre-Filter Junction Box (Settled water junction box)
The pre-filter junction box (also known as settled water junction box) receives ozonated water via 84-inch pipeline and acts as a splitter box to distribute flow to the filtration system. Because of these roles, the junction box is of fatal criticality.
Concrete cracking was noted in the structure, as shown in Figure 2.11. The stainless steel gates were reportedly installed approximately 30 years ago and are assumed to be in fair condition; however, staff have noted the inability to operate the gates recently. Therefore replacement of these gates is included in the CIP. Overall, the structure is in fair condition, as noted in Table 2.22.
| Discipline | Year Installed/ Rehabilitated | Original Useful Life (years) | Criticality | Condition | Condition Fraction |
|---|---|---|---|---|---|
| Mechanical | 2001 | 20 | Fair | 0% | 0.50 |
| Structural | 2001 | 50 | Fair | 0% | 0.50 |
2.4.5 Chemical Systems
The following chemical systems were evaluated for their associated piping, pumping, storage, and other associated appurtenances:
- Ferric sulfate.
- Fluoride.
- Hydrogen peroxide.
- Polymer.
- Ammonia.
- Sulfuric acid.
- Caustic.
- Chlorine.
- Lime.
Most containment structures and storage tanks for each chemical system are of moderate criticality. This rating was because of the public health and safety and possible environmental impacts that would occur if the structure fails.
2.4.5.1 Ferric Sulfate
Ferric sulfate is used a coagulant for the Actiflo™ and conventional treatment processes to remove suspended solids from water. The ferric system consists of three pumps and three storage tanks with associated piping and valves.
2.4.5.1.1 Pumps, Piping, and Valves
Typically, ferric is fed from the ferric storage tanks to the Actiflo™ and conventional treatment trains via gravity. When hydraulic conditions require it, one of three ferric pumps can be used. The air operated diaphragm metering pumps were replaced in 2015, have available spares, and are in good condition. However, the associated valves and piping should be replaced due to pitting and cracking. The electrical conduits are in fair condition, and the control panels in fair condition. Table 2.23 provides more information.
| Discipline | Year Installed/ Rehabilitated | Original Useful Life (years) | Criticality | Condition | Condition Fraction |
|---|---|---|---|---|---|
| Mechanical Piping | 40 | Moderate | Very Poor | 0.10 | |
| Mechanical Pumps | 2015 | 20 | Minor | Good | 0.70 |
| Structural | 1997/2001(1) | 25 | Moderate | Poor-Fair | 0.60 - 1.50 |
| Electrical | 2015 | 30 | Minor | Fair | 0.50 |
| Notes: (1) Tank 1 and 2 were originally installed in 1997, and Tank 1 was rehabilitated in 2013. Tank 3 was installed in 2001. The containment structure was built in the 1990s. | |||||
Storage and Containment
Three 62,000-gallon conical bottom ferric sulfate storage tanks are available. Tank No. 1 was rehabilitated in 2013. Tanks No. 1 and No. 2 were originally installed over 30 years ago, and Tank No. 3 was installed in 2001. Tanks No. 1 and No. 3 were recently relined.
Tank No. 2 and its associated piping have severe corrosion. The containment structure was in poor condition due to severe corrosion. Figure 2.12 shows the condition of selected features.
2.4.5.2 Fluoride
Fluoride (hydrofluosilicic acid) is added to the process after primary disinfection to prevent tooth decay in consumers. The DLTWTF can add fluoride before filtration or at the blending chamber at a maximum dose of 1.1 mg/L using 23 percent hydrofluosilicic acid solution. The fluoride system includes three pumps, a day tank, a bulk storage tank, and associated valving and piping.
2.4.5.2.1 Pumps, Piping, and Valves
The system consists of three diaphragm metering pumps, piping, and valves installed in 2015. As a result, the equipment is in very good condition mechanically, structurally, and electrically and does not need to be replaced in the next 15 years. The system's criticality is no impact because the pumps have redundancy and failure of this system would not impact plant capacity. Table 2.24 provides more information for this system.
2.4.5.2.2 Storage
The fluoride day tank is serviced by the 10,000 gallon vertical fiberglass reinforced plastic bulk storage tank, with both in very good condition structurally. The system has no impact to plant capacity since fluoride is not required in water treatment under the Safe Drinking Water Act. Figure 2.12 shows the condition of selected features.
CHEMICAL SYSTEMS CONDITION PHOTOS 1

| Discipline | Year Installed/ Rehabilitated | Original Useful Life (years) | Criticality | Condition | Condition Fraction |
|---|---|---|---|---|---|
| Mechanical | 2015 | 20 | No Impact | Very Good | 1.00 |
| Structural | 2015 | 25 | No Impact | Very Good | 1.00 |
| Electrical | 2015 | 30 | No Impact | Very Good | 1.00 |
2.4.5.3 Hydrogen Peroxide
The DLTWTF uses hydrogen peroxide for two reasons:
- To quench any residual ozone before the biologically activated carbon filters.
- To add within the ozone contactor to promote advanced oxidation for taste and odor compounds.
The system consists of four (three duty, one standby) diaphragm type metering pumps and two vertical, double-walled storage tanks.
2.4.5.3.1 Pumps, Piping, and Feed
Hydrogen peroxide can be pumped and fed to Cell 6 of the ozone contactor (for taste and odor) or in the pre-filter junction box (to quench ozone residual). The typical dosage for quenching is 0.15 mg/L, and the dosage for taste and odor is equal to or less than 0.7 mg/L. The four hydrogen peroxide pumps in service are in fair condition and have minor criticality because of adequate redundancy. The piping associated with the system is in good condition and also has minor criticality. Table 2.25 provides more information.
| Discipline | Year Installed/ Rehabilitated | Original Useful Life (years) | Criticality | Condition | Condition Fraction |
|---|---|---|---|---|---|
| Mechanical | 2001 | 20 | Minor | Fair | 0.50 |
| Structural | 2001 | 25 | Minor | Fair | 0.50 |
| Electrical | 2001 | 30 | Minor | Fair | 0.50 |
2.4.5.3.2 Storage
The two bulk storage tanks are 2,100 gallons each and are in fair condition. Figure 2.12 shows the condition of selected features.
2.4.5.4 Polymer
Polymer is used in conjunction with ferric sulfate to enhance the suspended solids removal processes (conventional and Actiflo™ systems). The DLTWTF receives dry polymer loaded manually into a dry polymer blend unit and combined with water before being fed to the process trains. The polymer system consists of six metering pumps, two dry storage bins, two feeders, two mix tanks, and two mixers. Additional observations on functionality and process efficiency for the polymer system are included in Chapter 3.
2.4.5.4.1 Feeder System
Dry polymer is fed into the polymer mix tanks using a constant rate screw feeder with a two-stage wetting chamber. Installed in 2001, the dry feeder systems are known to have mechanical issues because of their age. The joints have undergone structural re-welding in the past. Table 2.26 provides additional notes on this issue.
| Discipline | Year Installed/ Rehabilitated | Original Useful Life (years) | Criticality | Condition | Condition Fraction |
|---|---|---|---|---|---|
| Mechanical (feeder system) | 2001 | 20 | Moderate | Fair | 0.50 |
| Mechanical (pumps, piping, and mixers) | 2001 | 25 | Minor | Good | 0.70 |
| Structural | 2001 | 25 | Minor | Fair | 0.50 |
| Electrical | 2001 | 30 | Minor | Good | 0.70 |
2.4.5.4.2 Pumps, Mixers, and Piping
Because they are regularly changed out and rebuilt, the six diaphragm metering pumps are in good condition, with minor criticality because of their abundant redundancy. Although originally installed in 2001, the polymer booster pump has since been rebuilt and is in fair condition, with minor criticality due to spare pump availability.
The polymer process piping is in good condition and of moderate criticality. The two polymer stainless steel mixers are in good condition, with minor corrosion noted. The motors, controls, and electrical components of the pumps and mixers are in good condition.
2.4.5.4.3 Storage
The two dry polymer storage bins each have a capacity of 250 pounds and are in fair condition. The two vertical fiberglass reinforced plastic mix tanks are 10 feet in diameter and are each rated for 3,000 gallons. They are also in fair condition. Figure 2.13 shows the condition of selected features.
2.4.5.5 Ammonia
Anhydrous ammonia is used with chlorine to create monochloramine for secondary disinfection in the distribution system. The ammonia dosage is directly correlated to the chlorine dosage. It is fed either into the blending chamber or in the low lift pump station when ASR is used for bromate control. The system contains four ammoniators and two bulk storage tanks.
2.4.5.5.1 Feed Equipment and Piping
The four ammoniators are in good condition, although a lack of spare parts availability was noted. Because the feed equipment has adequate redundancy, it is of minor criticality. The connections, diffusers, and injectors are in good condition and have been maintained regularly.
Minimal corrosion was observed throughout, including the electrical conduit and wiring, which was damaged by a chlorine leak in 2012. The piping is in good condition, with a moderate leak near the clearwell. Plans for a new chemical trench in the future were noted. Condition of the overall system is included in Table 2.27.
| Discipline | Year Installed/ Rehabilitated | Original Useful Life (years) | Criticality | Condition | Condition Fraction |
|---|---|---|---|---|---|
| Mechanical | 2011-2014(1) | 20 | Minor | Good | 0.70 |
| Structural | 2000 | 25-50(2) | Minor | Fair -(3) Good | 0.50 - 0.70 |
| Electrical | 2001 | 30 | Minor | Fair | 0.50 |
| Notes: (1) Three of the four ammoniators were installed in 2011; one was installed in 2014. (2) The containment pad has an OUL of 50 years, and the storage tanks have an OUL of 25 years. (3) The structural concrete support pad is in fair condition, while the tanks are in good condition. | |||||
2.4.5.5.2 Storage
The concrete pad for the ammonia storage was installed in 2000. The structure itself is in fair condition.
The two ammonia tanks each have a 2,000-gallon capacity. Inspected in 2011, they were determined to be in good condition. However, as Figure 2.13 shows, spalling was noted in the pad for Ammonia Tank 1. Immediate replacement of these tanks is not recommended unless replaced with new ammonia system for process reasons.
2.4.5.5.3 Pumps and Piping
The centrifugal feed pumps, rated for 8.0 gpm, were installed in the last three years, and the system has a redundant pump. Shown in Figure 2.14, these pumps are in good condition overall and are of minor criticality. The associated piping and electrical systems are in good condition. Table 2.28 provides more details.
| Discipline | Year Installed/ Rehabilitated | Original Useful Life (years) | Criticality | Condition | Condition Fraction |
|---|---|---|---|---|---|
| Mechanical | 2013/2014(1) | 20 | Minor | Good | 0.70 |
| Structural | 1998/2001 | 25-50(2) | Minor | Fair-Good | 0.50 - 0.70 |
| Electrical | 2001 | 30 | Minor | Good | 0.70 |
| Notes: (1) One pump installed in 2013, the other in 2014. (2) The containment pad area has as an OUL of 50 years, and the storage tanks have an OUL of 25 years. | |||||
2.4.5.5.4 Storage
Three sulfuric acid storage tanks are available, each able to store 10,000 gallons. Tanks 2 and 3 were rehabilitated in 2013 and are in good condition. Tank 1 was installed in 1998 and is in fair condition. Chemical damage that resulted in pitting was noted in the concrete. The stairway legs have minor corrosion, as shown in Figure 2.14.
2.4.5.6 Caustic
Caustic (sodium hydroxide) is used to increase the water's pH after sedimentation and before the ozonation process. The 50 percent sodium hydroxide solution is typically dosed at the end of the conventional sedimentation basins before the low lift pump station. However, it can be added at the pre-filter junction box and blend chamber. The system consists of three bulk storage tanks and three feed pumps.
Chemical Systems Condition Photos 2

CHEMICAL SYSTEMS CONDITION PHOTOS 3
FIGURE 2.14

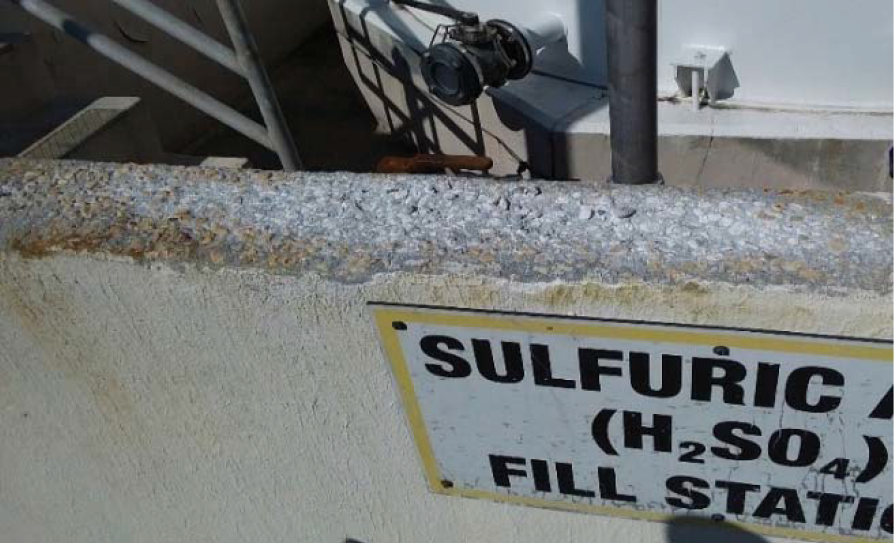
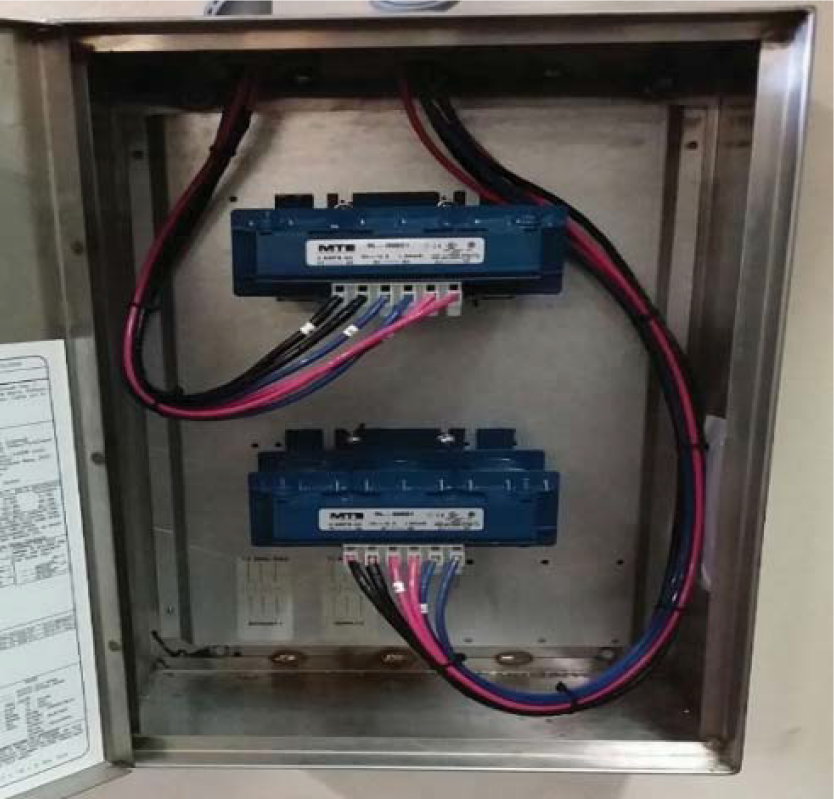
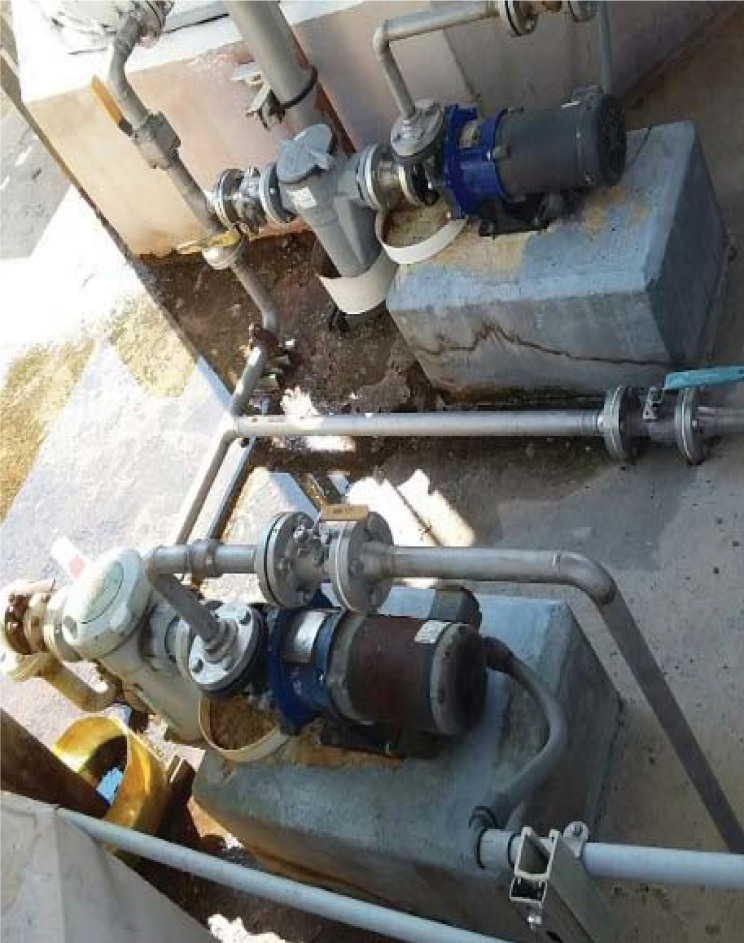
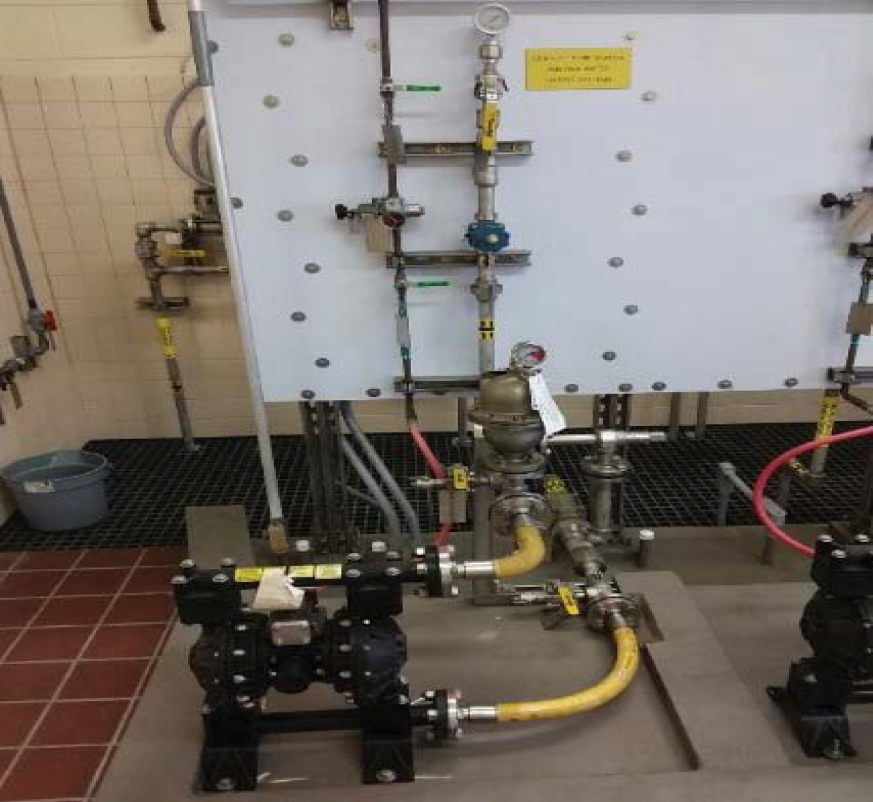
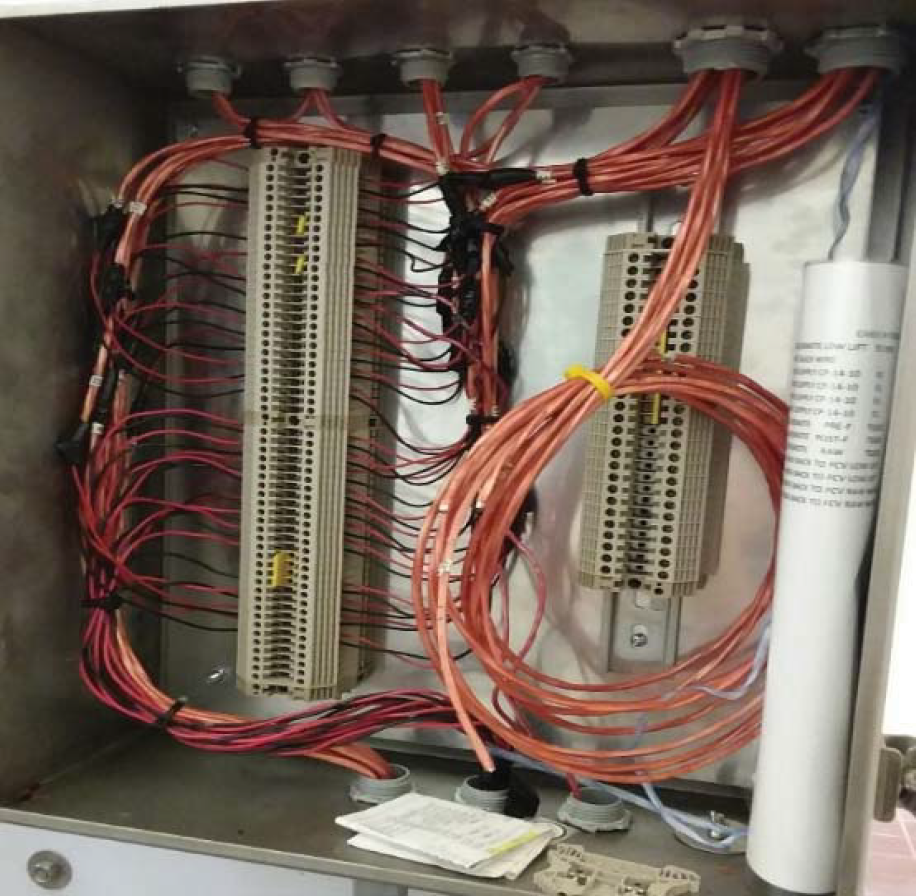
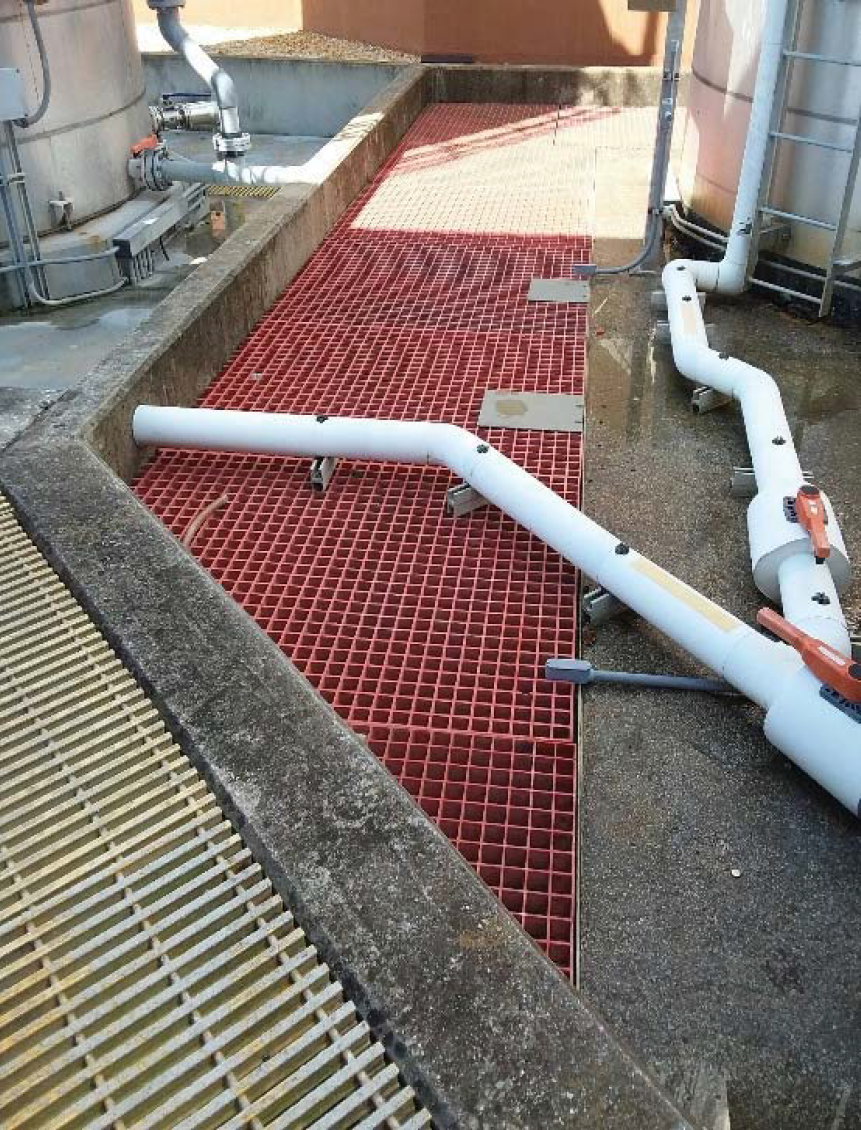
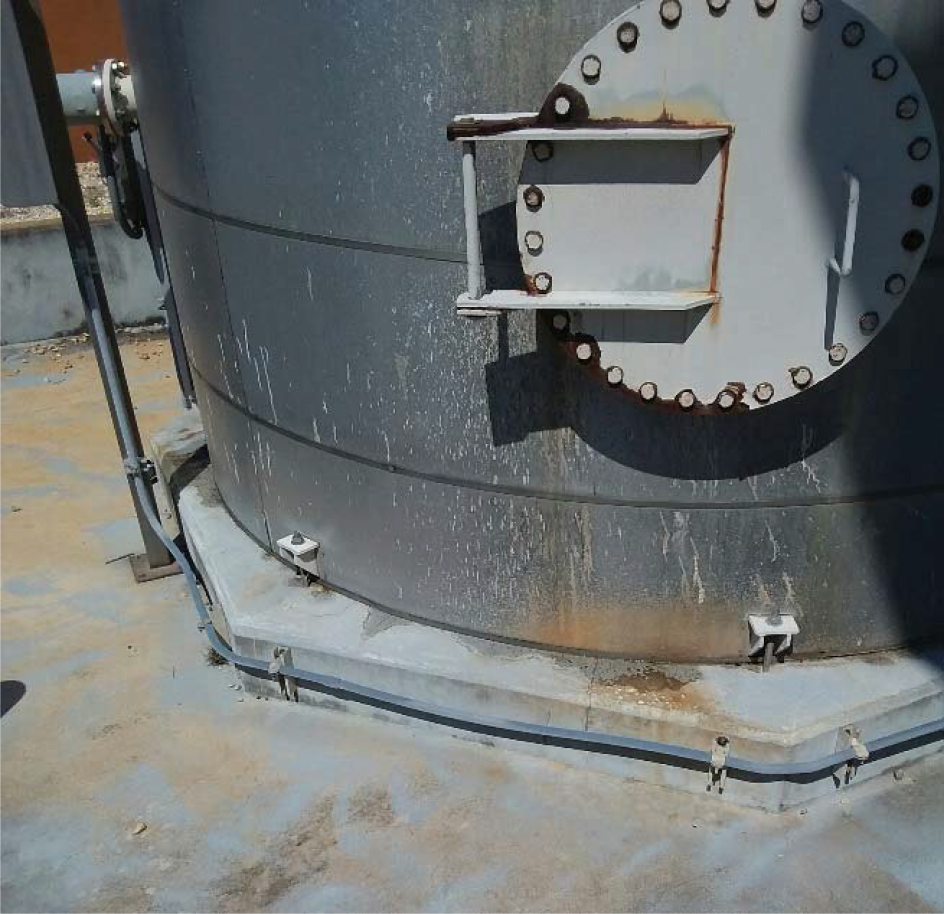
2.4.5.6.1 Pumps and Piping
Installed in 2015, the three caustic feed pumps and process piping are in very good condition, with overall good reliability, functionality, and spare parts availability. Shown in Figure 2.14, the caustic system's electrical components are in good condition, with minor criticality.
Table 2.29 provides more details.
| Discipline | Year Installed/ Rehabilitated | Original Useful Life (years) | Criticality | Condition | Condition Fraction |
|---|---|---|---|---|---|
| Mechanical | 2015 | 20 | Minor | Very Good | 1.00 |
| Structural | 1995/2001(1) | 25-50(2) | Severe | Fair | 0.50 |
| Electrical | 2001 | 30 | Minor | Good | 0.70 |
(1) Tanks 1 and 2 installed in 1995 with Tank 3 installed in 2001.
(2) The containment pad area has as an OUL of 50 years and the storage tanks have an OUL of 25 years.
2.4.5.6.2 Unloading and Storage
The caustic storage system consists of three 20,000 gallon tanks, all in fair condition. Storage Tanks 1 and 2 were installed in 1995. They had severe corrosion at the bases and at the steel bolts of the hatches. Installed in 2001, Tank 3 experiences corrosion in the steel bolts of the hatch.
The containment structure for the three tanks is in fair condition, with minor cracking. According to the record drawings and current design, the volume of this structure is suspected to be inadequate if one tank fails. The tank containment heaters, which are replaced occasionally because of burnout, are also in fair condition.
One containment structure houses Tanks 1 and 2, and the containment structure other houses Tank 3. To ensure proper containment, connecting the two containment areas is recommended.
2.4.5.7 Chlorine
Chlorine is used with ammonia to form monochloramine for secondary disinfection. When using ASR, chlorine can also be dosed at the end of the conventional sedimentation basins, followed by ammonia addition for bromate control. The system consists of four chlorine evaporators and six chlorinators, a rail car unloading system, and a chlorine booster pump.
Appendix 5A, attached to this master plan report, contains recommendations about replacing this system with an on-site hypochlorite generation system because of safety concerns.
2.4.5.7.1 Pumps and Piping
The chlorine booster pump is approximately 10 years old and is used only when the DLTWTF uses ASR wells for source water because of pressure requirements. Thus, it is of minor criticality.
The chlorinated PVC piping was installed in 2001, and the eductors were installed in 2005. Both are in fair condition. Installed in 2015, the steel piping at the chlorine cars and evaporators are in good condition. Plans to install a new chemical trench for this system were noted.
2.4.5.7.2 Chlorinators and Evaporators
Chlorinators No. 1 through 4 were installed in 2015 and are in very good condition. Chlorinators No. 5 and No. 6 were installed in 2001 and are in fair condition.
Installed in 2015, the four evaporators were each designed to process 10,000 pounds per day of chlorine. The evaporators, shown in Figure 2.15, are all in very good condition. The electrical annunciator panel and associated electrical components are in fair condition, as Table 2.30 shows.
| Discipline | Year Installed/ Rehabilitated | Original Useful Life (years) | Criticality | Condition | Condition Fraction |
|---|---|---|---|---|---|
| Mechanical (pump, piping, eductors) | 2001 | 20 | Minor | Fair-Good | 0.50 - 0.70 |
| Mechanical (chlorinators, evaporators) | 2015 | 20 | Minor | Fair- Very Good | 0.50 - 1.00 |
| Structural | 2001 | 25 | Minor | Fair | 0.50 |
| Electrical | 2001 | 30 | Minor | Fair | 0.50 |
2.4.5.7.3 Storage
Chlorine is delivered via two rail cars (shown in Figure 2.15) and stored in the chemical building. The two steel platforms are in fair condition. The three ventilation fans in the rail car room are in poor condition and could pose a safety hazard. Thus, they are recommended for replacement immediately.
CHEMICAL SYSTEMS CONDITION PHOTOS 4
FIGURE 2.15
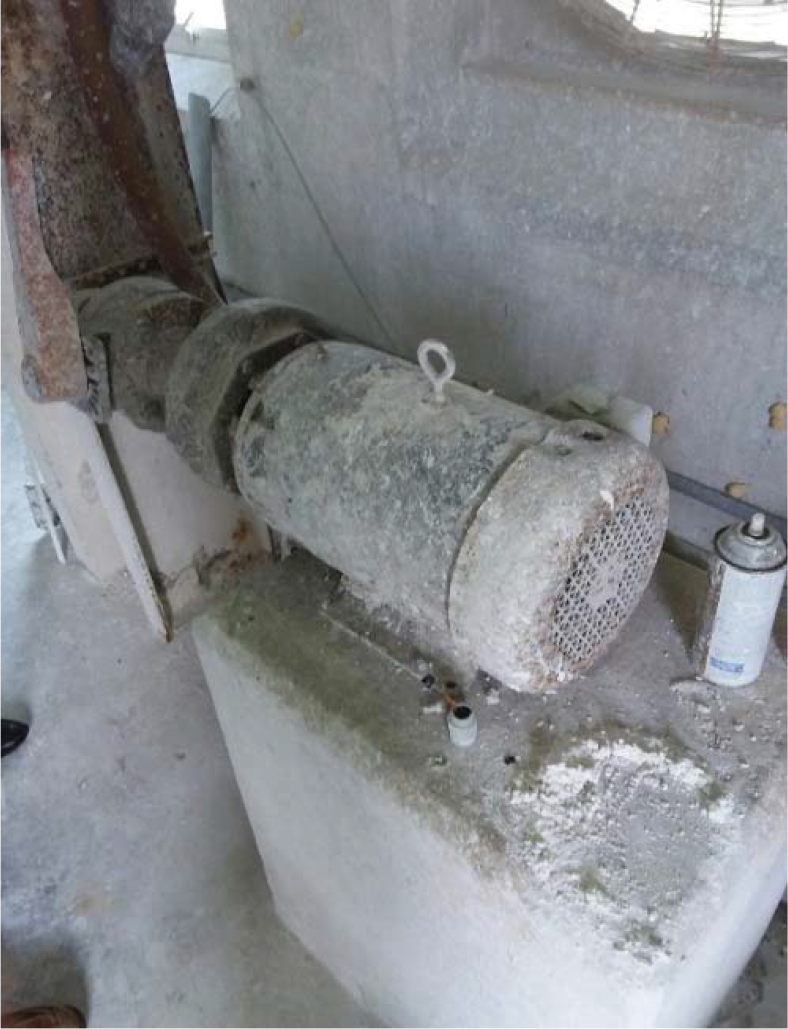
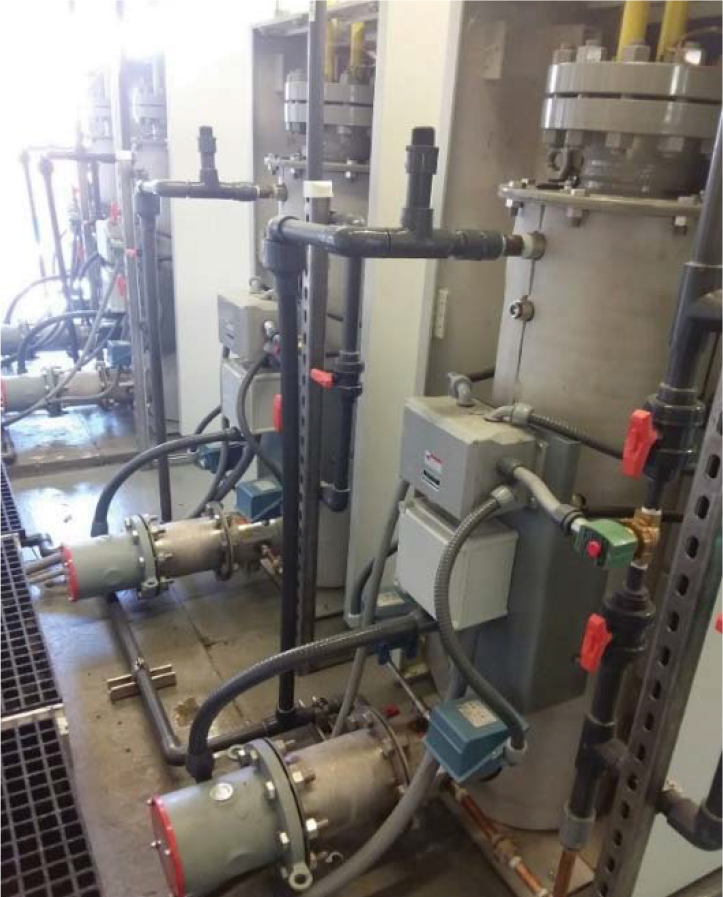
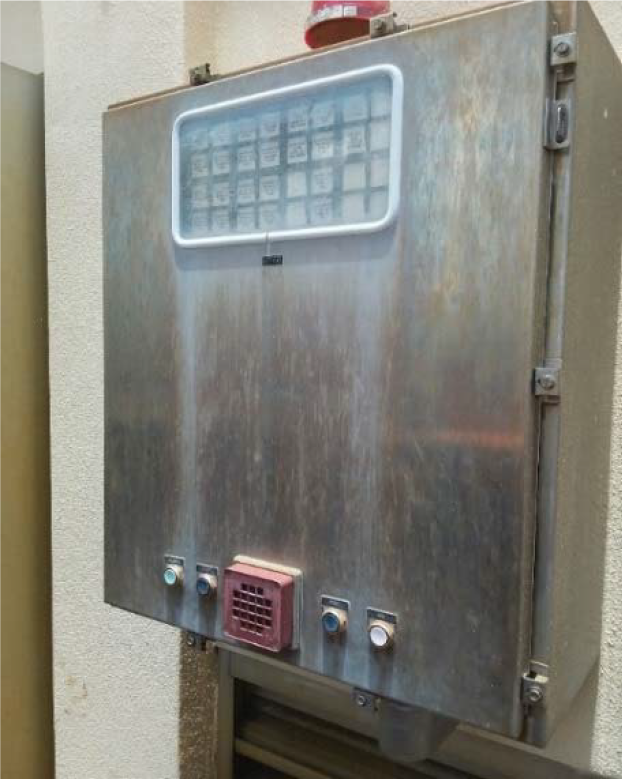
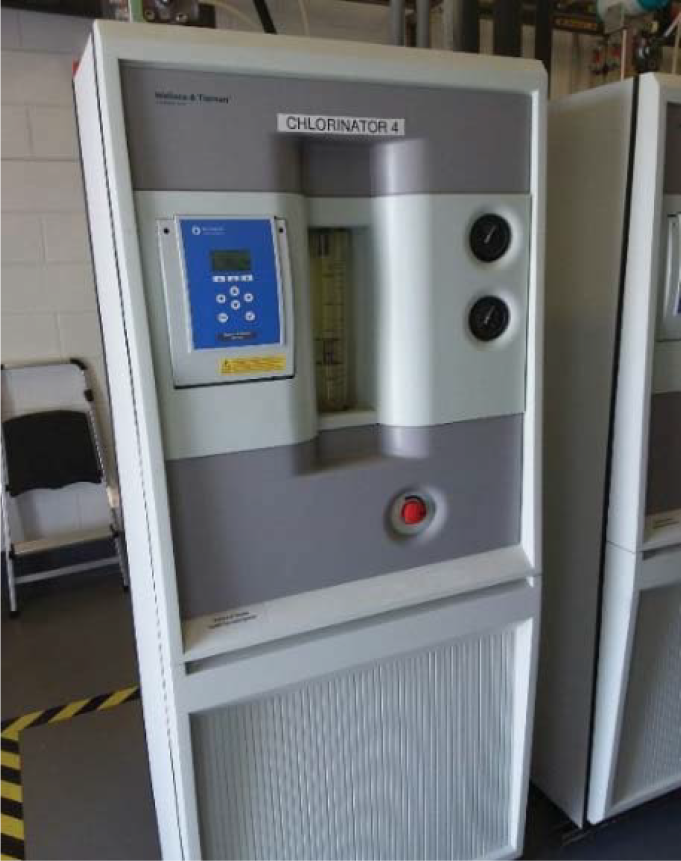
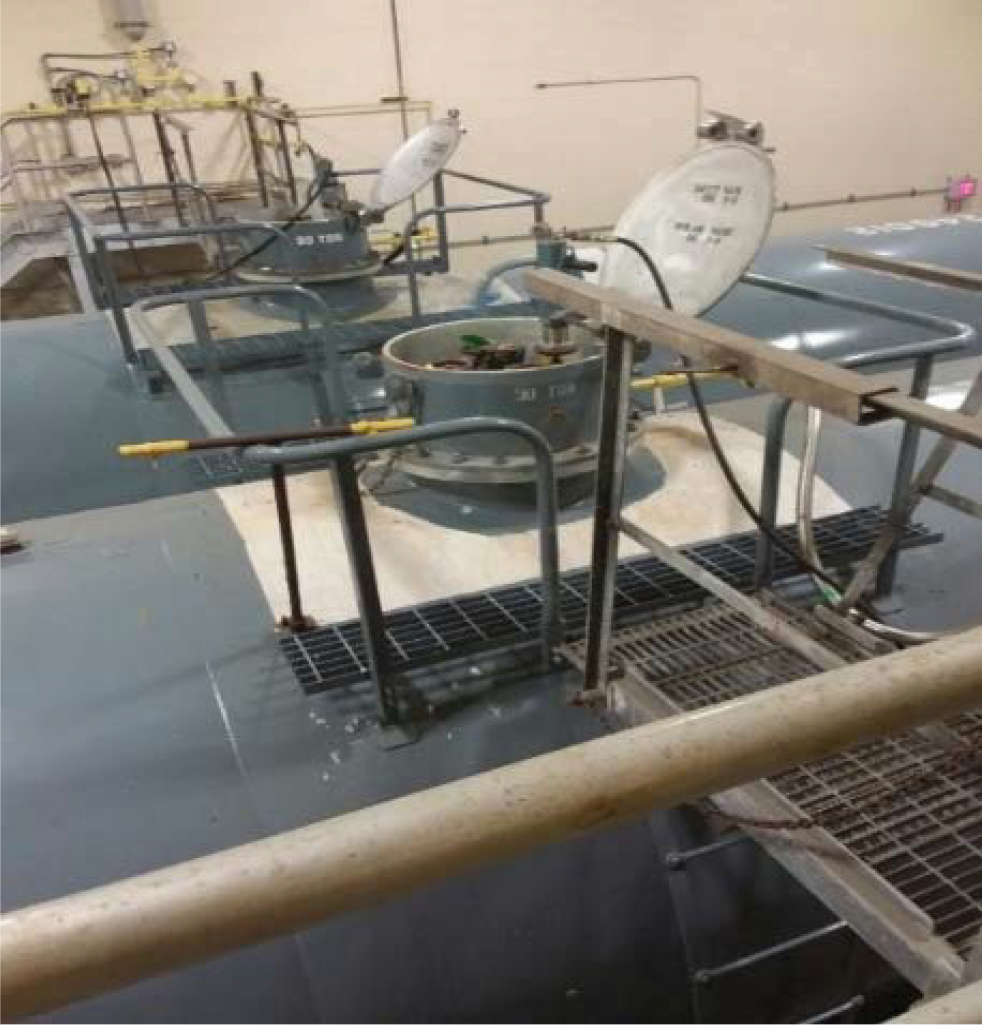
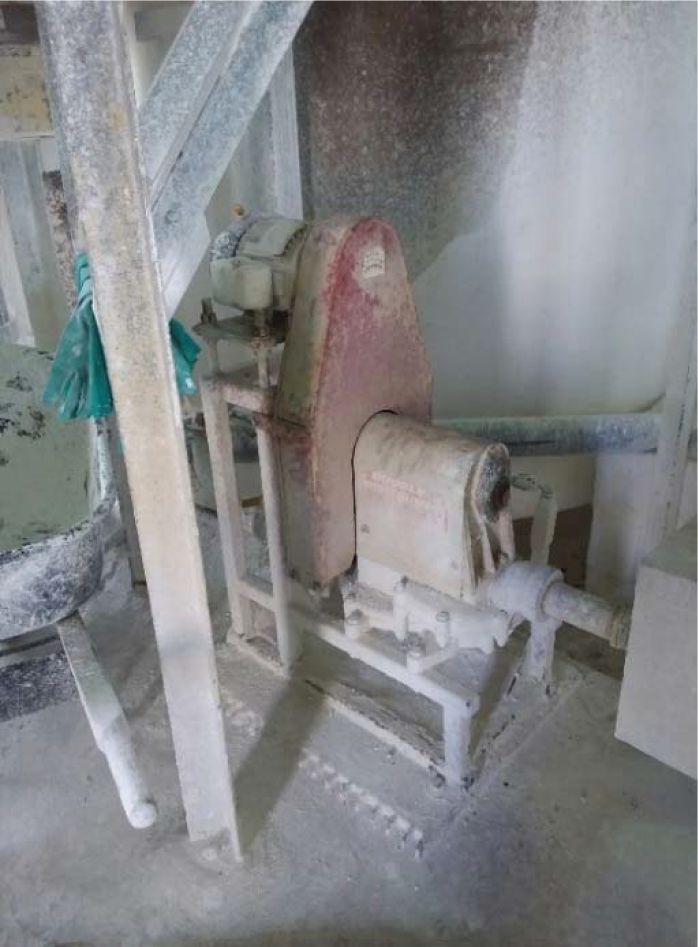
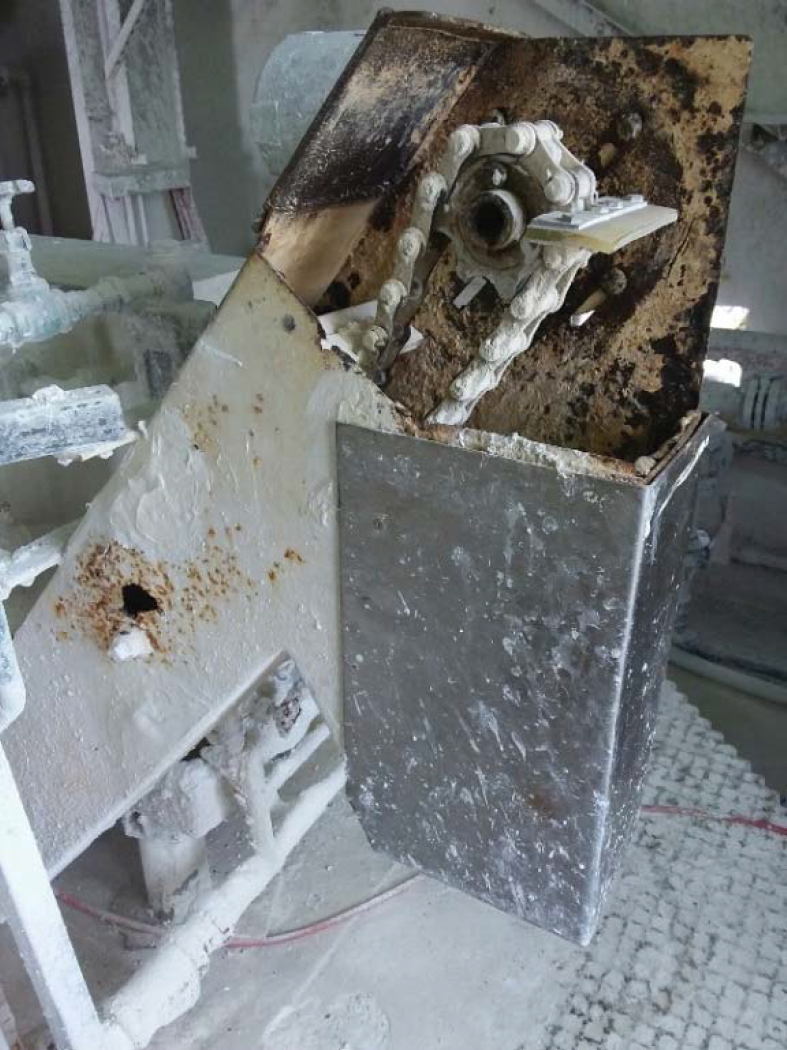
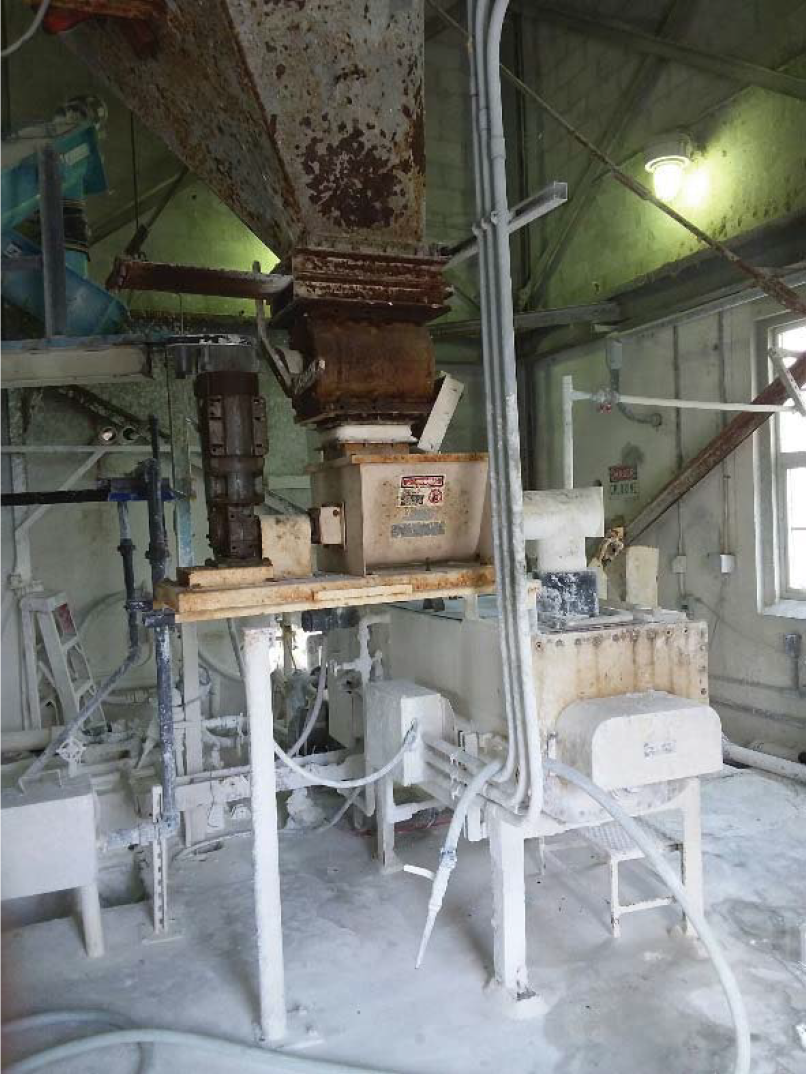
2.4.5.8 Lime
Like caustic, lime is used to increase pH. Because it has lower chemical costs per pound, the lime system is used more frequently for pH adjustment than the caustic system.
Lime is fed at the end of the conventional sedimentation basins before the low lift pump station. The lime system consists of two lime slakers, a slurry discharge pump, and two lime bin hoppers.
2.4.5.8.1 Pumps, Piping and Storage
The lime slurry discharge pump is in fair condition due to moderate corrosion. The lime feed piping is steel and is in good condition. Conversely, the lime slaker water piping is in fair condition, with moderate criticality because of isolation issues.
2.4.5.8.2 Slaking System
The lime slaking system ranged from poor to fair condition, as shown in Figure 2.15. The Tekkum feed system is stainless steel and is in good condition. Slaker No. 1 is approximately 30 years old and in need of replacement. Slaker No. 2 was installed in 2001.
The paddle shaft for Slaker No. 1 is in very poor condition. The grit removal drive and weight belt drive for Slaker No. 1 are also in very poor condition.
No recommendations will be made for this system since the City has a project in place to address these issues. The project will replace Slaker No. 1 and add a new electrical room to replace the existing power/lighting panel.
2.4.5.8.3 Storage
Because the lime silo is above the lime hopper and slaking system, it was not accessible during the assessment and is assumed to be in fair condition given its age. Additionally, the lime slaker splitter box, lime bin hopper, and limehouse grit pit are in fair structural condition. Table 2.31 provides more details on this system.
2.4.6 Filtration Systems
The filtration process follows primary disinfection (ozonation) and comes just before secondary disinfection and the clearwells. The filters were constructed between 1925 and 1974, as noted in the Figure 2.16.
The biologically active carbon (BAC) filtration system contains 30 gravity, concrete filters. Filters No. 1 through 14 are large (512 ft2 per bay), and Filters No. 15 through 30 are small (300 sq ft per bay). The filter media has 12 inches of sand and 22 inches of granular activated carbon (GAC).
Table 2.31 Lime System
David L. Tippin Water Treatment Facility Master Plan City of Tampa
| Discipline | Year Installed/ Rehabilitated | Original Useful Life (years) | Criticality | Condition | Condition Fraction |
|---|---|---|---|---|---|
| Mechanical (slakers, feed system, pumps, grit system) | 1976/2001(1) | 20 | Moderate | Very Poor-Fair | 0.10 - 0.50 |
| Structural | 1976 | 25-50(2) | Moderate | Fair | 0.50 |
| Electrical | 2001 | 30 | Moderate | Poor | 0.20 |
The filtration system components evaluated included:
- Filters No. 1 through 30 Structures.
- Filtration system piping and valves.
- Filter backwash system.
- Air-scour blowers.
- Washwater pumps.
- Filter Gallery.
2.4.6.1 Filters and Filter Gallery
The Leopold universal type "SL" underdrains for Filters No. 1 through 4 and 7 through 14 were replaced approximately 10 years ago and were not accessible during the assessment. The IMS caps are thought to be in poor condition. Thus, further inspection of the underdrains is recommended to determine the actual condition. Filter media is added every 6 to 12 months based on each filter's level measurement.
The filtration system piping is located inside the filter gallery. Its condition ranges from poor to fair given its age. Replaced in 2000, the valve actuators are in fair to poor condition because of age and actuator contact failure, as shown in Figure 2.17.
Filters No. 1 through 14 are in fair mechanical and structural condition with minor criticality because of age and ample redundancy (meaning that if one filter is inoperable then plant capacity is not impacted by more than 40 percent). Filters No. 15 through 30 are also in fair condition, with minor criticality.

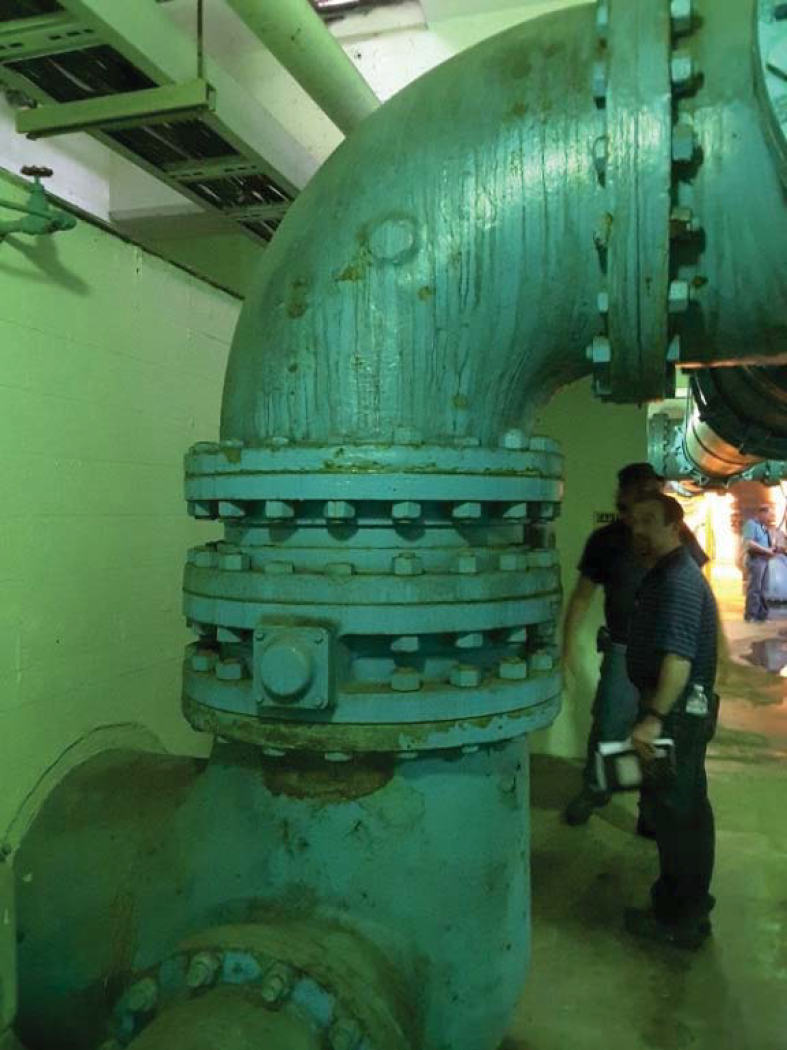
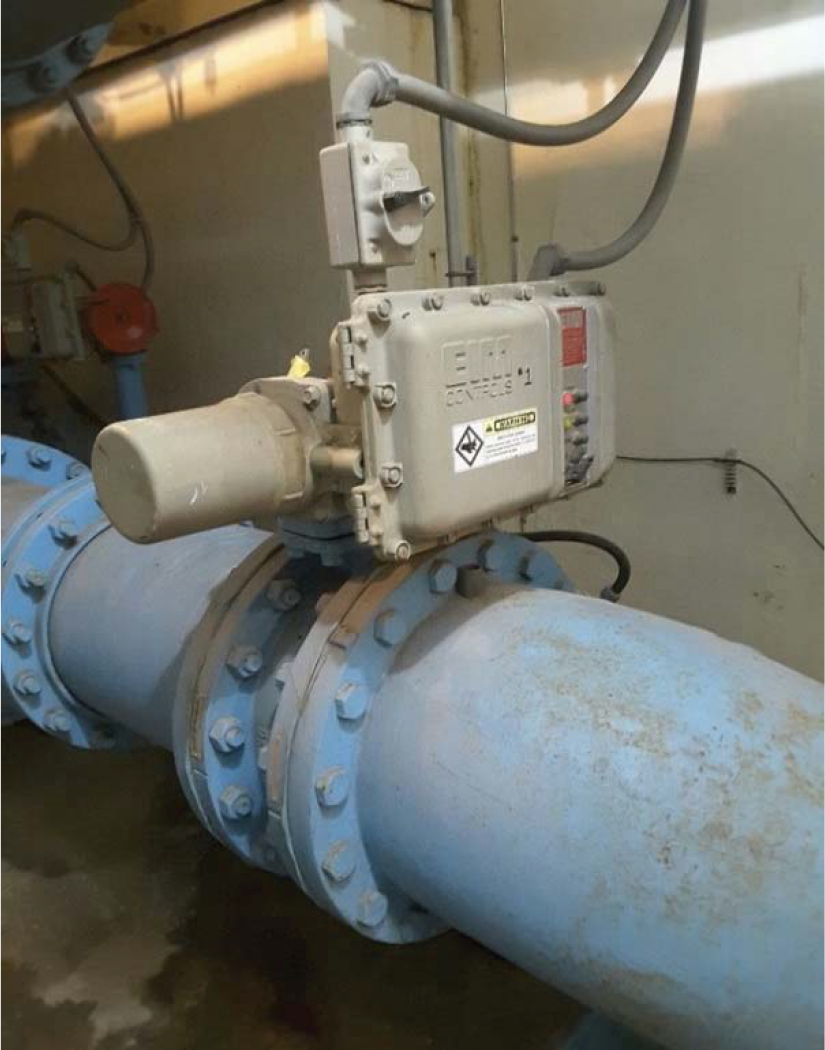
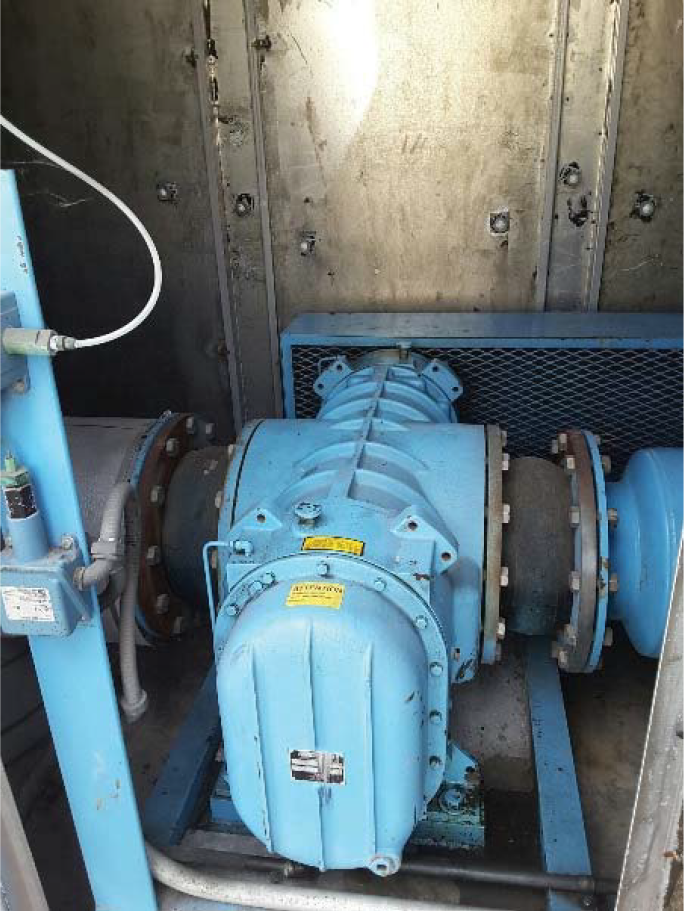
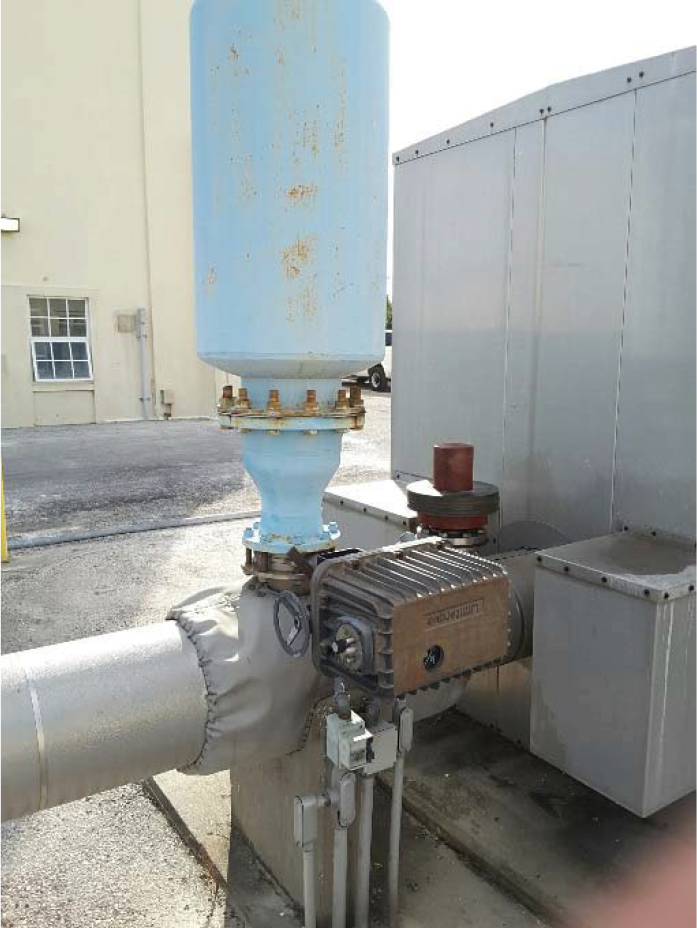
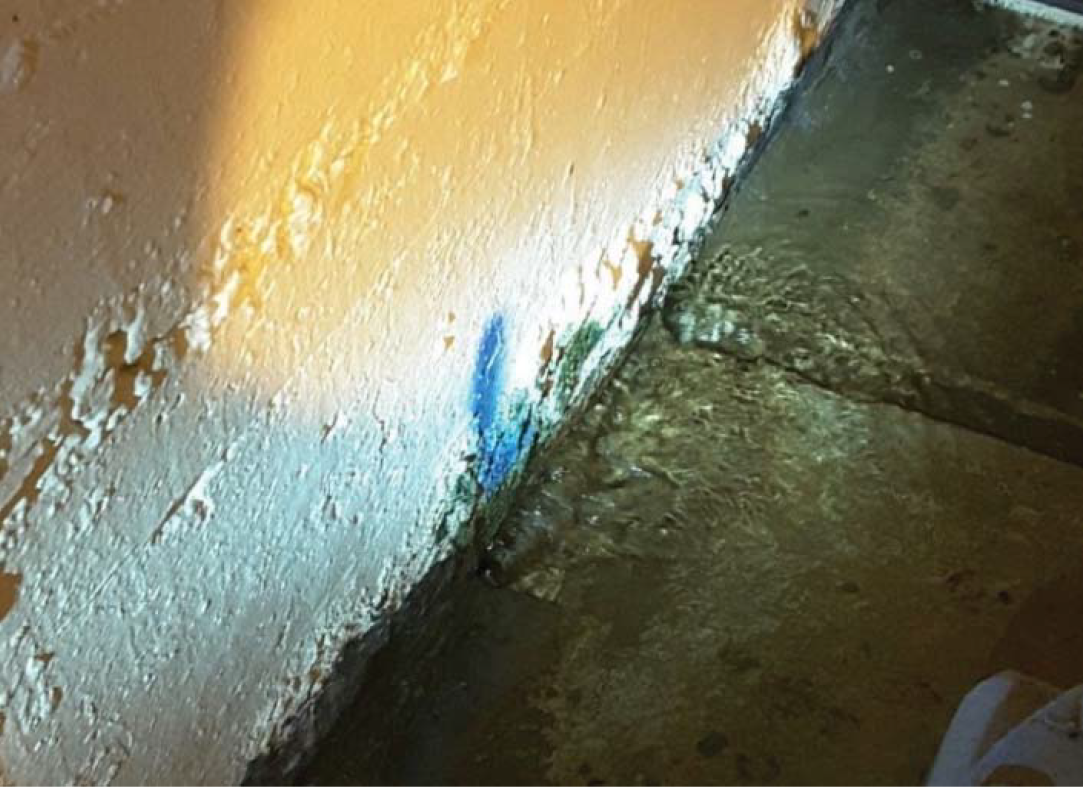
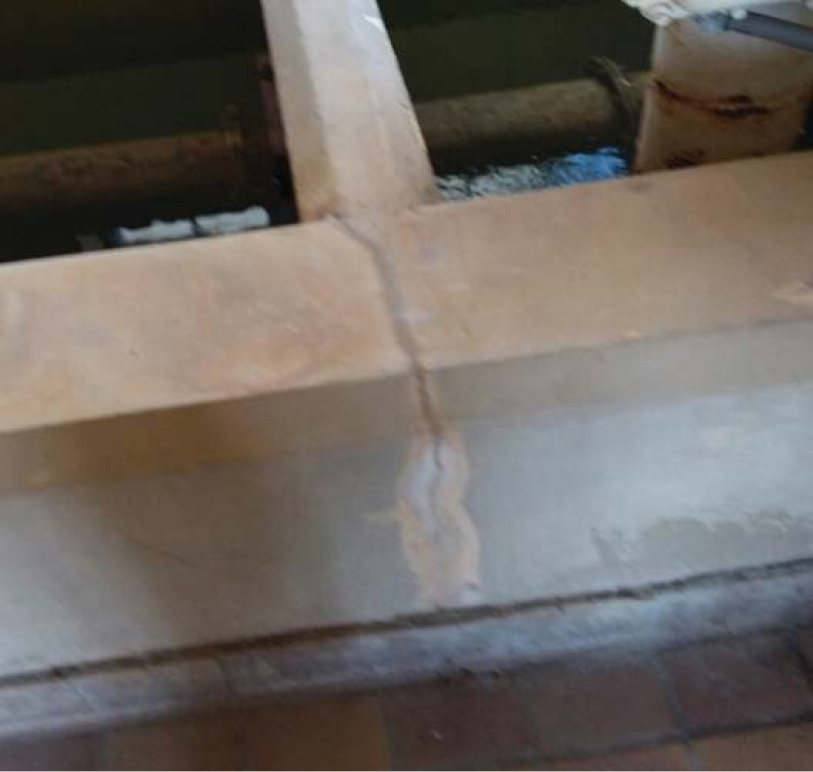
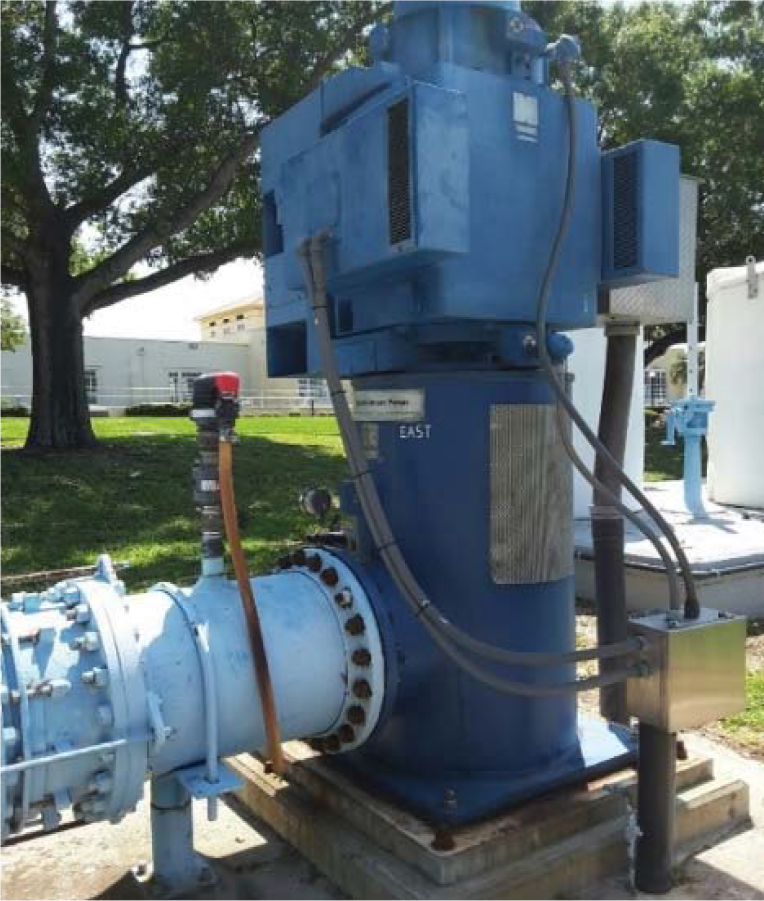
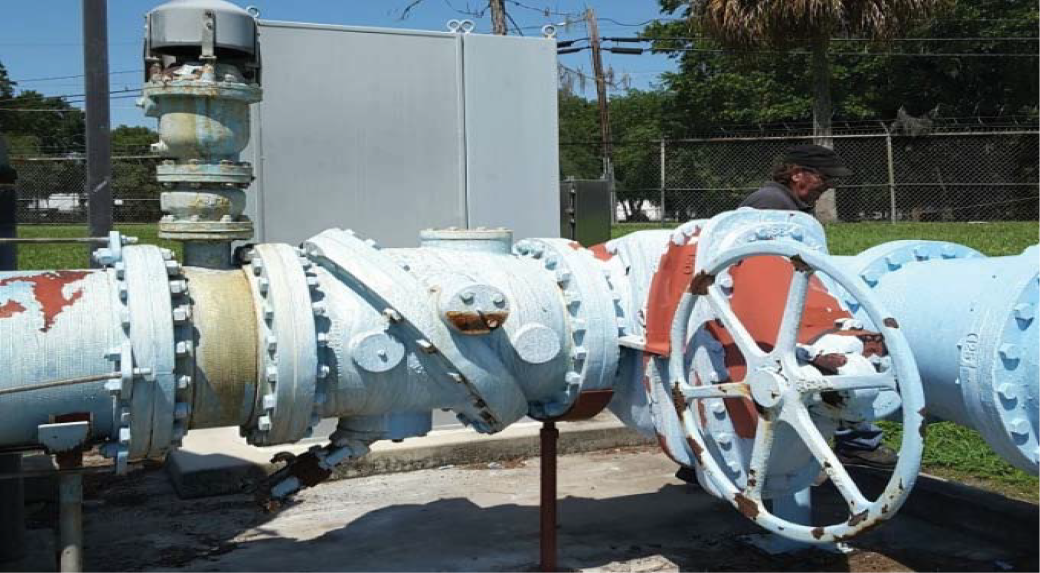
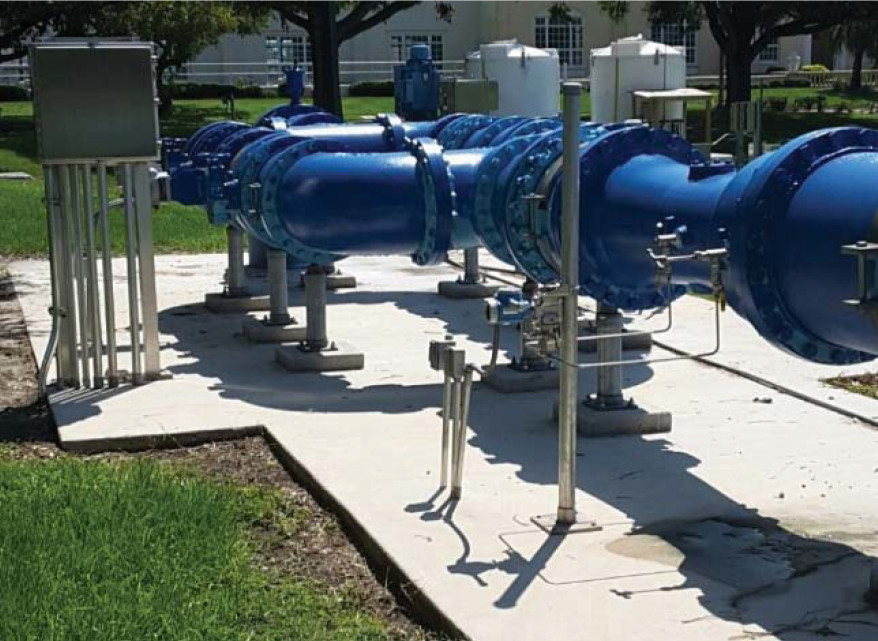

Structural issues include minor concrete cracking of filter walls for Filter No. 14, 16, 21, 23, and 24. Additionally, there is spalling of the concrete slabs below the locker rooms. The spalled concrete was caused by corrosion of the bottom mat of reinforcing steel. There is concrete spalling and deterioration in the filter gallery due to water infiltration from the filtered water flume, as shown in Figure 2.17. Hydraulic recommendations to mitigate this issue are included in Chapter 4.
The filter gallery electrical systems are in fair condition. However, replacement is recommended for the considerably aged power/lighting panel boards with significant corrosion.
Automatic transfer switch (ATS) No. 1, which provides a Utility A-Utility C transfer for the Filter Building, was recently rebuilt and is in good condition. ATS No. 2 and the 35 kW generator (used only if utility services and the three standby generators are down) are in good condition. Because the 35 kW generator is not routinely operated under load, testing under a load bank is recommended.
Table 2.32 summarizes the filters and filter galley conditions.
| Category | Year Installed/ Rehabilitated | Original Useful Life (years) | Criticality | Condition | Condition Fraction |
|---|---|---|---|---|---|
| Mechanical (Piping, Valves, Underdrains) | 1925-1974 | 40 | Minor | Poor | 0.20 |
| Structural | 1925-1974 | 50 | Minor | Fair | 0.50 |
| Electrical | 30 | Minor | Fair | 0.50 |
2.4.6.2 Filter Backwash System
The filter system uses air and water for backwashing. The backwash process removes accumulated solids from the filters, initiated by either head loss measured across the filter, filter run time, or turbidity exceedances.
2.4.6.2.1 Air Scour System
Two positive displacement air scour blowers are available, one duty and one standby. Each is rated for an air volume rate 2,560 standard cubic feet per minute (scfm), and both are in fair condition (as shown in Figure 2.17).
The belts associated with the blowers have been replaced only once since installation. Because the belts have little redundancy and the blowers have to service a fair amount of filter area, this system is of moderate criticality.
The condition of the air supply piping is unknown because of the piping's insulation covering the piping. However, it seemed to be in fair condition, with minor corrosion on the outside. Table 2.33 summarizes the system's condition.
| Category | Discipline | Year Installed/ Rehabilitated | Original Useful Life (years) | Criticality | Condition | Condition Fraction |
|---|---|---|---|---|---|---|
| Filter Air Scour System | David L. Tippin Water Treatment Facility Master Plan City of Tampa | |||||
| Mechanical | 2001 | 20 | Moderate | Fair | 0.50 | |
| Electrical | 2001 | 30 | Moderate | Good | 0.70 | |
| Structural | 2001 | 50 | No Impact | Good | 0.70 | |
2.4.6.2.2 Washwater Pumps, Piping, and Valves
The two filter backwash pumps were replaced in 2015. These pumps are in good condition mechanically and electrically, with severe criticality because they lack redundancy.
The associated check valves are in good condition. Other associated piping and valving are in poor condition, with moderate criticality. They should be replaced when the pumps are replaced.
Two new washwater valves (one primary and one backup) with actuators were recently installed, which included a new piping assembly with flow venturis. The valves and new piping assembly are in very good condition.
Figure 2.17 shows the condition of these assets. Table 2.34 shows additional information on the system's overall condition.
| Category | Discipline | Year Installed/ Rehabilitated | Original Useful Life (years) | Criticality | Condition | Condition Fraction |
|---|---|---|---|---|---|---|
| Filter Washwater Pump System | David L. Tippin Water Treatment Facility Master Plan City of Tampa | |||||
| Mechanical | 2000 / 2015 | 35 | Moderate - Severe | Poor - Very Good | 0.20 - 1.00 | |
| Electrical | 2000 | 15 | Moderate | Good | 0.70 | |
2.4.7 Residuals Handling and Thickening System
The on-site residuals handling and thickening system consists of a surge tank and four gravity thickeners with associated splitter boxes. Once thickened, sludge is pumped to an off-site sludge processing facility, which was not evaluated in this assessment.
One sludge equalization basin is located at the off-site facility. Because it lacks redundancy and is not reliable, including an additional basin is recommended. The system consists of a surge tank, four gravity thickeners, two splitter boxes, and two sludge pumping stations, as shown in Figure 2.18.
2.4.7.1 Backwash Surge Tank System
During backwash events, the 415,000-gallon surge tank receives filter backwash water from the filters, stores it, and then pumps it to the gravity thickeners. The surge tank system includes recirculation water jets to prevent solids accumulation and three submersible centrifugal pumps to transfer washwater to the gravity thickeners.
Built in 2001, the 80-foot diameter concrete tank is in fair condition, with moderate criticality. The junction box that feeds the surge tank is in good condition.
Surge tank pumps No. 1 and No. 2 were rebuilt in 2014 and 2015, respectively, and are in good condition. Surge tank pump No. 3 has not been rebuilt and is in fair condition. The surge tank valves and actuators are in fair condition. The surge tank system's piping is in good condition, except for noted coating delamination. Figure 2.19 shows the condition of these components.
Plant staff noted that the surge tank receives more flow than can be pumped at times. Chapters 3 and 4 include recommendations to mitigate this issue. Table 2.35 provides more information on the system's condition and criticalities.
| Discipline | Year Installed/ Rehabilitated | Original Useful Life (years) | Criticality | Condition | Condition Fraction |
|---|---|---|---|---|---|
| Mechanical (Pumps, Piping, Valves) | 2001(1) | 20-40 | Moderate | Fair-Good | 0.50 - 0.70 |
| Electrical | 2001 | 30 | Moderate | Good | 0.70 |
| Structural | 2001 | 50 | Moderate | Fair | 0.50 |
| Notes: (1) Surge Tank Pumps 1 and 2 were rebuilt in 2014 and 2015, respectively. Pump 3 has not been rebuilt. | |||||


RESIDUAL HANDLING AND THICKENING SYSTEMS CONDITION PHOTOS 1
FIGURE 2.19 CITY OF TAMPA DAVID L. TIPPIN WTF MASTER PLAN
- Photo Top Left: Surge tank and water jets in fair condition.
- Top Right: Piping and valves for surge pumps.
- Bottom Right: Junction box servicing surge tank.
- Photo Left: Gravity Thickener #4 in fair structural condition.
- Right: Splitter Box 1 and 2 in fair structural condition.
- Photo Left: Mechanism #4 out of service.
- Right: Mechanism #1 in good condition mechanically.
- Photo: Empty Gravity Thickener #4 showing deteriorated rake arm.
2.4.7.2 Thickener System
The four gravity thickeners (GT) receive sludge from the conventional, Actiflo™, and surge tank systems. Specifically, GT No. 1 and No. 2 receive sludge from the conventional system, GT No. 3 from the Actiflo™ system, and GT No. 4 from the surge tank system, which can route Actiflo™ sludge to GT No. 4.
Splitter Box 1 and 2 share a common concrete structure and feed GT No. 1 and 2, whereas GT No. 3 and GT No. 4 receive flow directly from the Actiflo™ system and surge tank pumps, respectively. Structurally, the splitter box and four GTs are in fair condition. Splitter Boxes 1 and 2 have had overflow issues. Chapter 4 includes recommendations for these issues.
Installed in 2001, the gravity sludge thickener gates are in good condition overall. However, Thickener No. 4 has no gate, with operation maintained by pulling sludge from the pipe feeding Thickener No. 1.
The thickener clarifier mechanisms are inspected annually. Because of their importance to the off-site biosolids system, they are of moderate criticality. The only exception to that rating is Mechanism No. 3, which is of severe criticality because it serves the Actiflo™ system exclusively.
In the last two years, the gear boxes for Mechanisms No. 1 and No. 2 were rebuilt and are in good condition. Mechanism No. 3 is also in good condition. Mechanism No. 4 has been out of service since August 2015 when the lower end gearbox failed. It is currently being repaired or replaced by the City. This means that only one thickener is available for Actiflo™ sludge. If Thickener No. 3 is out of service, the Actiflo™ system must also be shut down.
The rake arm steel structures were inspected in April 2016 and are in poor condition, with signficant corrosion. Sandblasting and recoating each gravity thickener's rake arms is recommended, as is replacing select steel members where needed. Figure 2.19 shows the condition of these assets.
MCC 15-1 Right and MCC 15-1 Left feed the residuals handling and thickening systems and are located near the E House. Both are in good condition.
Table 2.36 contains more information on the overall rating of the thickeners and associated appurtenances.
2.4.7.3 Sludge Pumping Systems
Two sludge pumping stations are on-site. One services the collected sludge from the conventional sedimentation basins and transfers it to GTs No. 1 and No. 2. The other transfers thickened sludge to the off-site processing facility.
| Discipline | Year Installed/ Rehabilitated | Original Useful Life (years) | Criticality | Condition | Condition Fraction |
|---|---|---|---|---|---|
| Mechanical (Mechanisms) | 2001(1) | 25 | Moderate | Very Poor-Good | 0.10 - 0.70 |
| Mechanical (Gates) | 2001 | 20 | Moderate | Good | 0.70 |
| Mechanical (Valves) | 2001 | 35 | Moderate | Fair | 0.50 |
| Electrical | 2001 | 30 | Moderate | Good | 0.70 |
| Structural | 1987/2001(2) | 50 | Moderate | Poor to Fair(3) | 0.20 - 0.50 |
2.4.7.3.1 Conventional Train Sludge Transfer Pumps
Four sludge transfer pumps at the end of the sedimentation basins transfer settled sludge from the conventional basins to the gravity thickeners. As shown in Figure 2.20, the pumps are approximately five years old or newer.
The impellers are rebuilt frequently, and preventive maintenance is conducted on the pumps based on flow and runtimes. The basin sludge transfer pit wet well is in fair condition. Table 2.37 contains additional information on the overall system's condition.
| Discipline | Year Installed/ Rehabilitated | Original Useful Life (years) | Criticality | Condition | Condition Fraction |
|---|---|---|---|---|---|
| Mechanical | 2011 | 20 | Moderate | Good | 0.70 |
| Electrical | 2001 | 30 | Moderate | Good | 0.70 |
| Structural | 2001 | 50 | Severe | Fair | 0.50 |
2.4.7.3.2 Thickener Sludge Pumps
The three constant speed, hidrostal screw centrifugal, thickener sludge pumps are located west of GT No. 1 and No. 2. These pumps transfer thickened sludge to the sludge processing facility located off-site.
Pumps No. 1 and No. 2 are approximately 15 years old and are in fair condition. Conversely, Pump No. 3, which was installed in 2010, is in good condition. All three pump bases show coating delamination, as shown in Figure 2.20. Table 2.38 details their condition and criticalities.
| Discipline | Year Installed/ Rehabilitated | Original Useful Life (years) | Criticality | Condition | Condition Fraction |
|---|---|---|---|---|---|
| Mechanical | 2001/2010(1) | 20 | Moderate | Fair-Good | 0.50 - 0.70 |
| Electrical | 2001 | 30 | Moderate | Good | 0.70 |
| Structural | 2001 | 50 | Moderate | Fair | 0.50 |
| Notes: (1) Pumps 1 and 2 installed in 2001, Pump 3 installed in 2010. | |||||
2.4.8 Finished Water Systems
The finished water systems incorporate assets downstream of the filtration process, including:
- Filtered water flume.
- Clearwell systems.
- Hawkey box
- Blending chamber
- Five clearwells.
- Finished flow meters and vaults.
2.4.8.1 Filtered Water Flume
The filtered water flume (built between the 1920s and 1970s) is located under the filter gallery. The flume's interior could not be accessed. However, because it shares a wall with the filter gallery floor, some of the structure could be observed, as shown in Figure 2.21.
Overall, the structure is in poor condition. Because it has three separate flumes, the structure is of severe criticality. As stated previously, the filter gallery floor, which is also the flume ceiling, has cracks. These cracks are particularly concerning, since downstream head conditions pressurize the flume, causing leakage into the gallery and minor flooding.
RESIDUAL HANDLING AND THICKENING SYSTEMS CONDITION PHOTOS 2
FIGURE 2.20


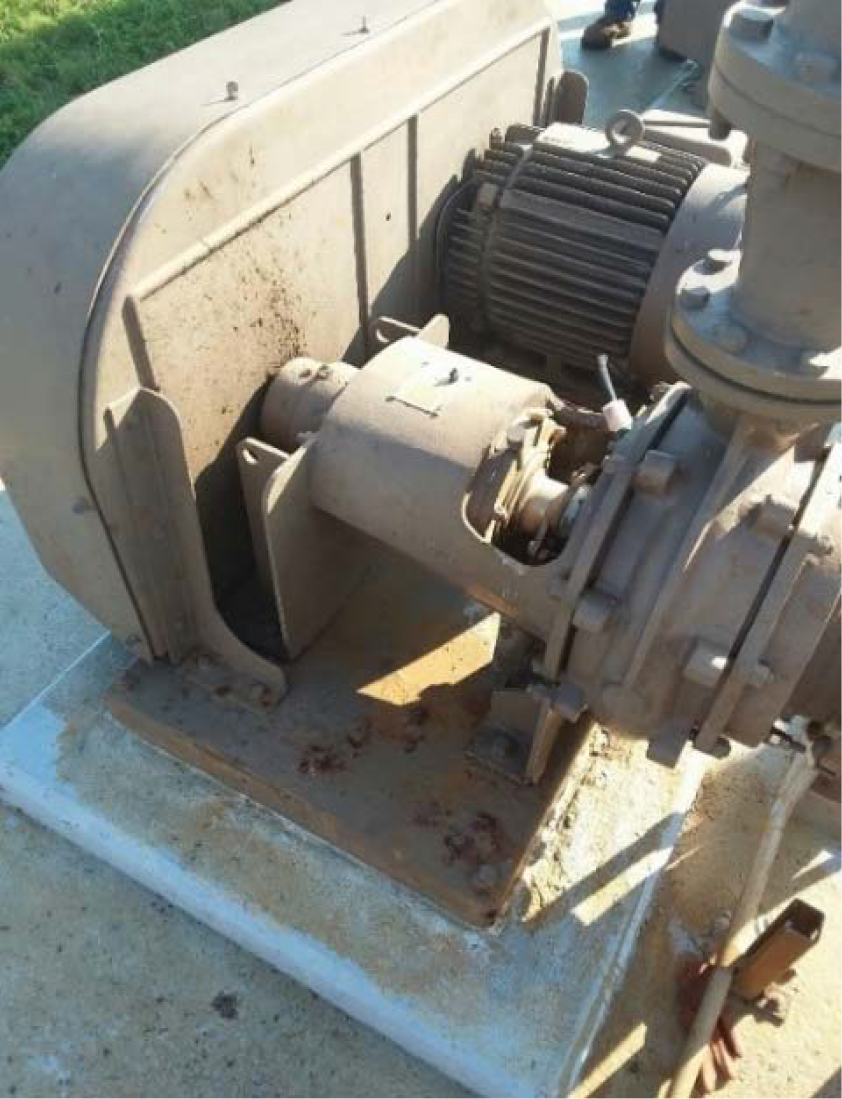
FINISHED WATER SYSTEMS CONDITION PHOTOS
FIGURE 2.21
Overall Site Plan of Clearwell Systems

Photo
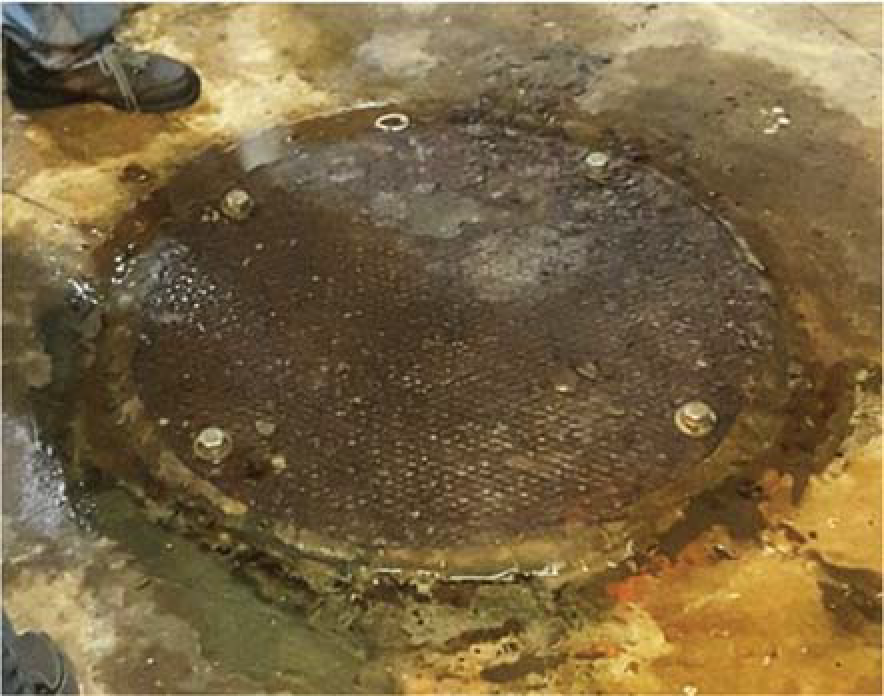
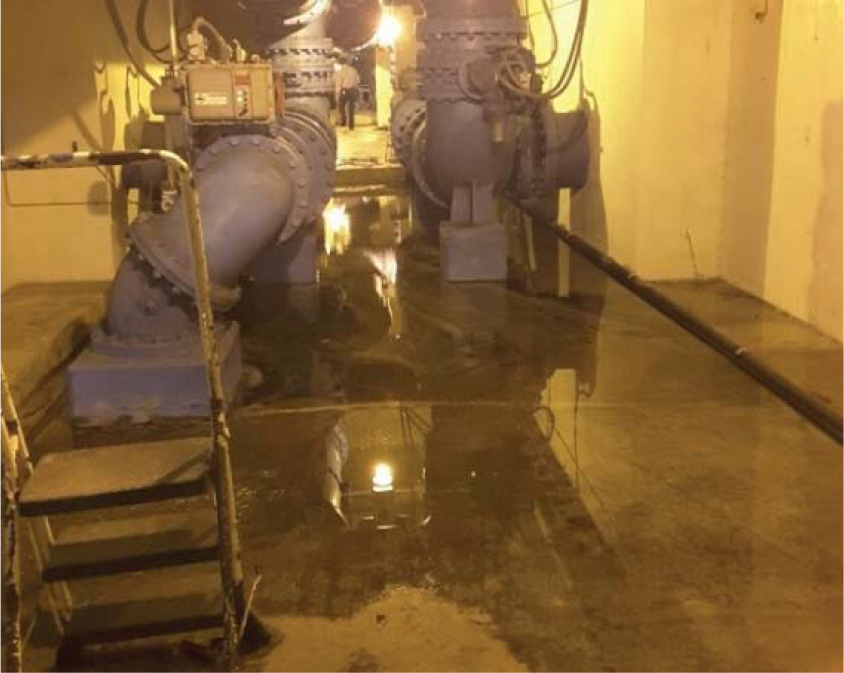
Left: Manhole access to finished water flume, significantly corroded.
Right: Filter galley flooding from finished water flume.
Photo
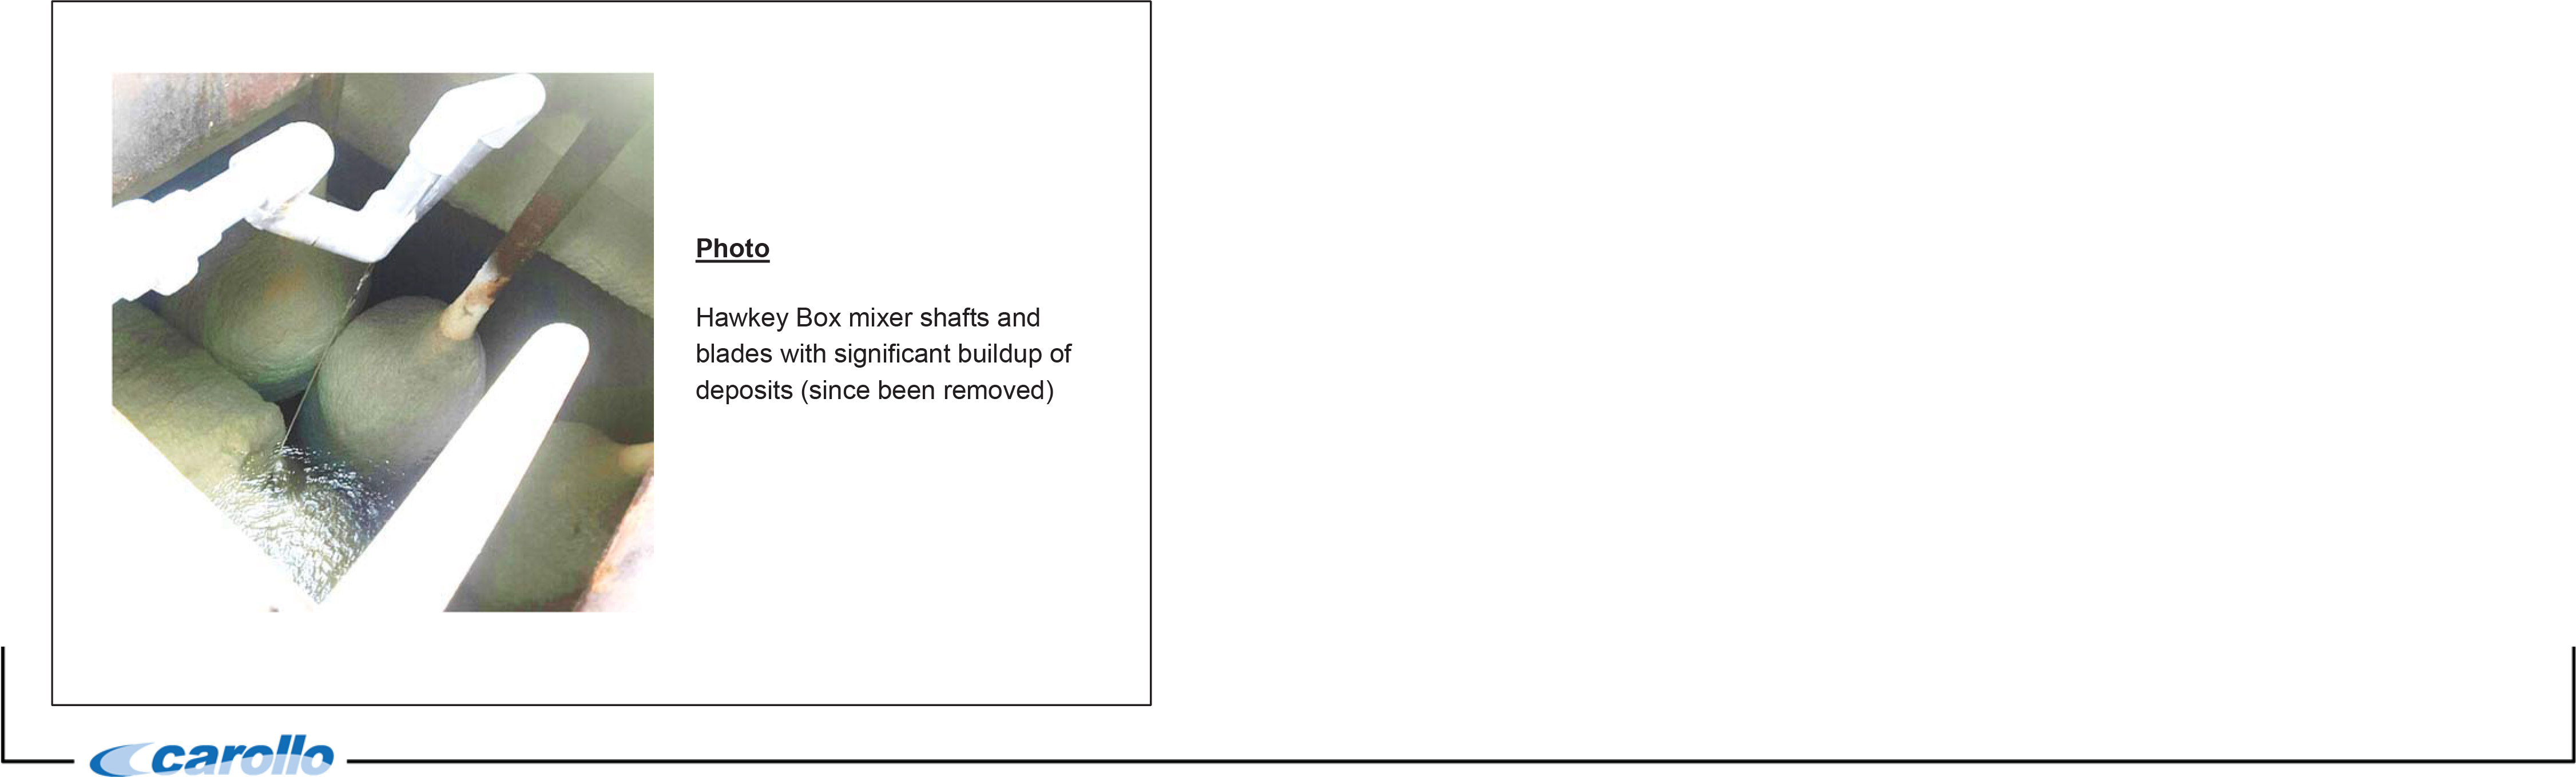
Photo Hawkey Box mixer shafts and blades with significant buildup of deposits (since been removed)
CITY OF TAMPA DAVID L. TIPPIN WTF MASTER PLAN
This pressurization must be remedied, but the cracks and voids on the pipe gallery floor must also be properly sealed to keep washdown water from becoming a cross contamination in the pipe gallery by entering the filtered water flume. Chapter 4 discusses hydraulic recommendations to mitigate this issue.
Table 2.39 details the structures' condition and criticality. This system does not have any mechanical or electrical components.
| Discipline | Year Installed/ Rehabilitated | Original Useful Life (years) | Criticality | Condition | Condition Fraction |
|---|---|---|---|---|---|
| Structural | 1925-1974(1) | 50 | Severe | Poor | 0.20 |
Notes:
(1) The filtered water flume was constructed on the same dates as the filter was installed.
2.4.8.2 Clearwell Systems
The clearwell systems evaluated included:
- Hawkey Box.
- Blending Chamber.
- Clearwells.
- Finished flow meters.
Figure 2.21 shows the location of each component on an overall site plan.
2.4.8.2.1 Hawkey Box
The Hawkey box, also known as the filtered water junction box, is located after the finished water flume and before the blending chamber. Because it receives 100 percent of the plant flow and has no redundancy, it is of fatal criticality.
The structure is in poor condition because of the plant hydraulic issues associated with the structure, which are further defined in Chapter 4. The chambers have mixers that are not in use because of significant deposit build-up, as shown in Figure 2.21. Since removing these mixers, plant staff has noted subsequent hydraulic improvements. Table 2.40 shows the structure's overall condition.
| Discipline | Year Installed/ Rehabilitated | Original Useful Life (years) | Criticality | Condition | Condition Fraction |
|---|---|---|---|---|---|
| Structural | 2001 | 50 | No Impact | Poor | 0.20 |
| Mechanical (Mixers) | 2001 | 20 | Fatal | Very Poor | 0.10 |
2.4.8.2.2 Blending Chamber
Located just after the Hawkey Box, the blending chamber uses baffle walls to mix chlorine and ammonia into the finished water before it flows through the clearwells. The blending chamber structure is underground and was not accessible during the assessment. Because it lacks redundancy, the blending chamber is of fatal criticality.
The chamber is assumed to be in poor condition because of its age, suspected calcium carbonate deposit build-up, and associated hydraulic issues. Chapter 4 provides more detailed information and recommendations on the chamber. Table 2.41 shows the structure's overall condition, which has no electrical or mechanical components.
| Discipline | Year Installed/ Rehabilitated | Original Useful Life (years) | Criticality | Condition | Condition Fraction |
|---|---|---|---|---|---|
| Structural | 1973 | 50 | Fatal | Poor | 0.20 |
2.4.8.2.3 Clearwells
Five clearwells range in size from 0.5 to 7.5 million gallons. The chlorinated water flows through each clearwell. Typical flow is 7.5 MG Clearwell → 5.0 MG Clearwell → 5.0 MG Clearwell → 0.5 MG Clearwell → 2.0 MG Clearwell. Then, the flows travel to the high-service pumps for distribution.
The interior of these clearwells was not accessible. Instead, photos from previous inspections conducted in 2007 and 2012 were used to evaluate the structures. Figure 2.22 contains the results and recommendations from these inspections. Chapter 4 includes hydraulic recommendations for the 7.5 MG clearwell.
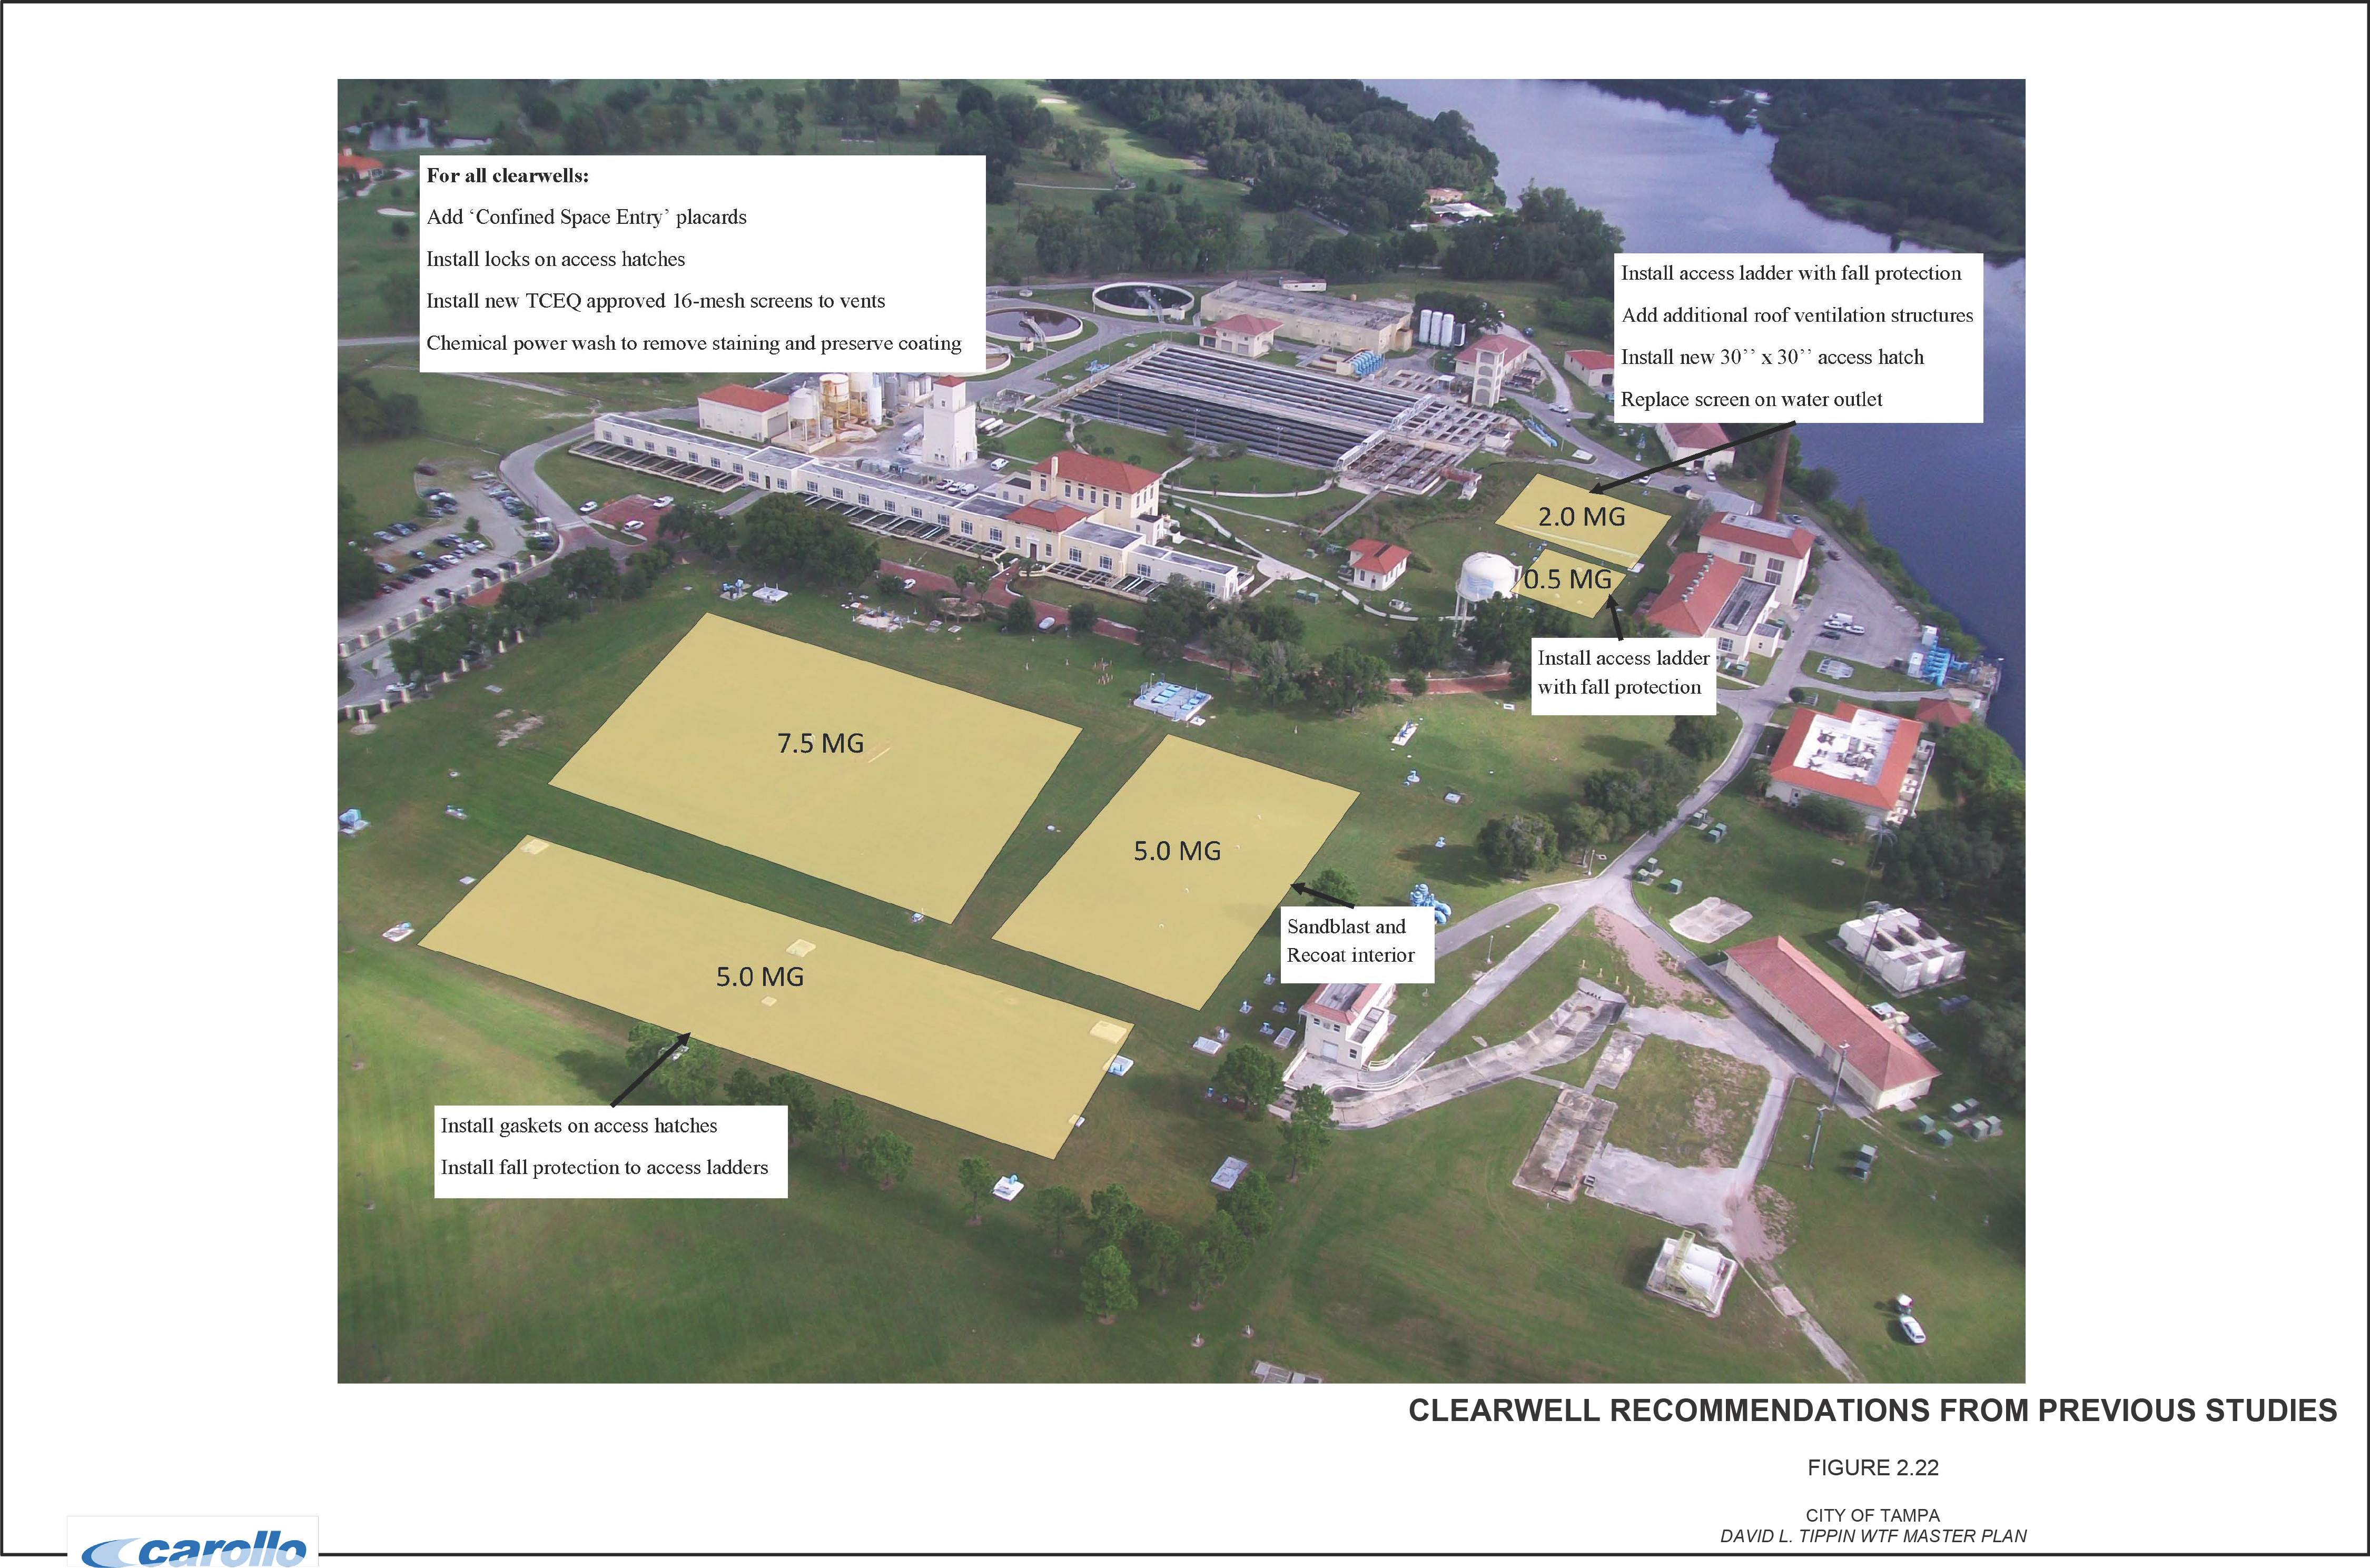
2.4.8.2.4 Finished Flow Venturis Flow Meters and Vaults
Five finished water Venturi flow meters are located just before the distribution system. These meters are in fair to good condition. Although the vaults could not be accessed, the structures overall are assumed to be in good condition. Table 2.42 summarizes the meters' condition.
| Discipline | Year Installed/ Rehabilitated | Original Useful Life (years) | Criticality | Condition | Condition Fraction |
|---|---|---|---|---|---|
| Mechanical | 1990s | 35 | No Impact | Good | 0.70 |
| Structural | 1990s | 50 | No Impact | Good | 0.70 |
2.4.9 Pumping Systems
The following three major pump systems were evaluated for this assessment:
- Raw Water Pumps No. 1 through 9.
- Raw Water Pump Station (Pumps No. 1 through 5)
- Lower Level Raw Water Pump Station (Pumps No. 6 through 9)
- Low Lift Pumps No. 1 through 6.
- High-Service Pumps No. 1 through 8.
- High Service Pump Station (Pumps No. 1 through 4)
- Remote High Service Pump Station (Pumps No. 5 through 6)
- Field High Service Pump Station (Pumps No. 7 through 8)
Each pump's age, time since last rebuild, vibration, efficiency, condition, and criticality were assessed. Vacuum priming pumps and samples pumps were not evaluated. Table 2.43 in Section 2.4.9.4 lists the scores for each pump.
Pumps in poor condition can often be refurbished. The De Laval pumps in particular have a long history of overhauls that have kept equipment over 40 years old in service.
However, even when existing equipment can be restored to satisfactory service, it may be more cost effective to replace it rather than re-build. Determining whether to replace or refurbish depends on a variety of factors, including equipment type, manufacturer, performance characteristics (system/pump curve fit, NPSHR, efficiency, etc.), availability of spare parts, and reliability.
As mentioned above, much of the pumping equipment is very mature, and recent repairs appear to cost as much as 70 percent of the capital cost of replacement equipment. This is according to a comparison of recent pump centerline rebuild data and budget pricing from Goulds pumps with similar performance characteristics.
Although maintenance can affect operational performance, operational pump controls have changed since these stations have been in service, such as the emergence of variable frequency drives (VFDs). According to a review of historical data, VFDs have been installed and/or removed at different pump stations at DLTWTF over the years.
Deciding to incorporate VFDs depends on pump station duty/load cycle, system characteristics (flow versus pressure, static versus dynamic head, constant versus variable flow requirements), and potential cost savings. In many applications, VFD controls save energy and reduce operation costs significantly. However, equipment such as constant speed pumps would be more efficient in certain applications, meaning VFDs might not always be the best choice.
Performing an overall operational improvements analysis for each pump station, including determining applicability of VFDs, is not part of this condition assessment. However, operational improvements should be included at the same time as the recommended repair/replacement work.
2.4.9.1 Raw Water Pumps
Two raw water pump stations are available, one at the intake structure (housing Pumps No. 1 through 5), and one in the High Service and Lower Pump Room Building (housing Pumps No. 6 through 9). Raw Water Pumps No. 1 through 5 are vertical turbine type, and No. 6 through 9 are split case double suction type.
2.4.9.1.1 Raw Water Pump Station
The raw water pump station is located just after the rotating bar screens and contains Raw Water Pumps No. 1 through 5. Each pump is rated for approximately 18,500 gpm (26.6 mgd) at 41.5 feet of total dynamic head (TDH) for a firm capacity of 106 mgd.
According to visible inspection of the outside, all pumps are in similar fair condition mechanically. This pump station's overall functionality is good. The grating and concrete in the area are in fair condition, with minor corrosion and spalling.
Installed in the 1960s, the electrical components (switchgears and starters) of Raw Water Pumps No. 1, 4, and 5 are in poor condition. Furthermore, the building experiences water infiltration, which poses a safety issue that must be corrected when the pumps are replaced.
Raw Water Pumps No. 2 and 3 have new Allen Bradley VFDs and are in excellent electrical condition. The raw water VFD building transformer is in good condition. Because the raw
water pumping system has redundancy, the transformer has minor criticality. The motor control building structure is also in fair condition, with minor corrosion noted. Figure 2.23 shows photos of these assets.
2.4.9.1.2 Lower Level Raw Water Pump Station
The lower level pump station is located in the high-service pump station building on the lower floor and consists of Raw Water Pumps No. 6 through 9. According to a visible inspection, the pumps are in fair condition. Specific information on the pumping capacity and head conditions was not available at the time of the assessment. Based on the plant process flow diagram, the firm capacity of the Lower Level Raw Water Pump Station is assumed to be similar to the Raw Water Pump Station (approximately 100 mgd).
Historical information indicates that the pumps have been successfully rebuilt over the years. The original equipment manufacturer (OEM) no longer exists. According to the City's operations staff, parts must be custom-built for these pumps, increasing the cost to rebuild.
The pump station grating, concrete, and masonry are in fair condition. The lower level pump station transformer powers pumps No. 6 through 9. This pump station electrical transformer is in good condition, with a criticality rating of moderate. Pumps No. 6 and No. 7 are in poor electrical condition with respect to their starters. Pumps No. 8 and No. 9 have new soft starts and are in good electrical condition.
Figure 2.23 shows the layout of these pumps.
2.4.9.2 Low Lift Pumps
The Low Lift Pump Station is located after the sedimentation step for the Actiflo™ and Conventional treatment systems, where Low Lift Pumps No. 1 through 6 lift settled water to the ozone process. The pumps are sized for 19,444 gpm (28 mgd) at 22 feet of total dynamic head for a firm capacity of 140 mgd. According to plant staff, the vertical turbine low lift pumps are pulled every 5 to 8 years for rebuilding and are therefore in good condition.
The butterfly valve shafts located in the lift station basin before pumping are in very poor condition. Thus, replacing them with a new actuation device or new type of valve is recommended.
Based on the O&M Manual, the low lift pump station is set up to automatically control pump speed based on the low lift station basin level. VFDs on Pump 1 and Pump 4 are available for flow pacing to achieve a constant wet well level; one of these pumps must be operational for automatic control to function properly.
However, the VFDs are in very poor condition and are currently inoperable, which affects the pump station's intended operation. Additionally, operational considerations for hydraulics are included in Chapter 4.
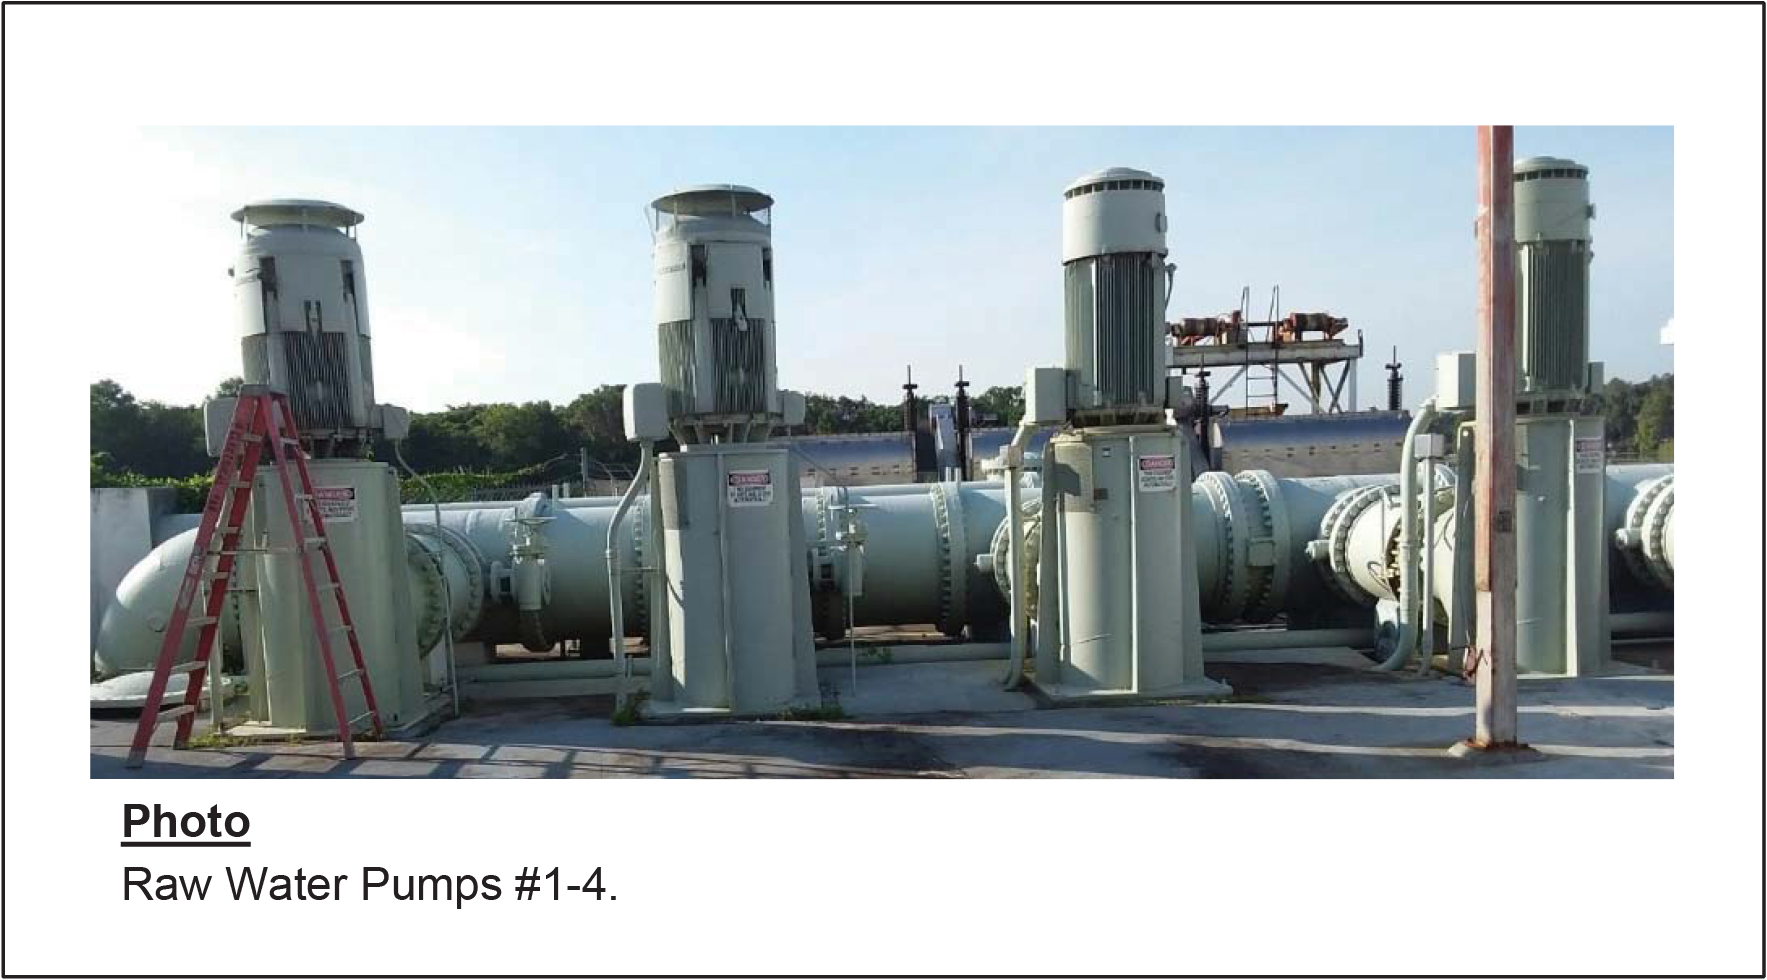
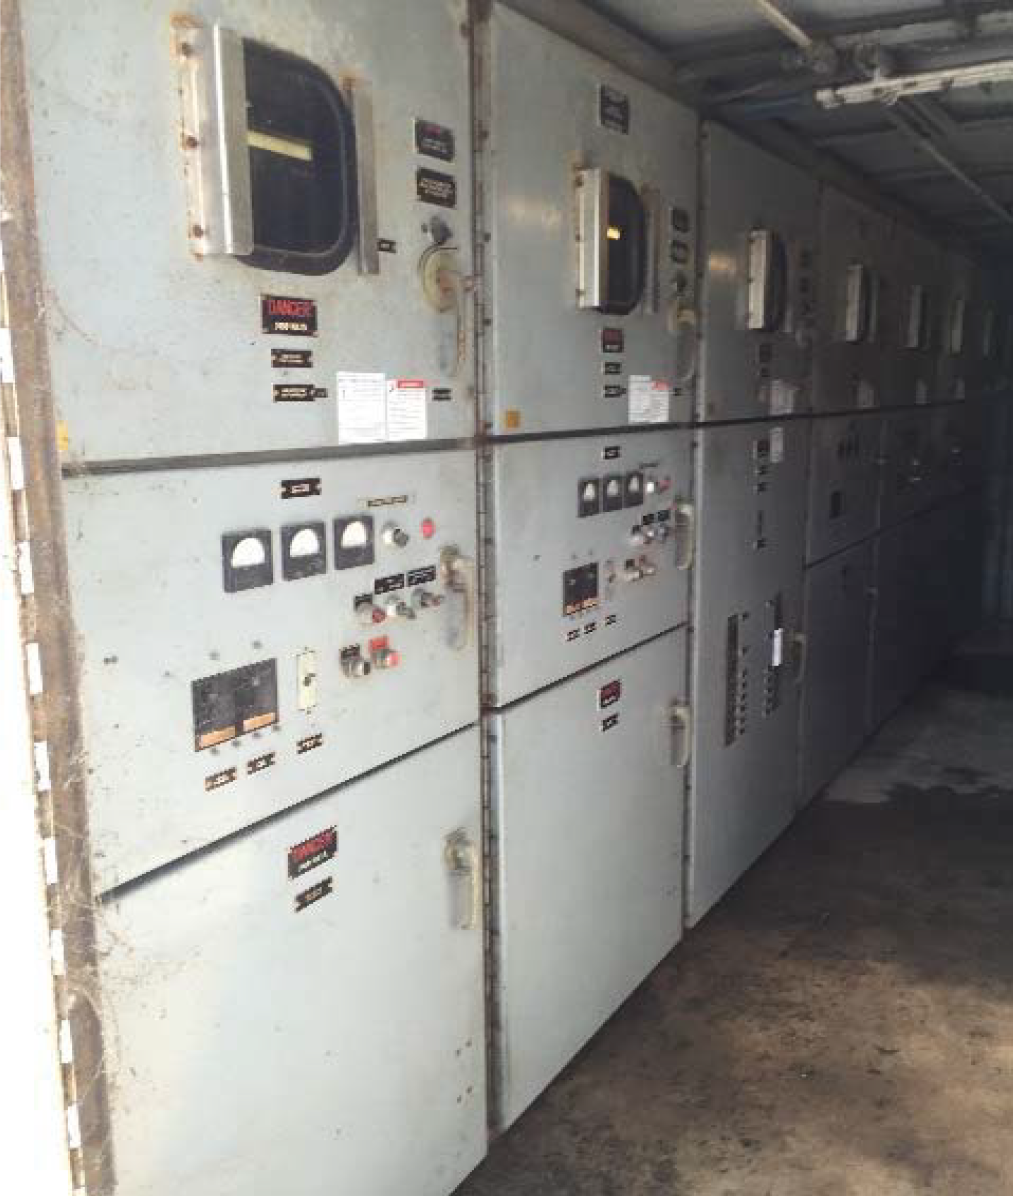
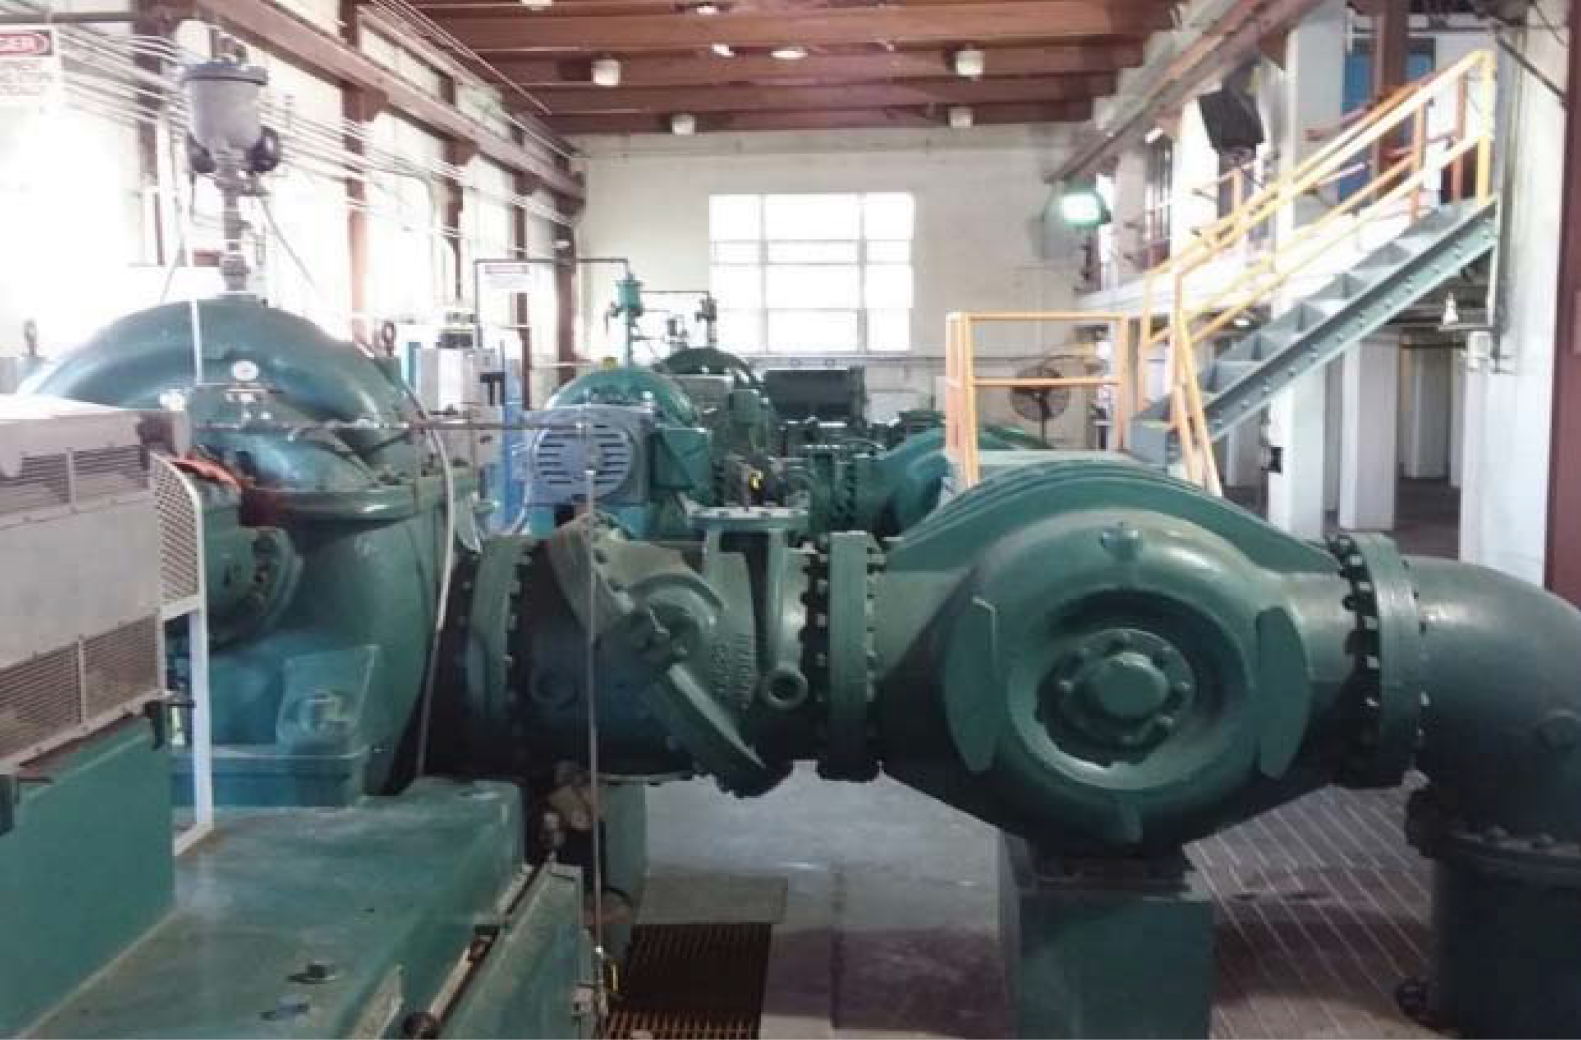

The pump station basin is in fair condition structurally, with minor concrete cracking noted in the center wall. Because the solid state starters were replaced recently, the electrical components for Pumps No. 2, 3, 5, and 6 are in good condition. Controls improvements, such as adding VFDs to constant speed pumps, could improve reliability, operational redundancy, and operating characteristics, including energy and cost savings. To restore normal operation, the inoperable VFDs should be replaced immediately. Figure 2.24 shows photos of select components.
2.4.9.3 High Service Pumps
The high service pumps deliver water to the distribution system. There are eight pumps configured in three distinct pump stations. The High Service Pump Station, Remote High Service Pump Station, and Field High Service Pump Station have an overall firm capacity of approximately 159 mgd.
2.4.9.3.1 High Service Pump Station
High Service Pumps No. 1 through 4 are located in the same building as Raw Water Pumps No. 6 through 9 on the upper level. The pumps are split case double suction pump type. Each of the four pumps at this station is rated for 10,000 gpm (14.4 mgd) at 170 feet TDH, for a firm capacity of 43.2 mgd. The High Service Pump Station is of moderate criticality because of its importance to the overall plant operation and low level of redundancy.
Like the Lower Level Raw Water Pumps No. 6 through 9, the OEM no longer exists. As a result, it experiences similar issues with spare part availability and rebuild costs. The City recently provided overhaul costs for Pump No. 1 of approximately $170,000, approximately 70 percent the cost of a new pump (based on budget pricing for a Goulds pump with similar performance).
High Service Pumps No. 1, 2, and 4 are in fair condition mechanically, with minor noise noted and structural issues associated with Pump No. 1 base. The auto-transformer starter for Pumps No. 2 and No. 3 is over 30 years old and is obsolete. Thus, it should be replaced. Pump No. 2 was noted to be running hot. Pump No. 3 is in poor condition mechanically and in very poor electrical condition. The High Service Piping, located in the lower level pump station room, is in fair condition and needs sand blasting and repainting.
The High Service Pump transformers (TRC06-2 and TRA08-2) are in good condition, except for transformer TRC07-1 and TRC08-1, which are in poor condition. Replacing the 240V with a 208V transformer is recommended. Figure 2.25 shows photos of this station.
2.4.9.3.2 Remote High Service Pump Station
Shown in Figure 2.25, the remote High Service Pump Station contains High Service Pumps No. 5 and No. 6, which are also split case double suction pumps. These pumps are from the same OEM as High Service Pumps No. 1 through 4. Based on the available pump curves, they are rated for 18,000 gpm (25.9 mgd) at 170 feet TDH.

HIGH SERVICE PUMPS CONDITION PHOTOS
Although the pumps were originally installed in the 1960s, they are in fair condition. However, they have not been rebuilt for over 10 years. The vibration report noted rough vibration for Pump No. 6. The overhead crane system is in overall good condition.
The pumps' associated ball valves and piping coatings are in poor condition and require sand blasting and repainting. Transformer TRC01-2, associated with Pump No. 6, is in good condition. However, leakage through the valve was noted, and the transformer needs a new actuation device or valve. The transformer for Pump No. 5 (TRA01-1) is in good condition.
2.4.9.3.3 Field High Service Pump Station
High Service Pumps No. 7 and No. 8 are located just outside of the remote High Service Pump Station, as shown in Figure 2.25. Installed in the 1990s, the vertical turbine pumps and their associated piping and valves are in good condition mechanically. Each pump is rated for 16,077 gpm (23 mgd) at 193 feet TDH. However, very rough vibration was noted for Pump No. 7, which is problematic since the pump was last rebuilt in 2013.
The VFDs on both pumps were replaced in 2012 and are in good condition. The transformers for Pump No. 7 and No. 8 (TRC01-2, TRA01-1) are in good condition.
2.4.9.4 Pump Station Summary
Table 2.43 presents information for each pump station, including a score for each pump. In Table 2.43, a score of 5 denotes very poor condition, and a score of 1 denotes very good condition. The timing for replacing these pumps is noted in subsequent sections.
As shown, most of the pumps are past their original useful life of 15 to 20 years. However, due to rebuilds and the quality of original equipment, many are still in fair condition mechanically. As previously stated, when determining if a pump needs to be replaced or rebuilt, the following should be considered:
- Existing pump performance and efficiency, and pump performance and efficiency after rebuild.
- Pump application, type, and the need for control improvements such as VFDs.
- System performance requirements (NPSHR, flow versus pressure curves, static versus dynamic head, etc.).
- Availability of spare parts and cost for rebuilds.
- Condition of pump internals.
- Time between rebuilds and time between failures.
Table 2.43 Pump Station Summary
David L. Tippin Water Treatment Facility Master Plan
City of Tampa
| Category | Type | OEM | Drive | Install Year | Pump Age | Score (Weight 20%) |
Rebuild Date | Time Since Last Rebuild | Score (Weight 15%) |
Vibration Report Results | Score (Weight 25%) |
Efficiency | Score (Weight 10%) |
Condition | Score (Weight 20%) |
Criticality | Score (Weight 10%) |
Overall Score | Overall Pump Station Score |
|---|---|---|---|---|---|---|---|---|---|---|---|---|---|---|---|---|---|---|---|
| Raw Water Pump Station | |||||||||||||||||||
| Pump #1 | Vertical Turbine | Verti-Line | CS | 1970 | 46 | 5 | 2006 | 10 | 4 | Fair | 2 | 88% | 1 | Fair | 3 | Minor | 2 | 3.0 | 2.8 |
| Pump #2 | Vertical Turbine | Verti-Line | VS | 1970 | 46 | 5 | 2011 | 5 | 2 | Good | 1 | 88% | 1 | Fair | 3 | Minor | 2 | 2.5 | |
| Pump #3 | Vertical Turbine | Verti-Line | VS | 1970 | 46 | 5 | 2010 | 6 | 3 | Rough | 4 | 88% | 1 | Fair | 3 | Minor | 2 | 3.4 | |
| Pump #4 | Vertical Turbine | Verti-Line | CS | 1970 | 46 | 5 | 2011 | 5 | 2 | Fair | 2 | 88% | 1 | Fair | 3 | Minor | 2 | 2.7 | |
| Pump #5 | Vertical Turbine | Verti-Line | CS | 1970 | 46 | 5 | 2015 | 1 | 1 | Fair | 2 | 88% | 1 | Fair | 3 | Minor | 2 | 2.6 | |
| High Service Pump Station | |||||||||||||||||||
| Pump #1 | Split Case Double Suction | De Laval | CS | 1970 | 46 | 5 | 2014 | 2 | 1 | Good | 1 | 78% | 4 | Fair | 3 | Moderate | 4 | 2.8 | 3.1 |
| Pump #2 | Split Case Double Suction | De Laval | CS | 1970 | 46 | 5 | 2007 | 9 | 3 | Good | 1 | 78% | 4 | Fair | 3 | Moderate | 4 | 3.1 | |
| Pump #3 | Split Case Double Suction | De Laval | CS | 1970 | 46 | 5 | 2008 | 8 | 3 | Good | 1 | 78% | 4 | Poor | 4 | Moderate | 4 | 3.3 | |
| Pump #4 | Split Case Double Suction | De Laval | CS | 1970 | 46 | 5 | 2015 | 1 | 1 | Slight | 3 | 78% | 4 | Fair | 3 | Moderate | 4 | 3.3 | |
| Remote High Service Pump Station | |||||||||||||||||||
| Pump #5 | Split Case Double Suction | De Laval | CS | 1960 | 56 | 5 | 2000 | 16 | 5 | Good | 1 | 78% | 4 | Poor | 4 | Moderate | 4 | 3.6 | 3.8 |
| Pump #6 | Split Case Double Suction | De Laval | CS | 1960 | 56 | 5 | 2005 | 11 | 4 | Rough | 4 | 78% | 4 | Fair | 3 | Moderate | 4 | 4.0 | |
| Field High Service Pump Station | |||||||||||||||||||
| Pump #7 | Vertical Turbine | Ingersoll-Dresser | VS | 1990 | 26 | 4 | 2013 | 3 | 2 | Severe | 5 | 88% | 1 | Fair | 3 | Moderate | 4 | 3.5 | 2.9 |
| Pump #8 | Vertical Turbine | Ingersoll-Dresser | VS | 1990 | 26 | 4 | 2012 | 4 | 2 | Good | 1 | 88% | 1 | Good | 2 | Moderate | 4 | 2.3 | |
| Low Lift Pump Station | |||||||||||||||||||
| Pump #1 | Vertical Turbine | Floway | VS | 2000 | 16 | 3 | 2014 | 2 | 1 | Severe | 5 | 86% | 2 | Fair | 3 | Minor | 2 | 3.0 | 2.2 |
| Pump #2 | Vertical Turbine | Floway | CS | 2000 | 16 | 3 | 2011 | 5 | 2 | Slight | 3 | 86% | 2 | Good | 2 | Minor | 2 | 2.5 | |
| Pump #3 | Vertical Turbine | Floway | CS | 2000 | 16 | 3 | 2014 | 2 | 1 | Good | 1 | 86% | 2 | Good | 2 | Minor | 2 | 1.8 | |
| Pump #4 | Vertical Turbine | Floway | VS | 2000 | 16 | 3 | 2015 | 1 | 1 | Good | 1 | 86% | 2 | Good | 2 | Minor | 2 | 1.8 | |
| Pump #5 | Vertical Turbine | Floway | CS | 2000 | 16 | 3 | 2012 | 4 | 2 | Good | 1 | 86% | 2 | Good | 2 | Minor | 2 | 2.0 | |
| Pump #6 | Vertical Turbine | Floway | CS | 2000 | 16 | 3 | 2011 | 5 | 2 | Good | 1 | 86% | 2 | Good | 2 | Minor | 2 | 2.0 | |
According to available information, many of the pumps currently in service should be replaced instead of repaired. The Raw Water Pump Stations are likely candidates for replacement rather than rebuilding, whereas Low Lift Pumps Stations are likely good candidates for rebuilding. Before repair or replacement, the project should make a final determination of the most economical path forward and the operational improvements required, such as adding VFDs.
In March of 2010, CDM completed a study and preliminary engineering report about high service pump improvements at the DLTWTF. Their recommendations were as follows:
- Decommission existing High Service Pumps No. 1 through 6.
- Retain High Service Pumps No. 7 and 8.
- Install a new pump station with five new vertical turbine pumps for a total firm capacity of 150 mgd.
- Add a new pump station building to house new pumps.
- Provide future area for an additional 4.5 million gallon (MG) storage tank.
By implementing these changes, the DLTWTF could increase the effective storage available by allowing a larger portion of the existing clearwell volume to be used while also meeting future flow demands. Currently, only 8 MG of the 20 MG clearwell storage is estimated to be available. Although some useable storage can be recovered with the proposed new pump station, other restraints do not allow for using the full storage volume:
- Uplift forces on the existing clearwells requiring a minimum 5-ft water depth (approximately 7 MG) for ballast.
- Requirement of 5-ft water depth to use filter backwash pumps.
As a result, implementing the new pump station with the ancillary recommendations from the previous study is recommended. However, the pump station should be implemented as a part of a new 5.0-MG clearwell. The timing to replace these pumps is included in subsequent sections.
2.4.10 Building Systems
The condition of the DLTWTF superstructure, electrical systems, lighting, HVAC, and lavatories (where applicable) were evaluated. Figure 2.26 shows an overall site plan for the buildings. All building superstructures were given a criticality score of moderate or higher because of the potential impacts to public health and safety if the superstructures fail. Superstructures with higher than moderate criticality are buildings that would affect plant capacity during a failure. Appendix A contains additional information on the overall condition, criticalities, and calculated risks.
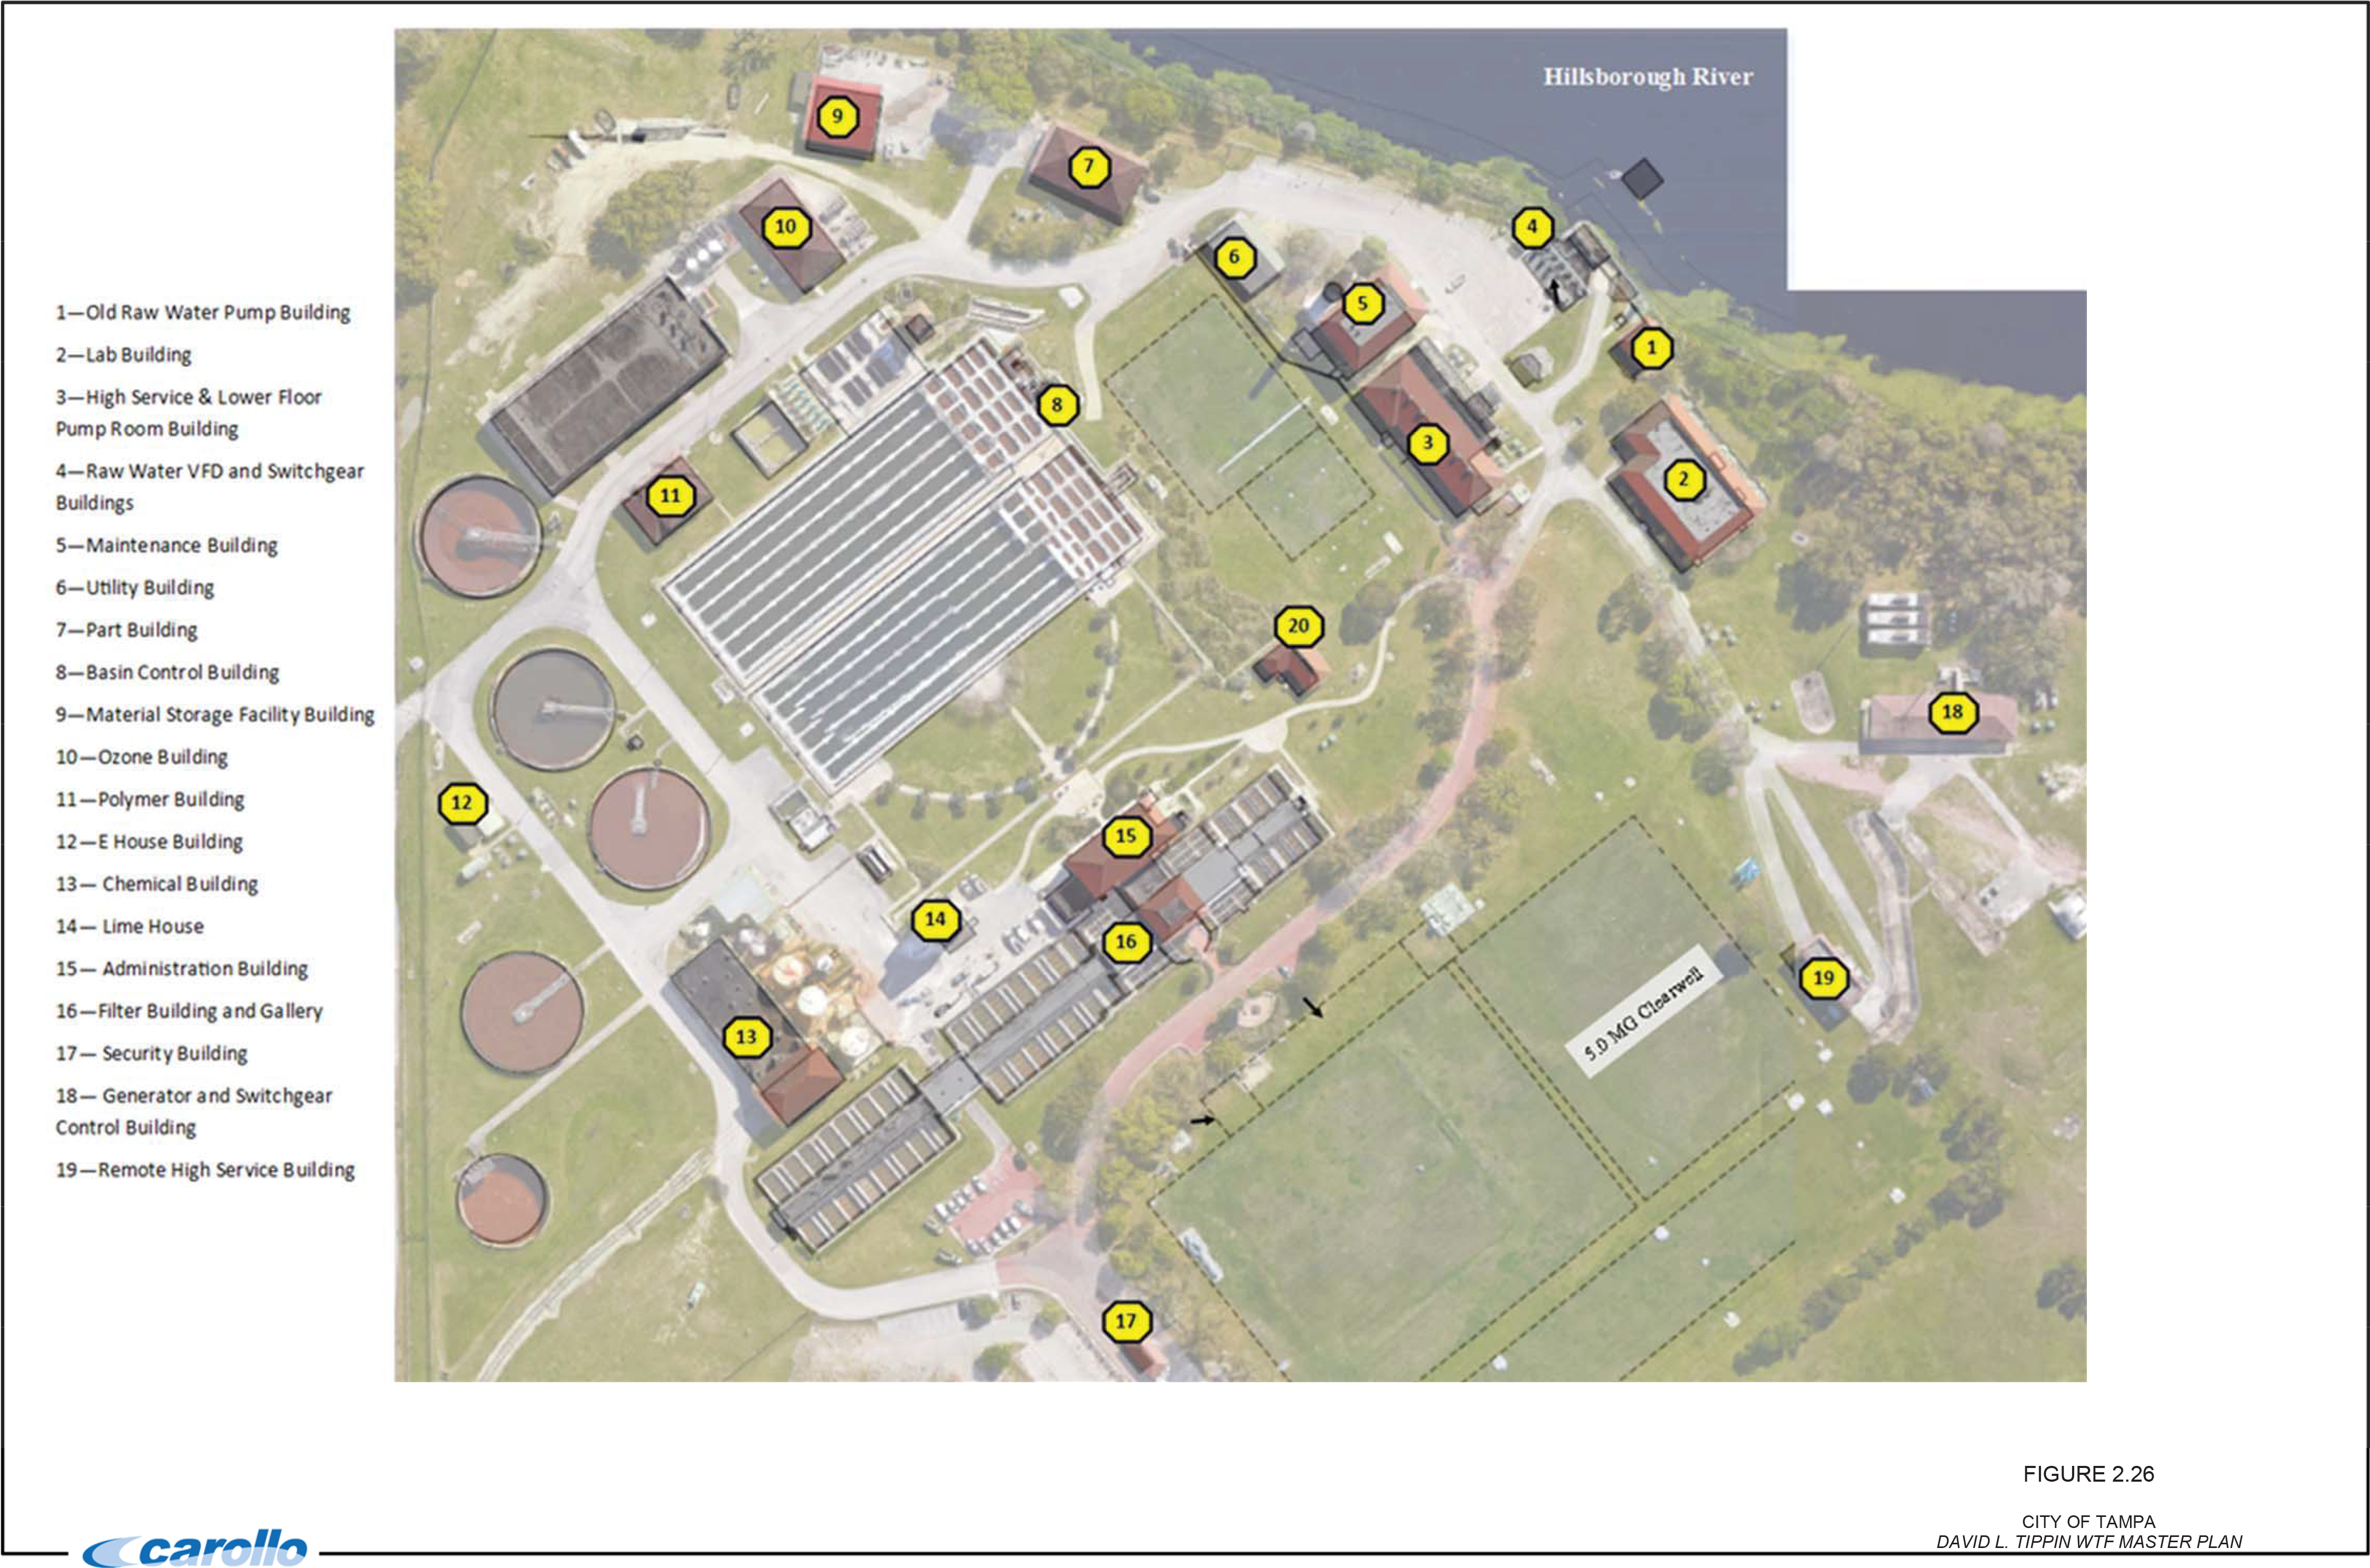
2.4.10.1 Old Raw Water Pump Building
The river pump house, also known as lower pump house or old raw water pump building structure, is no longer being used for plant flow operations.
The Old Raw Water Building's superstructure, shown in Figure 2.27, has a concrete dry well foundation with a masonry wall and a wood frame supported by steel beams. The interior floors are concrete, and the shell walls are masonry. The existing roof system is clay barrel tile, and the decking is wood.
The roof had areas of leaks and failure, with a damaged and rotted roof deck. In some locations, daylight could be seen through the roof. Thus, replacing the roof and decking systems within two years is recommended to stabilize the building and stop further deterioration. The electrical components are in very poor condition with significant corrosion noted.
Although there is a chance the building could be rehabilitated, the City noted the desire to have a new boat storage facility with loading ramp and floating dock that would likely be in this area. Therefore, the costs associated with this effort in the CIP assume demolition of this building for conservatism.
2.4.10.2 Lab Building
The Lab Building's superstructure has masonry walls and bearing walls, a steel frame, and wood trusses. The interior floors are slab-on-grade. Installed in 2008, the roof is flat in the center and has sloped barrel tile on the perimeter. It has a 30-year warranty. The structure has a barrel-joist steel frame with masonry walls. Overall, the structure is in good condition.
The building's interior was completely renovated in 2015. However, the main electrical panel was not upgraded and was in poor condition. The exterior light fixtures attached to the building are also in poor condition. The light switches/controls and interior light fixtures are in good condition. The power distribution equipment including panels, shown in Figure 2.27, are in good condition, although the main panel (PP1) had considerable wear and it should be considered for replacement in the next 5 to 10 years.
2.4.10.3 High Service and Lower Floor Pump Room Building
The High Service and Raw Water Pumps share a common superstructure, shown in Figure 2.27. This structure has a cast-in-place concrete frame with a slab steel support pump and a wood ceiling. The upper portion of the building serves the High Service Pumps No. 1 through 4, while the lower floor houses the Raw Water Pumps No. 6 through 9 as well as suction and discharge piping for the High Service pumps. Inside the building, the floors are also cast-in-place concrete. The few interior partitions are wallboard on stud framing.
BUILDINGS CONDITION PHOTOS 1
FIGURE 2.27

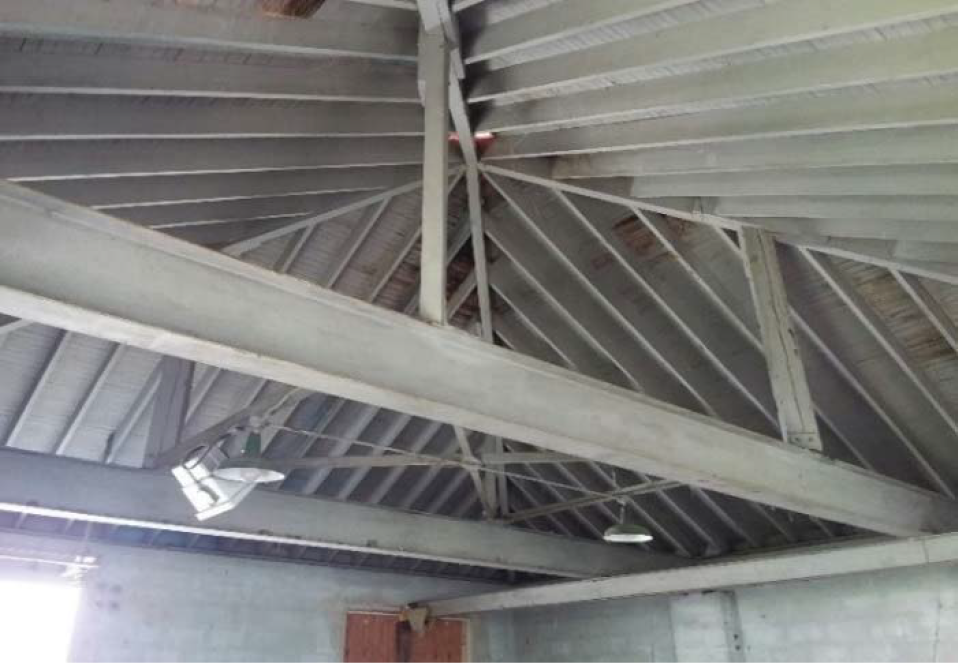
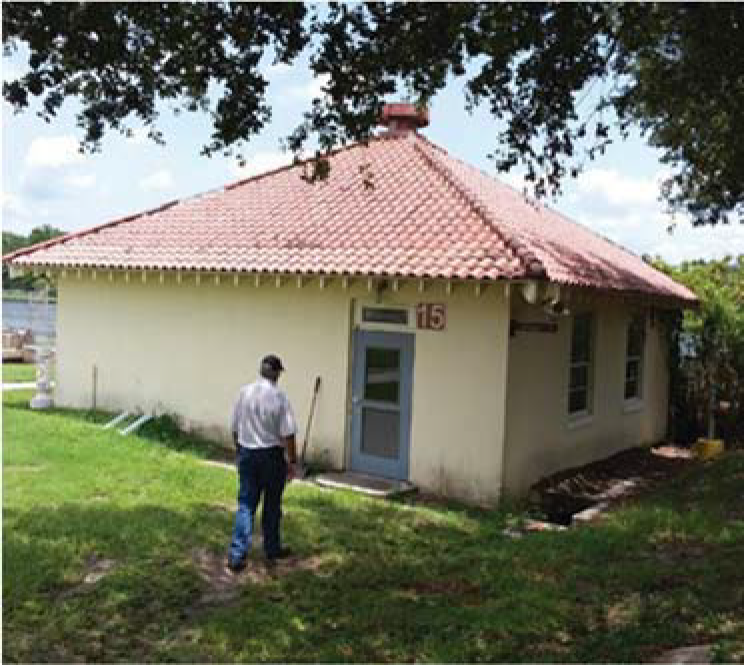
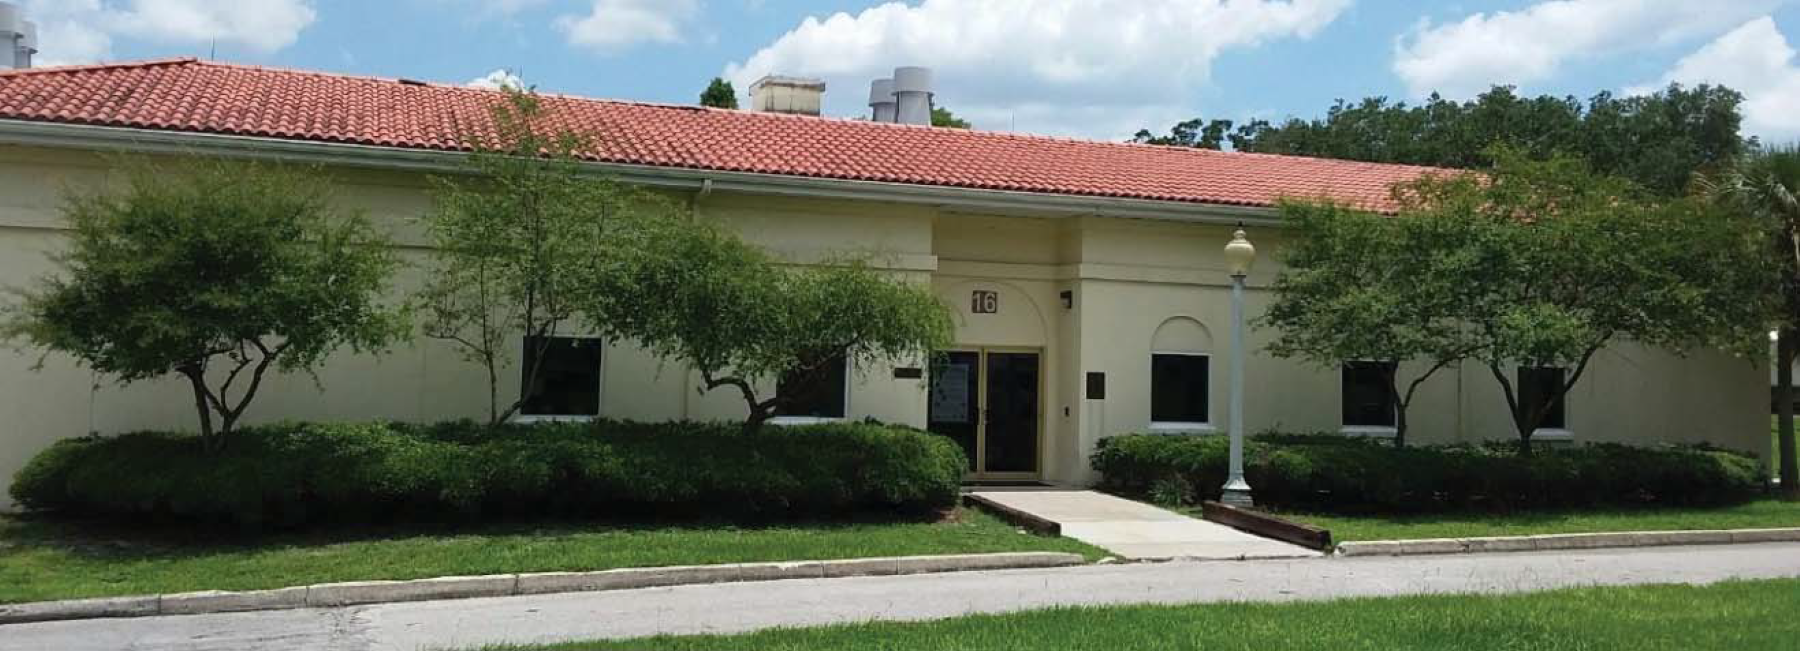
The upper roof system is clay barrel tile on decking supported by steel trusses. The lower roof system is a built-up system supported by structural steel beams. Both roof systems have a beadboard cladding on the underside.
The lower built-up roof system was installed in 2014 and has a 30-year warranty. The building was originally built in 1924, with a major addition completed in the 1950s. The age of the upper clay barrel tile is unknown, but it's fair to assume that at least part of the roof system dates back to the 1950s. According to the Tile Roof Institute, tile roofs can expect to have a lifespan of 50 to 100 years or more if designed and installed correctly.
Based on observations from the third floor of the adjacent maintenance building, the upper tile roof appears to be in fair condition. Since the roof lacks a warranty, the City should consider a maintenance budget to maintain and repair it as needed.
Overall, the High Service portion of the building is in fair condition, with severe criticality. The frame, interior floors, shell roof and walls, and structure are in good condition. The shell doors, interior ceilings, and signage are in fair condition. The lavatory is in good condition. The exhaust fans used for climate control appeared to be in fair condition.
The electrical is in fair to good condition and varies throughout the space. For example, LED, incandescent, CFL, and fluorescent lighting is found in various locations throughout the building, as shown Figure 2.27.
The Lower Floor Pump Room Building's superstructure condition is fair. However, the electrical and lighting components are in poor condition, with some lighting switches appearing to be original to the building. The two lavatories and associated plumbing are also in poor condition due to the structure's age.
The exterior attached light fixtures, the interior light fixtures, and the light switches/controls are in fair condition overall. However, updated fixtures are needed in the lower level of the building shown in Figure 2.28. Upgrading the interior finishes and renovating the conditioned spaces and lower level lavatories are also recommended.
The City budgeted for a renovation of this building in the next 2 years. The scope of this renovation includes upgrading interior finishes and renovating conditioned spaces and lower level lavatories. As a result, no additional recommendations are made in the 15-year planning horizon.
2.4.10.4 Raw Water VFD and Switchgear Buildings
The Raw Water VFD Building's superstructure has a prefabricated foundation and houses VFDs for Raw Water Pumps No. 2 and No. 3. Its frame, interior floors, and roof are insulated metal panel construction. Overall, the building is in good condition, as shown in Figure 2.28.
BUILDINGS CONDITION PHOTOS 2

The Raw Water Switchgear Building's superstructure is similar to the VFD building, except it houses the switchgear for Raw Water Pumps No. 1, No. 4, and No. 5. This building is in fair condition and lacks an HVAC system.
A significant amount of water pools on the building floor, posing a safety risk. Subsequently, the electrical condition of this building is poor and of severe criticality. Building a new masonry block switchgear building and replacing the Raw Water Pumps No. 1 through 5 are recommended.
2.4.10.5 Maintenance Building
The Maintenance Building's frame was constructed in 1952 and was updated in 1982. The roof consists of a central flat, built-up roof system with barrel tile roof system at the perimeter. The flat roof was installed in 2004 and has a 30-year warranty.
The age of the barrel tile roof system is unknown, but it appears to be in fair condition, with some minor damaged and displaced tiles. The roof is assumed to date back to 1982 and does not have a warranty. The building's shell has a Type-F roof hatch with a steel frame supported by steel trusses and slope panels.
Overall, the Maintenance Building is good condition. However, the frame, shell roof (shown in Figure 2.27), and signage are in fair condition. Furthermore, the adjacent smoke stack structure is in very poor condition although plant staff noted that this structure was inspected in 2011. Staff also reported a leak near the hatch in the center of the building at the built-up roof. The leak should be covered under the existing warranty.
Inside the building, most of the ceiling is exposed, with no ceiling system in place. Areas with ceiling systems are in good condition as shown in Figure 2.27. On the egress stair, paint is peeling.
Painting the ground floor shop areas is recommended. The first floor includes a workshop and welding room; the second floor includes general office space; and the third floor includes a newly renovated conference center. The second and third floor been recently renovated.
The exterior attached light fixtures, interior light fixtures, and light switches/controls are in fair condition. Lighting on the third floor has been recently upgraded. On the first floor, the lighting shows age and is less efficient than the upgraded lighting on the third floor.
Similarly, the buildings electrical components varied in condition. The first floor electrical is in poor condition, with significant corrosion noted, and the second and third floors are in fair condition. The first floor light fixtures should be replaced when scheduled for renovation.
2.4.10.6 Utility Building
The Utility Building's superstructure has a pre-engineered metal frame and a roof made of metal panels and dates to the 1980s. The building's shell walls are also made of metal
panels, and the building's structure is steel. The mezzanine has a wood-framed slab that is capable of supporting 90 psf.
This building is in overall fair condition, as shown in Figure 2.28. Although the bathroom and office have ceilings, the building's main interior space does not. Furthermore, the foundation, frame, interior ceilings and floors, shell doors, roof, and walls, signage, and structure are in fair condition. The interior walls are in poor condition.
The light switches/controls and the interior light fixtures are in fair condition, whereas the electrical is in poor condition, with the panels needing rehabilitation. The building lacks an HVAC system, and the exhaust fans are in fair condition.
2.4.10.7 Parts Building
The Parts Building was constructed in 2001. Overall, the building superstructure is in good condition, as shown in Figure 2.29. The roof system is clay barrel tile and is most likely original to the building. It does not have a warranty. Based on observations from the ground, the tile roof appears in fair condition, with some broken tiles visible. The City did not report any leaks. Because the frame's roof system is concealed, it was not assessed.
The building's structure is masonry. Inside the building, the floors are concrete slab. The signage, lavatory, and interior millwork are in fair condition.
The exterior attached light fixtures, interior light fixtures, and light switches/controls are in good condition. The interior lighting needs to be reconfigured so it is more appropriate for tasks carried out in that space.
2.4.10.8 Basin Control Building
The Basin Control Building, shown in Figure 2.29, was constructed in 1974. The building's frame is composed of concrete walls and a concrete roof. Because the building is an exposed structure, there are no ceilings inside. The interior floors are exposed concrete slab, and the structure is constructed of cast-in-place concrete.
The Basin Control Building is in fair condition overall, with severe criticality because the building serves all four treatment basins. Inside the building, the floors' concrete is pitted. The roof could not be seen or accessed.
The building's foundation, frame, and shell windows are in fair condition. The shell doors and interior floors are in poor condition.
The Basin Control Building electrical lighting and receptacles are in poor condition. Thus, replacing them with LED type lighting is recommended.
BUILDINGS CONDITION PHOTOS 3
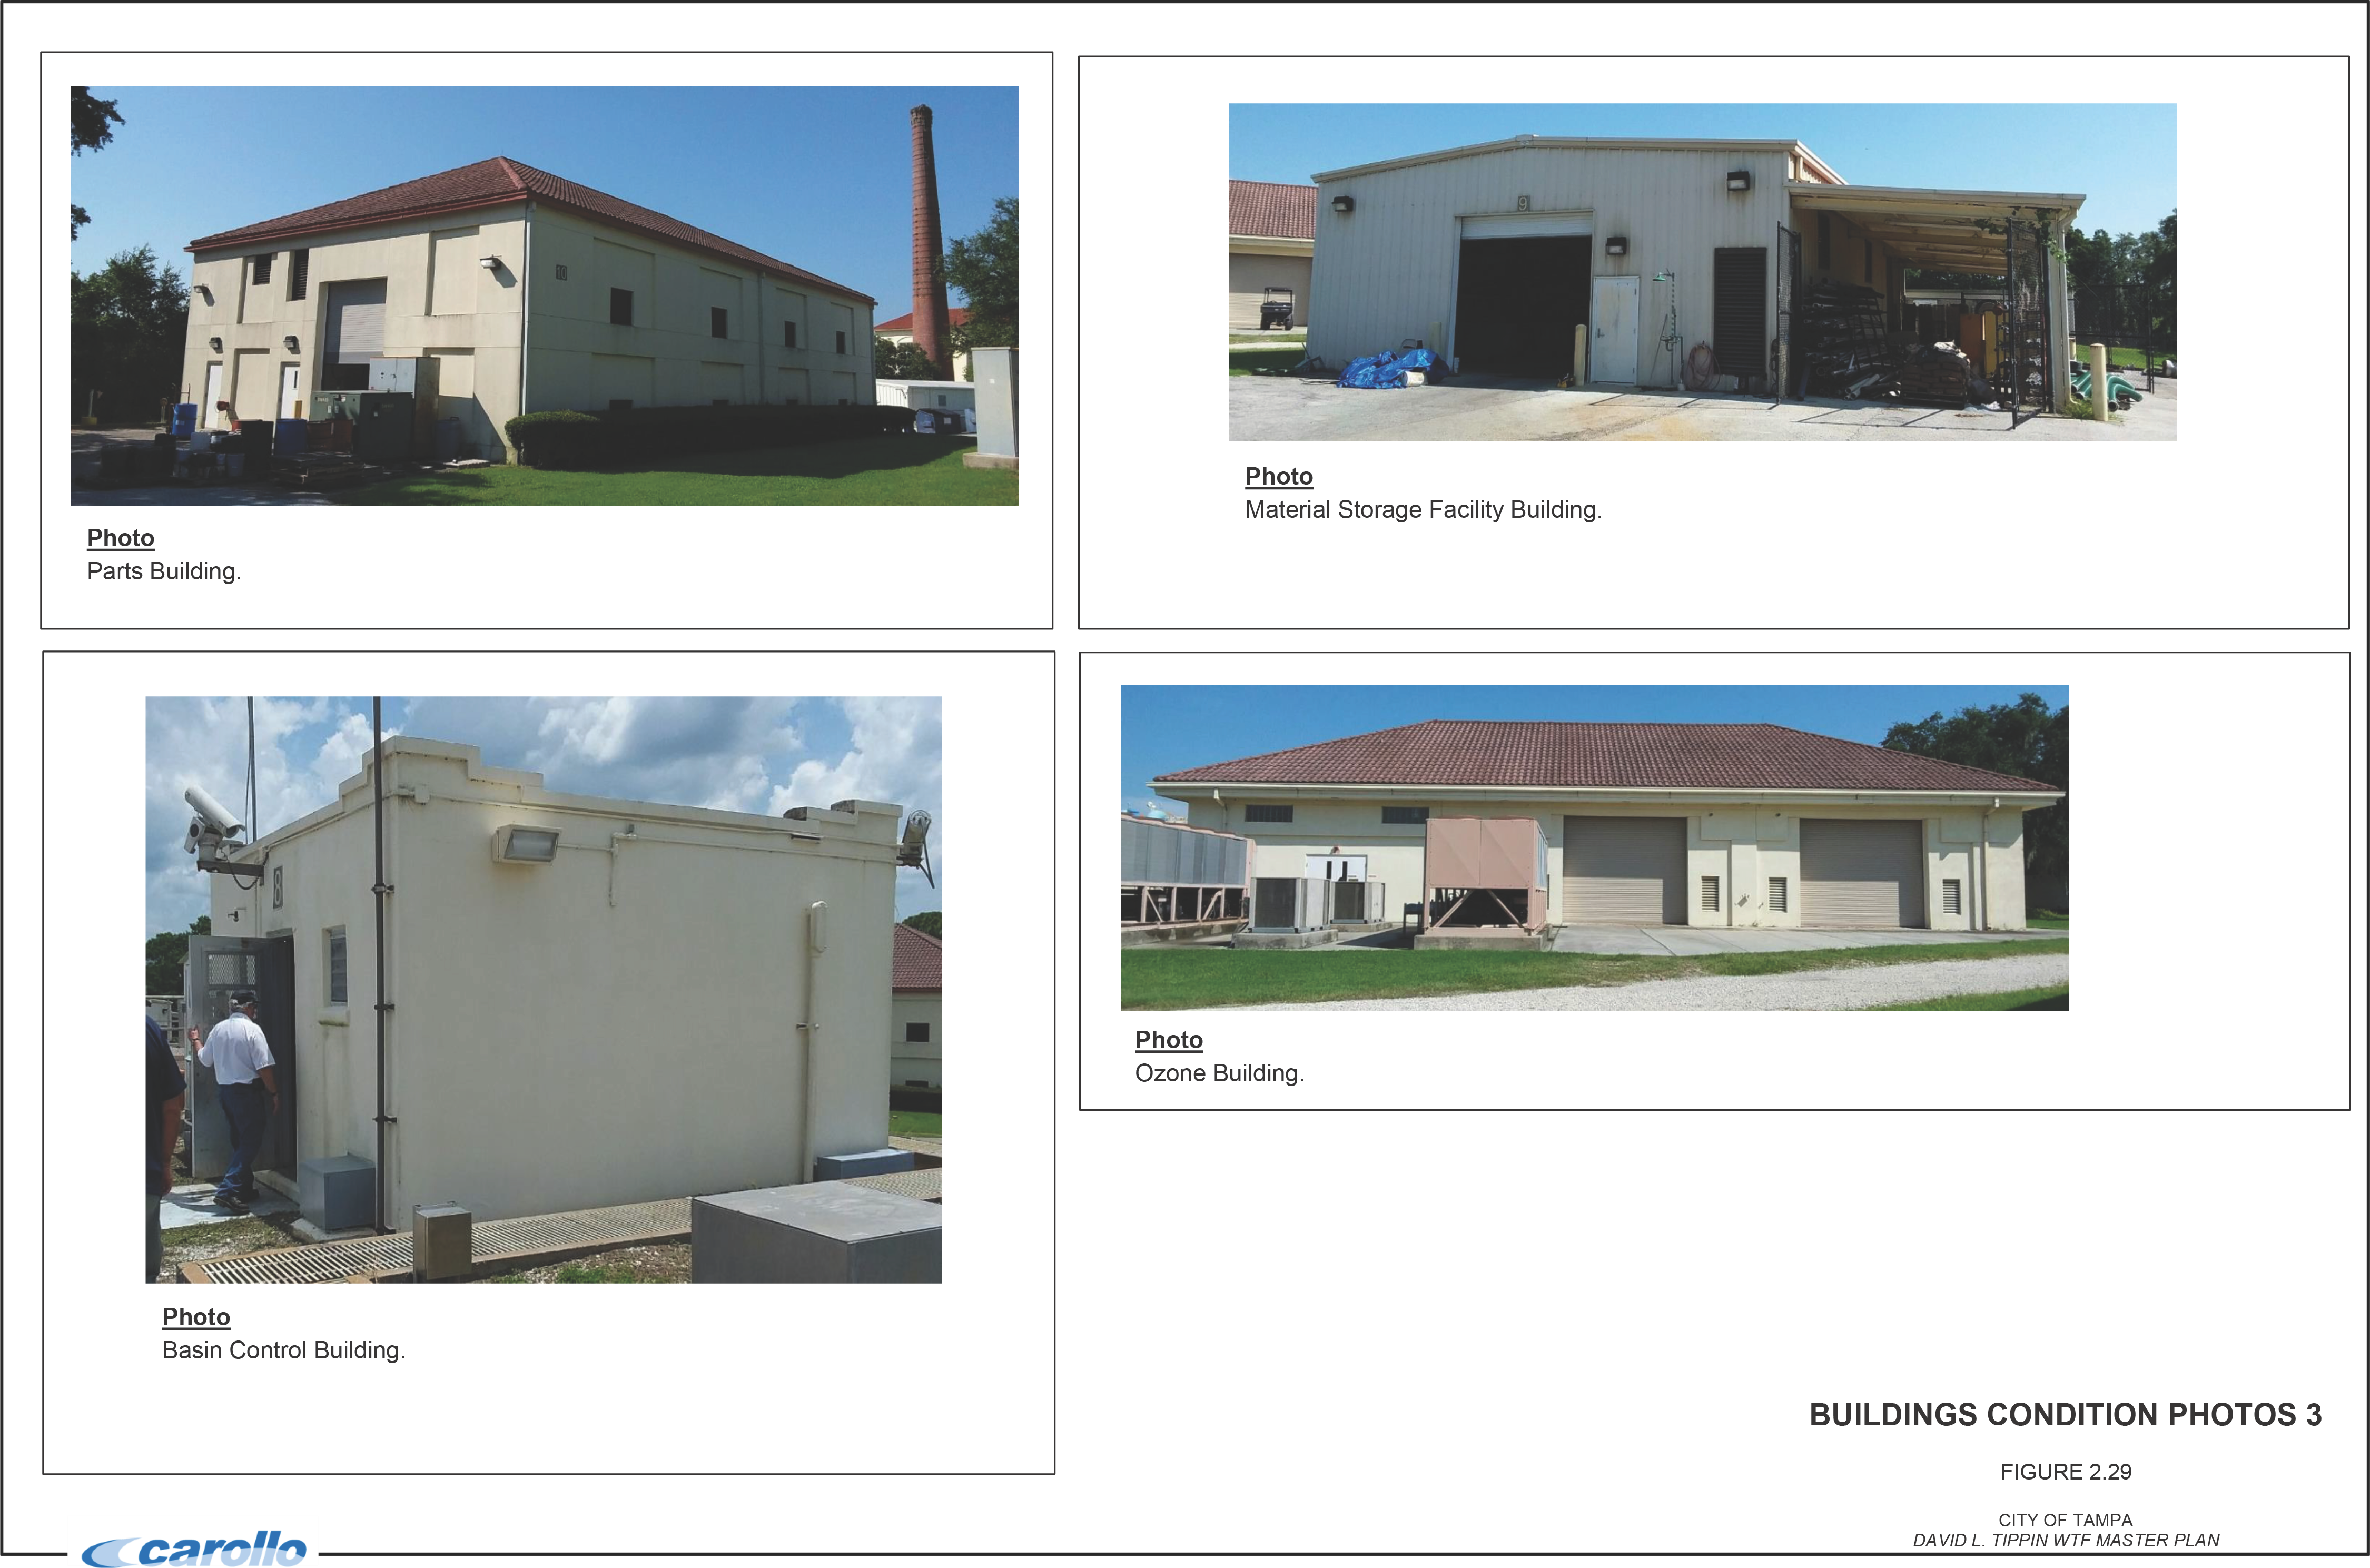
2.4.10.9 Material Storage Facility Building
The Material Storage Facility Building, shown in Figure 2.29, is a pre-engineered metal building built around the year 2000. The interior floors are concrete slab; the roof and shell walls are composed of metal panels; and the structure is steel. The foundation, frame, interior floors, interior walls, shell walls, and signage are in fair condition.
The exterior attached light fixtures, interior light fixtures, and light switches/controls are in poor condition and are recommended for replacement. The electrical systems and exhaust fans are also in poor condition.
2.4.10.10 Ozone Building
The Ozone Building was constructed in 2001 and is shown in Figure 2.29. Inside, the floors are slab-on-grade, and the walls are masonry. The building's shell walls are masonry, and its windows are made of glass block. The building is in good condition overall. The frame, interior floors, shell walls and windows, and signage are in fair condition.
The roof system is clay barrel tile and is most likely original to the building. It does not have a warranty in place. Based on observation from the ground, the tile roof appears in fair condition, with some broken tiles visible. The City has not reported any leaks.
The exterior attached light fixtures, interior light fixtures, and light switches/controls are in good condition. The electrical systems in the building are in good condition because the building has climate control and an HVAC system. The fire protection system is also in good condition and is regularly maintained.
Because codes require ventilation in ozone generator rooms, the HVAC associated with the ozone building should be replaced. As mentioned previously, ventilation is critical to avoid build-up on ozone gas from fugitive or nuisance emissions.
These emissions can originate from leaky valve stems, instruments, and anything else with a seal on the product gas piping.
The ventilation fans should be designed to provide the code-required continuous six air changes per hour in the ozone generator room. Having redundancy in exhaust fans is important so that if one fails, the necessary air changes can still be provided. The ventilation system, including all new louvers, actuators, and programming, was under repair during the site visit.
2.4.10.11 Polymer Building
The Polymer Building's frame, constructed in 2001, has a cast-in-place concrete floor and a steel-framed hipped roof. The structure is masonry with a steel roof, and the exterior walls are masonry. The shell's windows are made of glass block. The roof system is clay barrel tile and is most likely original to the building. It does not have a warranty in place. Based on
observation from the ground, the tile roof appears in fair condition, with some broken tiles visible. The City has not reported any leaks.
Inside the building, the floors are made of concrete, and the walls are masonry. Because the building is an exposed structure, it has no ceilings.
Overall, the Polymer Building is in good condition. The Eastern portion of the building is a metal structure that houses the hydrogen peroxide tanks. This structure is in good condition. However, some corrosion was noted on the electrical equipment and tanks. Additionally a tripping hazard is present between the two tanks.
The exterior attached light fixtures, interior light fixtures, and light switches/controls are in fair to good condition, with some fixtures recommended for replacement. The electrical system is in good condition. The exhaust fans cool the building and are in fair condition. Photos of the condition are shown in Figure 2.30.
2.4.10.12 E House Building
The E House Building, shown in Figure 2.30, has a prefabricated frame with steel walls roof panels. The interior floors and main roof are part of the prefabricated unit. Overall, the building is in good condition. It does not have exterior light fixtures, and the electrical is in good condition.
2.4.10.13 Chemical Building
The Chemical Building's frame, constructed in 1991, is made of masonry walls with precast joists and a concrete deck roof slab. Installed in the year 2000 with a 30-year warranty, the roof is a flat built-up roof with barrel tile, as shown in Figure 2.30. The building's structure is made of concrete.
Overall, the Chemical Building superstructure is in fair condition. It was given a fatal criticality rating because of its failure could prohibit the plant from treating water.
The building has two roof systems, shown in Figure 2.31: a high roof with a clay barrel tile system and a low flat, built-up roof system. The higher clay tile roof is assumed to be original to the building. Based on observation from the low roof and ground, the tile roof appears in good condition. Some tiles are missing or damaged.
Inside the building, most areas are an exposed structure. The floor is a concrete slab with ceramic or quarry tiles. The walls are masonry with ceramic tile. The suspended acoustic ceiling in the lower portion of the building's main corridor is in poor condition.
The exterior attached light fixtures, interior light fixtures, and light switches/controls are in fair condition. The chemical building MCC is in very poor condition from being exposed to chlorine gas in 1989 and in the 2000s. Thus, it is recommended for replacement in conjunction with the building's respective electrical transformers.
BUILDINGS CONDITION PHOTOS 4

BUILDINGS CONDITION PHOTOS 5

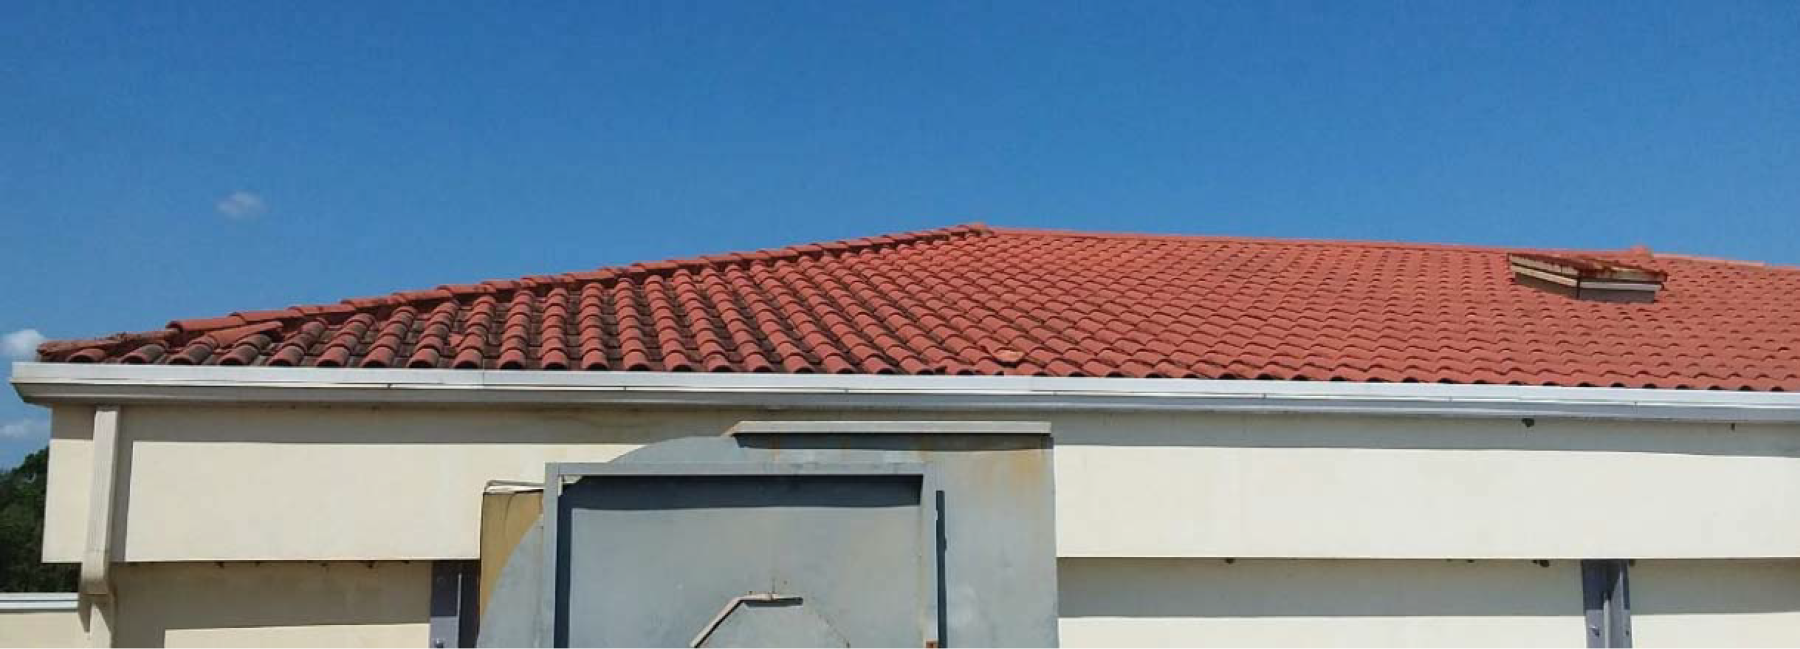
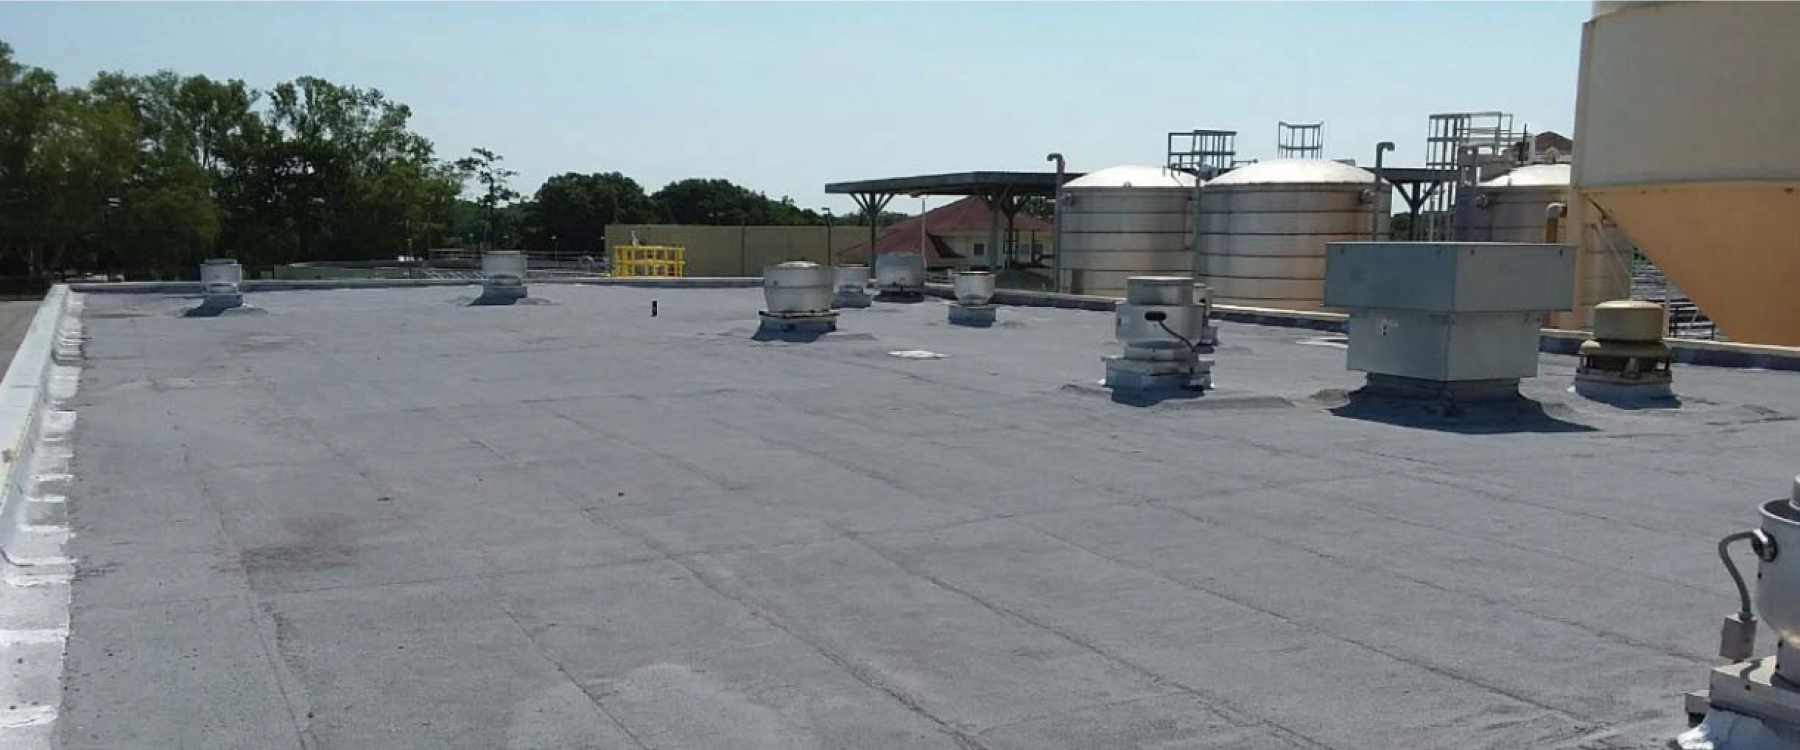
FIGURE 2.31
CITY OF TAMPA DAVID L. TIPPIN WTF MASTER PLAN
2.4.10.14 Lime House
The Lime House was constructed in 1947. Its structure has an xbox-braced steel frame with masonry cladding, with a concrete floor slab as the interior floor.
Overall, the Lime House is in poor condition, with moderate criticality. The exterior walls had settlement cracks. The signage and structure are in fair condition.
The electrical room is located on the inside of the building and is in poor condition. However, the City has a project in place to relocate and replace the electrical components. Figure 2.31 shows the interior of the building.
Although the roof could not be accessed, it is made of barrel tile. Based on observation from the ground, the tile roof appears in fair condition.
2.4.10.15 Administration Building
Shown in Figure 2.31, the Administration Building (also known as the Operations Building) consists of a two-story Operations/Admin Office Area and a one-story Conference Room. Constructed in 1925, the building has a concrete frame with clay block infill. The two-story component has a clay barrel tile roof system, and the one-story component has a flat, built-up roof system. The age of the clay tile roof is unknown.
Based on observation from the ground, the tile roof appears in fair condition, with no leaks reported or observed. The flat built-up roof was installed in 1995 and has a 30-year warranty. These roof areas received an “Energizer re-coating" in May of 2011. The building's shell has a hipped roof with steel trusses, wood rafters, and purlins.
Overall, the Administration Building is in fair condition, with fatal criticality because the controls room houses the SCADA controls. The main entry of the building's shell needs repairs. According to plant staff, however, an upcoming project is addressing this issue.
The interior ceilings, floors, and millwork, as well as the shell doors and roof, signage, and structure, are in fair condition. The building's electrical system, however, is in very poor and of fatal criticality due to its service to the SCADA control room.
The lavatories are in fair condition, with some leaks and mold noted in the men's restroom. The HVAC is in fair condition as well.
The City has a partial remodel and renovation project in place to address issues in the next 2 years. This project involves:
- Renovating the first floor (conference room, break room, Instrument and Control Workroom, Supervisor Office, Shop Storage).
- Adding a Security Workroom, Production Offices, and Call Center.
- Renovating the office spaces on second floor.
- Renovating the attic space.
No recommendations are made in addition to this project in the 15-year planning horizon.
2.4.10.16 Filter Building and Gallery
The Filter Building and Gallery is a one-story structure. It has a center original structure constructed in 1925, with subsequent one-story wing additions in 1947, 1954, 1960, and 1974. The Filter Building and Gallery has a masonry frame and shares a common superstructure with the Administration Building.
The original center structure has a higher clay barrel tile roof of unknown age. Based on observation from the ground, the tile roof appears in good condition.
The aforementioned wing additions have built-up roofs. The building's flat built-up roof was installed in 1995 and has a 30-year warranty. These roof areas received an “Energizer re-coating" in May of 2011.
Overall, the building is in fair condition with severe criticality. Although no leaks were evident between the roof's spaces, the concrete pipe tunnel exiting the floor is cracked, and the locker room's floor had spalled concrete, as shown in Figure 2.32. The interior plaster walls of the original 1925 Filter Gallery showed peeling and blistering paint in some areas.
The exterior shell doors stick and are in poor condition. The interior frame, ceilings, floors, and millwork, as well as the signage and structure, are in fair condition.
The exterior attached light fixtures, interior light fixtures, and light switches/controls are in fair condition. The electrical systems in the filter gallery range from poor to fair condition.
The building lacks an HVAC system. The exhaust fans at both ends of the building are in poor condition, with missing louvers.
2.4.10.17 Security Building
Shown in Figure 2.32, the Security Building's frame and structure are made of masonry walls and a hipped wood roof. The building's roof was installed in 2005, with a warranty that expired in 2010. The City has not observed or reported any leaks. Overall, the Security Building is in good condition.
The exterior attached light fixtures, interior light fixtures, and light switches/controls are in good condition.
BUILDINGS CONDITION PHOTOS 6
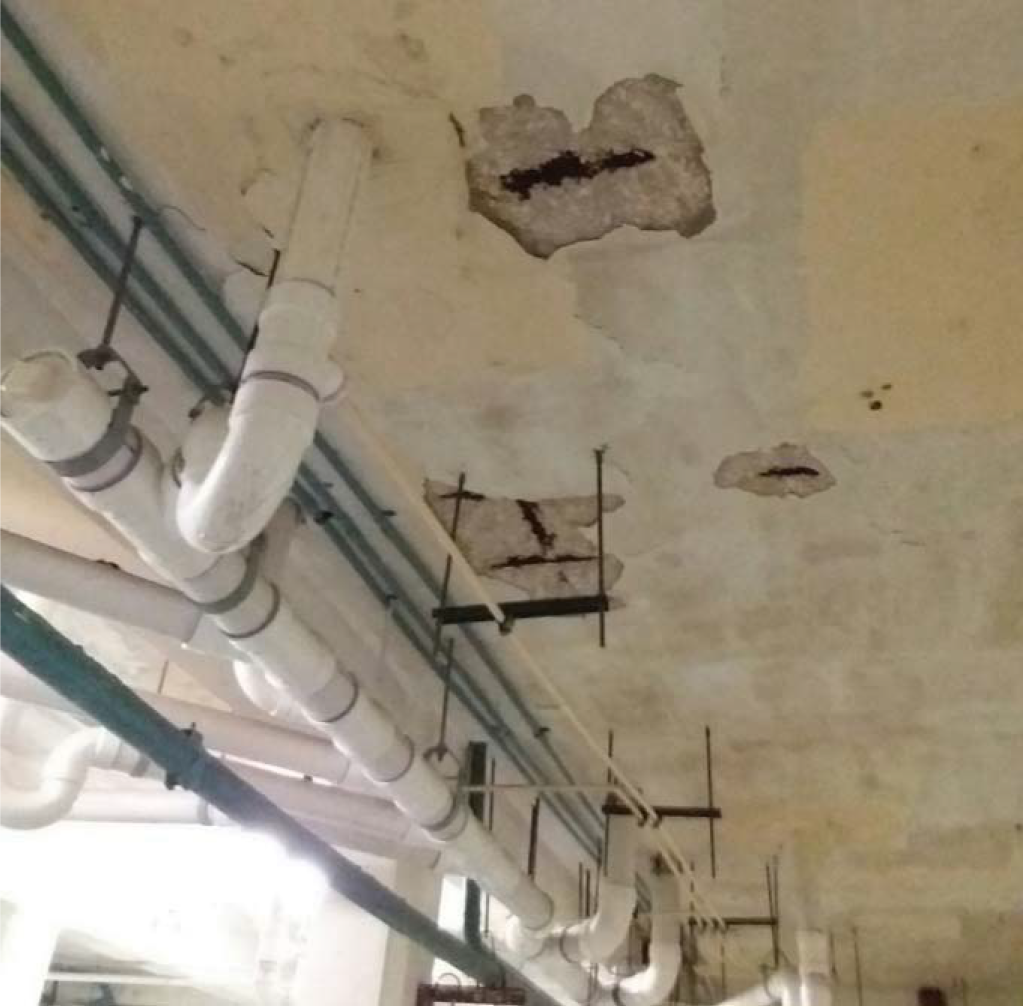
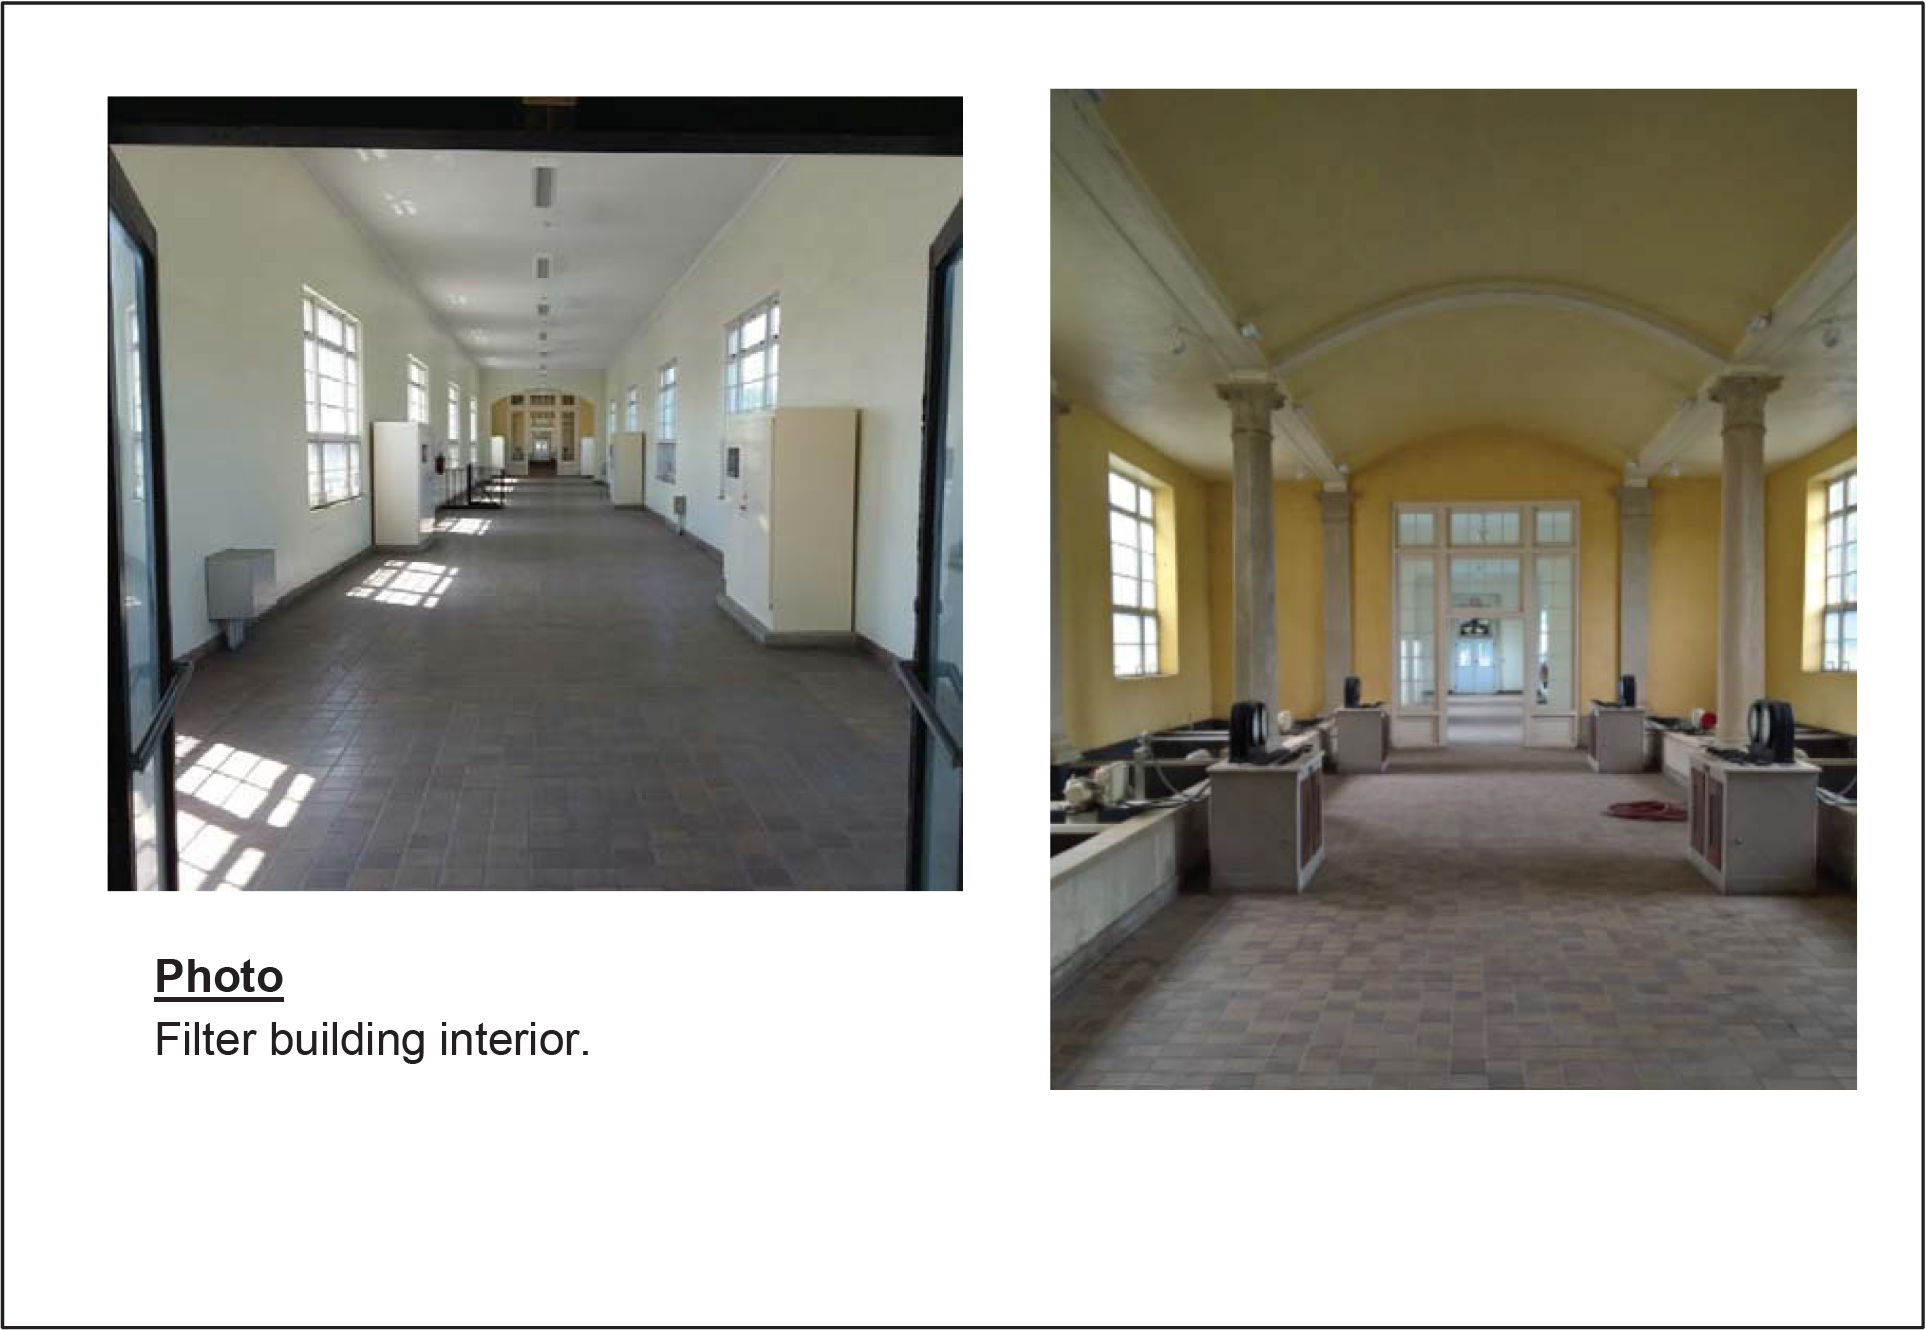
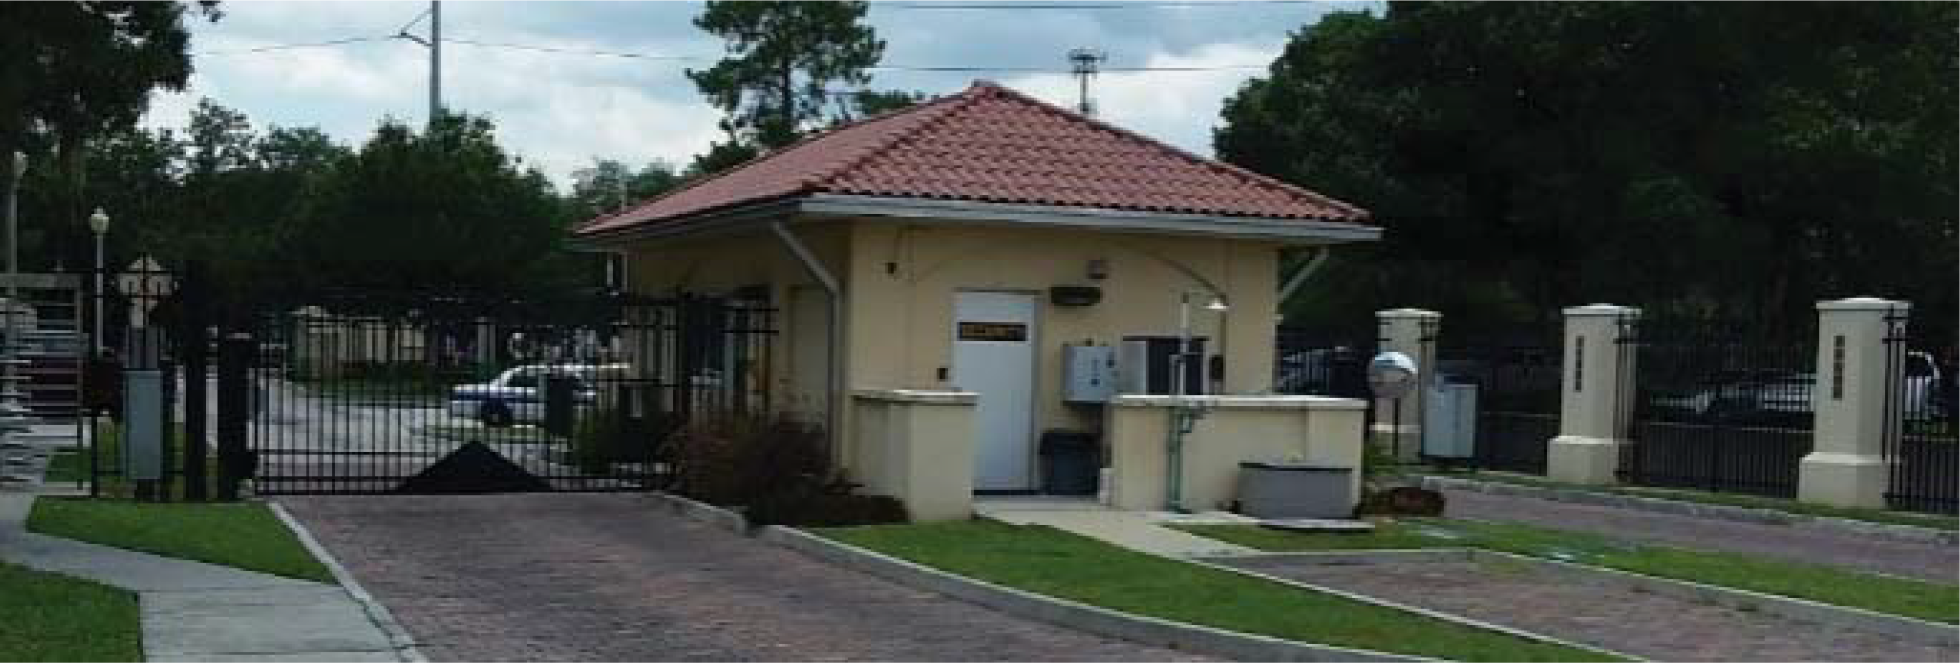
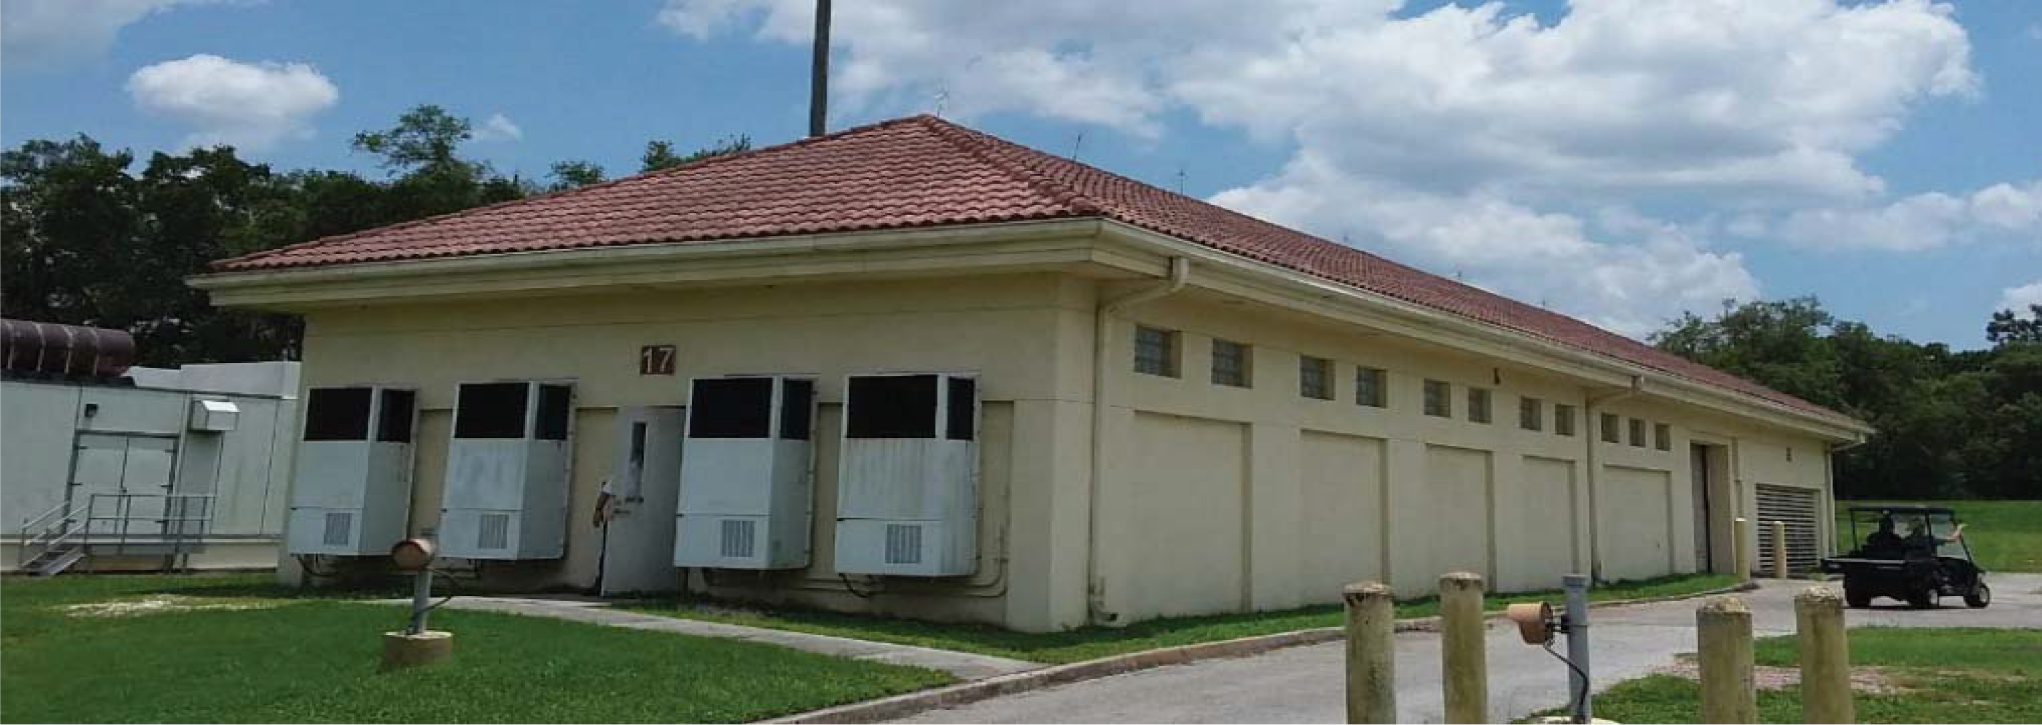
FIGURE 2.32
CITY OF TAMPA DAVID L. TIPPIN WTF MASTER PLAN
2.4.10.18 Generator and Switchgear Control Building
Also known as the TECO House Building, the Generator and Switchgear Control Building, shown in Figure 2.32, was constructed in 2001. The building has a masonry frame and a barrel tile roof. Its shell has a steel beam roof, a metal deck, and glass block windows. Inside the building, the ceilings are made of wallboard where the structure is not exposed. The floors are concrete, and the walls are masonry.
The roof system is clay barrel tile and is most likely original to the building. It does not have a warranty in place. Based on observation from the ground, the tile roof appears to be in fair condition, with some broken tiles visible. The City has not reported any leaks.
Overall, the building is in good condition, with severe criticality. From the ground level, the shell doors appeared to be in good condition.
The HVAC system consists of four exterior wall-mounted AC units in good condition. The electrical systems are also in good condition.
2.4.10.19 Remote High Service Building
The Remote High Service Building was constructed in 1954 with an addition constructed in 1974. The building has a cast-in-place concrete frame. The interior walls and the shell walls are concrete. The roof consists of a central flat, built-up roof system with barrel tile roof system at the perimeter.
Although the age of the barrel tile roof system is unknown, it appeared to be in fair condition. The tile roof could date back to the 1974 addition; it does not have a warranty.
At a lower elevation is a second flat roof that was installed in 1998, with a 30-year warranty. Because the warranty will expire in twelve years, the City should budget to replace the flat roof within the next 10 to 15 years.
Overall, the building is in fair condition, with moderate criticality. However, the concrete in the southeast corner of the shell walls is cracking, as shown in Figure 2.33.
The exterior attached and interior light fixtures are in fair condition. The building's electrical is in poor condition, with deteriorated panel boards.
2.4.10.20 Accelator Building
Also known as the Air Compressor Building, the Accelator Building, shown in Figure 2.33, was constructed in 1947. The building has a wood-frame roof, a conventional frame, and masonry walls. Inside the building, the ceilings are made of cement plaster; the floors are a concrete slab with a pipe well; and the walls are masonry. The building's shell has steel frame windows. Its structure has a wood roof and masonry walls.
BUILDINGS CONDITION PHOTOS 7
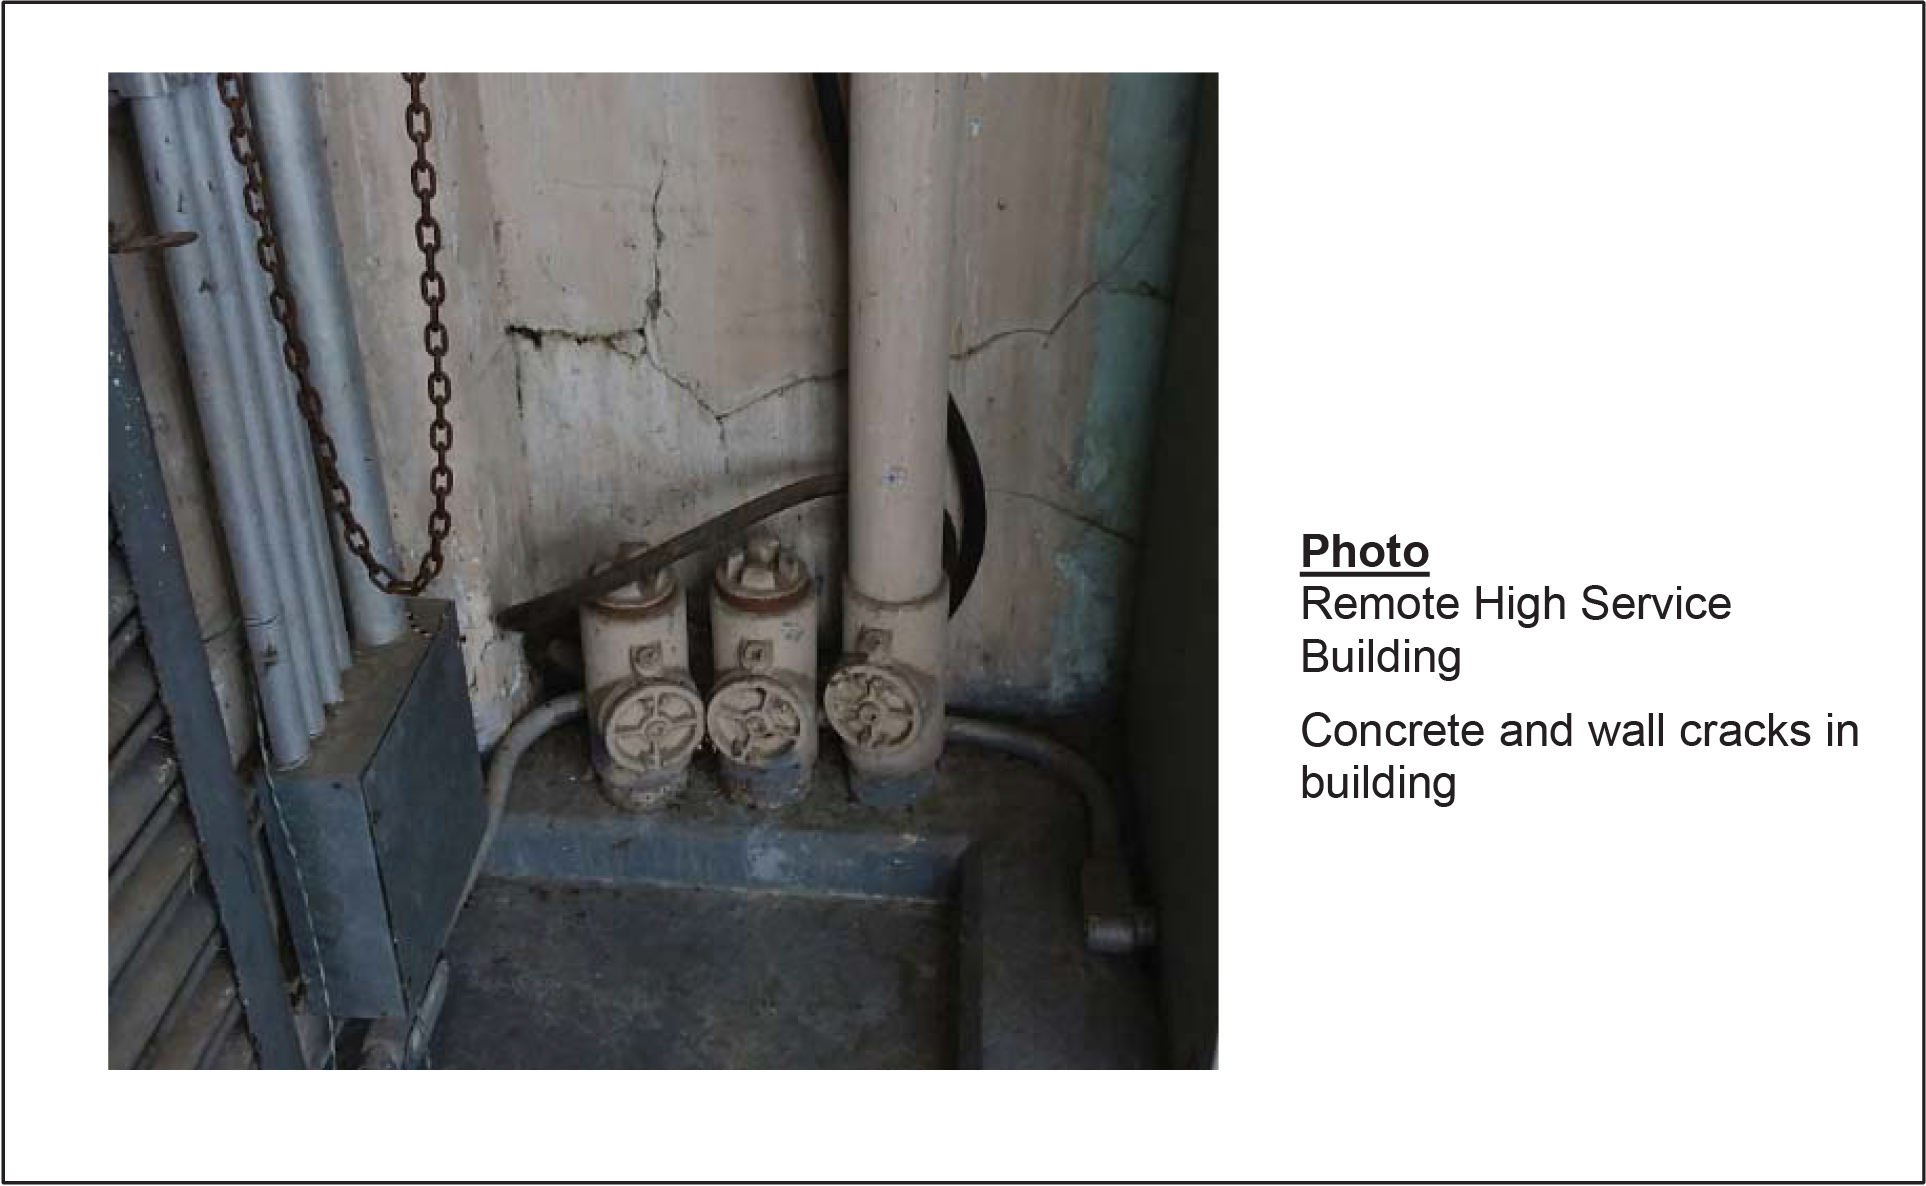
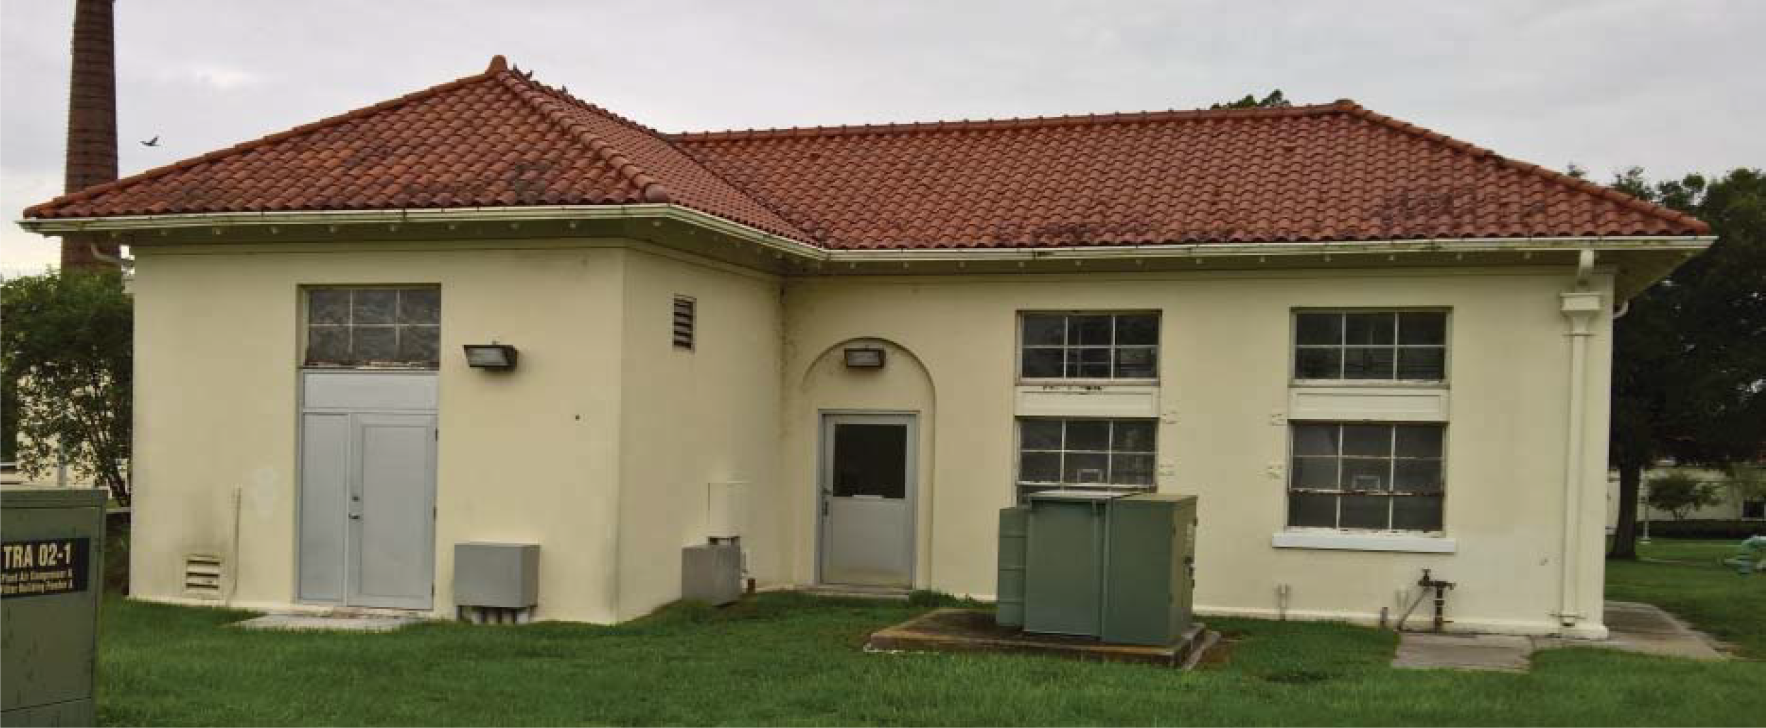
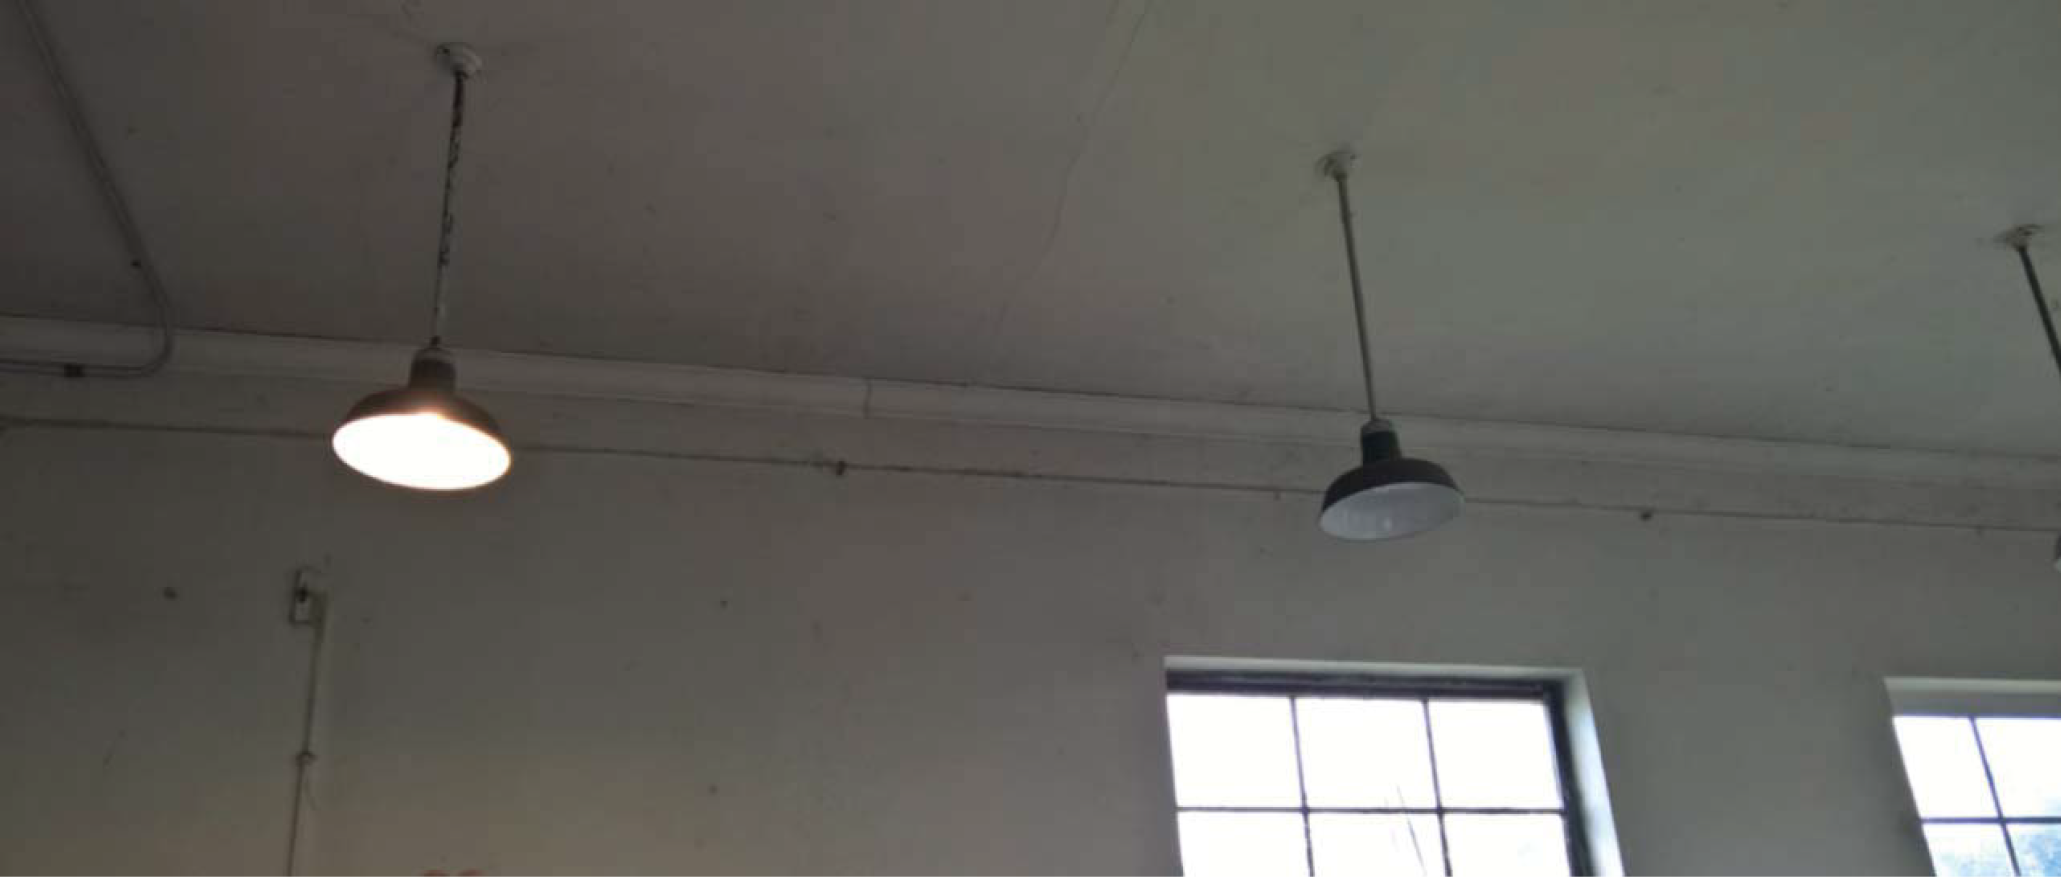
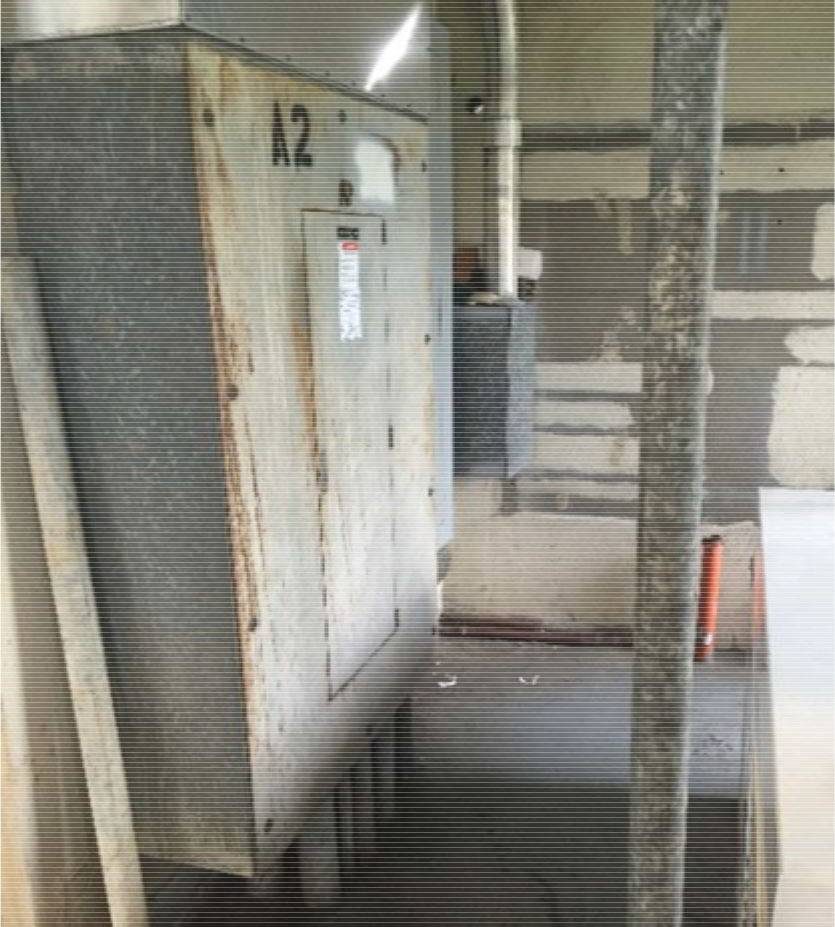
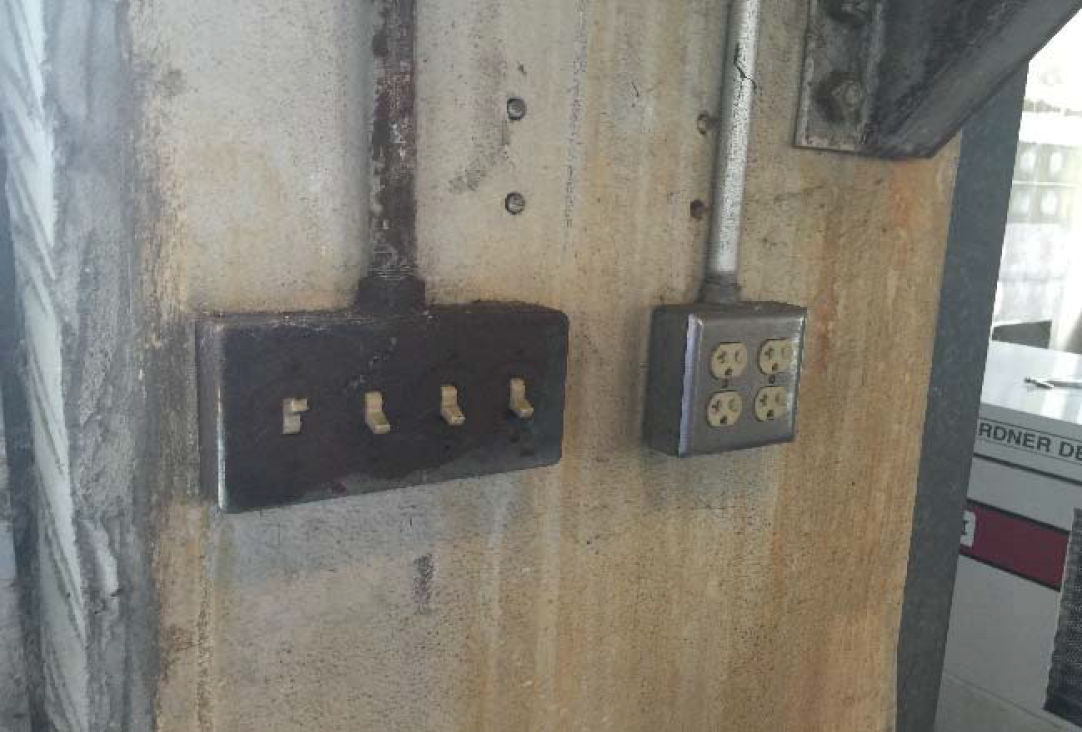
2.4.11 Plant Electrical Systems
Overall, the Accelator Building is in poor condition. The cement plaster ceilings are cracking in some areas. The shell windows are in poor condition; the steel frame windows are old and in need of major repair or replacement. The foundation, frame, interior floors and walls, and signage are in fair condition, and the interior ceilings and shell windows are in poor condition. To prevent further deterioration, renovating the building within the next 5 years should be considered. The building's function is being reconsidered, possibly to house switchgear.
The electrical systems are in poor condition. The SCADA Improvements project will address the building's electrical issues and use it as the breaker building for the administration building filters, with added redundancy. Under this project, the compressors will be relocated to another area. New windows will also be installed, and some air conditioning improvements will be made.
In addition to evaluating the electrical components of assets, the overall plant electrical systems were evaluated, including:
- Facility utility power.
- Emergency power systems.
- Facility power supply and distribution.
As stated previously, instrumentation and controls were not part of this evaluation. Additionally, programmable logic controllers (PLCs) were not evaluated, since the City is replacing these assets plant-wide. Appendix A includes additional information on the overall condition, criticalities, and calculated risks of the electrical systems.
2.4.11.1 Utility Power
Two TECO 13.2KV feeders serve the DLTWTF, identified on-site as 'A' (#13100) and 'C' (#13260). The main switchgear, as shown in Figure 2.34, is in good condition. As such, no recommendations are made within the 15-year planning horizon.
2.4.11.2 Emergency Power
Generators 1, 2, and 3 are in good condition, with moderate criticality. No oil leaks were visible, and continuing routine maintenance is recommended for oil changes, filter changes, battery/charger testing, etc. The generator switchgear is in good condition.
The fuel storage tanks, as shown in Figure 2.34, are also in good condition with severe criticality. A project is currently in place to add a fourth generator and replace the pumps in the fuel storage tanks.
ELECTRICAL SYSTEM CONDITION PHOTOS
FIGURE 2.34
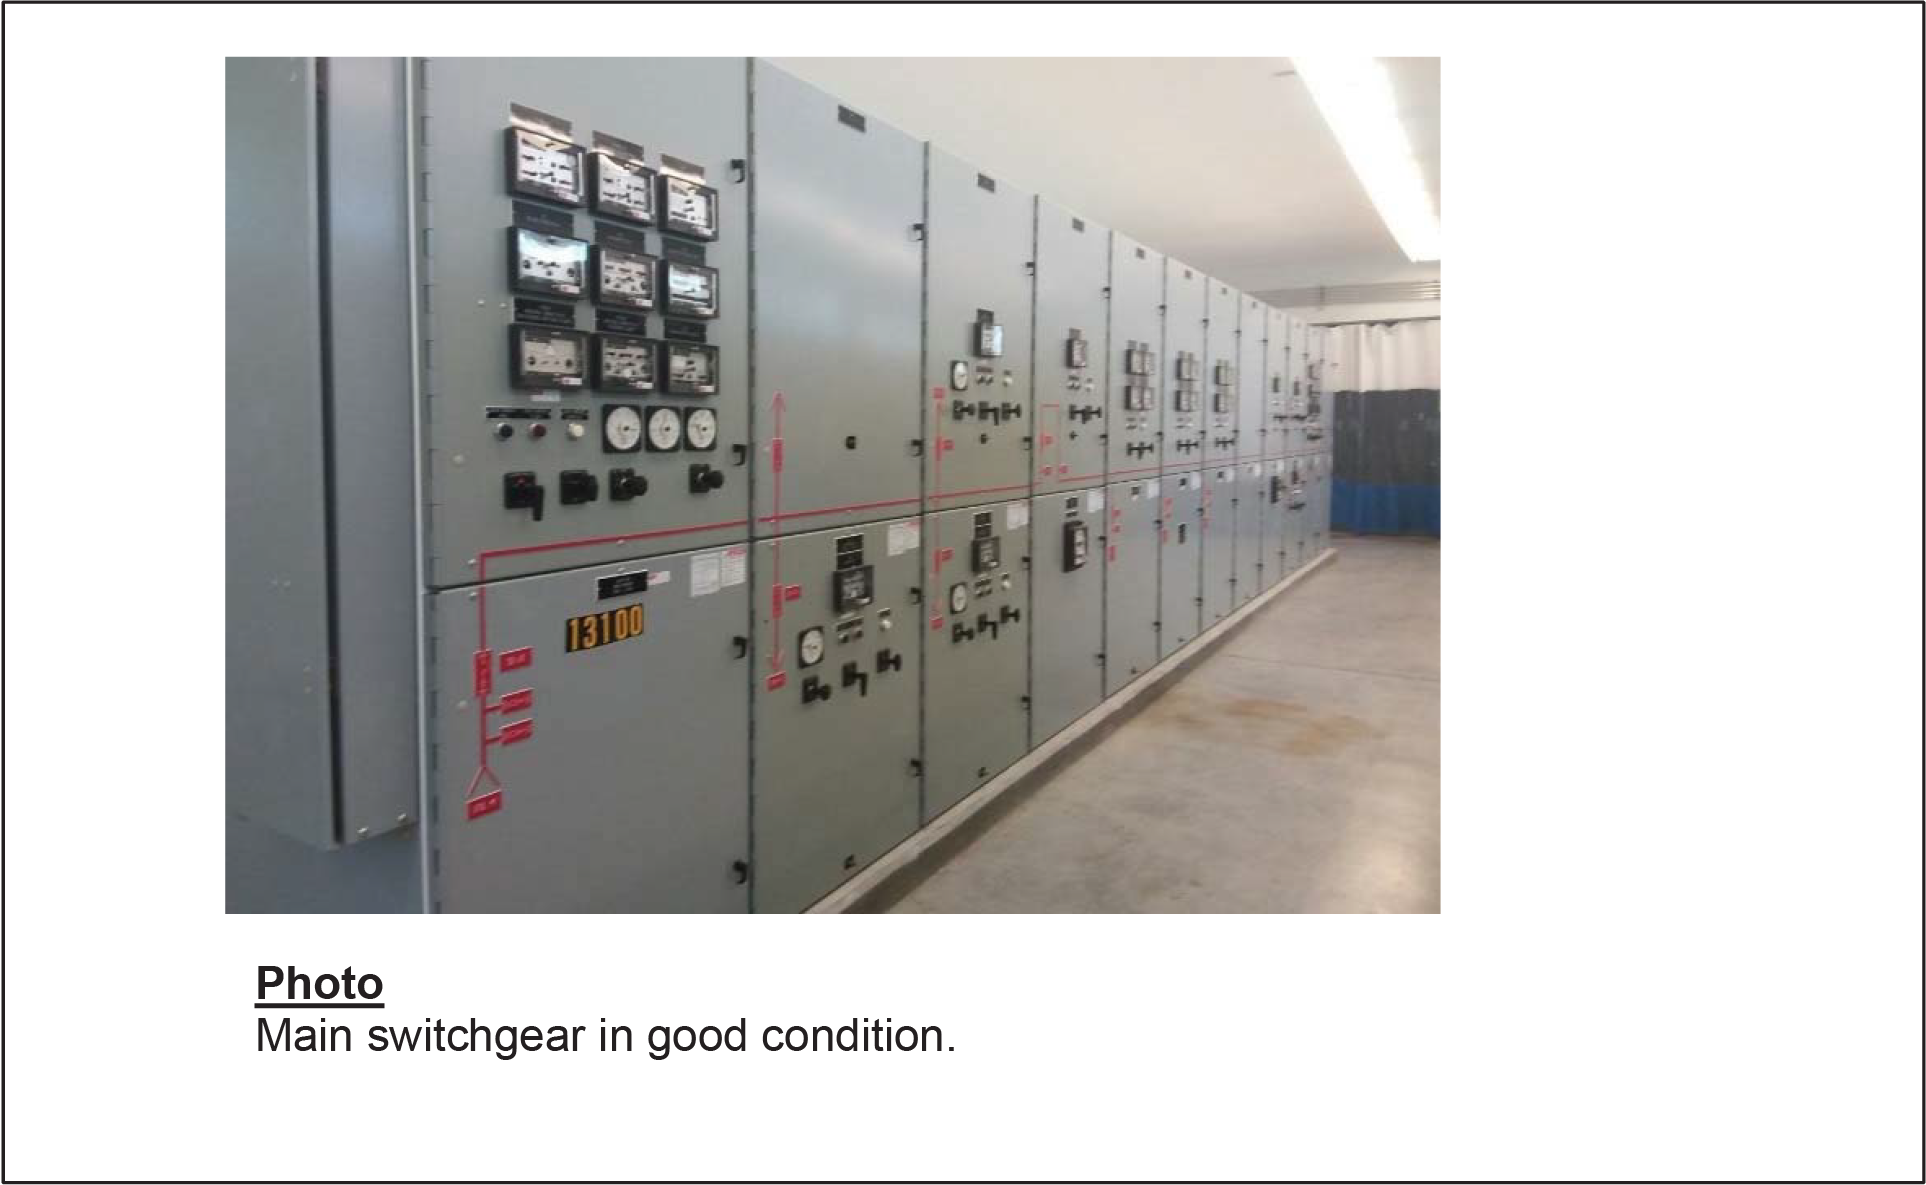
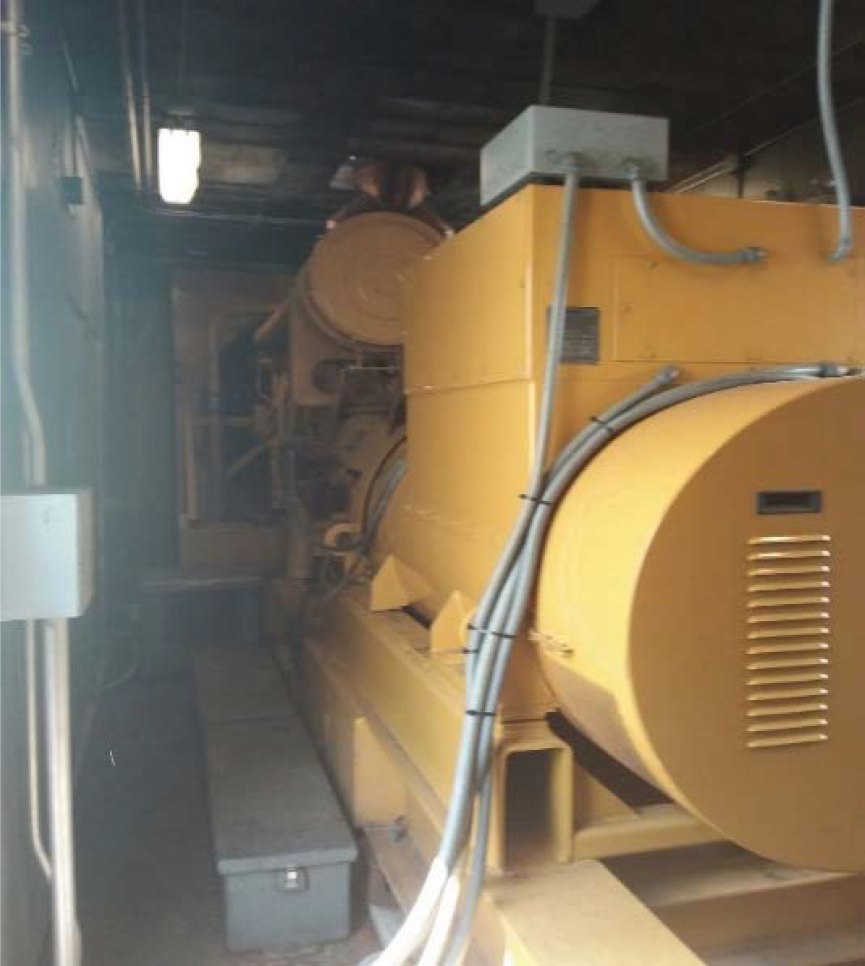
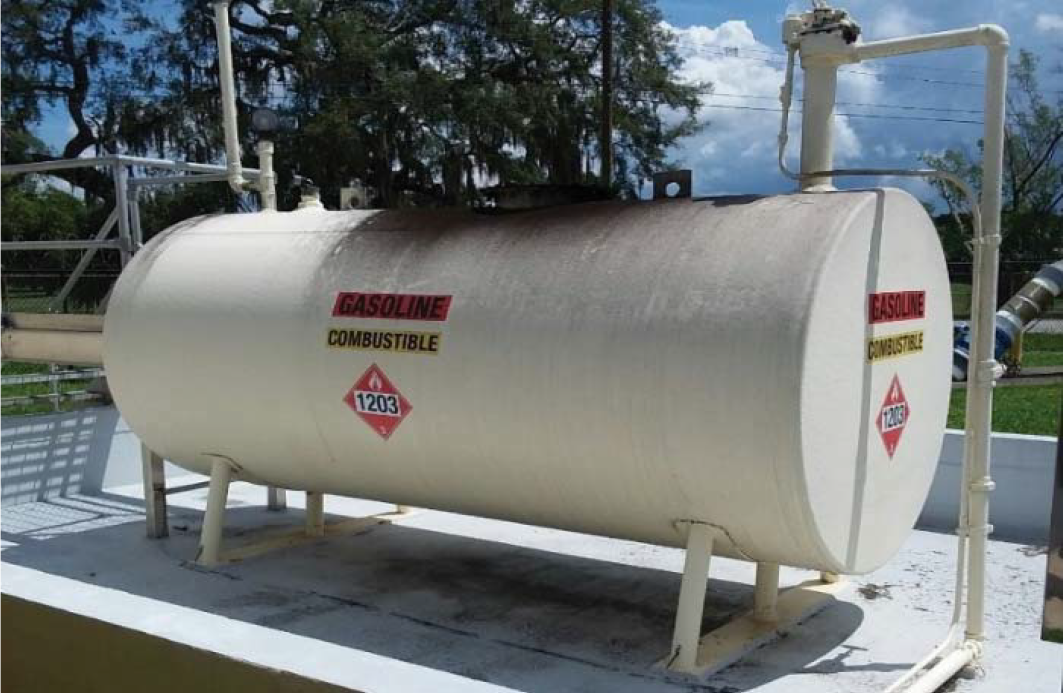
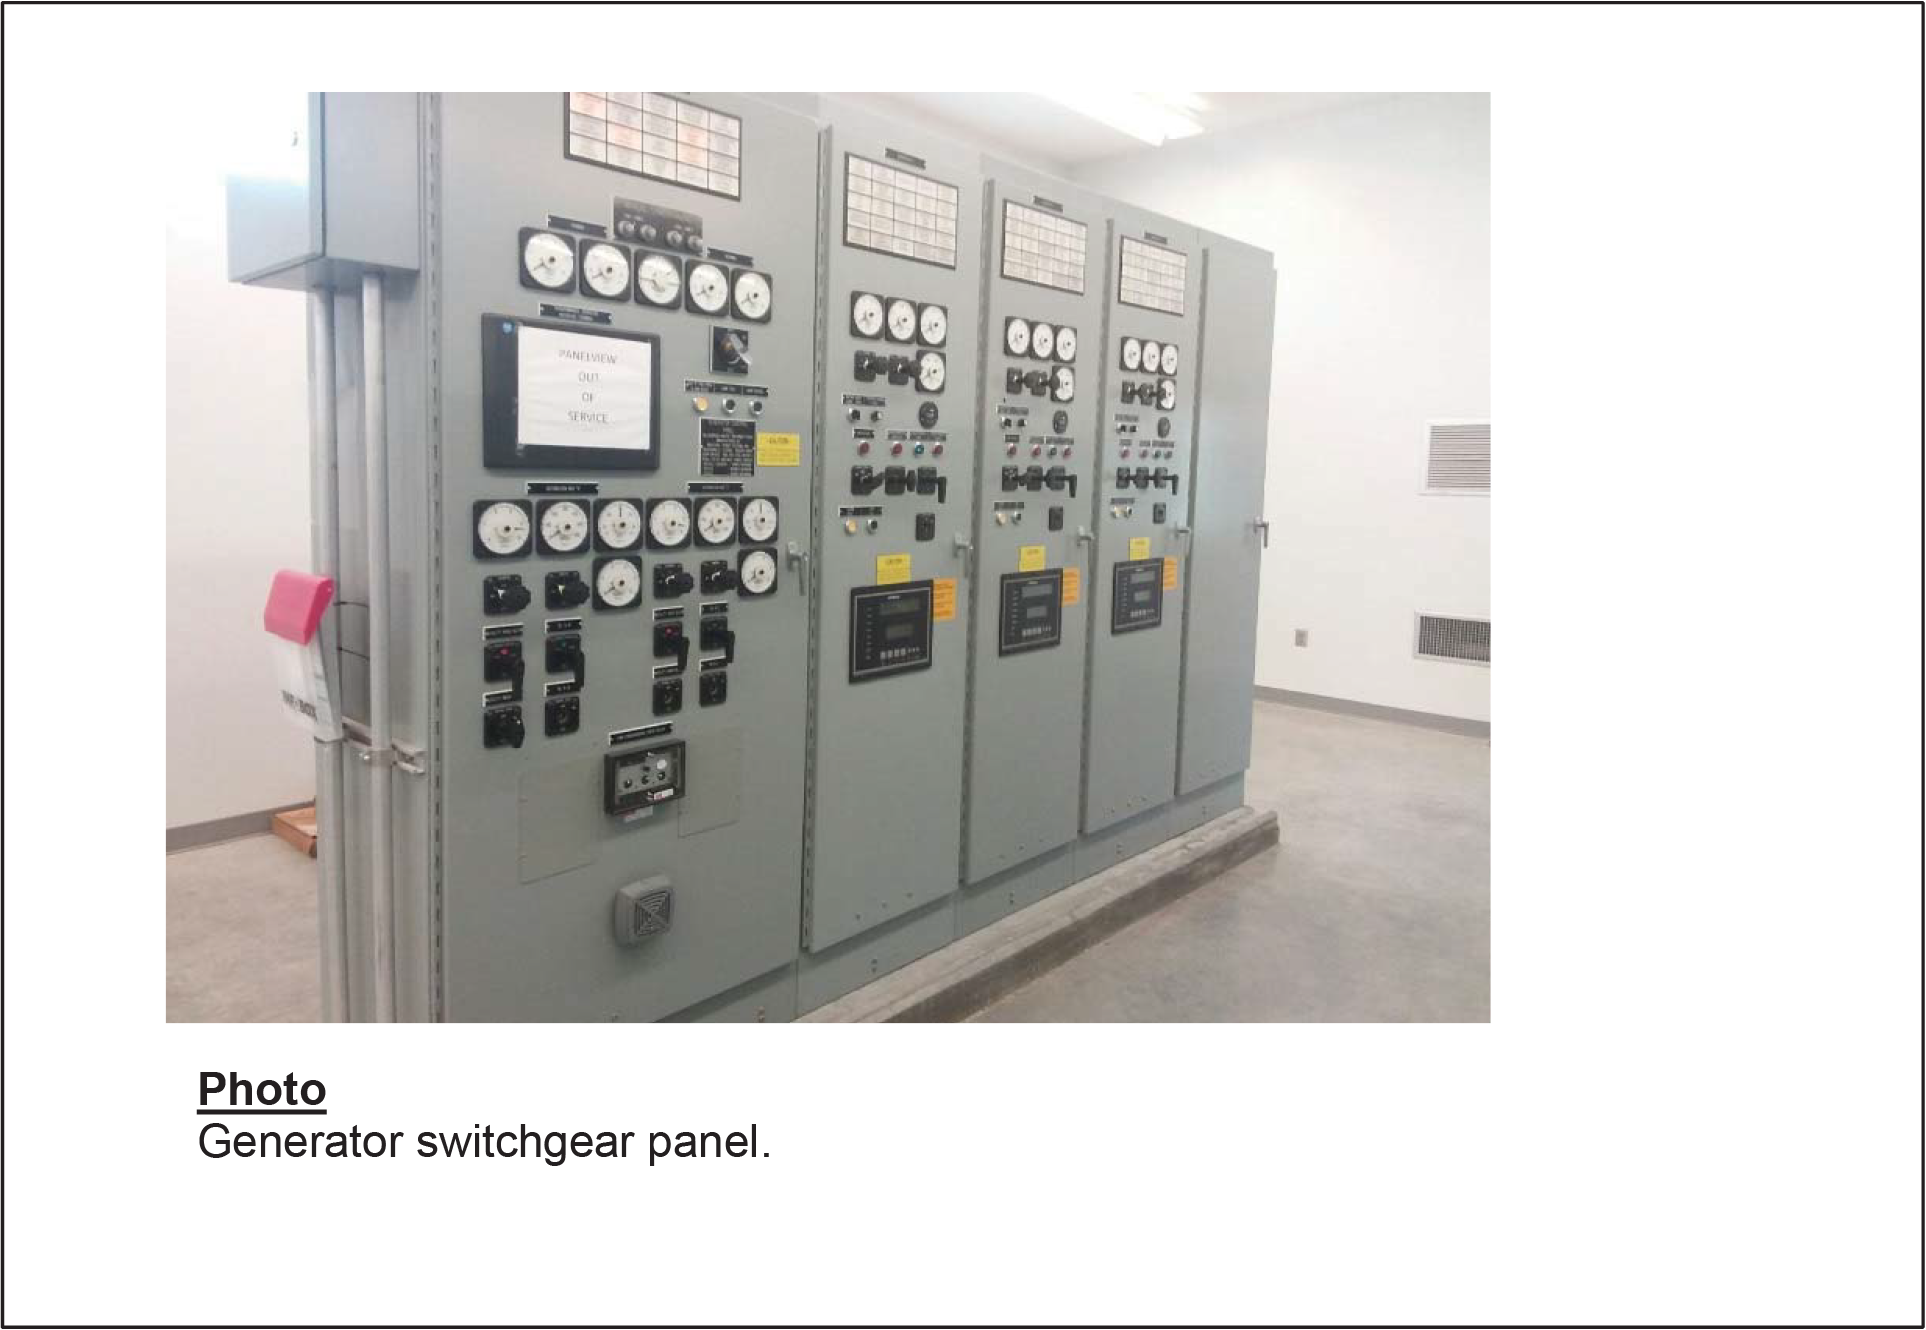
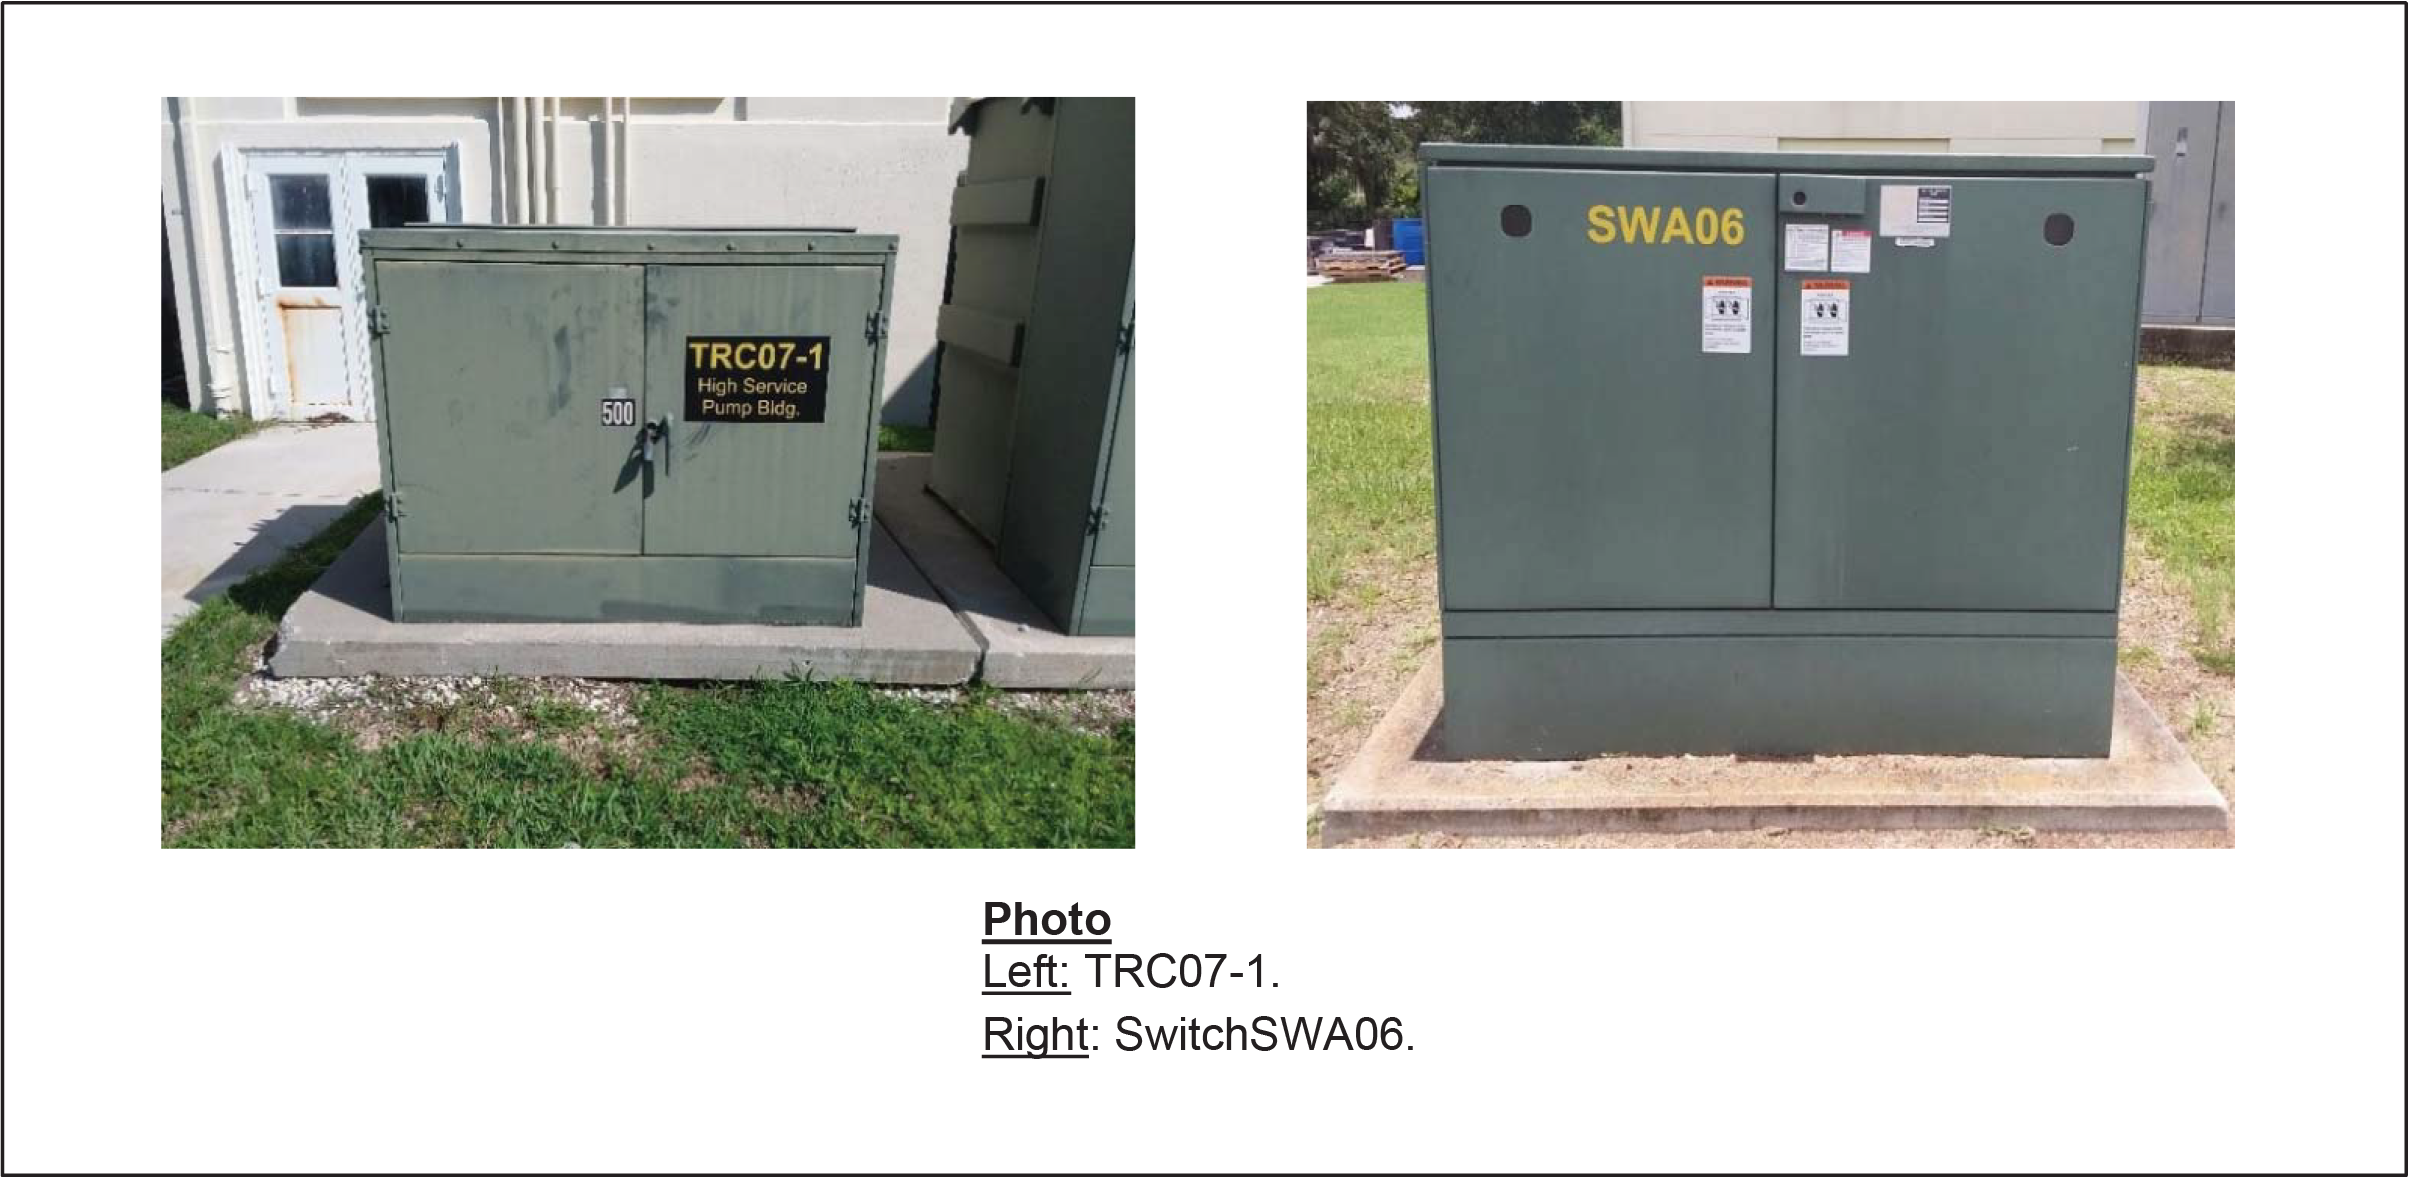
The fuel tanks and containment structure for the gasoline fuel station are in fair condition, with minimal corrosion noted. The generator fuel containment structure, exhaust structure, and hemisphere array structure are in fair condition. The 12,000 gallon diesel fuel tanks and the fuel tank detection sump are in fair condition.
2.4.11.3 Electric Power Supply and Distribution
The looped primary around the site has nine sectionalizing switches for each feeder (A and C). Switches SWA01 through SWA09 and switches SWC01 through SWC09 are in good condition, with moderate criticality.
Feeder A has fifteen pad-mounted transformers (one is not being used) and fourteen pad-mounted transformers on Feeder B of varying utilization voltages: 4,160V, 2,400V, 480V, 240V, and 208V.
Most of the pad-mounted transformers were installed in 2000 and are recommended for cleaning and washing. Replacing renewal parts, such as gaskets, oil, etc., plant-wide is also recommended to continue as preventative maintenance to help prevent failures or leaks.
The 240V (120/240V, 3 phase, 4 wire) transformers are delta configuration with a “high leg.” Replacing them with the more standard wye configuration with 120/208V, 3 phase, 4 wire should be considered. In doing so, single-phase loads could be better balanced and dangers associated with the "high leg" could be avoided.
The following transformers should be changed: TRA02-1, TRA03-1, TRA06-1, TRA07-1, TRC02-1, TRC03-1, TRC07-1 and TRC08-1. Figure 2.34 shows photos of TRC07-1 and SWA06.
2.4.11.4 Plant Control System Hardware and Software
The Plant Control System's computers run Windows 7 and use a fiber-optic data highway. Overall, the system's hardware is in good condition, with moderate criticality. Out of necessity, the current PLCs are being replaced. The system's software is in good condition, with severe criticality.
2.4.12 Civil and Site Work Systems
The civil and site work systems were evaluated and included site drainage (stormwater), site paving and roadways, accessible lift stations and field structures, and yard piping. Because buried piping and structures were not accessible, their condition was determined based on age and observations from plant staff. Appendix A includes additional information on the condition scores and risks for these assets.
2.4.12.1 Site Drainage, Stormwater and Paving
The stormwater system is designed to divert flow back to the Hillsborough River. The overall site drainage is in fair condition, with minor water pooling noted throughout the site.
As Figure 2.35 shows, previous rain events have caused minor sediment build-up. The paving is in fair condition, and minimal patching is needed. The brick roadways at the front of the DLTWTF are in fair condition, with some areas being unleveled.
2.4.12.2 Site Lighting and Security
For site security, the DLTWTF uses cameras, motion sensors, and fencing. The motion sensors and double sets of fencing surround the site and are in good condition. Operations staff did not note any issues with these systems.
2.4.12.3 Sanitary Sewers
The sanitary sewers and force mains on-site, shown in Figure 2.35, were inaccessible. Therefore, they are assumed to be in poor condition because they are more than 30 years old.
The maintenance wastewater lift station located just outside of the maintenance building is in fair condition, with pumps recently installed. Thoroughly assessing the interior of this structure is recommended.
The main wastewater lift station, located just south of the Administration building, is in good condition, with new pumps and check valves. The structure needs cosmetic attention due to minor corrosion and spalling concrete. The Parts Wastewater Lift Station, consisting of a duplex pump station, is in good condition.
2.4.12.4 Field Structures
The chemical manholes throughout the site were inaccessible. However, they are assumed to be in fair condition because of their age. The site-wide electrical vaults are in good condition, with no notable issues.
2.4.12.5 Yard Piping
The yard piping on-site is buried and was therefore inaccessible. However, based on its age (ranging from 1920s to 2000s), the yard piping is assumed to be in fair condition. Because much of the yard piping is of severe criticality, including raw water, settled water, and filtered water piping, further inspecting the interior condition of this piping is recommended.
CIVIL AND SITE WORK SYSTEM CONDITION PHOTOS

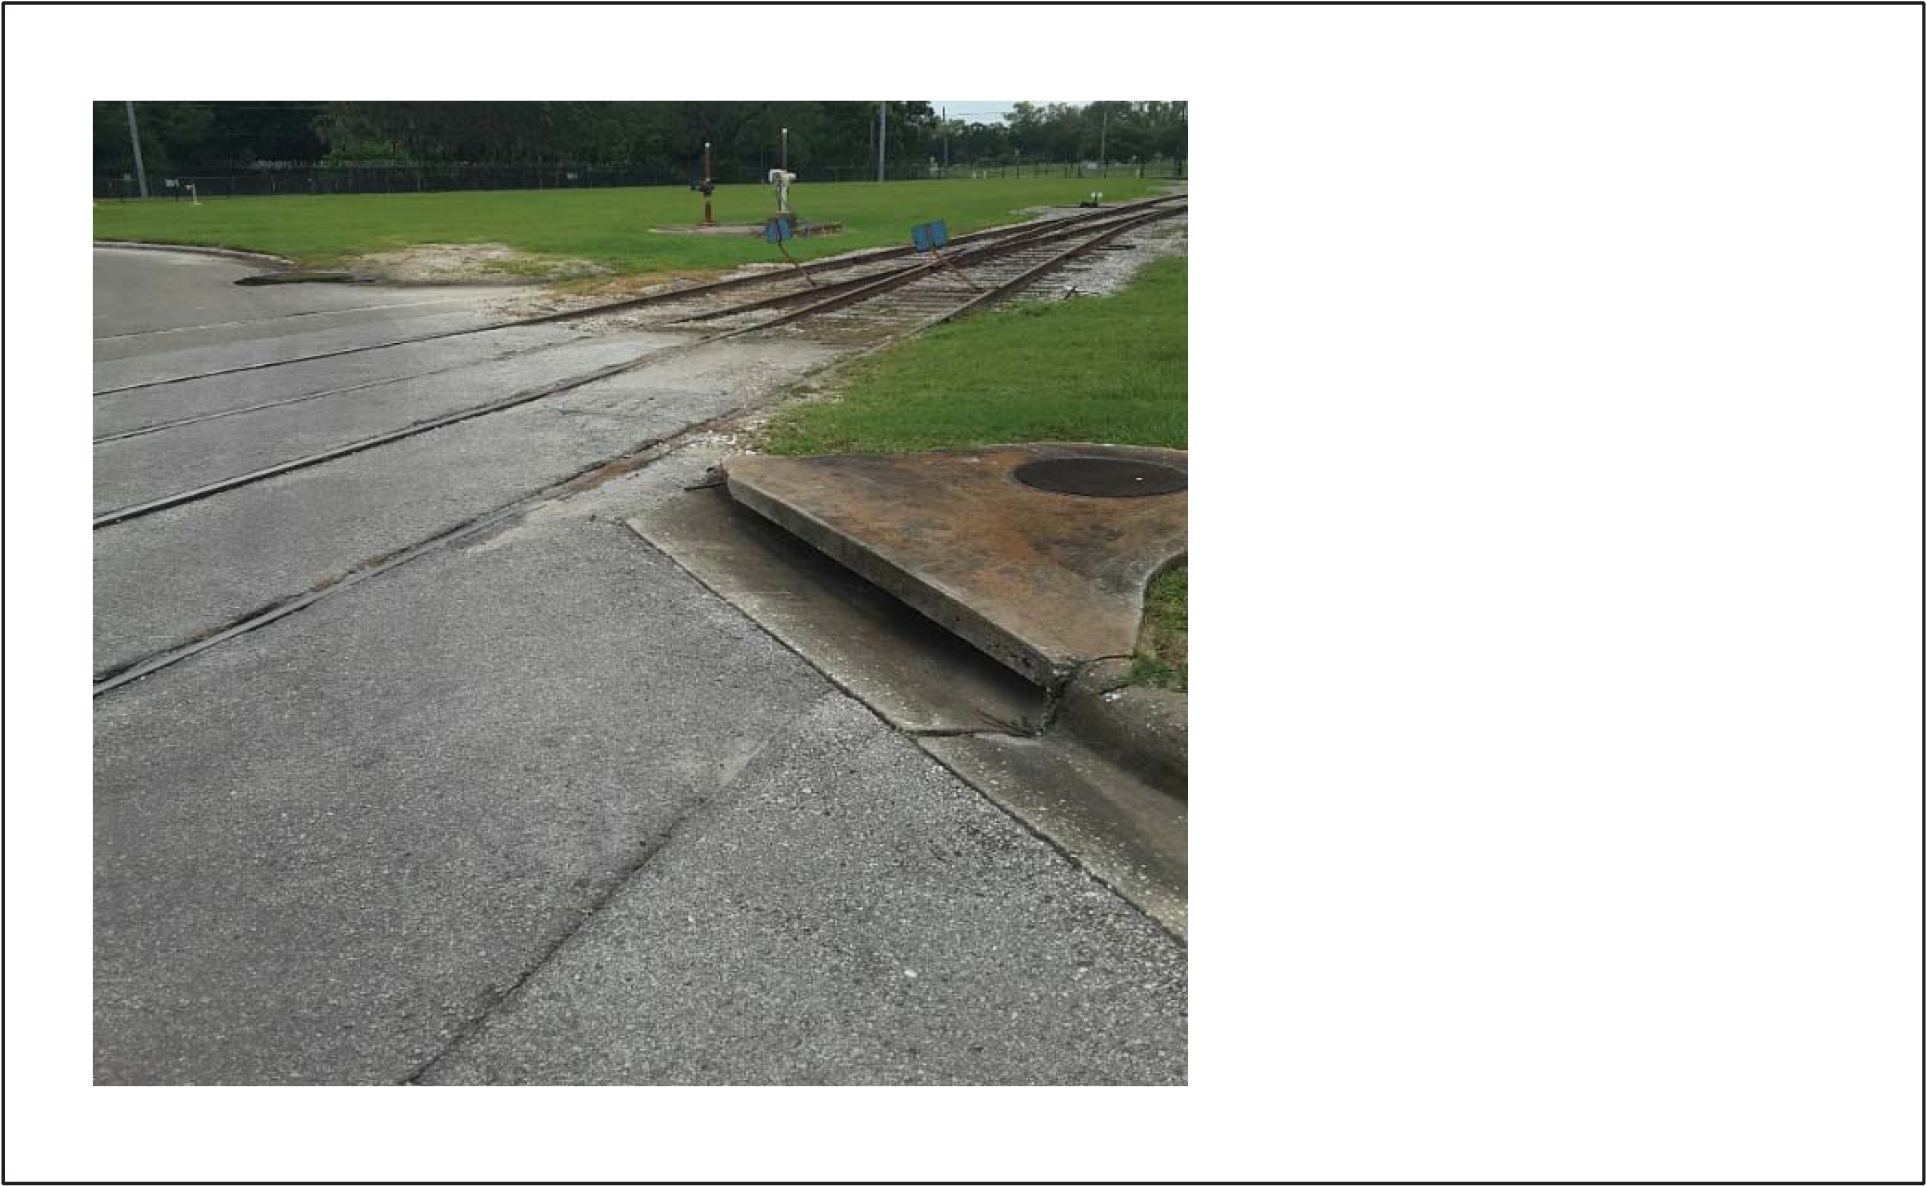
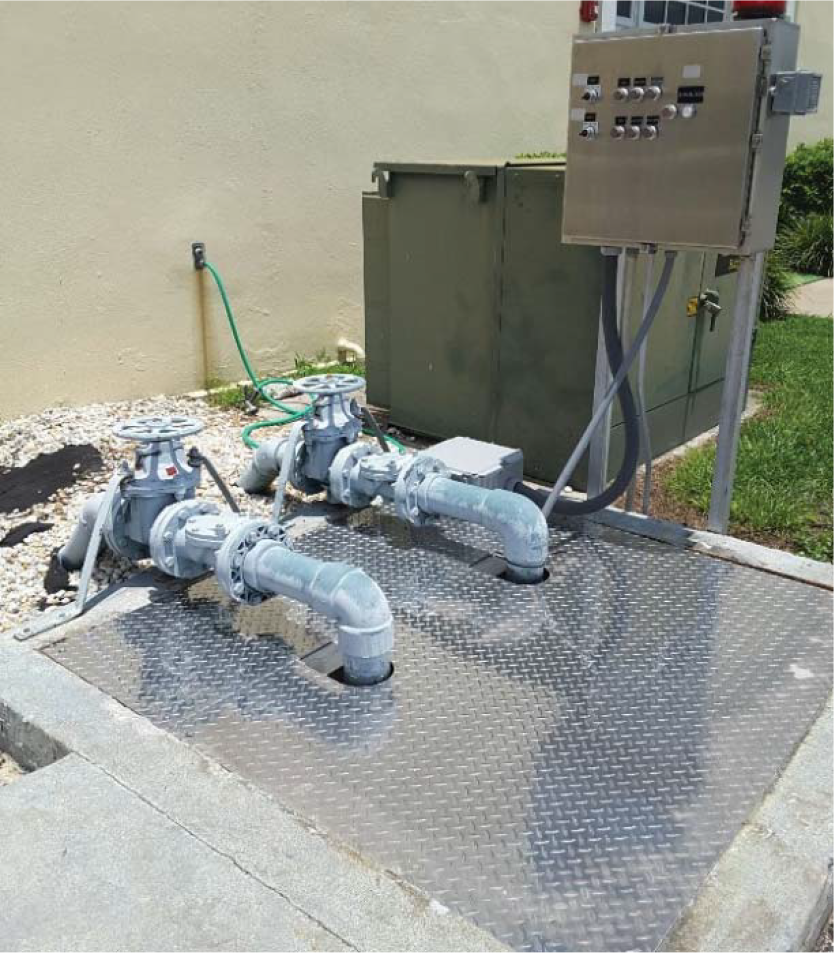
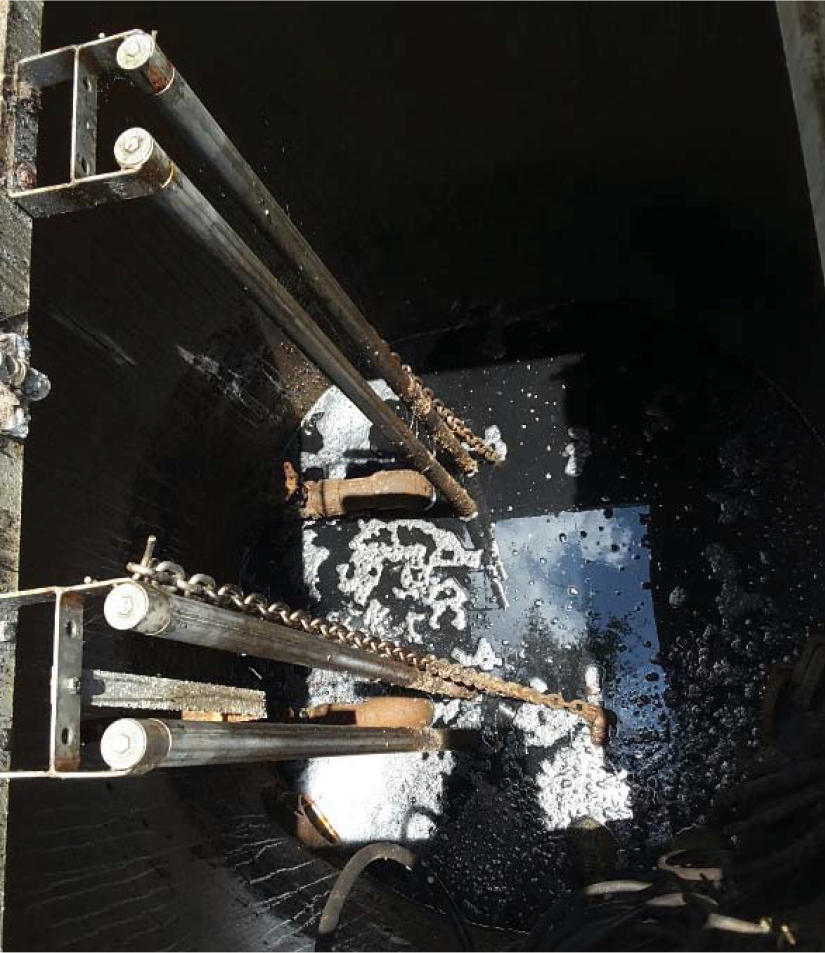
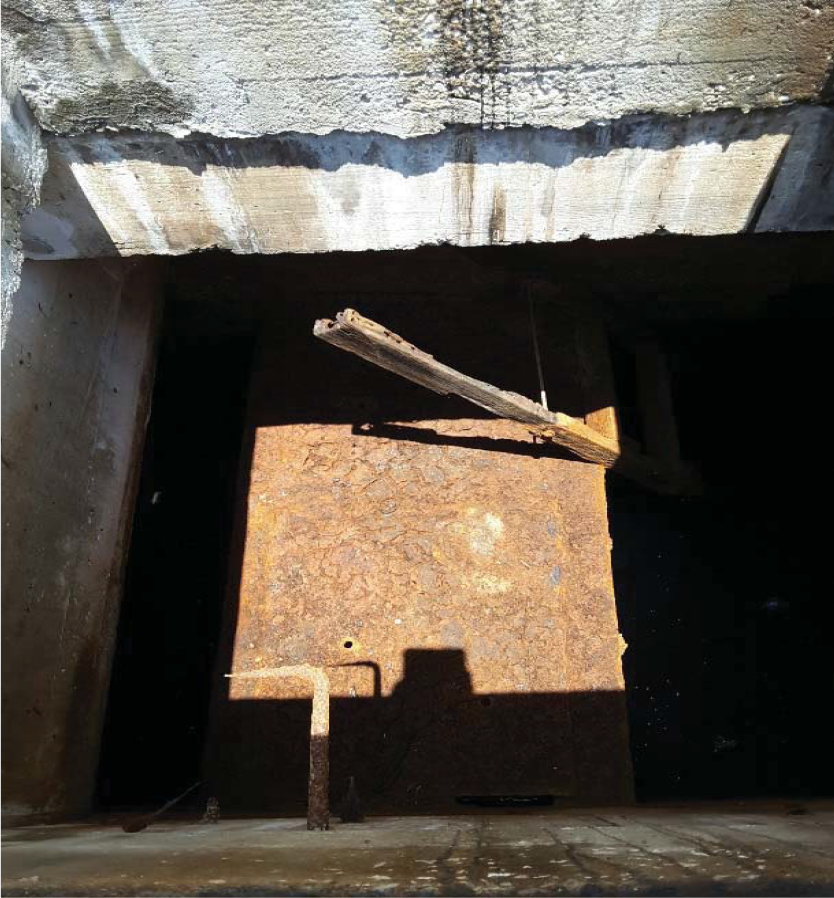
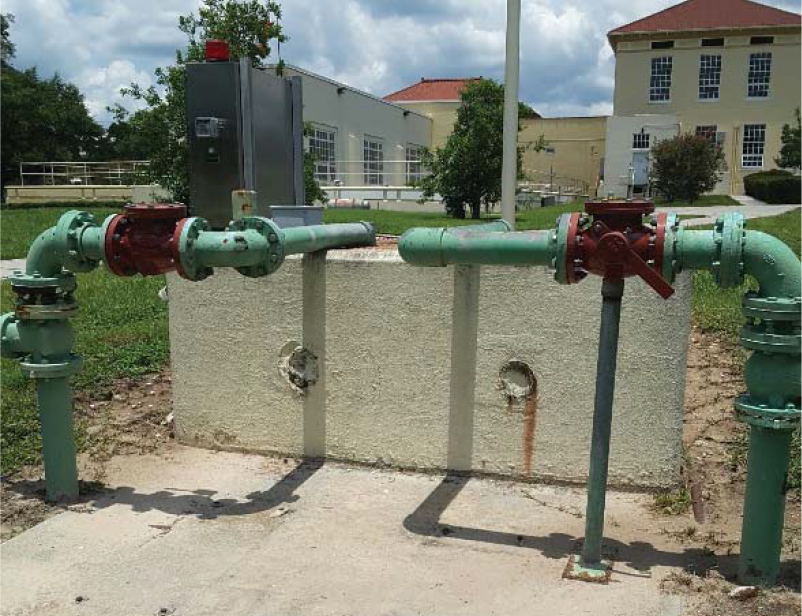
2.5 RECOMMENDATIONS AND ASSET REPLACEMENT TIMING
After the assets were rated for condition and criticality, they were organized and ranked according to their calculated risk and EvRUL. The highest ranked assets are recommended for rehabilitation or replacement in the 15-year planning horizon.
Specific recommendations for each DLTWTF building are included in subsequent sections and are organized and presented by discipline (mechanical, structural, and electrical). Recommendations for the three major pump stations are also included.
Assets with a risk score higher than 1.0 or an EvRUL of less than 15 years were recommended for replacement or rehabilitation. If an item is high-risk and needs to be replaced but is part of an ongoing project, no recommendations for it were made in this assessment.
Additionally, recommendations for asset replacement, repair, decommissioning or the like, are included in Chapters 3, 4, and 5 and satisfy the DLTWTF’s needs with respect to hydraulics, process performance, and/or facility expansion. Chapter 9 groups projects according to their scope and replacement timing to provide a streamlined CIP with more uniform expenditures each year. The 15-year CIP incorporates and considers the results and recommendations of each Chapter's evaluation.
Appendix A lists all asset condition scores, criticality scores, EvRULs, and calculated risks.
2.5.1 Mechanical Assets
The DLTWTF's mechanical assets were evaluated and assigned condition and criticality scores. Much of the equipment has been rebuilt since installation, and most assets were in fair or good condition. Table 2.44 outlines the mechanical assets that are recommended for rehabilitation or replacement within the 15-year master plan. Additional recommendations were made for assets that could not be accessed during the field assessment but require attention within the 15-year planning horizon. Recommendations are as follows:
- Investigate the internal condition of the raw water DI pipe into the Actiflo™ system because sulfuric acid is being added at these locations.
- Investigate the interior condition of the Actiflo™ sludge piping because of the sludge's low pH and the aggressive nature of sand. Annual monitoring with ultrasonic technology is needed to determine if pipe replacement is necessary.
- Investigate on-site buried yard piping, force mains, and lift stations to determine interior condition.
Table 2.44 Asset Condition, Recommendation, and Timing for Mechanical Assets
| Asset Description | Condition | Criticality | EvRUL | Risk | Recommendation | Target Project Year(1) |
|---|---|---|---|---|---|---|
| Lightning Rods (Located on Top of Ozone Contactors) | fair | fatal | 10 | 1.00 | Install protective caps atop rods until rods are re-mounted to safer locations | 2018 |
| Ozone Generator #1 and #2 Equipment and PSU HVAC System | fair | Moderate | 10 | 0.60 | Replace at time of PSU and Generator Shell Replacement | 2018 |
| Ozone Generator Room Exhaust Fans | very poor | Moderate | 2 | 3.00 | Replace with new | 2018 |
| Actiflo™ Coagulation Tank Mixers 1 and 2 | very poor | Moderator | 2 | 3.00 | Install new Coagulation tank mixers | 2019 |
| Ferric Sulfate Process Piping | very poor | Moderate | 4 | 3.00 | Replace piping associated with ferric chemical system within chemical trenches | 2019 |
| Actiflo™ Maturation Tank Mixer # 2 | poor | Severe | 4 | 2.00 | Rebuild or replace gearbox | 2019 |
| Chlorine Ventilation Fans | poor | moderate | 4 | 1.50 | Replace with new | 2019 |
| Ozone Chillers #1 and #2 | poor | Moderate | 4 | 1.50 | Replace with new | 2019 |
| Ozone Destruct System | fair | Minor | 7.5 | 0.60 | Replace inlet valves on ozone destruct units 1 and 3, in conjunction with electrical replacements | 2019 |
| Actiflo™ Settling Tank Scrapers #1 and #2 | fair | Severe | 10 | 0.80 | Evaluate condition of blades with consideration of torque, noise and any corrosion | 2025 |
| Intake Bar Rack and Grass Rake Equipment | poor | Moderate | 4 | 1.50 | Replace with new automated intake bar rack and grass rake system | 2020 |
| Low Lift Pump Station Butterfly Valves & Shafts | poor | Moderate | 4 | 1.50 | Replace existing butterfly valve shafts with new actuation device or new valve type in low lift station basin | 2022 |
| Filter Gallery Exhaust Fans | poor | No Impact | 6 | 0.50 | Replace with new | 2022 |
| Filter backwash pumps associated piping and valves | poor | Moderate | 7 | 1.50 | Consider replacement of tilting disc valve with alternative valve | 2022 |
| Ozone Diffusers | fair | Minor | 10 | 0.60 | Replace diffusers with gasketless type | 2022 |
| Filter Underdrain IMS Caps | Unknown | Inspect condition of underdrain to determine if replacement is needed | 2023 | |||
| High Service Pump #2 Ball Valve | poor | Minor | 7 | 1.00 | Repaint and re-service of actuator not required based on new high service pump station implementation | 2023 |
| High Service Pump #6 Ball Valve | poor | Minor | 7 | 1.00 | Repair/Replace not required based on new high service pump station implementation | 2023 |
| Raw Water Pumps #6-9 Check Valves | poor | Minor | 7 | 1.00 | Replace with new swing type check valve at time of pump replacement | 2023 |
| Sludge Piping (Exterior) | poor | Moderate | 8 | 1.50 | Sand/water blast and repaint | 2024 |
| Filtration System Piping located in Filter Gallery | poor | Minor | 8 | 1.00 | Sand/water blast and repaint | 2024 |
| Settled Water Junction Box Gates | fair | Fatal | 10 | 1.00 | Inspect condition of gates and replace with new if required | 2025 |
| Chemical Yard Piping | fair | Severe | 10 | 0.80 | Replace deteriorated piping with new as needed, yearly (with the exception of piping replaced in years 0-8) | 2025-2032 |
| Actiflo™ Injection Tank Mixer #1 | fair | Severe | 10 | 0.80 | Evaluate condition of mixer blade to determine replacement. Replace motor and supporting appurtenances. | 2025 |
| Dry Polymer Feed System #1 and #2 | fair | Moderate | 10 | 0.60 | Re-design or repair/rehabilitation dry polymer feed system | 2025 |
| Asset Description | Condition | Criticality | EvRUL | Risk | Recommendation | Target Project Year(1) |
|---|---|---|---|---|---|---|
| Filter Backwash Air Scour Blowers #1 and #2 | fair | Moderate | 10 | 0.60 | Replace with new | 2026 |
| Gravity Thickener #1 and #2 Clarifier Mechanisms | fair | Moderate | 10 | 0.60 | Rebuild gearboxes and/or motors | 2026 |
| Gravity Thickener Sludge Pumps #1 and #2 | fair | Moderate | 10 | 0.60 | Evaluate internal condition and replace or rebuild accordingly. | 2026 |
| Surge Tank Pump #3 | fair | Moderate | 10 | 0.60 | Evaluate internal condition and replace or rebuild accordingly. | 2026 |
| Actiflo™ Sand Pumps #1-8 | fair | Minor | 10 | 0.40 | Evaluate internal condition and replace or rebuild accordingly. | 2026 |
| Caustic Tank Containment Heaters | fair | Minor | 10 | 0.40 | Replace with new | 2026 |
| Chlorinators #5 and #6, | fair | Minor | 10 | 0.40 | Replacement not required if new on-site generation system is implemented | 2026 |
| Chlorine Booster Pump, Hydrogen Peroxide Feed Pumps, Lime Slurry Discharge Pump, Polymer Booster Pump | fair | Minor | 10 | 0.40 | Replace with new | 2026 |
| Ozone Nitrogen Boost System Equipment | fair | Minor | 10 | 0.40 | Replace with new | 2027 |
| Surge Tank Recirculating Water Jets | fair | Minor | 10 | 0.40 | Evaluate condition of jets with consideration of torque, efficiency, noise and any corrosion. Replace or rebuild motor accordingly if new mixers are not installed via recommendations from Chapter 3 or 5. | 2027 |
| Flocculators 5-1 through 8-4 | fair | Minor | 10 | 0.40 | Replace based on recommendations from Chapter 5. | 2027 |
| Actiflo™ Maturation Tank Mixer #1 | good | Severe | 14 | 0.57 | Evaluate condition of mixer blade to determine replacement. Replace motor and supporting appurtenances. | 2028 |
| Actiflo™ Injection Tank Mixer #2 | good | Severe | 14 | 0.57 | Evaluate condition of mixer blade to determine replacement. Replace motor and supporting appurtenances. | 2028 |
| Filter Backwash Pumps #1 and #2 | good | Moderate | 14 | 0.43 | Evaluate internal condition and replace or rebuild accordingly | 2029 |
| Gravity Thickener Sludge Gates | good | Moderate | 14 | 0.43 | Evaluate condition of gates and replace if required | 2029 |
| Basin Sludge Transfer Pumps #1-4 | good | Moderate | 14 | 0.43 | Evaluate internal condition and replace or rebuild accordingly | 2030 |
| Gravity Thickener Sludge Pumps #3, Surge Tank Pumps #1 and #2 | good | Moderate | 14 | 0.43 | Evaluate internal condition and replace or rebuild accordingly | 2030 |
| Ferric Feed Pumps, Sulfuric Acid Feed Pumps | good | Minor | 14 | 0.29 | Replace with new | 2030 |
| Ozone Destruct System Off Gas Blowers | good | Minor | 14 | 0.29 | Replace with new | 2031 |
| Surge Tank Valves | fair | Moderate | 17.5 | 0.60 | Replace with new | 2032 |
| High Service Pumps #1-4 Discharge and Suction Piping | fair | Moderate | 20 | 0.60 | Sandblast piping and repair/replacement not required based on new high service pump station implementation | 2032 |
2.5.2 Electrical Assets
The DLTWTF's electrical assets were evaluated and assigned condition and criticality scores. Much of the equipment ranges from poor to good condition.
As previously stated, the DLTWTF's utility power switchgears and emergency power generation systems are in good condition and do not require rehabilitation or replacement in the next 15 years. The only exception is the PanelView, which is out of service, however the City has since noted that this equipment is not necessary for operation so no recommendation will be made.
Cleaning, washing, and replacing renewal parts (gaskets, oil, etc.) for the DLTWTF's fifteen pad-mounted transformers is recommended to continue in the City's preventative maintenance program to help prevent failures or leaks. Replacing the 240V transformers (120/240V, 3 phase, 4 wire) with the more standard wye configuration with 120/208V, 3 phase, 4 wire is also recommended in the next 5 years. Specifically, transformers TRA02-1, TRA03-1, TRA06-1, TRA07-1, TRC02-1, TRC03-1, TRC07-1 and TRC08-1 should be replaced. Transformers TRA03-1 and TRC03-1, associated with the Chemical Building should be replaced when the Chemical Building MCC is replaced.
The pumps' electrical components should be replaced when the pump is replaced, as detailed in Section 2.5.5. Table 2.45 outlines the electrical assets that should be rehabilitated or replaced within the 15-year master plan.
2.5.3 Structural Assets
The structures plant-wide vary greatly in age and condition ranging from the 1920's to the 2000's and very poor to very good condition.
Table 2.46 outlines the structural assets that include a recommendation for rehabilitation or replacement within the 15-year master plan.
2.5.4 Buildings
The DLTWTF building systems were evaluated for the condition of their superstructure, electrical systems, lighting, HVAC, and lavatories (where applicable). The buildings ranged in age from original plant construction (1920s) to the early 2000's with a majority of buildings being renovated. Overall the buildings were in fair to good condition with the exception of the Accelator, Limehouse, and Maintenance Building Smoke Stack.
In general, it is recommended to replace and repair the barrel tiled roofed buildings, as needed, annually if not already done.
Table 2.47 outlines the buildings' assets (including superstructures, electrical systems, and mechanical systems) and includes a recommendation for rehabilitation or replacement within the 15-year master plan.
| Asset Description | Condition | Criticality | EvRUL | Risk | Recommendation | Target Project Year(1) |
|---|---|---|---|---|---|---|
| Ozone Generation System PSUs | poor | Severe | 4 | 2.00 | Replace both PSUs and ozone generators with new (competitive bid) | 2018 |
| High Service Pump #6 | good | Minor | 21 | 0.29 | Replacement of existing actuation device on the transformer for High Service Pump #6 not necessary if new high service pump station is implemented | 2018 |
| Lowlift Pump #1 and #4 | very poor | Minor | 3 | 2.00 | Replace VFDs (replace VFD on Pump 3 in conjunction with pump rehabilitation or replacement) | 2018 |
| High Service Pumps #2 and #3 | very poor | Minor | 3 | 2.00 | Replacement of Starter with Reduced Voltage Starter not necessary if new high service pump station is implemented | 2020 |
| Ozone Destruct Units Electrical | good | minor | 21 | 0.43 | Replace Watlow single loop controllers for ozone destruct unit preheaters and Replace valve actuators on Units #1 and #3 | 2020 |
| Pad Mounted Transformers (14) | poor | Severe | 6 | 2.00 | No capital improvement recommendations, only to maintain preventative maintenance (clean and replace renewal parts (gaskets, oil, etc.) to prevent failures or leaks) | NA |
| Actiflo™ Settling Tank Scrapers #1 and #2 | poor | Severe | 6 | 2.00 | Replace VFDs | 2020 |
| Basin 5 & 6 and 7 & 8 Bridges | poor | Moderate | 6 | 1.50 | Replace both Sedimentation Basin Sludge Collection Bridge cable reels with new type of sludge collection technology | 2023 |
| Raw Water Pumps #6 and #7 Electrical Starters | poor | Minor | 6 | 1.00 | Replace starter with Reduced Voltage Starter at time of pump rehabilitation or replacement | 2021-2023 |
| Raw Water Pumps #1, 4, and 5 Electrical Drives | poor | Minor | 6 | 1.00 | Replace switchgears and starters when new switchgear building is complete and at time of pump rehabilitation or replacement | 2021-2023 |
| Transformers TRA02-1, TRA03-1, TRA06-1, TRA07-1, TRC02-1, TRC03-1, TRC07-1 and TRC08-1. | fair | Severe | 15 | 0.8 | Replace the 240V (120/240V, 3 phase, 4 wire) transformers with the more standard wye configuration with 120/208V, 3 phase, 4 wire. | 2023 |
| Lowlift Pump #2 | fair | minor | 15 | 0.40 | Replace Auto-Transformer at time of pump rehabilitation or replacement | 2023 |
| High Service Pump #6 | good | Minor | 21 | 0.29 | Replacement of existing actuation device on the transformer for High Service Pump #6 not necessary if new high service pump station is implemented | 2018 |
| Actiflo™ Sand Pumps | fair | Minor | 15 | 0.40 | Replace at time of pump rehabilitation or replacement | 2026 |
| Lowlift Pump #3 | fair | minor | 15 | 0.40 | Replace Auto-Transformer at time of pump rehabilitation or replacement | 2029 |
Table 2.46 Asset Condition, Recommendation, and Timing for Structural Assets
| Asset Description | Condition | Criticality | EvRUL | Risk | Recommendation | Target Project Year(1) |
|---|---|---|---|---|---|---|
| Ferric Tank 2 Structure | poor | Moderate | 5 | 1.50 | Sandblast and repaint tank and replace steel anchor bolts at concrete pad if not already being completed as a part of the 'Ferric and Acid Tank Rehabilitation' project currently in place. | 2020 |
| Gravity Thickener Rake Arms and Steel Cross Members | poor | Moderate | 5 | 1.50 | Sand blast and recoat steel rake arms systems and replace select members and hard ware that are significant corroded and unable to restore by sand blasting | 2020 |
| Ozone Generators #1 and #2 Shells | fair | Moderate | 12.5 | 0.60 | Replace with new at time of ozone system replacement | $0 |
| Blending Chamber & Hawkey Box Structures | poor | Fatal | 10 | 2.50 | See Chapters 4 and 5 for recommendations | $0 |
| Filtered Water Flume Structures | poor | Severe | 10 | 2.00 | Reline and/or repair filtered water flume | 2020 |
| Intake Bar Rack and Grass Rake Structures | fair | Moderate | 12.5 | 0.60 | Replace with new stainless steel bar rack at time of equipment replacement, Replace grass rake rail system, and replace anchor bolts with stainless steel. | 2020 |
| Ozone Contactors #1 and #2 Interior | poor | Moderate | 10 | 1.50 | Sand blast, structurally repair with shotcrete, and repaint interior of both ozone contactors | 2021 |
| Liquid Oxygen Vaporizers | fair | No Impact | 12.5 | 0.20 | Clean steel with power tools and wire brush, and repaint corroded steel members. Re-inspect steel members every 3-5 years and repaint accordingly. | 2021, 2025, and 2029 |
| Raw Water Pump Metal Electrical Enclosure | fair | Severe | 12.5 | 0.80 | Replace with new masonry/concrete building appropriate for housing the raw water pump electrical equipment | 2021 |
| Caustic Tanks #1-3 | fair | Severe | 12.5 | 0.80 | Drain and evaluate steel tanks to determine interior condition for spalling and/or cracks. Rehabilitate or replace accordingly. | 2022 |
| Ozone Liquid Oxygen Tanks and Containment Area | fair | Moderate | 12.5 | 0.60 | Wire brush and recoat areas where coating failure has occurred at base of tanks, and repair spalled concrete. | 2022 |
| Actiflo™ Sand Silo and Tank | fair | Moderate | 12.5 | 0.60 | Wirebrush and recoat areas where coating failure has occurred within structure. | 2022 |
| Basin 5 & 6 and 7 & 8 Bridge Structures | fair | Moderate | 12.5 | 0.60 | Replace with new sludge collection mechanism, either chain and flight or scraper type | 2022 |
| Ammonia Tanks #1 and #2 | fair | Moderate | 12.5 | 0.60 | Chip out loose concrete, protect, seal, and pour new concrete where spalling has occurred. Reevaluate Tanks at year 15 to determine if replacement is needed. | 2024 , 2032 |
| Ferric Tanks #1 and #3 | fair | Moderate | 12.5 | 0.60 | Sandblast and repaint tank and replace steel anchor bolts at concrete pad if not already completed as a part of the 'Ferric and Acid Tank Rehabilitation' project currently in place. | 2025 |
| Hydrogen Peroxide Tanks #1 and #2 | fair | Moderate | 12.5 | 0.60 | Re-evaluate structural condition of FRP tanks and replace if needed | 2026 |
| Polymer Tanks #1 and #2 | fair | Moderate | 12.5 | 0.60 | Re-evaluate structural condition of FRP tanks and replace if needed | 2026 |
| Sulfuric Acid Tank #1 | fair | Moderate | 12.5 | 0.60 | Re-evaluate structural condition of steel tanks and replace if not already addressed as a part of the 'Ferric and Acid Tank Rehabilitation' project currently in place. | 2026 |
| Hydrocyclone Structures #1 and 2 | fair | Minor | 12.5 | 0.40 | Replace with new | 2027 |
| Dry Polymer Bins #1 and #2 | fair | Minor | 12.5 | 0.40 | Re-evaluate structural condition of FRP tanks and replace if needed | 2027 |
| Carbon Silo | fair | No Impact | 12.5 | 0.20 | Demolish and remove | 2027 |
| Low Lift Pump Station Basin | fair | Fatal | 25 | 1.00 | Pressure inject Sikadur35 into crack in center wall of pump station basin | 2032 |
| Settled Water Junction Box | fair | Fatal | 25 | 1.00 | Pressure inject Sikadur35 into crack in center wall of pump station basin | 2032 |
| Actiflo™ Train #2 Structure | fair | Moderate | 25 | 0.60 | Pressure inject Sikadur35 into crack in top slab | 2032 |
| Sulfuric Acid Unloading and Containment | fair | Moderate | 25 | 0.60 | Patch areas where concrete spalling has occurred | 2032 |
Table 2.47 Asset Condition, Recommendation, and Timing for Buildings
David L. Tippin Water Treatment Facility Master Plan
City of Tampa
| Asset Description | Condition | Criticality | EvRUL | Risk | Recommendation | Target Project Year(1) |
|---|---|---|---|---|---|---|
| Chemical Building Electrical | very poor | Severe | 3 | 4.00 | Replace MCC that was damaged from Chlorine Leak in conjunction with their respective transformer replacement | 2018 |
| Maintenance Building Smoke Stack Structure | very poor | Moderate | 5 | 3.00 | Continue to complete interior and exterior survey to determine if spiraling dowels and/or additional banding is necessary every 5 years and make repairs as necessary | 2018 |
| Old Raw Water Pump Building Structure | fair | Severe | 25 | 0.80 | If not demolished for new boat storage facility, replace the roof and decking systems to stabilize the building and halt further deterioration. (matching replacement of the existing clay barrel tile roof system and wood deck) | 2019 |
| Old Raw Water Pump Building Electrical and Lighting | very poor | No Impact | 3 | 1.00 | Replace outdated light fixtures with new LED lighting, if not already addressed in currently building rehabilitation project. | 2019 |
| Administration & Filter Gallery Building Electrical | poor | Fatal | 6 | 2.50 | Replace existing electrical power/lighting panel boards. | 2019 |
| Filter Building & Gallery Electrical | poor | Moderate | 6 | 1.50 | The 35 kW generator for the filtration system is not routinely operated under load so testing under load bank would be recommended. | 2019 |
| Remote High Service Pump Building Electrical | poor | Moderate | 6 | 1.50 | Replace panel boards | 2020 |
| Raw Water Pump Switchgear Metal Enclosure | fair | Severe | 12.5 | 0.80 | Replace with new masonry/concrete building appropriate for housing the raw water pump electrical equipment | 2021 |
| Accelator Building Structure | poor | Moderate | 10 | 1.50 | Complete interior and exterior survey to determine if additional structural modifications are needed prior to building renovation if not included in the SCADA System Replacement Project. | 2021 |
| High Service and Lower Floor Pump Room Building Lower Level Lavatory & Potable Water System | poor | Minor | 6 | 1.00 | Renovate at time of building renovation | - |
| Basin Control Building Lighting & Electrical | poor | Minor | 6 | 1.00 | Replace lighting in Basin Control Building with LED type and provide convenience and task receptacles. Replace MCC-S and replace lighting transformer within building. | 2021 |
| Lab Building Lighting and Electrical | poor | Minor | 6 | 1.00 | Replace main panel (PP1) and replace outdated light fixtures with LED | 2022 |
| Remote High Service Pump Building Structure | fair | Moderate | 25 | 0.60 | Replace Flat Roof and inject areas where concrete cracking has occurred in southeast wall | 2022 |
| Remote High Service Pump Building Lighting | poor | Minor | 6 | 1.00 | Replace interior lighting and switches with new LED lighting | 2022 |
| Maintenance Building Electrical and Lighting | poor | No Impact | 6 | 0.50 | The light fixtures should be replaced at the first floor when scheduled for renovation. | 2022 |
| Material Storage Building Electrical and Lighting | poor | No Impact | 6 | 0.50 | Replace the Material storage facility and building exterior attached light fixtures, interior light fixtures, and light switches/controls. | 2022 |
| Utility Building Electrical and Lighting | poor | No Impact | 6 | 0.50 | Rehabilitate or replace electrical panel boards, and replace lighting | 2023 |
| Accelator Building Electrical | poor | No Impact | 6 | 0.50 | Replace at time of building renovation | - |
| Lime House Structure | poor | Moderate | 10 | 1.50 | Repair spalled concrete and remove lime build-up to inspect steel members to determine if replacement or repair is needed | 2023 |
| Ozone Building HVAC | fair | Moderate | 15 | 0.60 | Replace with new | 2029 |
| Ozone Building Lighting | fair | Moderate | 15 | 0.60 | Replace with new | 2029 |
Table 2.47 Asset Condition, Recommendation, and Timing for Buildings (cont.)
David L. Tippin Water Treatment Facility Master Plan
City of Tampa
| Asset Description | Condition | Criticality | EvRUL | Risk | Recommendation | Target Project Year(1) |
|---|---|---|---|---|---|---|
| High Service and Lower Floor Pump Room Building Exhaust Fans | fair | Minor | 15 | 0.40 | Replace with new if not addressed in current project | 2029 |
| Lab Building Lavatory and Potable Water System | fair | Minor | 15 | 0.40 | Renovate | 2029 |
| Polymer Building Electrical and Lighting | good | Moderate | 21 | 0.43 | Replace the polymer building's exterior attached light fixtures, interior light fixtures, and light switches/controls are that are in fair condition | 2030 |
| Part Building Lighting and Electrical | fair | No Impact | 15 | 0.20 | Reconfigure interior lighting in Parts Building to match shelving arrangement | 2031 |
| Chemical Building HVAC | fair | No Impact | 15 | 0.20 | Replace with new | 2032 |
| Maintenance Building HVAC | fair | No Impact | 15 | 0.20 | Replace with new | 2032 |
| Utility Building Lavatory | fair | No Impact | 15 | 0.20 | Renovate | 2032 |
| Accelator Building Lighting | fair | No Impact | 15 | 0.20 | Replace at time of building renovation | $0 |
| Filter Building Gallery Interior Structure | fair | Severe | 25 | 0.80 | Any loose concrete is recommended to be removed. Corroded reinforcing should be cleaned and or replaced and the concrete should be patched with new concrete. | $0 |
(1) The target project year only considers the condition assessment. The project implementation CIP incorporates the and economic asset feasibility. condition as well as the results and recommendations from the process and hydraulic evaluations. Additionally, projects will be consolidated and organized in Chapter 9 according to
Notes:
2.5.5 Pump Stations
Three major pump systems were evaluated for this assessment, including the raw water pump stations, high service pump stations, and low life pump stations. Each pump was assessed for its age, time since last rebuild, vibration, efficiency, condition, and criticality. Using the calculated overall score for each pump, Table 2.48 shows the overall condition and master plan year in which repair or replacement should occur.
| Asset Description | Overall Condition | Target Project Year(2) |
|---|---|---|
| High Service Pump #7 | 3.50(1) | 2018 |
| Low Lift Pump #1 | 3.00(1) | 2018 |
| High Service Pump #6 | 4.00 | 2018 |
| High Service Pump #5 | 3.60 | 2019 |
| Raw Water Pump #3 | 3.35 | 2019 |
| High Service Pump #3 | 3.30 | 2020 |
| High Service Pump #4 | 3.30 | 2020 |
| High Service Pump #2 | 3.10 | 2020 |
| Raw Water Pump #1 | 3.00 | 2021 |
| Raw Water Pump #9 | 2.95 | 2021 |
| Raw Water Pump #6 | 2.80 | 2021 |
| High Service Pump #1 | 2.80 | 2022 |
| Raw Water Pump #4 | 2.70 | 2023 |
| Raw Water Pump #8 | 2.65 | 2023 |
| Raw Water Pump #5 | 2.55 | 2023 |
| Raw Water Pump #7 | 2.50 | 2023 |
| Raw Water Pump #2 | 2.45 | 2023 |
| Low Lift Pump #2 | 2.45 | 2025 |
| High Service Pump #8 | 2.30 | 2025 |
| Low Lift Pump #5 | 1.95 | 2029 |
| Low Lift Pump #6 | 1.95 | 2029 |
| Low Lift Pump #3 | 1.8 | 2029 |
| Low Lift Pump #4 | 1.8 | 2029 |
- (1) Recent overhaul combined with severe vibration indicates immediate maintenance or replacement is recommended.
- (2) The target project year considers only the condition assessment. The 15-year CIP incorporates the asset condition and the results and recommendations from the process and hydraulic evaluations. Additionally, projects are consolidated and organized in the 15-year CIP according to project implementation and economic feasibility.
As stated in Section 2.4.9, each pump project should include a final determination of the most economical path forward (repair or replacement) and operational improvements (such as adding VFDs).
The CIP includes a more economically feasible approach to evaluations and replacements for each pump station. The CIP includes the recommendation to address the Raw Water and High Service Pump Stations within 7 years and the Low Lift Pump Station within 15 years.
2.6 SUMMARY AND CONCLUSIONS
Carollo Engineers performed a visual inspection of the DLTWTF to inventory above-ground assets and assess their current condition for the 15-year master plan. The assessments were recorded in the Water Research Foundation's Water Infrastructure Manager Software database using the similar nomenclature and terminology already in use. The City can utilize the access database and/or excel database generated by the software for integration into the City’s computerized maintenance management system.
Considering the assets' varied age, Carollo found the DLTWTF to be in overall fair condition given the equipment, structures, and electrical systems. The DLTWTF is very well maintained. Therefore, the decision to replace an asset was based on the condition and criticality, not strictly on age.
The timing for replacing an asset was based on the calculated EvRUL and calculated risk. Both are a function of asset condition and criticality, where EvRUL also considers the OUL of the asset.
Replacement costs are relayed in the 15-year CIP that defines each proposed project, its scope, and the year of implementation. The CIP considers the year in which the repair, replacement, or plant improvement is required to make the annual expenditures as uniform as practical without compromising plant reliability and performance.
The 15-year CIP in Chapter 9 incorporates and considers the results and recommendations of each Chapter's evaluation to determine the most appropriate 15-year master plan. If projects are already in place to address assets requiring attention, then no additional recommendations were made.
Chapter 3
PROCESS EVALUATION
3.1 CHAPTER SUMMARY
Carollo Engineers conducted a treatment process evaluation of the David L. Tippin Water Treatment Facility (DLTWTF), which included visual inspections and extensive data collection.
This chapter details the results of the unit operations and processes evaluation to determine the current process capacities. These results will help define opportunities for optimization, regulatory compliance, and expansion. As part of this evaluation, specific treatment objectives and water quality parameters were assessed, including, but not limited to, total organic carbon (TOC), color, pH, iron, and turbidity throughout the DLTWTF.
The following processes and systems were evaluated:
- Raw water intake.
- Actiflo™ treatment.
- Conventional treatment.
- Ozone.
- Filtration.
- Chemical systems.
- Solids handling and thickening.
- Finished water systems.
According to Black and Veatch, the system's water demands require the DLTWTF to produce 134 million gallons per day (mgd) by 2032, which is within this study's 15-year planning horizon. This flow rate, when accounting for in-plant uses for treated water, mandates a treatment capacity of approximately 140 mgd. Thus, this evaluation considered existing flows of 80 mgd, a current rated maximum day treatment capacity flow of 120 mgd, and a predicted future flow of 140 mgd.
This evaluation was completed while finalizing the hydraulic and condition assessment evaluations. The existing unit processes were evaluated considering flow rates that corresponded to the DLTWTF's future needs. Chapter 5 discusses alternative treatment technologies and solutions for plant optimization. However, select required recommendations, regardless of the selected alternative from Chapter 5, are discussed in this chapter.
3.2 TEN STATES STANDARDS
Carollo reviewed the Ten States Standards, as presented by the Great Lakes-Upper Mississippi River Board of State and Provincial Public Health and Environmental Managers (GLUMRB) Water Supply Committee. For each process, the evaluation considered the applicable standards shown in Appendix D. In addition to considering the Ten States Standards, industry standards and Carollo's experience in process design were considered plant-wide.
3.3 EXISTING PROCESS PERFORMANCE
An inspection and condition assessment was conducted on the DLTWTF in late June of 2016. For this assessment, the DLTWTF's treatment processes were reviewed, studied, and discussed. When available, the City's Operation and Maintenance Manuals were referenced to evaluate the existing processes. The following sections convey the DLTWTF's existing processes and their performance.
3.3.1 Plant Intake Bar Rack, Grass Rake, and Rotating Screens
3.3.1.1 Description
The intake bar rack, with 3-inch openings, captures large debris entering from the reservoir. The grass rake equipment removes this debris from the bar rack and disposes it into a hopper. After the grass rake, but before raw water pumping, the mechanical rotating screens process raw water and remove smaller debris not captured by the bar rack.
Table 3.1 presents the design information for the intake structures and equipment.
| Parameter | Value |
|---|---|
| Minimum Reservoir Level Required for Pumping | 16 |
| Intake Bar Rake Slot Opening (in.) | 3.0 |
| No. of Mechanical Screens (Duty/Standby) | 2/1 |
| Mechanical Screen Capacity | Not available |
| Mechanical Screen Type | square wire mesh |
| Mechanical Screen Slot Opening (in.) | 3/8 |
3.3.1.2 Existing Process Performance and Ability to Expand
Although this equipment serves its process purpose by removing debris, Chapter 2 noted recommendations because of its age, condition, and functionality. From the process
standpoint, these units perform their intended function. Nonetheless, the improvements described in Chapter 2 will optimize the system for enhanced operations and maintenance.
3.3.2 Actiflo™ Treatment System
3.3.2.1 Description
The raw water pumps transfer flow to the conventional treatment trains and the Actiflo™ treatment trains. The Actiflo™ system typically receives 20 to 30 mgd (approximately 20 to 30 percent of the total flow). The two treatment trains are designed to process 20 mgd each, for a total of 40 mgd.
Two 36-inch raw water lines feed into the Actiflo™ system (one line per train). Prior to the treatment process, the influent raw water is dosed in-line with sulfuric acid to lower the pH. Ferric sulfate is then introduced in-line just after sulfuric acid addition but before the injection tank. The acid and coagulant are mixed in-line via a static mixer. Polymer is also added before the maturation tank.
Table 3.2 shows information on the static mixers, including the calculated mixing energy values. Because original design information on the installed mixers was unavailable, the manufacturer drafted head loss estimates based on similarly installed units.
| Parameter | Value |
|---|---|
| Manufacturer | Koch-Glitsch |
| Model | SMV PX |
| Length per element | 15 inches |
| No. of Element | 3 |
| No. of Layers | 5 |
| Mixing Energy (per train) | |
| At 13 mgd flow | 520 sec-1 |
| At 17 mgd flow | 776 sec-1 |
| At 20 mgd flow | 989 sec-1 |
| At 25 mgd flow | 1,400 sec-1 |
| At 30 mgd flow | 1,840 sec-1 |
As the table shows, at the 20 mgd flow rate (correlating to a total plant flow of 120 mgd), the mixing energy values are within the recommended Ten States Standards value. At the 30 mgd flow for each train (140 mgd total plant flow), the mixing energy is significantly above the recommended 1,000 sec-1, and applying these flows to the Actiflo™ system is not recommended.
From the static mixers, the water flows into the main Actiflo™ unit. The unit consists of a coagulation chamber, an injection chamber, a maturation chamber, and a settling chamber. Because the static mixer is used before the Actiflo™ unit, the coagulation mixers are not in use.
After the coagulation chamber, the water enters the injection chamber, where micro-sand is added to encourage ferric hydroxide flocculation and the floc's adherence to the sand. This micro-sand is silica sand at an effective size of 130-150 microns (µm) and promotes floc formation, collisions, and high rate particle settling. The maturation tank follows the injection tank, where the water is dosed with polymer and gently mixed to achieve more floc adherence. The water then flows to the settling tank, where fully formed ballasted flocs settle out through the lamella tubes to remove suspended solids and colloidal matter.
Using solids pumps, the sand is transferred to an hydrocyclone. The solids pumps break the polymer bond holding the sand to the ferric hydroxide floc. The hydrocyclone separates the sand from the sludge so it can then be reused in the Actiflo™ process.
Table 3.3 displays the design criteria for the system.
| Parameter | Units | Value |
|---|---|---|
| No. of Treatment Trains | each | 2 |
| Design Flow (each train) | mgd | 20 |
| Maximum Flow (each train)(1) | mgd | 30 |
| Coagulation Tank Hydraulic Retention Time (HRT) at Design Flow | min | 2 |
| Injection Tank HRT at Design Flow | min | 2 |
| Maturation Tank HRT at Design Flow | min | 6 |
| System Sand Concentration | g/L | 3-6 |
| Rise Rate in Sedimentation Portion of the Actiflo™ Unit (based on 20 mgd per train) | gpm/sq ft | 25 |
| Notes: (1) The 30 mgd represents the hydraulic capacity of each Actiflo™ train; reliably processing flow rates above 20 mgd per train could result in excess sand carryover into the ozone system and could lessen the performance of the Actiflo™ system. | ||
Based on the City's sand purchased in 2015 (nearly 48,000 pounds) and assuming the Actiflo™ system (both trains combined) treats an average daily flow of 25.8 mgd, approximately 5.08 pounds of sand is lost per million gallons of Actiflo™ treated water. Per conversations with the manufacturer, any sand loss under 8.0 pounds of sand lost per million gallons treated water is acceptable.
3.3.2.2 Existing Performance and Ability to Expand
The Actiflo™ system effectively removes TOC, color, turbidity, and the other targeted contaminants in the raw water. Figure 3.1 shows the settled water TOC and compares the performance of this process with the parallel conventional treatment trains (Trains 5, 6, 7, and 8).
As the figure shows, the Actiflo™ system is marginally more efficient at removing TOC, even though the volume of the basins is much smaller (hence the advantage of the system). Since this evaluation, City staff noted that the Actiflo™ system receives an average of 40 milligrams per liter (mg/L) of additional coagulant and 0.5 mg/L of additional polymer than the conventional system, which is likely causing slightly better performance.
As noted above, the mixers in the first two stages of treatment are either non-functional or are not routinely operated. No adverse effects on treatment are observed due to the lack of mixing. Enhanced coagulation, now employed at the DLTWTF, is believed to be the reason for good performance without mixing.
At low pH (under 5.0) and as high as approximately 130 to 200 mg/L of coagulant dose, a sweep floc forms in which the particle density in suspension is so great that inter-particle collision, typically achieved by mechanical mixing, is achieved hydraulically. This sweep floc is due to the sheer volume of particles and their capacity to adsorb contaminants (such as TOC), entrain particulates, and agglomerate prior to sedimentation.
In a conventional treatment process that employs coagulant doses in the 20 mg/L to 30 mg/L range (typically at a higher pH), the first and second stage mixers function to promote inter-particle collisions and to "build" a settleable floc. Additionally, operating the Actiflo™ system at flows no greater than 40 mgd is most practical. Chapter 5 proposes possible treatment options at lower coagulant doses and establishes a potential value to restore these mixers to active service.
3.3.3 Conventional Treatment Trains
3.3.3.1 Description
The four conventional treatment trains (Trains 5, 6, 7, and 8) receive 70 to 80 percent of the total plant flow from the raw water pumps. Each of the four trains has a rated capacity of 20 mgd for a total capacity of 80 mgd. The water the conventional system receives is pH adjusted with sulfuric acid and uses ferric sulfate for coagulation and a polymer for a flocculant aid.
The raw water flows into the influent splitter box, which also acts as the rapid mix basin where ferric sulfate and sulfuric acid are dosed. Sulfuric acid is dosed at the bottom of the basin where the influent flow enters, whereas ferric sulfate is dosed mid-depth. The water then flows to the flocculation basins, where floc is formed with stainless steel, vertical, 45- or 135-degree blade angle flocculators.

As the water flows through each flocculation basin, the mixing energy decreases until it reaches the sedimentation basin, where no mixing energy is inputted. Polymer is dosed between the second and third flocculation stages to bridge the floc.
The agglomerated floc settles in the sedimentation basins, where sludge is collected via traveling bridge siphon. The traveling bridge siphon typically collects sludge in the first half of the sedimentation basin, but it runs the full length of the basins approximately once per day.
The settled water is collected using six, 18-inch diameter pipeline launders per treatment train that extend 125 feet from the end of the train toward the middle of the sedimentation basins. Each pipeline launder has 96, 2-inch orifices for laminar flow into the pipe.
The settled water is then treated with lime to increase the pH before ozonation. The lime is added in-line before the settled water is routed to the low lift pump station, where it is combined with the Actiflo™ settled water.
3.3.3.2 Assumptions
The conventional treatment facilities were evaluated with plant flows of 80, 120, and 140 million gallons per day (mgd). Assumptions were based on Carollo's understanding of the DLTWTF facilities, record drawings, and discussions with plant staff. These assumptions are as follows:
- Actiflo™ will always treat 40 mgd, and the conventional system trains will split the remainder. As a result:
- Plant flow of 80 mgd results in each conventional train treating 10 mgd (40 mgd to Actiflo™, then 40 mgd split evenly between the four conventional trains).
- Plant flow of 120 mgd results in each conventional train treating 20 mgd.
- Plant flow of 140 mgd results in each conventional train treating 25 mgd.
- A maximum water temperature of 25 degrees Celsius and a minimum water temperature of 15 degrees Celsius.
- A water surface elevation of no less than 2 feet below the top of concrete at max flow (140 mgd).
The following subsections detail the equations and design criteria that determine the existing conventional treatment system capacity.
3.3.3.2.1 Mixing Energy
Mixing energy, also called velocity gradient, is a function of the power applied to a specified volume of water at a specified temperature, with units of feet per second per foot. For rapid mix basins, the recommended mixing energy is between 600 and 1,000 seconds (sec)-1.
For flocculation basins, the recommended mixing energy is between 10 and 70 sec-1 and should decrease at each stage from rapid mix through sedimentation.
G2=P/(µ·V)
Where:
- G= Mixing intensity/mixing energy/velocity gradient (ft/sec/ft or m/sec/m)
- P= Power input (hp)
- µ=dynamic viscosity of water (0.0009 Ns/M2 at 25 degrees Celsius)
- V=Volume of Water impacted (cubic feet or m3)
Hydraulic mixing is the only mixing that occurs in the rapid mix basins at DLTWTF. Thus, to estimate the rapid mix basins' mixing energy, the area and head loss through the rapid mix from the following equation were used to calculate the subsequent horsepower:

Power (hp) = Flow (gpm)·Head loss (feet) / 3960 (HP*gpm*ft)
3.3.3.2.2 Detention Time
Detention time was calculated by dividing the volume of water in either the rapid mix, flocculation, or sedimentation basin by the flow:

DT=V/Q
Where:
- DT = detention time (min or seconds)
- V = Volume of water (gal or ft3)
- Q = Flow (gpm or cfs)
Table 3.4 shows recommended detention times.
| Process | Units | Value |
|---|---|---|
| Rapid Mix | seconds | <30 |
| Flocculation | minutes | 30≤ |
| Sedimentation | hours | 4≤ |
3.3.3.2.3 Flocculator Tip Speed
The tip speed for a flocculator impeller is:

TS = π·RPM·D
Where:
- RPM = revolutions per minutes (speed)
- D = impeller diameter
To minimize flocs shearing, recommended tip speeds are between 0.5 and 3.0 feet per second for pitched blade impellers.
3.3.3.2.4 Froude Number (Fr)
The Froude number describes the relationship between gravitational (g) and inertial (V2) forces in sedimentation basins. Higher Froude values (recommended to be greater than 10-5) typically relate to better sedimentation, since the two forces allow for sedimentation without back mixing.
Fr=V2/(g·R)
Where:
- g = gravitational constants (32.2 ft/sec2)
- R = hydraulic radius (A/P)
- A = cross-sectional area of flow passage (sf)
- P = wetted perimeter of basin (ft); wetted perimeter is the basin's width and the side water depth
- V = displacement flow velocity (ft/sec)
Displacement flow velocity is calculated by dividing the flow by the cross-sectional area of flow passage. It is also referred to as "horizontal velocity," which for sedimentation is recommended to be no more than 0.5 ft/min.
3.3.3.2.5 Reynolds Number (Re)
The dimensionless Reynolds number describes the relationship between fluid viscosity (ʋ) and inertia (VR) in sedimentation basins:

Re=V·R/ʋ
Where:
- ʋ = kinematic viscosity of water (sq ft/sec)
High Reynolds number values indicate a high degree of turbulence. Recommended values of 2,000 or less typically correspond to better sedimentation performance.
Froude and Reynolds values can be less significant if other design parameters are adequate, such as the length-to-width ratio, the overflow rate, and the detention time.
3.3.3.2.6 Surface Overflow Rate (Vo)
The surface overflow rate is a function of the sedimentation basin's flow and surface area. When also considering detention time and length to width ratio, overflow rates should be between 0.25 and 1.0 gpm/sf for efficient settling.

Vo=Q/A
Where:
- A = basin surface area of flow passage (sf)
3.3.3.2.7 Computational Fluid Dynamics Modeling
Computational fluid dynamics (CFD) modeling was conducted for the existing conventional basin configuration at 20 mgd per train. CFD modeling considers the basic principles that govern fluid flow and uses numerical techniques to quantify flow distribution and velocities throughout a model basin.
To develop the model, dimensions and specifications were based on record drawings and O&M manuals. Carollo's understanding of the rotational direction, speed, and installation angle of the flocculators were also used. To ensure the most representative model, these assumptions should be confirmed. Chapter 5 presents additional CFD modeling results.
3.3.3.3 Rapid Mix System
Like the ActifIo™ system, the mechanical rapid mixers are not in use. However, these mixers could be used again if the process changed from enhanced coagulation to conventional coagulation. Changes in coagulant doses would likely need to be accompanied with an alternative treatment technology for TOC/color reduction, which Chapter 5 discusses.
One of the rapid mix basins is for the combined flow for Trains 5 and 6 (from now on referred to as Rapid Mix Basin 1), and the other is for the combined flow for Trains 7 and 8 (Rapid Mix Basin 2). Dimensions and geometry vary between the two basins.
Table 3.5 shows the design criteria for both basins. For clarification, Figure 3.2 and Figure 3.3 show the assumed rapid mix areas and details on flow path.
| Parameter | Units | Rapid Mix Basin 1 | Rapid Mix Basin 2 |
|---|---|---|---|
| Original Design Flow | mgd | 40 | 40 |
| Total Volume | gal | 30,800 | 36,000 |
| Estimated Rapid Mix Volume | gal | 5,120 | 4,850 |
| Detention Time | sec | ||
| At 80 mgd Plant Capacity | |||
| 22.1 | 20.9 | ||
| At 120 mgd Plant Capacity | |||
| 11.1 | 10.5 | ||
| At 140 mgd Plant Capacity | |||
| 8.84 | 8.38 | ||
| Assumed Freeboard | ft | 2 | 2 |
| Mixing Energy, G | sec-1 | ||
| At 80 mgd Plant Capacity | |||
| 103 | 56.3 | ||
| At 120 mgd Plant Capacity | |||
| 300 | 169 | ||
| At 140 mgd Plant Capacity | |||
| 424 | 252 | ||
Per the Ten States Standards, rapid mixing should occur within 30 seconds and within the acceptable G value range of 600 to 1,000 sec-1. These factors at the DLTWTF are not within their limits for either rapid mix basin. Despite this, the DLTWTF still produces settleable floc and finished water with a low TOC, primarily because of the high ferric sulfate coagulant dose and low pH process water.
As with the Actiflo™ system, previous studies have shown that at ferric sulfate dosages over 100 mg/L and pH ranging from 4 to 6, coagulation performance is no longer a function of rapid mixing intensity (i.e., G value) if the coagulant is properly mixed before being split between Trains 5 and 6 and Trains 7 and 8. At pH 4.5 and a coagulant dose of up to 120 to 200 mg/L (the DLTWTF's current operating procedure), adsorption destabilization occurs. In this zone, mixing has little effect on the conventional treatment process.
Two competing reactions also occur within the rapid mix zone: charged organic particles are neutralized instead of ferric hydroxide reactions being formed with the positively charged ferric species. High-intensity mixing allows for the former reaction, while low-intensity mixing (similar to the existing conventional rapid mix basins) allows for the latter.
With high coagulant doses and low pH, negatively charged particles will be neutralized even with poor mixing. If the TOC removal approach changes and coagulant dose is lowered, high-intensity mixing would be favorable. This is because only neutralizing negatively charged particles requires a significantly lower ferric dose (or alternate coagulant).

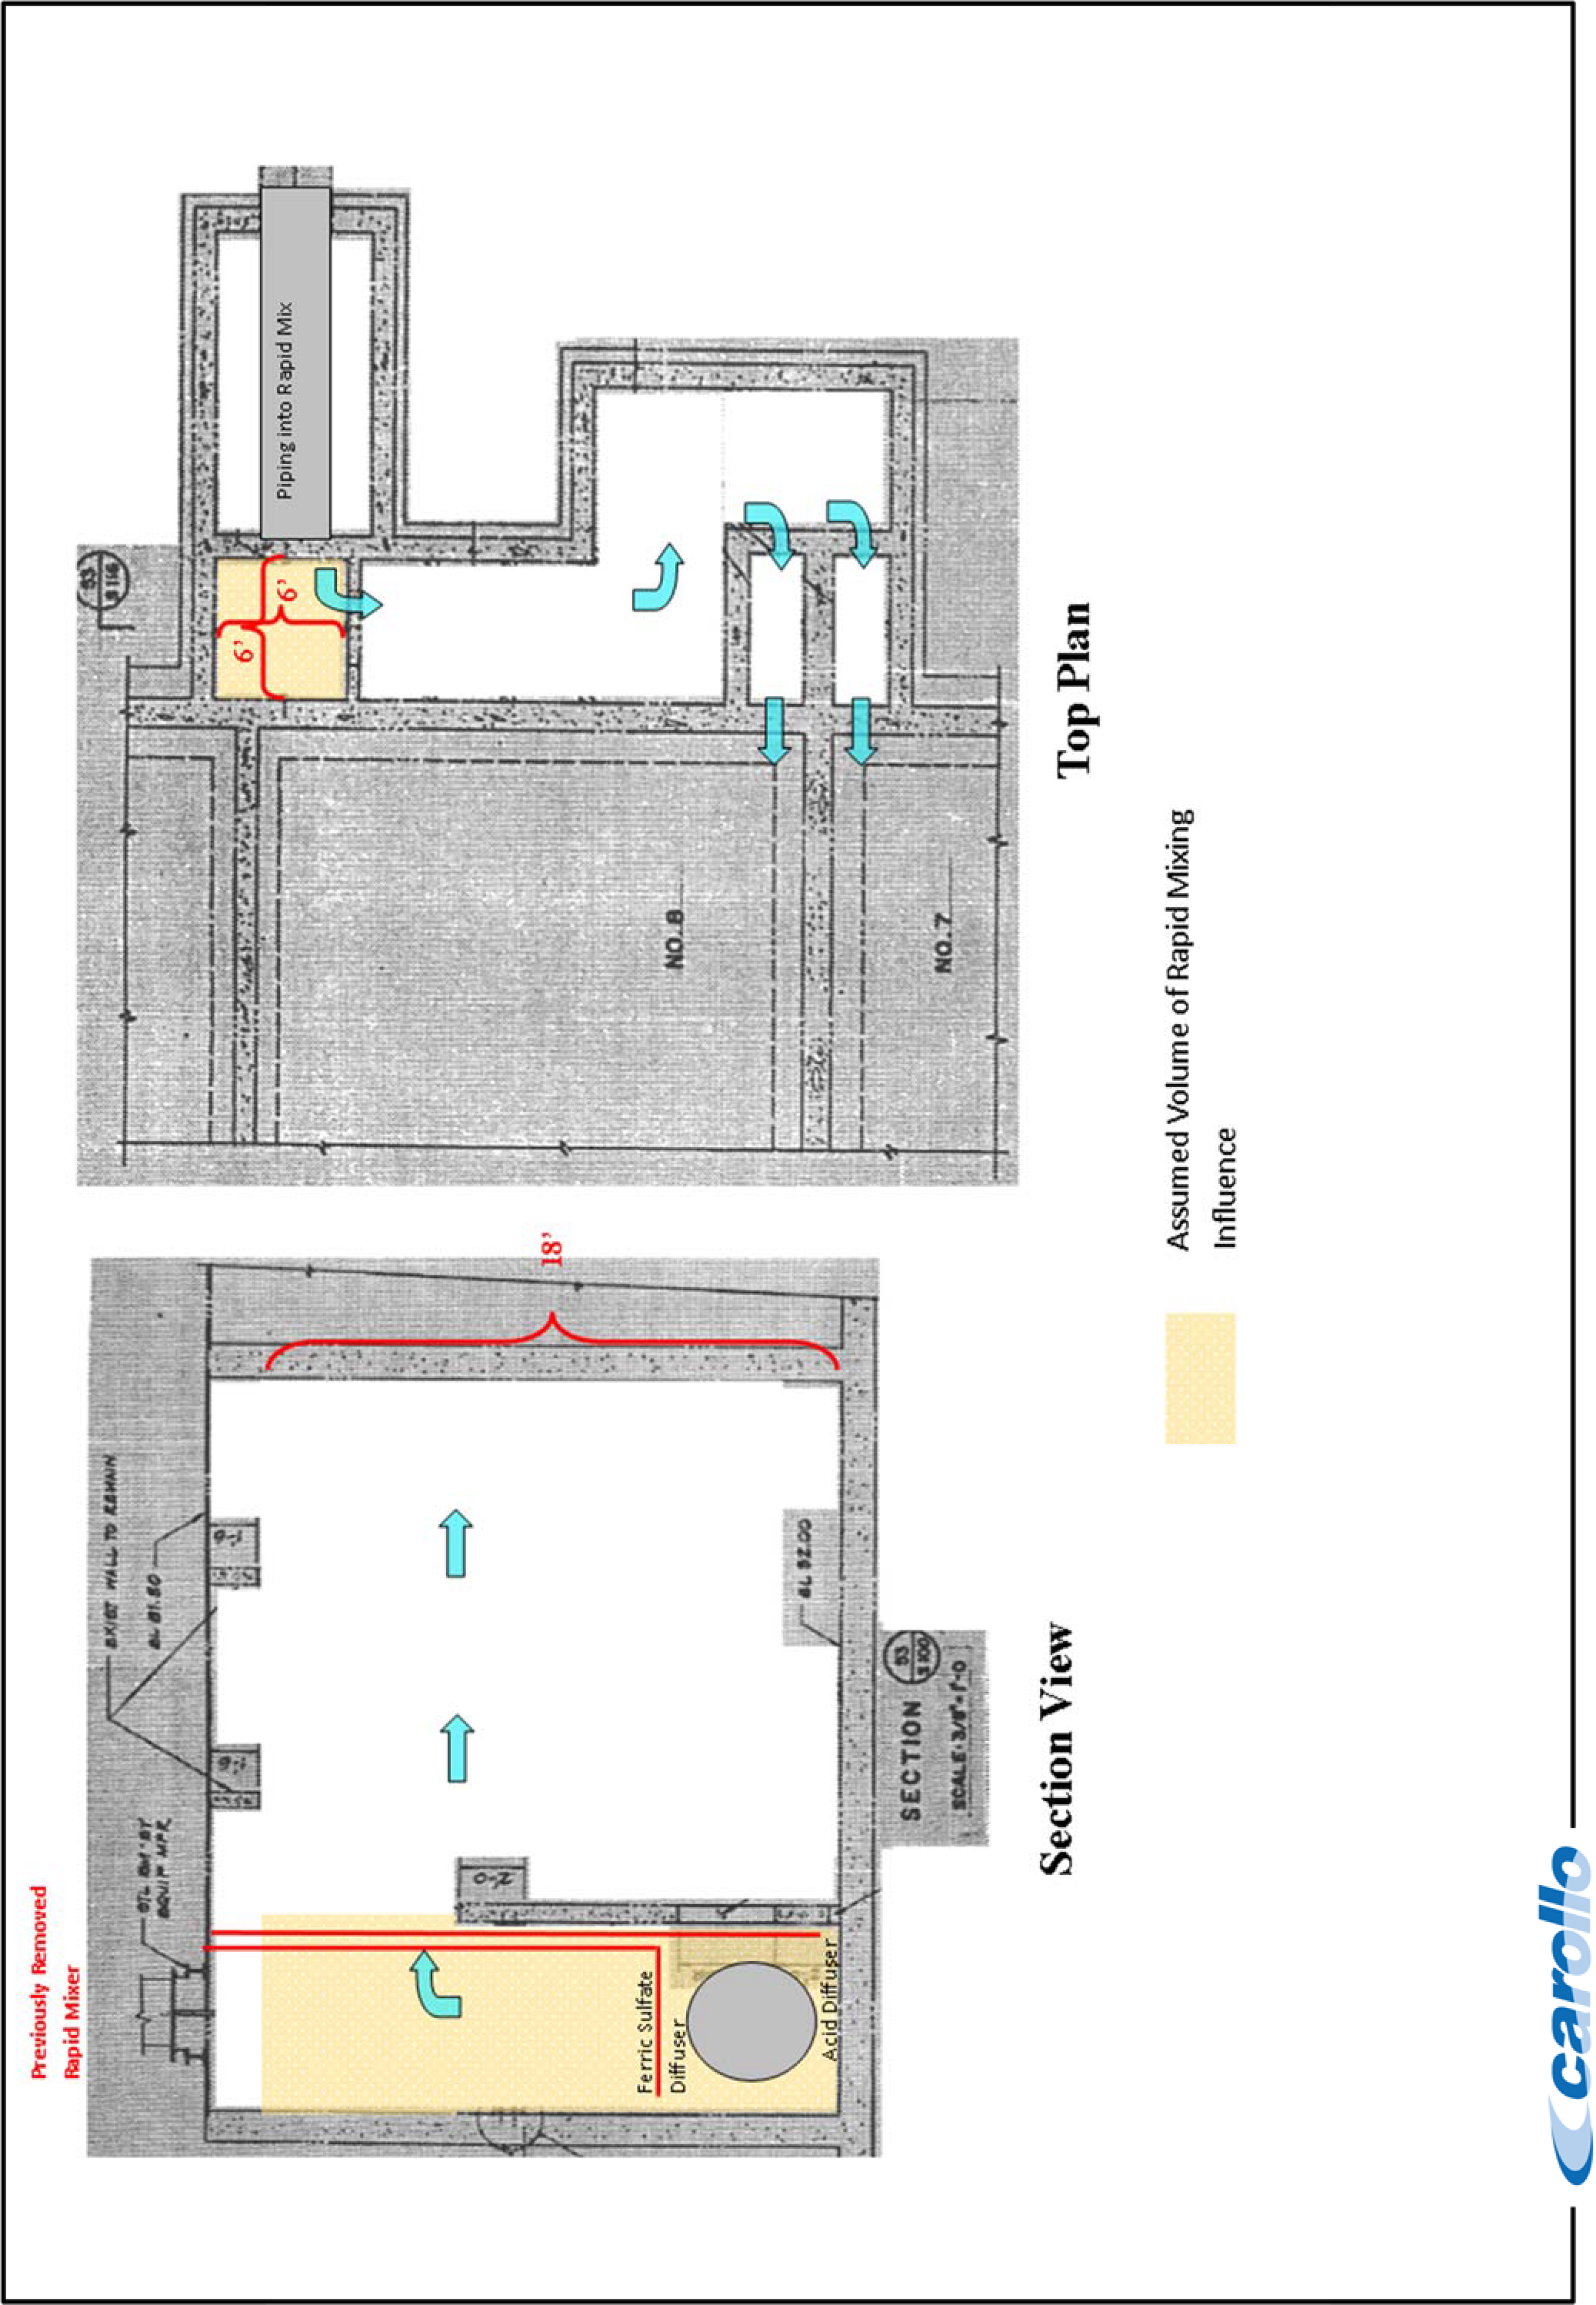
If DLTWTF changes its current operating procedure, mixing intensity may become more important with lower coagulant doses or increased pH. Thus, this must be taken into account when evaluating treatment that would lower the coagulant dose. High-intensity mixing provides the flexibility to operate over different ranges of coagulation conditions and provides a well-mixed flow before splitting between basins.
Although the Ten States Standards desire a detention time no greater than 30 seconds, detention times could be as low as 1 second for high-intensity mixers, with 10 seconds being the recommended maximum. The DLTWTF currently has excessive detention times that can cause shearing. Thus, either the area of rapid mix or the volume of water affected by rapid mix should be reduced. Chapter 5 presents the proposed design for the rapid mix area.
The allowable design criteria for the rapid mix basin does not limit the capacity of the conventional treatment trains, each of which can process 50 mgd.
3.3.3.4 Flocculation System
The flocculation process follows coagulation and allows for the interaction and collision of destabilized particles to form larger particles that will settle out in the sedimentation process. Each treatment train has four flocculation stages and its own variable speed flocculator.
Based on the provided record drawings, the basins were originally configured for two-stage flocculation. However, they were modified in the 1980s to allow for a four-stage system. Figure 3.4 and Figure 3.5 show the flow path and design for the treatment trains.
The flocculation basin configuration was confirmed to be consistent among all treatment trains. However, Trains 7 and 8 have a slightly smaller volume available for treatment.
Stages 1 and 2 for each train have 5-horsepower (hp) flocculators and Stages 3 and 4 have 1.5-hp flocculators. On October 27, 2016, a site visit was conducted while Trains 5 and 6 were dewatered and made available for inspection. Power was then calculated using the flocculators' actual (witnessed) speeds for each stage. Trains 7 and 8 were assumed to have the same flocculator speeds in the respective flocculation stages.
Table 3.6 shows the flocculation design criteria and calculated values for the existing configuration. Values in red, orange, or green font reflect a significant, minor, or insignificant variance from the recommended value, respectively.

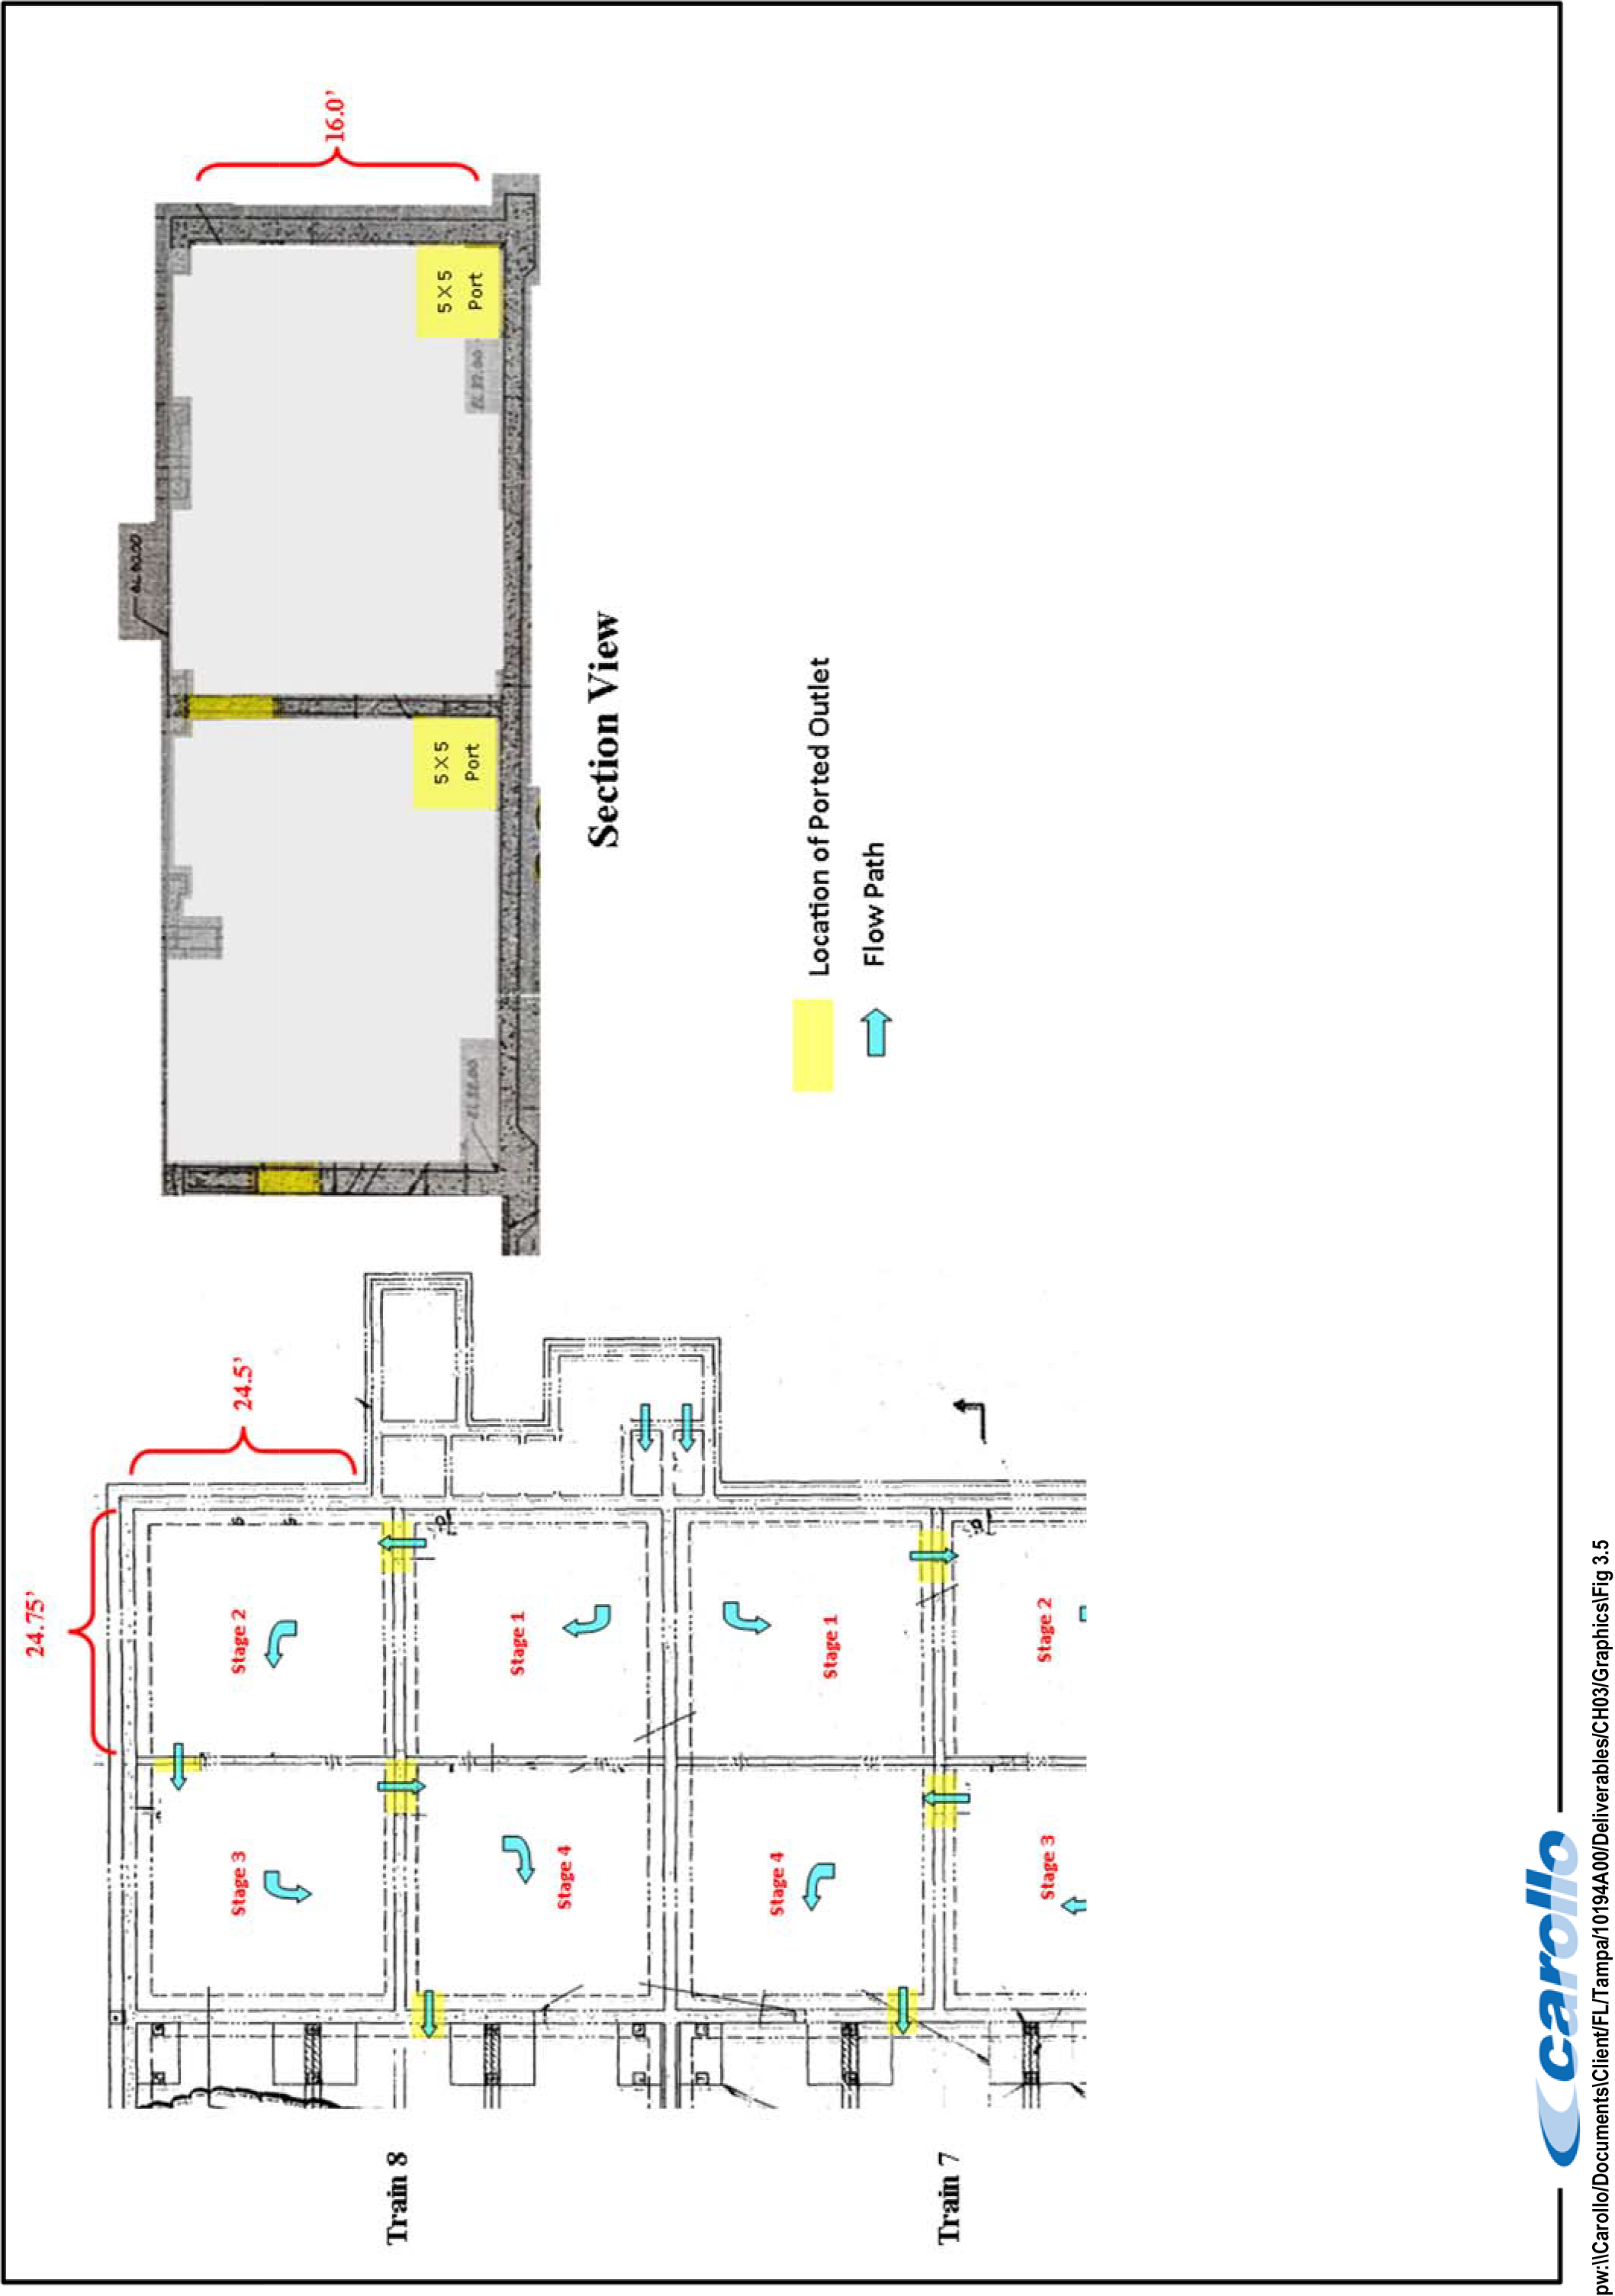
| Parameter | Units | Trains 5 & 6 | Trains 7 & 8 | Recommended Value |
|---|---|---|---|---|
| Flocculation | ||||
| No. of Basins (Stages) | - | 4 | 4 | - |
| Original Design Flow (each train) | mgd | 20 | 20 | - |
| No. of Flocculators per Stage | - | 1 | 1 | - |
| Stage Dimensions | ft | |||
| Length | 24.5 | 24.5 | - | |
| Width | 24.75 | 24.75 | - | |
| Water Depth | 16.5 | 16 | - | |
| Volume per Stage | gal | 74,800 | 72,600 | - |
| Volume for all four stages | gal | 299,400 | 290,300 | - |
| Total Detention Time Through All Stages | min | |||
| At 10 mgd Train Capacity | 43.1 | 41.8 | 30 | |
| At 20 mgd Train Capacity | 21.6 | 20.9 | ||
| At 25 mgd Train Capacity | 17.2 | 16.7 | ||
| Motor Power | ||||
| Stage 1 and 2 | 5 | 5 | - | |
| Stage 3 and 4 | 1.5 | 1.5 | - | |
| Flocculator Speed(1) | rpm | |||
| Stage 1 | 9.0 | - | ||
| Stage 2 | 8.5 | - | ||
| Stage 3 | 5.5 | - | ||
| Stage 4 | 5.0 | - | ||
| Mixing Energy, (at 25̊ C/15̊ C) | sec-1 | |||
| Stage 1 | 13.2 / 10.2 | 13.3 / 10.3 | 60 | |
| Stage 2 | 13.0 / 10.1 | 13.2 / 10.2 | 35 | |
| Stage 3 | 12.1 / 9.37 | 12.3 / 9.51 | 20 | |
| Stage 4 | 11.9 / 9.22 | 12.1 / 9.36 | 10 | |
| Parameter | Units | Trains 5 & 6 | Trains 7 & 8 | Recommended Value |
|---|---|---|---|---|
| Tip Speeds | fps | |||
| Stage 1 | 4.7 | 7.0 - 9.0 | ||
| Stage 2 | 4.5 | |||
| Stage 3 | 2.9 | |||
| Stage 4 | 2.6 | |||
Notes:
- (1) As witnessed on October 27, 2016, while Trains 5 and 6 were down for maintenance.
- Detention times are insufficient for all four flocculation systems at 80 and 100 mgd of conventional basin capacity (20 and 25 mgd per conventional train). To achieve 30 minutes of flocculation time, the maximum flocculation flow rate would be 14.3 mgd for Train 5 and 6 and 13.9 mgd for Train 7 and 8, for a total flow of 56.4 mgd for the conventional system.
- The mixing energy for all stages is too low. Also, floc sedimentation is reported in the flocculation basins, further reducing the theoretical detention time. A pitched blade flocculator has more shear than other lower shear flocculators (like hydrofoils or paddles), and the selected G value is likely a balance between shearing floc and too much settling, especially after polymer is added. Settling reduces the volume in the flocculators, effectively making the floc basins smaller and reducing the detention time. Figure 3.6 shows the recommended range for each stage compared to the actual mixing energies.
- At lower coagulation doses, mixing energy within the flocculation basins becomes more vital to proper floc formation because, with less floc in the water, more collisions are required. Low mixing energy can cause sludge accumulation in the basins and further reduce the volume available for flocculation.
- The tip speeds based on the flocculator speed (rpm) are below the maximum tip speeds of 3.0 fps for stages 1 and 2 but above the maximum in stages 3 and 4. Considering that a large percentage of the floc is ferric hydroxide, the floc is weaker and possibly more shear-sensitive than typical floc. Thus, tip speeds should be minimized.

RECOMMENDED MIXING ENERGY VS ACTUAL MIXING ENERGY
FIGURE 3.6 CITY OF TAMPA DAVID L. TIPPIN WTF MASTER PLAN
In addition to considering the mixing energy, short-circuiting should be minimized within the basins. Openings in the corners of the walls encourage high velocities and short-circuiting.
A better approach could be to use the center wall with ports to provide an even distribution into and out of each flocculation stage. Chapter 5 further discusses this approach.
Figure 3.7 shows the current rotational direction of each flocculator. Ideally, the flow path entering the stage should be directed to prevent short-circuiting and dead zones. The arrows highlighted in red show flocculators that could encourage short-circuiting. If current operation continues, reversing the rotation of these flocculators should be considered.
Furthermore, the angle of the pitched blade should be reviewed and verified in the field for each train. Figure 3.8 shows the differences between a 135-degree blade and 45-degree blade, which can push or pull water depending on rotational direction. This is significant, since the flocculation basins are designed for water to enter the top or bottom of a basin and exit on the other side, meaning water enters from the top and exits at the bottom or enters from the bottom and exits at the top. The blades should be angled to discourage short-circuiting.
Multiple ports and openings of varying sizes are found in the flocculation basins. Figure 3.9 shows the five different sized ports and their applicable locations. As Table 3.7 shows, at train flows of 20 mgd, velocities are higher than recommended at locations C1, and D, and at train flows of 25 mgd, velocities are higher than recommended at locations C1, C2, and D. Based on an allowable velocity of 1.0 fps through ports, port C1 would limit the flow rate for each train at a maximum flow of 13.0 per train, for a total of 52 mgd for the conventional system.
| Port | Actual Velocity | Recommended Velocity |
|---|---|---|
| C1 | ||
| At 20 mgd Train Capacity | 1.54 | 1.2 |
| At 25 mgd Train Capacity | 1.92 | 1.2 |
| C2 | ||
| At 25 mgd Train Capacity | 1.63 | 1.2 |
| D | ||
| At 20 mgd Train Capacity | 1.15 | 0.8 |
| At 25 mgd Train Capacity | 1.43 | 0.8 |


3.3.3.5 Sedimentation System
Following flocculation, the sedimentation process allows for agglomerated floc particles to settle, which are then removed via the sludge collection siphon. Each treatment train has its own rectangular sedimentation basin. Trains 5 and 6 have a marginally longer basin, and Trains 7 and 8 have one foot more side water depth because the bottom slab elevation is one foot deeper.
Table 3.8 shows the design criteria and calculated values for the existing sedimentation basins.
| Parameter | Units | Trains 5 & 6 | Trains 7 & 8 | Recommended Value |
|---|---|---|---|---|
| No. of Basins | - | 2 | 2 | - |
| Basin Dimensions | - | - | ||
| Length | ft | 300 | 300 | |
| Width | ft | 50 | 50 | |
| Water Depth | ft | 14.34 | 15.34 | |
| Volume (per basin) | MG | 1.61 | 1.72 | - |
| Detention Time | hr | |||
| At 10 mgd Train Capacity | 3.86 | 4.13 | 1.5 - 4 | |
| At 20 mgd Train Capacity | 1.93 | 2.07 | 1.5 - 4 | |
| At 25 mgd Train Capacity | 1.55 | 1.65 | 1.5 - 4 | |
| Cross Sections Area (per basin) | sq ft | 717 | 767 | - |
| Surface Area (per basin) | sq ft | 15,013 | 15,000 | - |
| Surface Overflow Rate | gpm/sq ft | |||
| At 10 mgd Train Capacity | 0.46 | 0.46 | 0.25 - 1.0 | |
| At 20 mgd Train Capacity | 0.93 | 0.93 | 0.25 - 1.0 | |
| At 25 mgd Train Capacity | 1.16 | 1.16 | 0.25 - 1.0 | |
| Length to Width Ratio | - | 6:01 | 6:01 | 4:1 to 6:1 |
| Length to Depth Ratio | - | 20.9:1 | 19.6:1 | >15:1 |
| Parameter | Units | Trains 5 & 6 | Trains 7 & 8 | Recommended Value |
|---|---|---|---|---|
| Reynold's Number | ||||
| At 10 mgd Train Capacity | - | 21,100 | 20,600 | <20,000 |
| At 20 mgd Train Capacity | - | 42,300 | 41,200 | <20,000 |
| At 25 mgd Train Capacity | - | 52,900 | 51,600 | <20,000 |
| Froude Number | ||||
| At 10 mgd Train Capacity | - | 1.6 x 10⁻⁶ | 1.3 x 10⁻⁶ | >10-5 |
| At 20 mgd Train Capacity | - | 6.3 x 10⁻⁶ | 5.3 x 10⁻⁶ | >10-5 |
| At 25 mgd Train Capacity | - | 9.9 x 10⁻⁶ | 8.3 x 10⁻⁶ | >10-5 |
| Horizontal Velocity | ||||
| At 10 mgd Train Capacity | ft/min | 1.29 | 1.21 | <1.0 |
| At 20 mgd Train Capacity | ft/min | 2.59 | 2.42 | <1.0 |
| At 25 mgd Train Capacity | ft/min | 3.24 | 3.03 | <1.0 |
Calculated detention times, surface overflow rates, and length-to-width ratios were within the recommended ranges for all four basins at 10 mgd per train. However, the horizontal velocities exceeded 1.0 ft/min for all flow scenarios. Higher horizontal velocity in a sedimentation basin can lead to scour from the bottom of the basins and allow for resuspension of settled flocs that are ultimately carried to the next unit process.
High Reynolds numbers were also calculated. High Reynolds numbers can signify turbulent and unfavorable conditions for settling.
At the entrance to the basin, a baffle plate was installed on the 1-foot by 3-foot openings in the outlet wall of the floc basins, likely to avoid short-circuiting with water jetting into the sedimentation basin. While the baffle may have diminished short-circuiting, the resulting high velocities in this reduced area cause concern about floc shearing. The floc is unlikely to reform, since flows transition from flocculation to settling mode.
To collect settled water, the DLTWTF uses launders with 2-inch orifices that run 125 feet into the sedimentation basins. This design forces the water and unsettled particulates to migrate upward and horizontally to exit the basin. Particles that may have settled in the second half of the DLTWTF treatment basins are instead carried out of the basin. This is a primary reason plant staff reported very little solids accumulation on the basin floor and an infrequent need to vacuum this portion of the basin floor. This design is more adverse to treatment than the finger launders and weirs that were commonplace in previous designs. The previous design encouraged particle carryover in a vertical plane and at a lower exit
velocity because of the large number of launders and extensive weir length. Table 3.9 details the velocities through each orifice of the effluent launders at different flow rates.
| Parameter | Units | Value |
|---|---|---|
| No. of Launder Per Train | - | 6 |
| No. of Orifices Per Launder | - | 96 |
| Total No. of Orifices per Train | - | 576 |
| Diameter of Orifices | in. | 2 |
| Surface Area of Orifice | ft2 | 0.022 |
| Velocity Through Each Orifice | fps | |
| At 10 mgd Train Capacity | 1.23 | |
| At 20 mgd Train Capacity | 2.46 | |
| At 25 mgd Train Capacity | 3.08 |
As the table shows, velocity through the orifices exceeds the Ten States Standards value of 0.5 fps, reinforcing that floc carryover and shearing are likely occurring. Additionally, as Chapter 4 notes, significant differences in headlosses were observed between the orifices and the launders, which signifies poor distribution throughout this zone of the basin.
For these reasons, the drinking water industry has largely migrated away from finger launders/weirs and designs similar to the one in Trains 5 through 8. Instead, designs such as ported outlet walls are common, because they give particles in the outlet zones of sedimentation basins the best opportunity to settle.
The Ten States Standards require 4 hours of settling time and a rise rate of 0.5 gallons per minute per square foot (gpm/sq ft). If the remaining features of the basins are well-designed, these requirements are overly conservative. Carollo's experience at the Draper WTP and other facilities shows that higher rates are allowable. The Draper WTP in Oklahoma City, OK, originally was a 90-mgd facility limited by its flocculation/sedimentation process. The plant consisted of three trains with two basins in each train.
Carollo redesigned the Draper WTP sedimentation facility to modify the basins. The redesign improved the design parameters and removed all flow disturbing features of the basin. The following improvements were made:
- Solids collection equipment removed and replaced.
- Bottom floor slope filled to create a flat floor.
- Partition wall added to improve basin length to width ratio. This wall was just for baffling and was not a water retaining wall.
- Concrete fillets were removed.
- Finger launders were removed and replaced with a ported wall.
With these improvements, Oklahoma City could increase flow through the basin from 15 mgd to 25 mgd while dramatically improving the settled water turbidity and TOC removal.
Table 3.10 compares the original design criteria and the revised design criteria of the improvements made to the Draper WTP basin. The basins successfully operated at 25 mgd per train with very low settled water turbidities.
| Description | Units | Original Draper | Retrofit Draper |
|---|---|---|---|
| Design Flow | mgd | 15.0 | 25.0 |
| Number of Basins | No. | 2 | 2 |
| Length to Width Ratio | ft: ft | 2:07:1 | 4:1 |
| Froude Number | 8.6 x 10⁻⁷ | 2.14 x 10⁻⁶ | |
| Reynolds Number | 14,000 | 12,900 | |
| Side Water Depth (average) | ft | 18.0 | 15.0 |
| Length-to Depth Ratio | ft:ft | 12:1 | 13.8:1 |
| Total Area | sf | 23,600 | 22,500 |
| Surface Loading Rate | gpm/sf | 0.45 | 0.83 |
| Total Volume | gal | 2,375,000 | 1,875,000 |
| Detention Time | min | 228 | 108 |
| Horizontal Flow Velocity | fpm | 1 | 1.7 |
| Sludge Collection | type | 1 Circ. Sweep (space for a second) | Superscraper |
| Weir Type | type | V-Notch | Ported walls |
| Weir Length | ft | 1000 | 0 |
| Weir Loading | gpm/ft | 10.4 | NA |
Based on the success at Draper WTP and many other facilities, Carollo believes the capacity of the existing basins could be between 14 and 20 mgd per basin with good flocculation and well-distributed inlet conditions to the sedimentation basins. The exact capacity rating would be based on full-scale testing of the system once the flocculation improvements are made. For this master plan, the current rated capacity of these basins is considered to be 14 mgd. Chapter 5 proposes an alternative to expand the capacity using existing infrastructure.
Although the sludge collection equipment in the basins is extremely well maintained and functional, it is antiquated. As stated in Chapter 2, given the system's age, replacing it with a new and more efficient technology, requiring only minimal structural modifications to the
existing basins, is recommended. The mechanism recommended can be either a chain and flight type or a super-scraper type. They are described in detail at the conclusion of this chapter.
3.3.3.5.1 pH Adjustment
Since the settled water pH at the DLTWTF is typically from 3.8 to 4.5, it must be increased before ozonation. Currently, lime is dosed at the end of the sedimentation basin after the settled water has been collected from the launders and prior to the low lift pump station wet well, where it is combined with Actiflo™ settled water. This set-up is problematic because the total flow is not being pH adjusted, and higher doses must be used in the conventionally settled water to make up for the volume of Actiflo™ settled water not being adjusted.
Adding lime in this way can cause localized softening and subsequent precipitation of calcium carbonate, a likely culprit as it pertains to shortened filter run times. Redesigning this feed system to allow for uniform dispersion of lime fed into all of the settled water is recommended. Caustic is currently added (when needed) to the discharge of the intermediate pump station to the entire plant flow.
Since the initial evaluation, the City noted a design is in progress to address this issue. Carollo has reviewed and provided recommendations for improvement based on the proposed design.
3.3.3.6 CFD Modeling Results
CFD modeling was based on the existing geometry and configuration of the conventional basins at the flow rate of 20 mgd per train, the current rated capacity.
Figure 3.10 shows the flow distribution, velocities, and mixing energies for the flocculation basins and ports to the sedimentation basin via plan view. As shown, the mixing energy varies from 12 to 20 sec-1 for most of the basin. The mixing energy is lower than recommended and is also not significantly tapered (decreasing from stage to stage). Higher energies and velocities are realized at various locations in the basin and can signify short-circuiting.
Additionally, the velocities at Port B, C, and D exceed the recommended values, with Port D velocities exceeding 2.0 ft/s. This is likely causing significant floc shearing.
Figure 3.11 shows the profile view results. As the figure shows, poor distribution in the sedimentation basin is occurring, where velocities on the left side of the basin are higher than the right side. Higher velocities at the bottom of the basin are also likely causing resuspension of previously settled floc.
Overall, the CFD modeling supported previous assertions about issues with short-circuiting, insufficient mixing, sludge accumulation, high port velocities, and poor distribution in the existing system.
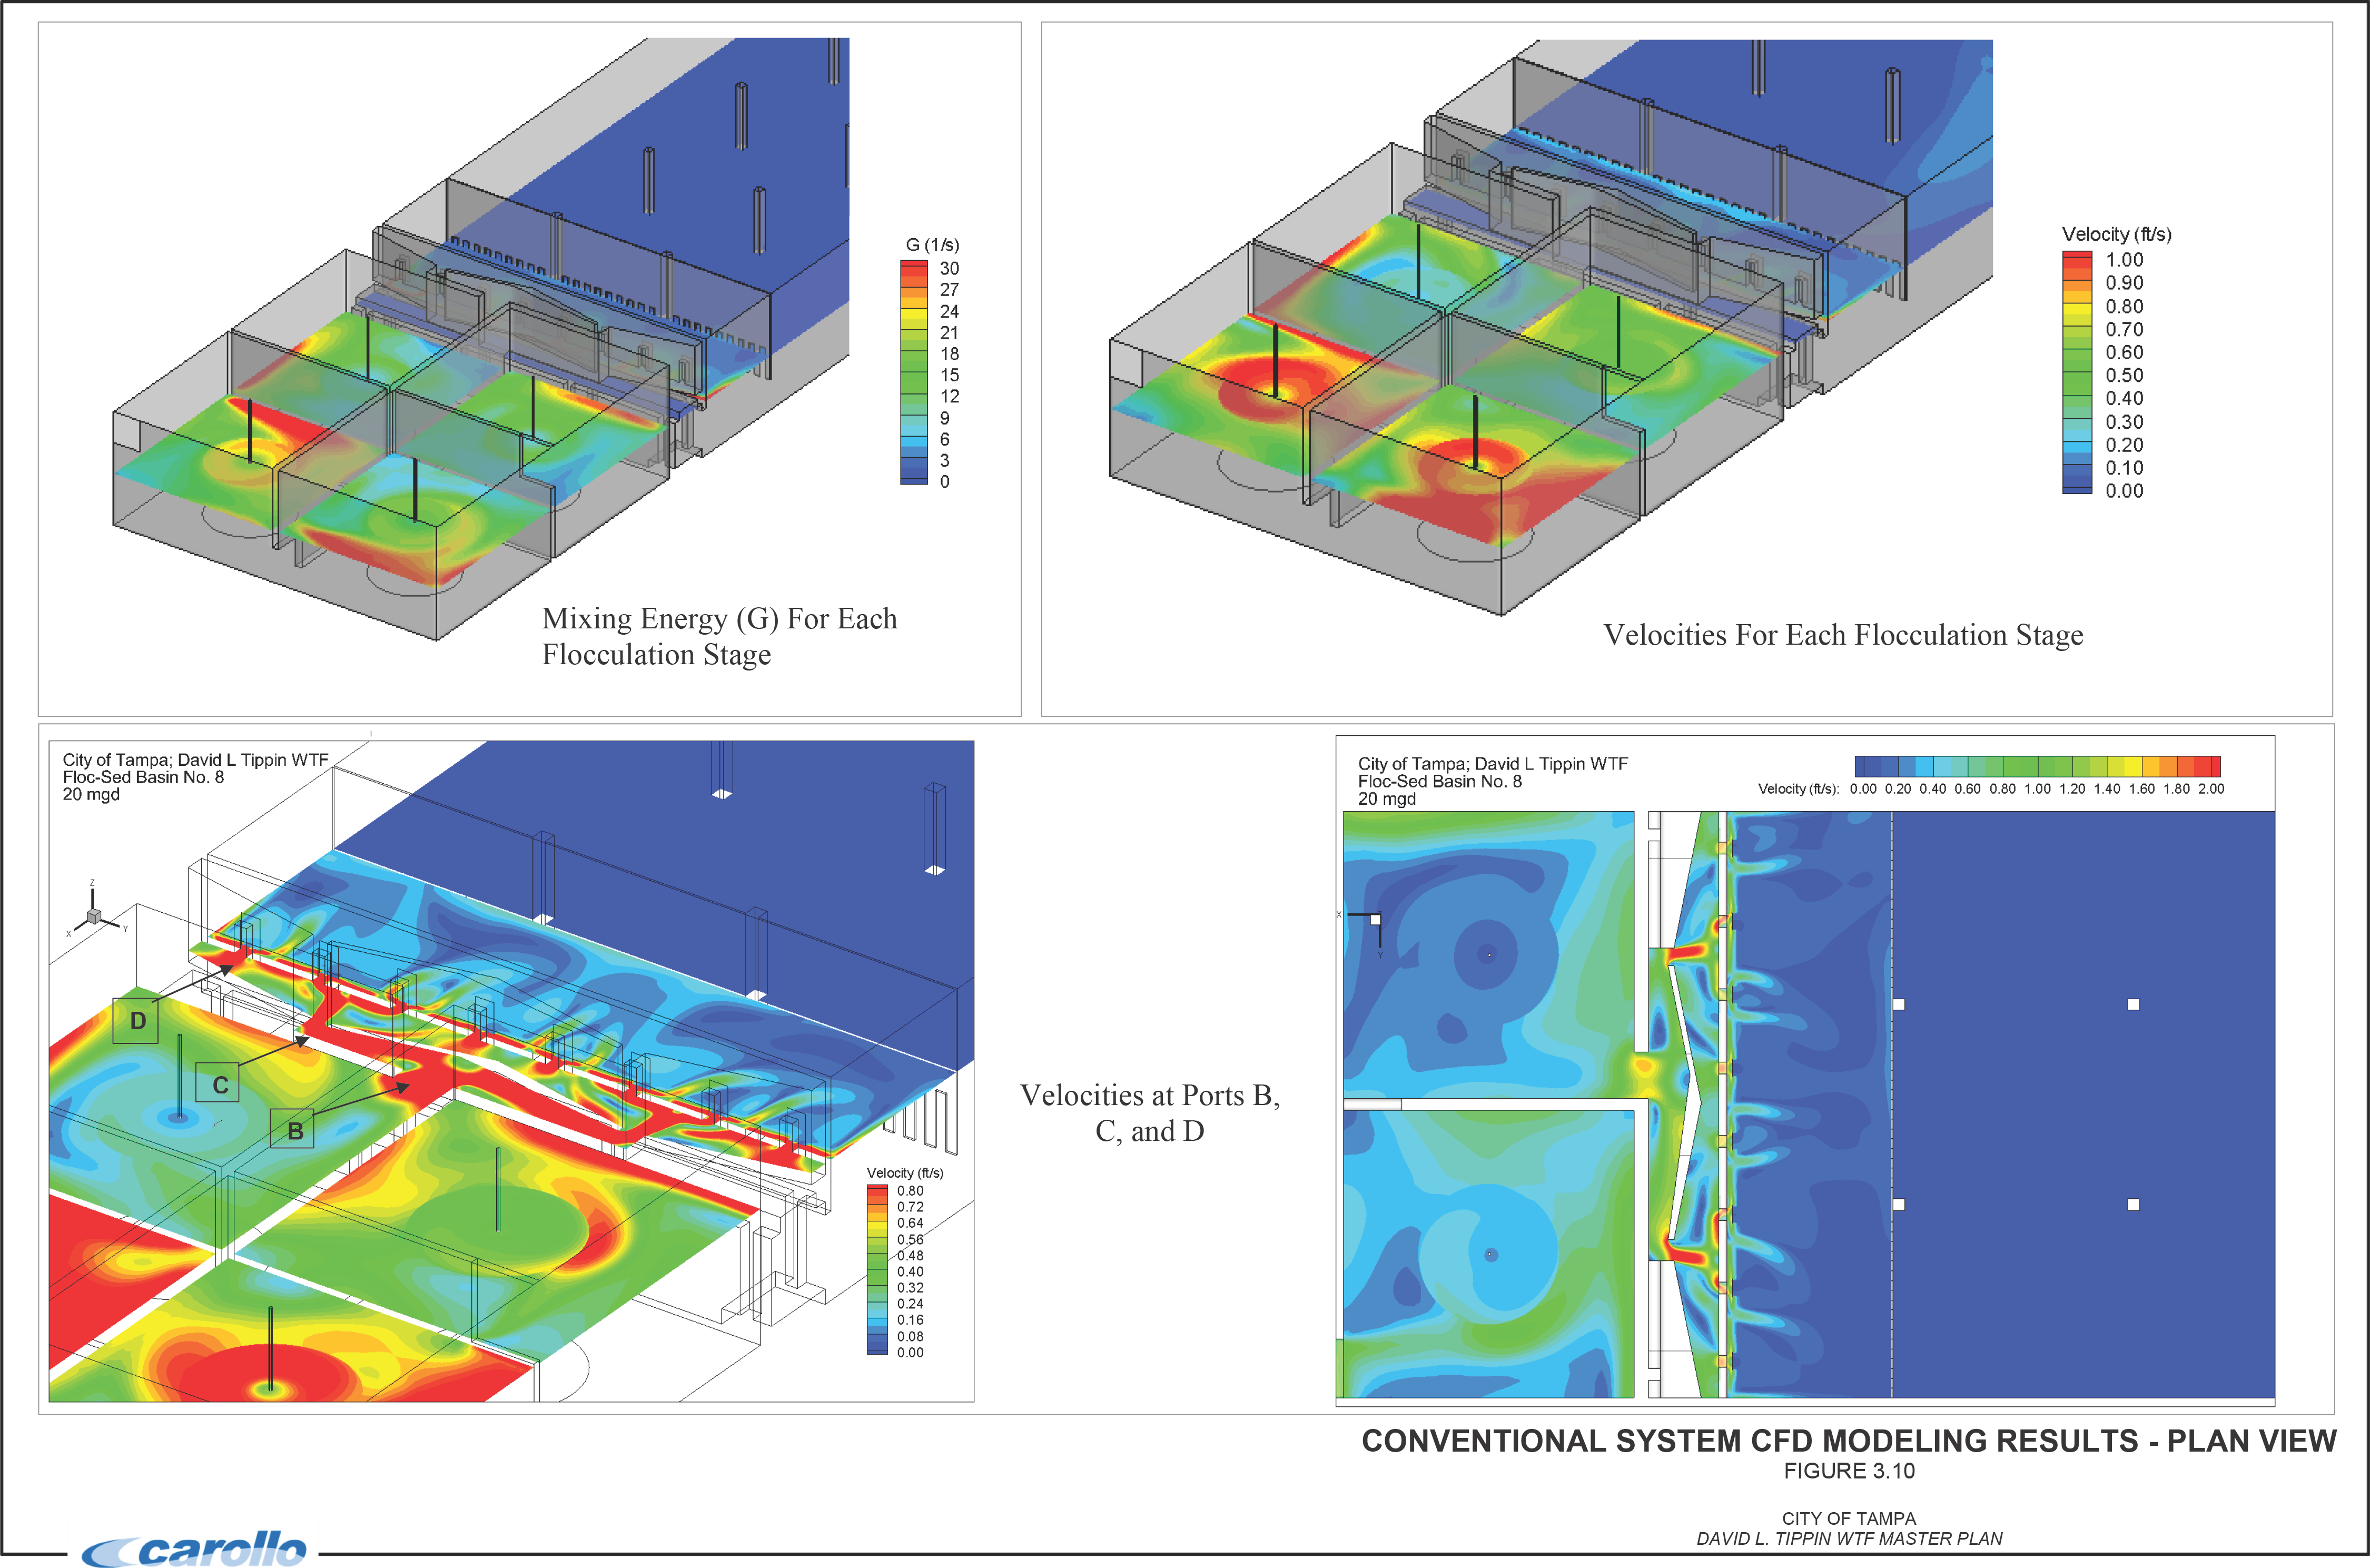
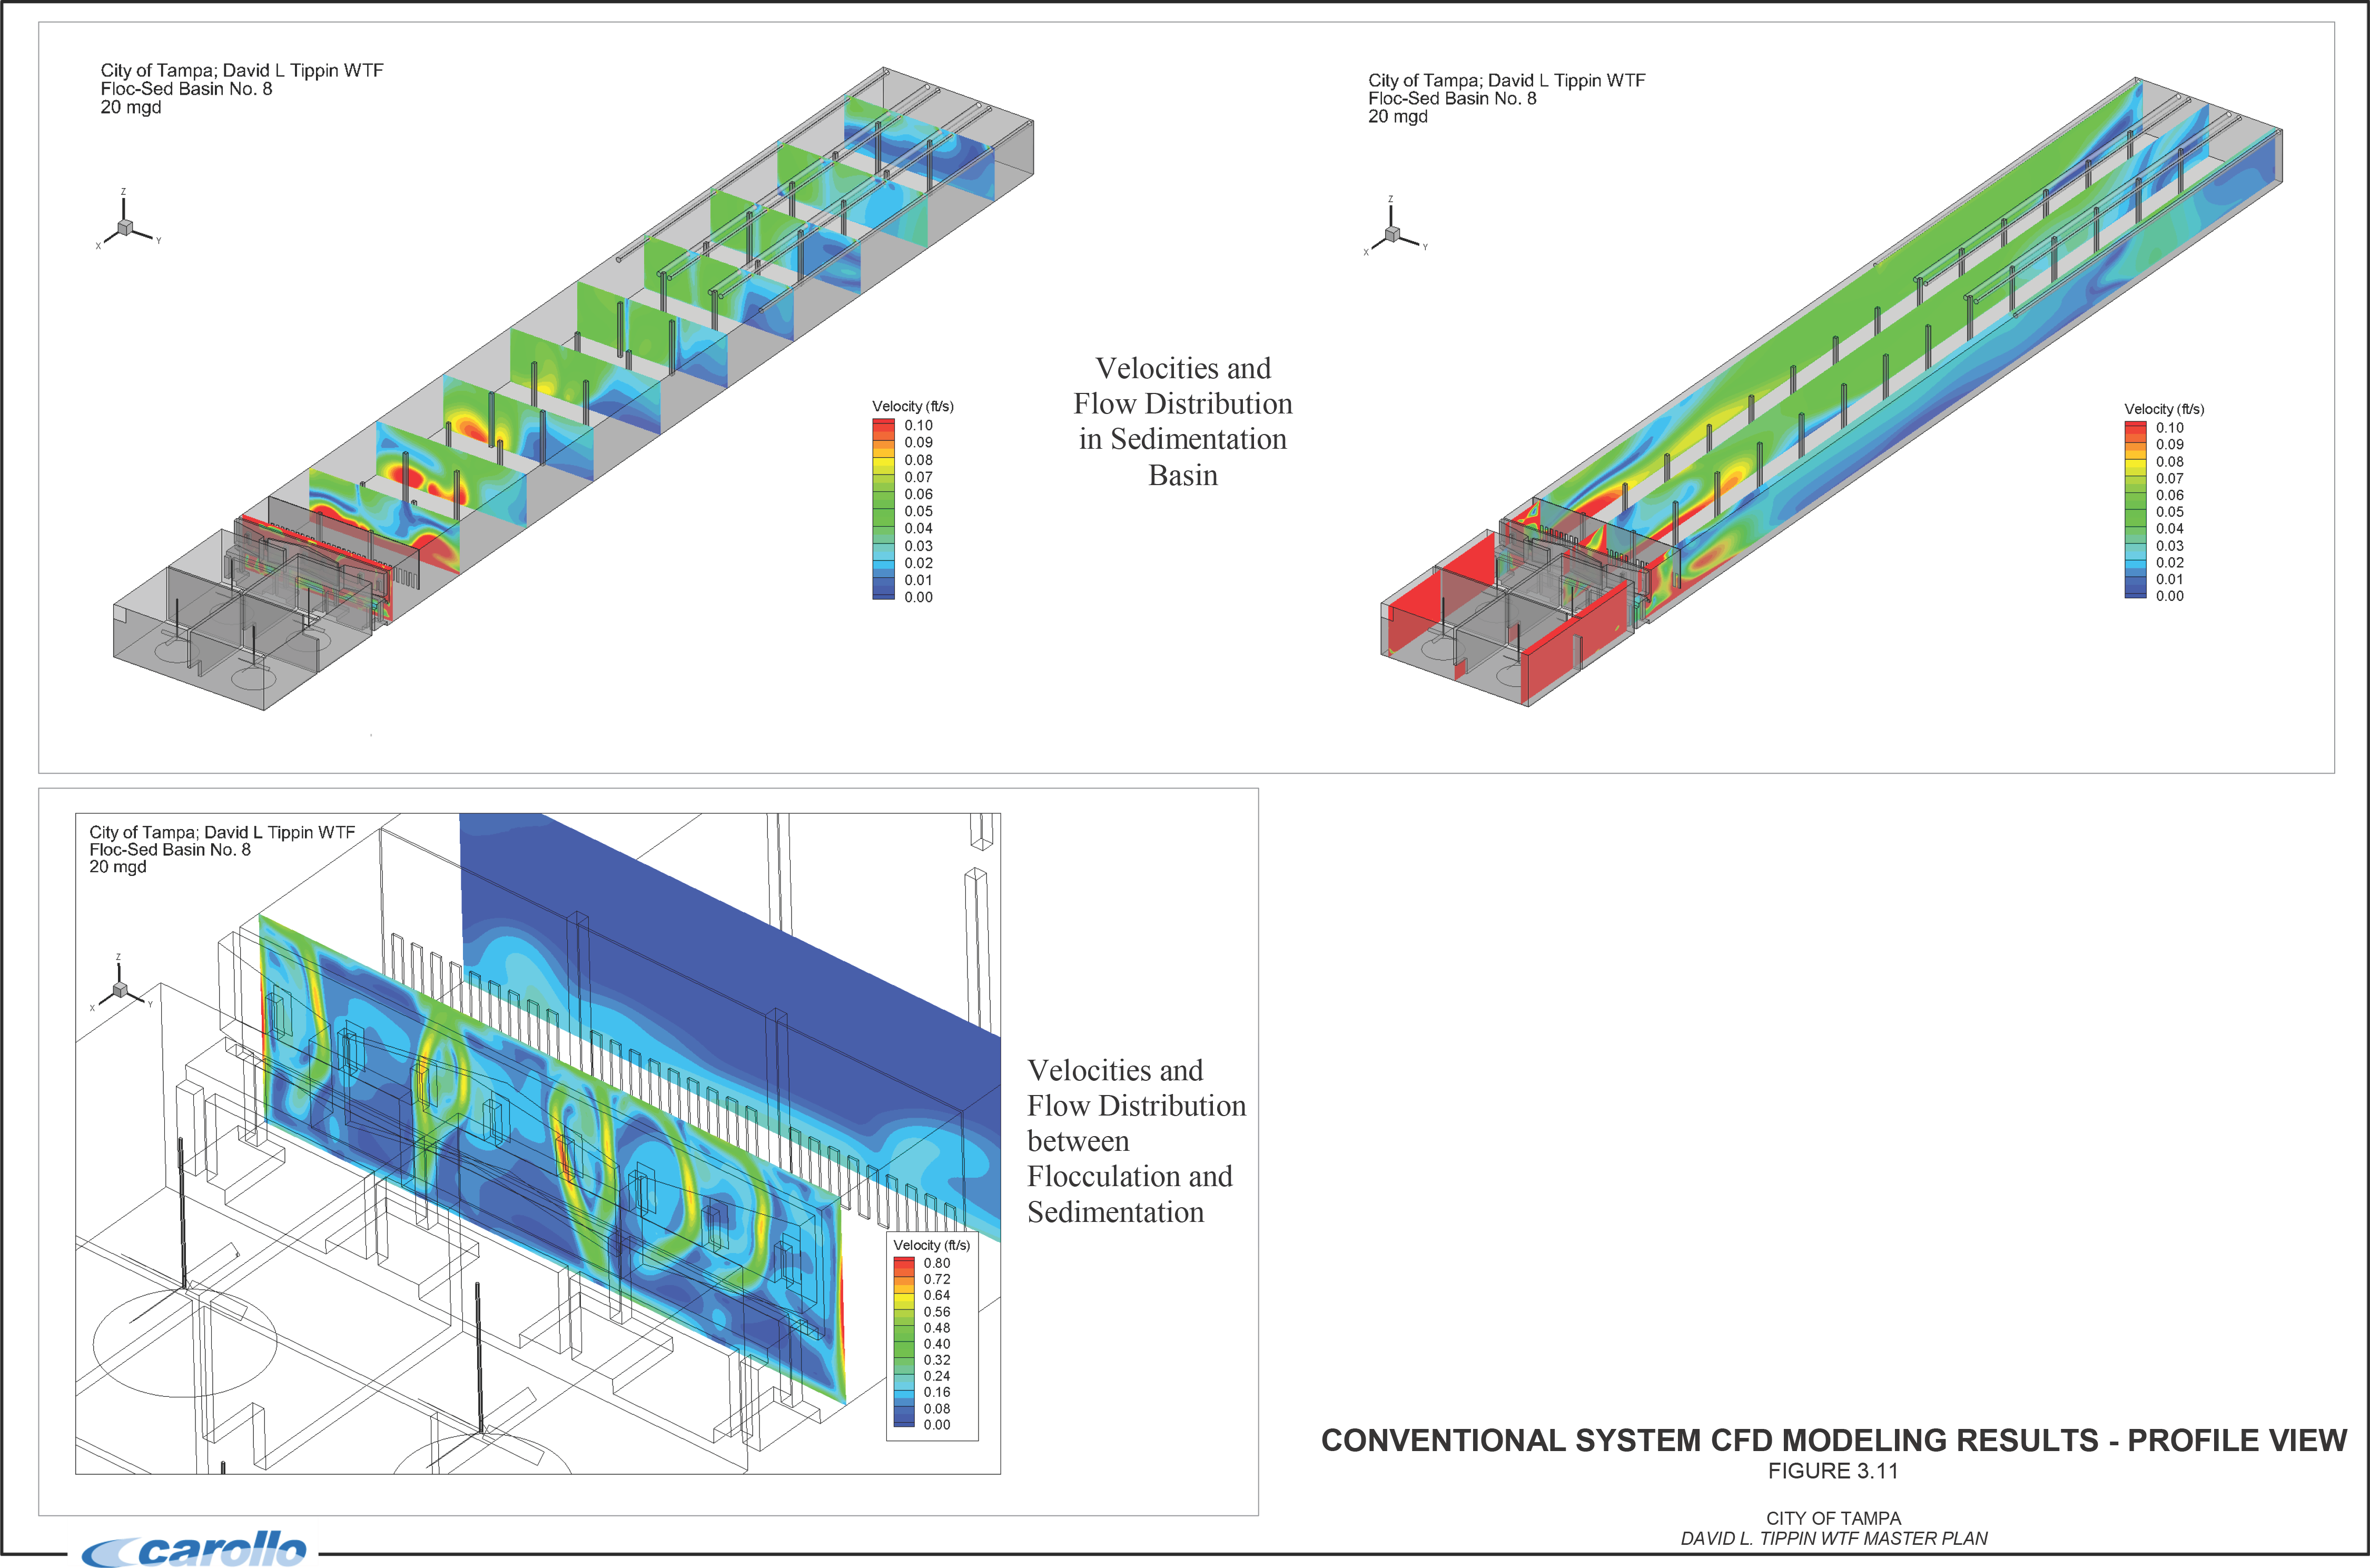
3.3.3.7 Overall Notes on Existing Process Performance and Ability to Expand
Although the conventional treatment system has performed reasonably well, it has led to high chemical costs due to the elevated ferric sulfate and acid dosages and subsequent lime and caustic dosages.
In evaluating each conventional treatment step for all flow scenarios, many issues were found in each system. The approach for remedying these issues will depend to some degree on the decision to keep the current enhanced coagulation treatment method or employ an alternative treatment technology, such as ion exchange. Nonetheless, remedies to provide reliable and cost-effective treatment at the current rated capacity (120 mgd) and especially at the expanded capacity (140 mgd) will be substantial. They are discussed in Chapter 5.
3.3.4 Ozone System
3.3.4.1 Description
Ozone is a strong oxidant typically used as a primary or secondary disinfectant that can destroy or deactivate microorganisms, bacteria, and viruses. Its effectiveness depends on the type of organisms in the source water, contact time, and ozone residual concentration.
In addition, ozone effectively alters the characteristics of organic compounds and renders them more biodegradable. This is important because it will maximize the efficiency of TOC removal across the downstream Biologically Activated Filtration (BAF) process. Ozone's effect on organics also has the side benefit of dramatically reducing color by oxidizing the color-causing compounds in the incoming flow stream.
The DLTWTF generates ozone on site and uses it for primary disinfection of settled water before it goes to the filtration system. Using ozone for primary disinfection reduces the amount of disinfection byproducts (DBPs) produced in the distribution system. The DLTWTF also uses ozone to reduce taste and odor compounds during the rainy season, when concentrations of these compounds are elevated.
3.3.4.2 Production System
Typically, pure oxygen is the feed gas for ozone production. The DLTWTF uses a liquid oxygen (LOX) system that converts liquid oxygen to gaseous oxygen sent to the ozone generators. The LOX system consists of three 13,000 gallon pressurized liquid oxygen storage tanks, four ambient air vaporizers, a bypass cooling system, pressure regulation system, and gas coolers and heaters. These components ensure that the gaseous oxygen fed into the ozone generators has an appropriate flow, temperature, and pressure.
Since nitrogen (0.5 to 2.0 percent, by weight) is also required in the gas stream, the DLTWTF uses a nitrogen boost/air system (NBAS). The system consists of two compressors, an air receiver tank, coalescing pre-filters, desiccant dryers, and a particulate after-filter. These components deliver a clean, dry, air flow that will be blended with the pure
oxygen gas flow to produce the desired nitrogen concentration prior to the ozone generators.
Two completely redundant, Wedeco Model PDSD-3400 ozone generators are available, each with a power supply unit, that convert the oxygen gas to ozone. The high energy input in the generators creates significant heat within the shell. A chilled water system removes excess heat from the generators. Using chilled water as opposed to plant water reduces conversion of ozone back to oxygen inside the ozone generators. Table 3.11 shows the design criteria for the ozone production system.
| Parameter | Units | Value |
|---|---|---|
| Total LOX Storage | gal (tons) | 39,000 (181.5) |
| Total Vaporizer Capacity | scfh @ psig | 56,000 @ 75-115 |
| No. of Duty Generators | each | 1 |
| No. of Standby Generators | each | 1 |
| Generator Production Capacity | lb/day | 3,500(1) or 5,100(2) |
| Gas Pressure Range to Generator | psig | 50-65 |
| Maximum Inlet Gas Temperature to Generator | °F | 75 |
| Minimum Inlet Gas Temperature to Generator | °F | 40 |
| Total No. of Dielectrics (both Generators) | - | 9,100 |
The City has noted issues with the generation system. Chapter 2 details them and recommends improvements for reliability and extending the useful life of the system.
3.3.4.3 Contact System
The contact system uses the generated ozone and provides means to introduce it into the process water. The DLTWTF operates two contactors in parallel. Table 3.12 shows the design criteria.
| Parameter | Units | Value |
|---|---|---|
| Total No. of Ozone Contactors | - | 2 |
| Ozone Contactor Design Capacity (each) | mgd | 75 |
| pH Target Entering Contactors | mg/L | 6.5 |
| Ozone Dose(1) | mg/L | 2.37 |
| Hydraulic Detention Time at Design Capacity | min | 20 |
| Hydraulic Detention Time at AADF (Assuming 60 mgd per contactor) | min | 23.3 |
| T10 at AADF | min | 15.1 |
| No. of Cells per Contactor | - | 8 |
| No. of Diffusers | - | |
| Cell 1 | each | 288 |
| Cell 2 | each | 160 |
| Minimum Gas Flow Rate per Diffuser | scfm | 0.4 |
| Maximum Gas Flow Rate per Diffuser | scfm | 1.5 |
Notes: (1) 2014 and 2015 average ozone dose data provided by City.
Ozone is introduced in only two of the eight cells in each contactor; Cells 1 and 2. Ozone is added:
- Counter-currently into Cell 1 to meet the immediate demand of the process water.
- Co-currently into Cell 2 to establish an ozone residual for adequate contact time (CT).
In this case, hydrogen peroxide may be added to the settled water junction box or directly into Cell 6 for quenching the remaining ozone residual.
3.3.4.4 Destruct System
Any remaining ozone not transferred into the process water must be destroyed before it is released to the atmosphere. This excess ozone is collected in the headspace above the water level in the contactors and routed to one of three off-gas destructors that use a catalyst to convert ozone back to oxygen. Each destructor can process up to 600 scfm of off-gas.
3.3.4.5 Existing Process Performance and Ability to Expand
3.3.4.5.1 Ozone Generation Requirements Based on Historical Usage
Ozone production requirements can be calculated based on historical usage, current annual average and maximum day hydraulic plant flow rates (80 and 120 mgd, respectively), and the future hydraulic flow rate of 140 mgd.
The average applied ozone dosage in 2014 and 2015 was 2.37 mg/L, and the maximum month average ozone dosage for 2008-2015 years was 4.64 mg/L. These figures were used to calculate the production rates shown in Table 3.13. Information in this table was used to determine if the existing ozone system is adequate to meet the future hydraulic flow rate of 140 mgd. More recent ozone dose data was provided in April 2018 and there has been a significant increase in ozone usage. The new average and max month dose for data from January 2016 – April 2018 were 2.88 mg/L and 5.72 mg/L, respectively. This new max month dose was utilized to determine the future ozone production rate requirement of 6,700 pounds per day (lb/day) at 10 percent ozone concentration to meet 140 mgd.
| Plant Flow Rate | Average Dose (2.37 mg/L)(1) | Max Dose (4.64 mg/L)(2) |
|---|---|---|
| 80 mgd | 1,575 | 3,100 |
| 120 mgd | 2,375 | 4,650 |
| 140 mgd | 2,775 | 5,425 |
Notes:
- (1) 2014 and 2015 average ozone dose data provided by City.
- (2) Maximum month dose data from 2008-2015 provided by City.
3.3.4.5.2 Production System
Overdosing of ozone and the subsequent use of hydrogen peroxide as a quenching agent occur when the settled water ozone demand is low, because the ozone generators cannot produce less than 300 lbs/day. However, problems are also reported with ozone failing to meet high demand. The City noted that consultations with the manufacturer are ongoing to evaluate the system and restore its high demand production capabilities.
The ozone process is a valuable and vital part of treatment at the DLTWTF and could potentially also treat reclaimed water as a part of the TAP Project. Nonetheless, the ozone production system is aging and some elements need to be replaced, as detailed in Chapter 2.
Table 3.13 shows that at a 5 percent ozone product gas concentration, the future ozone production rate of 6,700 lb/day will exceed the firm ozone generator capacity of 5,100 lb/day (at 10 percent ozone concentration), not counting stand-by capacity. See also Table 3.11. For a variety of reasons, the existing ozone generators are challenged to make their 3,500 lb/day design capacity (at 5 percent ozone concentration). Replacing the existing ozone generation system with a new system that has a higher firm capacity is recommended, as is detailed at the end of this chapter.
An important part of the production system is the LOX storage and vaporization equipment. As Table 3.11 shows, the LOX storage tanks have a total volume of 181.5 tons (or 363,000 pounds). The future ozone production rate of 6,700 lb/day would require 67,000 pounds of LOX per day at an ozone product gas concentration of 10 percent, by weight.
The LOX tank total volume equates to approximately 5.4 days of storage, a relatively short duration for LOX storage when ozone is the primary disinfectant. When the ozone product gas concentration is reduced to 5 percent, a typical concentration at DLTWTF, LOX usage doubles to 134,000 lb/day and days of storage drops to approximately 2.7 days. This is an unacceptably short duration for LOX storage.
Either the new ozone system should deliver a firm capacity of 6,700 lb/day at an ozone product gas concentration of 10 percent, or the LOX storage equipment should be expanded to provide additional days of storage.
As shown in Table 3.11, the LOX vaporizers have a total capacity of 56,000 standard cubic feet per hour (scfh). The firm vaporizer capacity should be 42,000 scfh, with one of the four vaporizers out of service. This flow rate corresponds to approximately 85,000 pounds of oxygen per day.
Similar to the LOX storage tanks, the vaporizers are adequately sized for the future ozone production rate if an ozone product gas concentration of 10 percent by weight is used. However, if the concentration is 5 percent, the firm vaporization capacity of 85,000 scfh can't meet the LOX usage rate of 108,500 scfh.
3.3.4.5.3 Contact System
When the diffuser stones in the contactors were replaced in 2016, staff noted that calcium carbonate seemed to have precipitated on top of the diffusers. They also noted that significant Actiflo™ microsand had accumulated in the bottom of the contactors that required cleaning once per year. Since then, the accumulation was found to be more calcium carbonate deposit than microsand. Foam accumulation has also been observed. Chapter 2 contains recommendations for the equipment and contactor structures.
As Table 3.14 shows, the contact system and diffusers can accommodate the future hydraulic capacity of 140 mgd. At the future ozone production rate of 5,425 lb/day, a total
gas flow of approximately 552 scfm and 1,104 scfm must be diffused into the contactors at an ozone product gas concentrations of 10 percent and 5 percent, respectively. As Table 3.14 shows, adequate diffusers for the future ozone production rate are available for either product gas concentration.
| System | Existing Max Capacity(2) | Required Capacity at 140 mgd |
|---|---|---|
| Contactor Capacity | 150 mgd(1) | 140 mgd |
| Diffusers Capacity | ||
| 5 percent Ozone | 1344 scfm | 552 scfm |
| 10 percent Ozone | 1344 scfm | 1104 scfm |
Notes:
- (1) Based on each contactor's design capacity of 75 mgd.
- (2) Based on 448 diffusers in each contactor for a total of 896 diffusers, capable of providing up to 1.5 scfm each.
3.3.4.5.4 Destruct System
The destruct system performs as designed and raises no concerns about its performance or ability to expand. Chapter 2 contains minor recommendations about replacing the equipment.
As mentioned, each ozone destruct unit has a capacity of 600 standard cubic feet per minute (scfm). Also, since there are three, a firm capacity of 1,200 scfm is expected for the full ozone destruct system. With the maximum gas flow rate of 1104 scfm (see the above discussion on diffuser capacity), the destruct system has sufficient capacity for the future ozone production rate of 6,700 lb/day at either 5 or 10 percent ozone product gas concentration.
3.3.5 Settled Water - Pre-Filtration
3.3.5.1 Chemical Feed and Settled Water Quality
The filters are located downstream of the ozone process. Between sedimentation and filtration the following chemicals are added:
- Lime is added after Trains 5 through 8 only, and caustic is added to the low lift pump station header box. Data provided by the City show the average lime doses ranged from 26 mg/L in 2011 to 38 mg/L in 2014. The caustic dose ranged from 18.5 mg/L in 2014 to 42.4 mg/L in 2010.
- Hydrogen peroxide is added after ozone.
- Ammonia and chlorine are added seasonally to control bromate formation.
The influent water quality to the filters consists of the following:
- The pH applied on the filters is about 7.2 to 7.3. If lime is used to adjust the pH above 7.0 then turbidity on the filters becomes an issue. This also correlates to lime doses over 40 to 60 mg/L.
- Settled water turbidity is variable. Plant staff noted that problems with filtration usually occur when settled water turbidities are about 5 NTU. A rule of thumb for turbidity is that the ratio of suspended solids to turbidity ranges from 1.0 to 2.0. This means that the loading on top of the filters can be as high as 5 to 10 mg/L of suspended solids. The turbidity out of Trains 5 through 8 is typically around 1.5 NTU. The effluent turbidity from the Actiflo™ trains is typically around 0.2 to 0.3 NTU. Assuming a composite turbidity of approximately 1 NTU, a significant amount of turbidity is undoubtedly being developed between the basins and the filters.
Due to this type of operation and dosing strategy, two potential sources of solids can be precipitating on the filters:
- Iron from both carryover and post lime/caustic precipitation.
- Calcium carbonate from adding lime.
Carryover from both the conventional and the Actiflo™ processes occurs with an average of 1 to 2 mg/L of suspended solids (1 NTU) from the settling process. The pH is raised from 3.9 to 5.5 in the settling basin (depending on the raw TOC and necessary TOC removal) to the filter influent pH of 7.2 to 7.3.
Figure 3.12 shows that the pH increase reduces the solubility from 10-6 moles/liter of Fe to 10-10 moles/liter of Fe. This means that approximately 0.107 mg/L of ferric hydroxide will precipitate when the pH is changed from 3.9 to 7.3. This is an insignificant amount compared to the 1 to 2 mg/L of suspended solids from floc carryover.
Currently, lime is dosed to the combined effluent of Trains 5 and 6 and the combined effluent of Trains 7 and 8. Table 3.15 shows the doses required for various pH and alkalinity levels.

| Coagulation pH | Raw Water Alkalinity (mg/L As CaCO₃) | Lime Dose (Overall Dose) | Resulting pH In Combined Trains 5-8 | Calcium Carbonate Precipitation Potential (CCPP) Combined Trains 5-8 (mg/L as CaCO₃; |
|---|---|---|---|---|
| 3.9 | 46 | 36 | 10.0 | 55 |
| 3.9 | 143 | 60 | 7.14 | -8.31 |
| 5.5 | 46 | 27 | 9.87 | 40 |
| 5.5 | 143 | 60 | 9.04 | 37 |
Table 3.16 shows the results of blending after the water is combined with the effluent from the Actiflo™ process.
| Coagulation pH | Raw Water Alkalinity (mg/L As CaCO₃) | Lime Dose (Overall Dose) | Resulting pH In Combined | CCPP Combined Flow (mg/L as CaCO₃; |
|---|---|---|---|---|
| 3.9 | 46 | 36/0 | 7.3 | -8.0 |
| 3.9 | 143 | 60/45 | 7.3 | -5.6 |
| 5.5 | 46 | 27/0 | 7.3 | -6.5 |
| 5.5 | 143 | 60/25 | 7.3 | -6.2 |
With these scenarios, the amount of calcium carbonate that precipitates ranges from -13.9 to 150 mg/L (CCPPbefore + CCPPafter). This amount of calcium carbonate will not re-dissolve but will be deposited on the filters. Lower combined flow ratios between Trains 5 through 8 and Actiflo™ will cause less precipitation and lower alkalinities, which will in turn lower deposition.
High doses of lime will increase calcium concentrations and will also cause more deposition. High ratios of caustic soda will also reduce the amount of deposition of calcium carbonate, because the pH prior to blending will not be high enough to create a positive CCPP.
The City has a project in place to redesign the lime dosing strategy. Carollo has reviewed this design and provided input for improvement.
3.3.5.2 Settled Water Pipelines
The Ten States Standards require settled water pipeline velocities of 2 ft/sec or less. The velocities in the existing system range from 0.5 ft/sec to 6.77 ft/sec, depending on the settled water lines and plant flow rates. Chapter 4 describes these events in more detail.
The velocity in the settled water lines might cause precipitated calcium carbonate to settle. The lowest velocities are in the settled water line on the east side. This could be the reason that the smaller filters at times outperform the larger filters. The smaller filters are also operated at a lower loading rate because of the way the PLC was programmed to split the flows among all filters. Resolving the calcium carbonate precipitation should alleviate these concerns.
Table 3.17 reviews the Ten States Standards applicable to the settled water pipelines and indicates whether the DLTWTF is in compliance.
| Parameter | Actual Condition | Recommended Condition |
|---|---|---|
| Velocity of treated water in pipe and conduits to filters | 0.5 - 6.8 fps | < 2 fps |
| Influent pipes or conduits where solids loading is heavy, or following lime-soda softening | Settled water junction box provides cleanouts and straight alignment | Cleanouts and straight alignment piping |
3.3.6 Filtration Systems
3.3.6.1 Description
After primary disinfection with ozone, the settled water is sent to the filtration system to remove additional suspended solids, taste and odor compounds, TOC (particularly assimilable organic carbon), microorganisms, bacteria, and viruses. The DLTWTF's filter media is biologically activated carbon (BAC), which helps remove these constituents by using a biofilm that feeds on organics. Typically, the filters remove approximately 1 mg/L of TOC, predominantly in the form of DOC.
The system consists of 30 filters, 14 of which are large filters (16 ft by 32 ft). The remaining 16 are small filters (10 ft by 30 ft), all with 12 inches of sand and 22 inches of granular activated carbon (GAC). All filters consist of two bays on either side of their influent/effluent channel. Leopold underdrains with an IMS (Integral Media Support) cap support the media.
Table 3.18 shows the general design criteria for the filtration system.
| Parameter | Units | Value |
|---|---|---|
| No. of Small Filters | each | 16 |
| No. of Large Filters | each | 14 |
| Size of Small Filter | ft2 | 300 |
| Size of Large Filter | ft2 | 512 |
| Total Filter Surface Area | ft2 | 23,936 |
| Design Flow (two filters out of service) | mgd | 102.5 |
| Max Filtration Rate (w/ two large filters out of service) | gpm/ft2 | 3.25 |
| Empty Bed Contact Time (EBCT) | min | 4.5 |
| Operating Water Surface Elevation (WSEL) | ft | 45.5 |
| Bottom of the Filter Box | ft | 37.00 |
| Distance from Media to Operating WSEL (original design) | ft | 4.98 |
| Distance from Media to Bottom of Trough (original design) | ft | 1.56 |
| Distance from Media to Top of Trough (original design) | ft | 3.17 |
| Filter Media | ||
| Sand | ||
| Depth | in. | 12 |
| Effective Size | mm | 0.45-0.55 |
| L/d Ratio | - | 610 |
| GAC | ||
| Depth | in. | 22 |
| Effective Size | mm | 0.8-1.0 |
| L/d Ratio | - | 620 |
| Total L/d Ratio | - | 1230 |
| Filter Backwash | ||
| Backwash Rate | gpm/ft2 | 20 |
| Air Scour Rate | scfm/ft2 | 4 |
3.3.6.2 Filter Design and Characteristics
3.3.6.2.1 Biological Filtration
Biological filtration is the practice of managing, maintaining, and promoting biological activity on granular media in a filter to enhance the removal of organic and inorganic constituents before treated water is introduced into the distribution system. Several chemical and physical conditions can affect biofilter performance, including influent water quality, temperature, empty bed contact time (EBCT), chemical application, and backwashing procedures.
A biofilter design with sufficient EBCT is essential for biological removal of contaminants, such as TOC and taste-and-odor causing compounds such as MIB and Geosmin. At a design rate of 3.25 gpm/sq ft, the empty bed contact time for the filters is 4.2 minutes through the GAC and 2.3 minutes through the sand. These parameters are within typical ranges for drinking water biofilters in North America. The Ten States Standards for biological filtration are guidelines, not specific requirements.
3.3.6.2.2 Filter Box
The filter box for all of the filters is 10 feet deep, which meets the Ten States Standard requirement of 8.5 feet deep, although industry standards typically recommend 13 feet. A 10-foot deep box can be effective, given the optimization of the box's dimensions. Figure 3.13 and Figure 3.14 show the filter box's dimensions and critical aspects of the filter layout. Table 3.19 compares the actual dimensions with the optimal dimensions.
| Category | Actual Condition (ft) | Recommended Condition (ft) |
|---|---|---|
| Distance from operating water level to media | 4.92 | 6-8 |
| Distance from media to the bottom of the wash water trough | 1.56 | 2.1-2.8 |
| Distance from media to the top of the trough | 3.17 | 6 |
| Filter depth | 10 | At least 8.5 |
The distance from the operating water level to the top of the media provides the driving force through the media which is currently over one foot shorter than the optimal distance. This reduces driving head and limits the allowable head loss. Ultimately, this limits the filter run time if head loss controls filter backwashes.

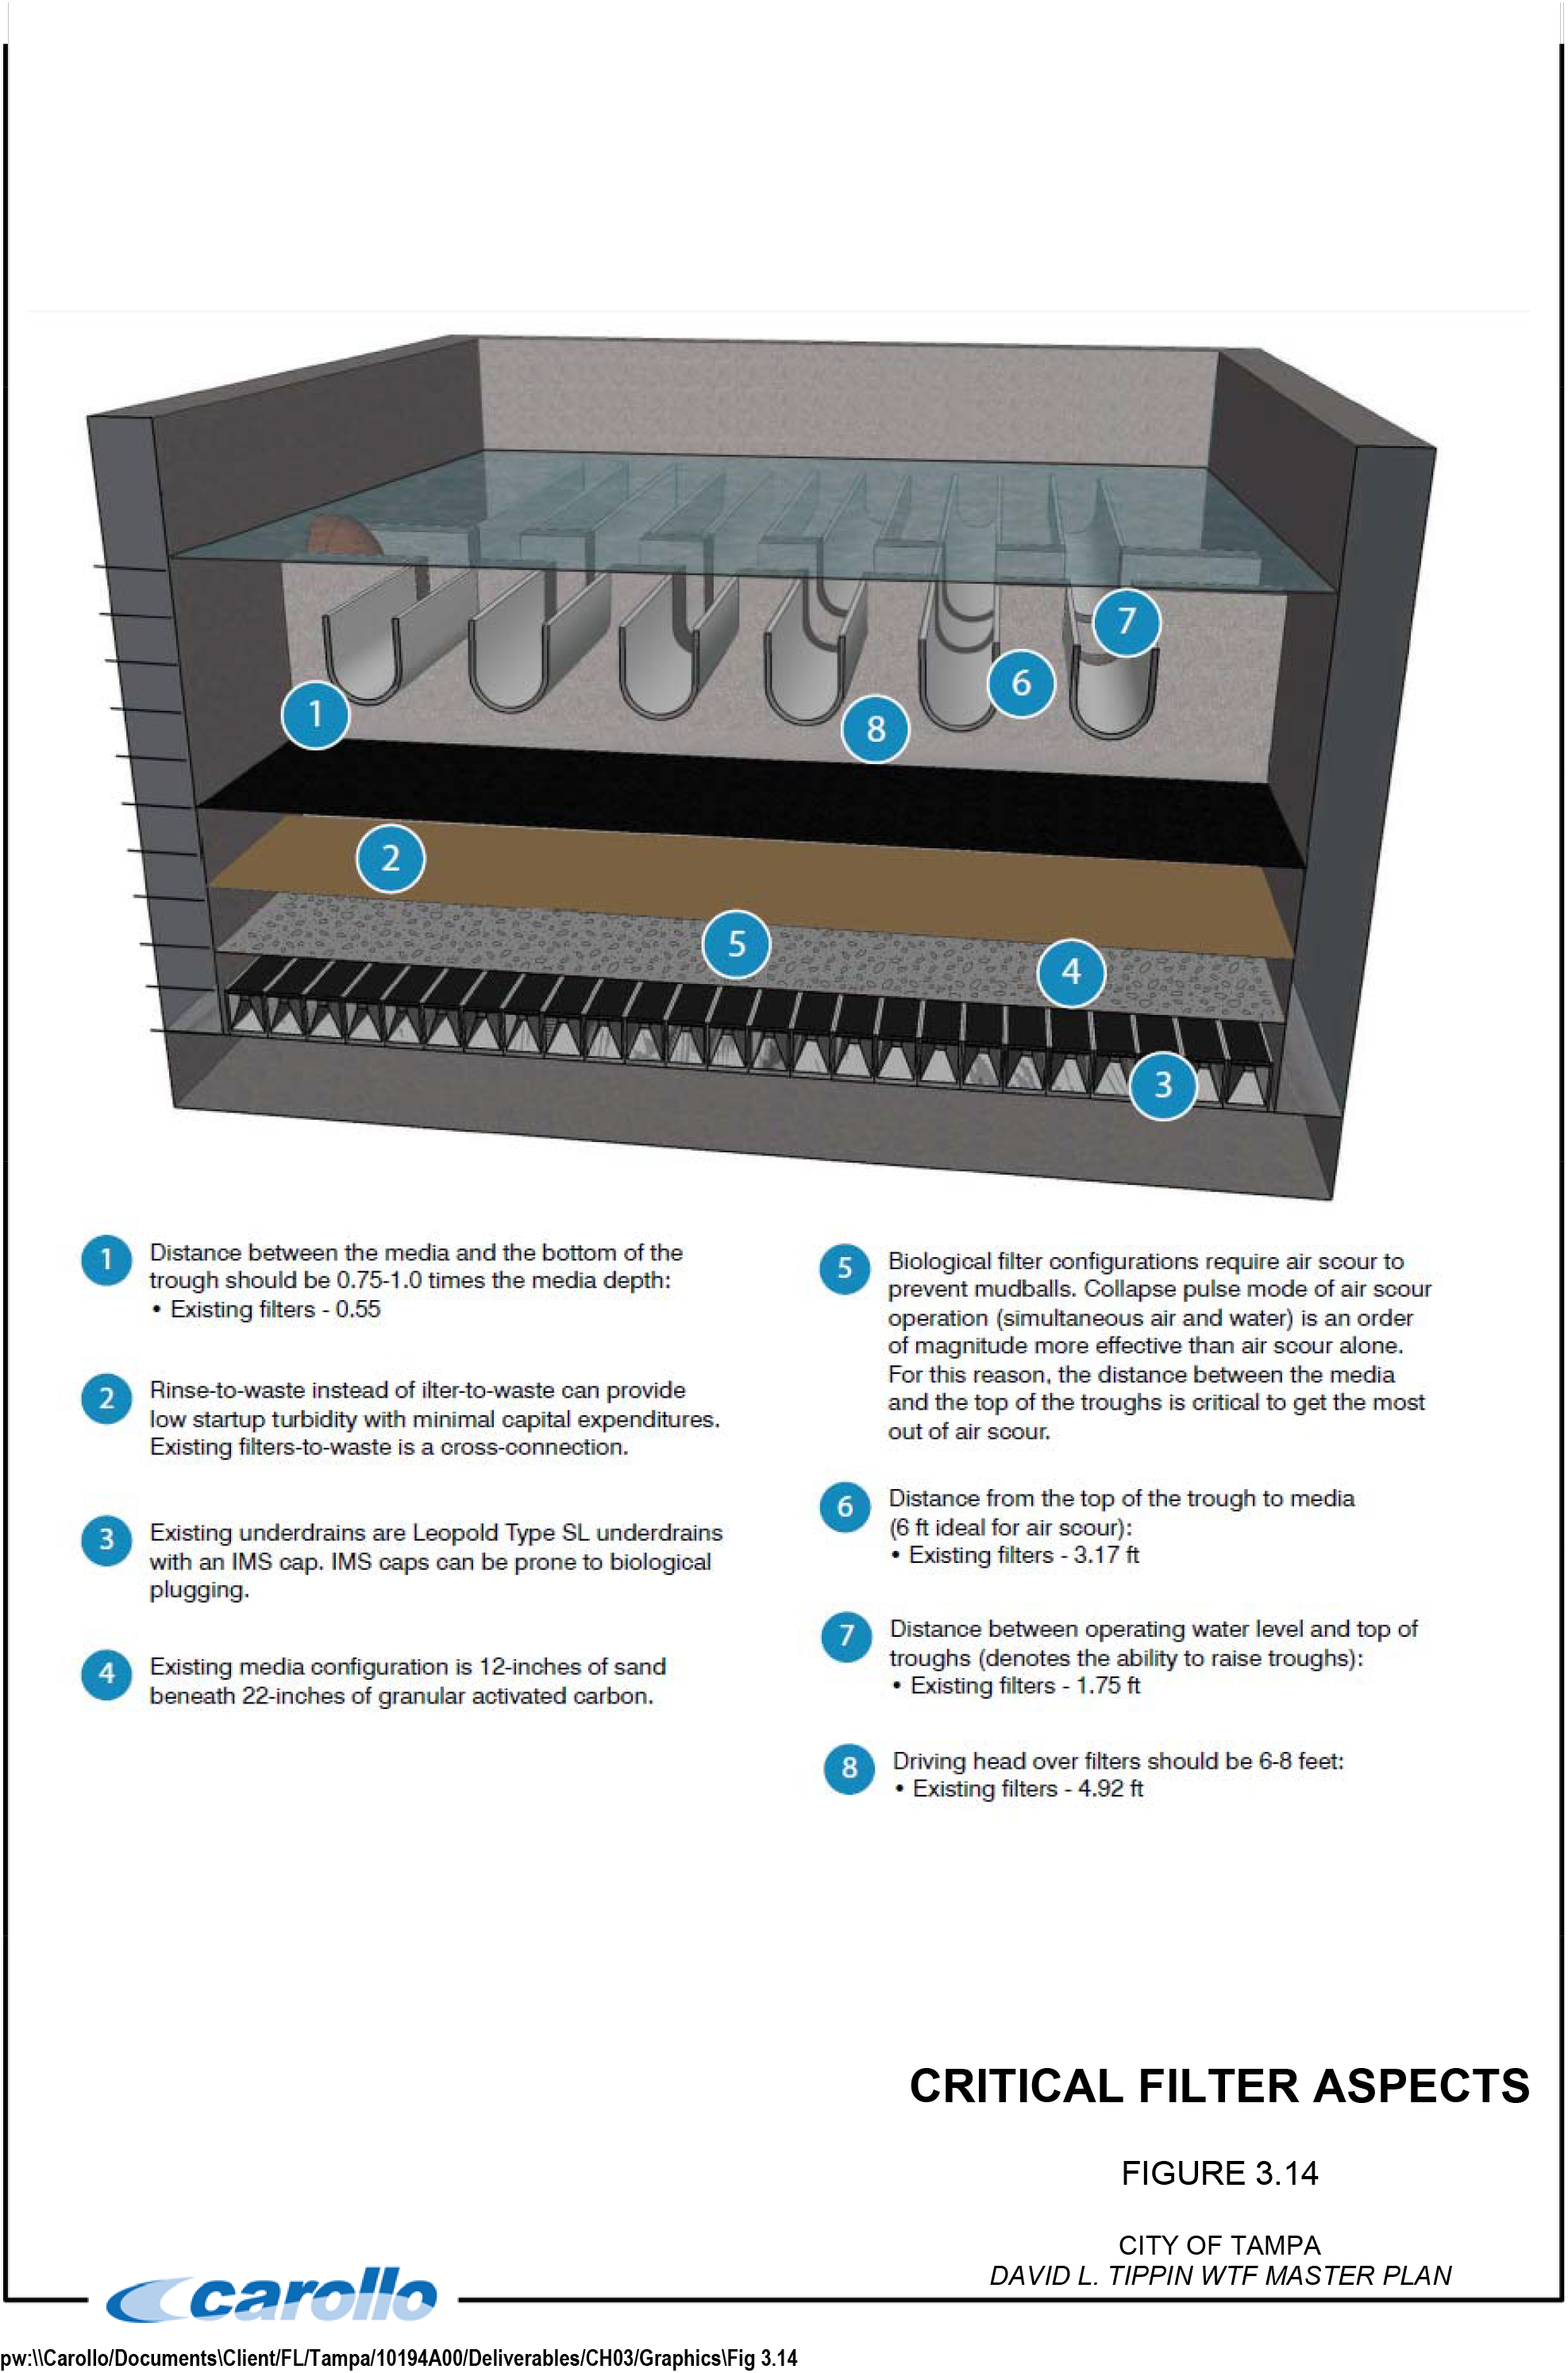
- Distance between the media and the bottom of the trough should be 0.75-1.0 times the media depth:
- Existing filters -0.55
- Rinse-to-waste instead of filter-to-waste can provide low startup turbidity with minimal capital expenditures.
- Existing filters-to-waste is a cross-connection.
- Existing underdrains are Leopold Type SL underdrains with an IMS cap.
- IMS caps can be prone to biological plugging.
- Existing media configuration is 12-inches of sand beneath 22-inches of granular activated carbon.
- Biological filter configurations require air scour to prevent mudballs.
- Collapse pulse mode of air scour operation (simultaneous air and water) is an order of magnitude more effective than air scour alone.
- For this reason, the distance between the media and the top of the troughs is critical to get the most out of air scour.
- Distance from the top of the trough to media (6 ft ideal for air scour):
- Existing filters -3.17 ft
- Distance between operating water level and top of troughs (denotes the ability to raise troughs):
- Existing filters -1.75 ft
- Driving head over filters should be 6-8 feet:
- Existing filters -4.92 ft
CRITICAL FILTER ASPECTS FIGURE 3.14 CITY OF TAMPA DAVID L. TIPPIN WTF MASTER PLAN
The distance from the media to the bottom of the washwater trough is a common concern considering backwash effectiveness when the filter media expands above the bottom of the backwash troughs. Kawamura (1997), showed adequate washing of the filter media occurred even when the bed expand into the bottom of the trough.
The distance from the media to the top of the trough separates the filter media from the backwash waste washwater trough. Greater distances reduce the likelihood of losing media over the troughs during a backwash.
In addition to carrying over media during backwash fluidization, having a significant distance between the media and the trough is desirable to achieve a simultaneous air/water wash cycle. This simultaneous cycle must be completed before the water goes over the troughs. Otherwise, excessive media loss will occur.
Table 3.20 reviews the Ten States Standards that apply to this discussion and indicates whether the DLTWTF is in compliance.
- The filters also need to meet the following requirements:
- Vertical walls within the filter.
- No protrusion of the filter walls into the filter media.
- On-line turbidimeters installed on the effluent line from each filter.
- A flow rate controller that can provide gradual rate increases when placing the filters back into operation (although the rate of change is not known).
- A meter indicating the instantaneous rate of flow.
- An indicating loss of head gauge for each filter.
- Influent and effluent sampling taps for each filter.
- Head room to permit normal inspection and operation.
- The filters do not meet the following requirements:
- Measures for cross-connection control and construction to prevent cross connections and common walls between potable and non-potable water. (Filter-to-waste is directly connected to the waste washwater gullet and is therefore a cross connection.)
- Prevention of flooding by providing overflow.
- Trapped effluent to prevent backflow of air to the bottom of the filters.
- Safety handrails or walls around all filter walkways. (They are around most but not all.)
| Design Requirement Summary | Actual Condition | Recommended Condition |
|---|---|---|
| Rapid rate gravity filters upstream requirement | Coagulation and ozone pretreatment | Pretreatment |
| Filtration rates range | Below 4 gpm/ft2 | 2 to 4 gpm/ft2 |
| No. of filter units required | 30 | At least 2 |
| Filter capacity with one unit out of service | Up to 102 mgd | Meet plant design capacity |
| Cover by superstructure | No cover | Typically not required when disinfection through the filters is not in the process |
| Minimum water depth over the surface of the filter media | 4.9 feet | 3 feet |
| Prevention of floor drainage to the filter | No curb around the filter, the filters are elevated 2+ feet above grade | Minimum 4-inch curb around the filters |
| Walkways around filters, to be not less than 24 inches wide | 30-inches | ≥24-inches |
3.3.6.2.3 Filter Underdrains
The underdrains associated with the filters serve the following purposes:
- Support the filter media without media migration through the underdrains.
- Provide even distribution of back washwater.
- Provide even distribution of air scour.
- Collect filtered water and transport it to the filter effluent piping.
The existing underdrains are Leopold Universal Type SL underdrains with an IMS cap. The IMS cap is made of high-density polyethylene beads sintered together and is approximately 0.63 inches thick with a porosity of 30 to 50 percent.
The cap eliminates the need for support gravel and helps with backwash distribution. The cap's head loss is 3 to 4 inches at a backwash flow rate of 15 gpm/sq ft and 4.5 to 5.5 inches at a backwash flow rate of 21 gpm/sq ft. Figure 3.15 shows the head losses across the underdrain at different backwash rates, with the IMS cap.
The Leopold O&M manual recommends that the differential pressure across the underdrain not exceed 750 pounds per square foot (psf) (or 5.2 pounds per square inch [psi]). The challenge with filters, especially biological filters, is the potential for filter plugging over time.
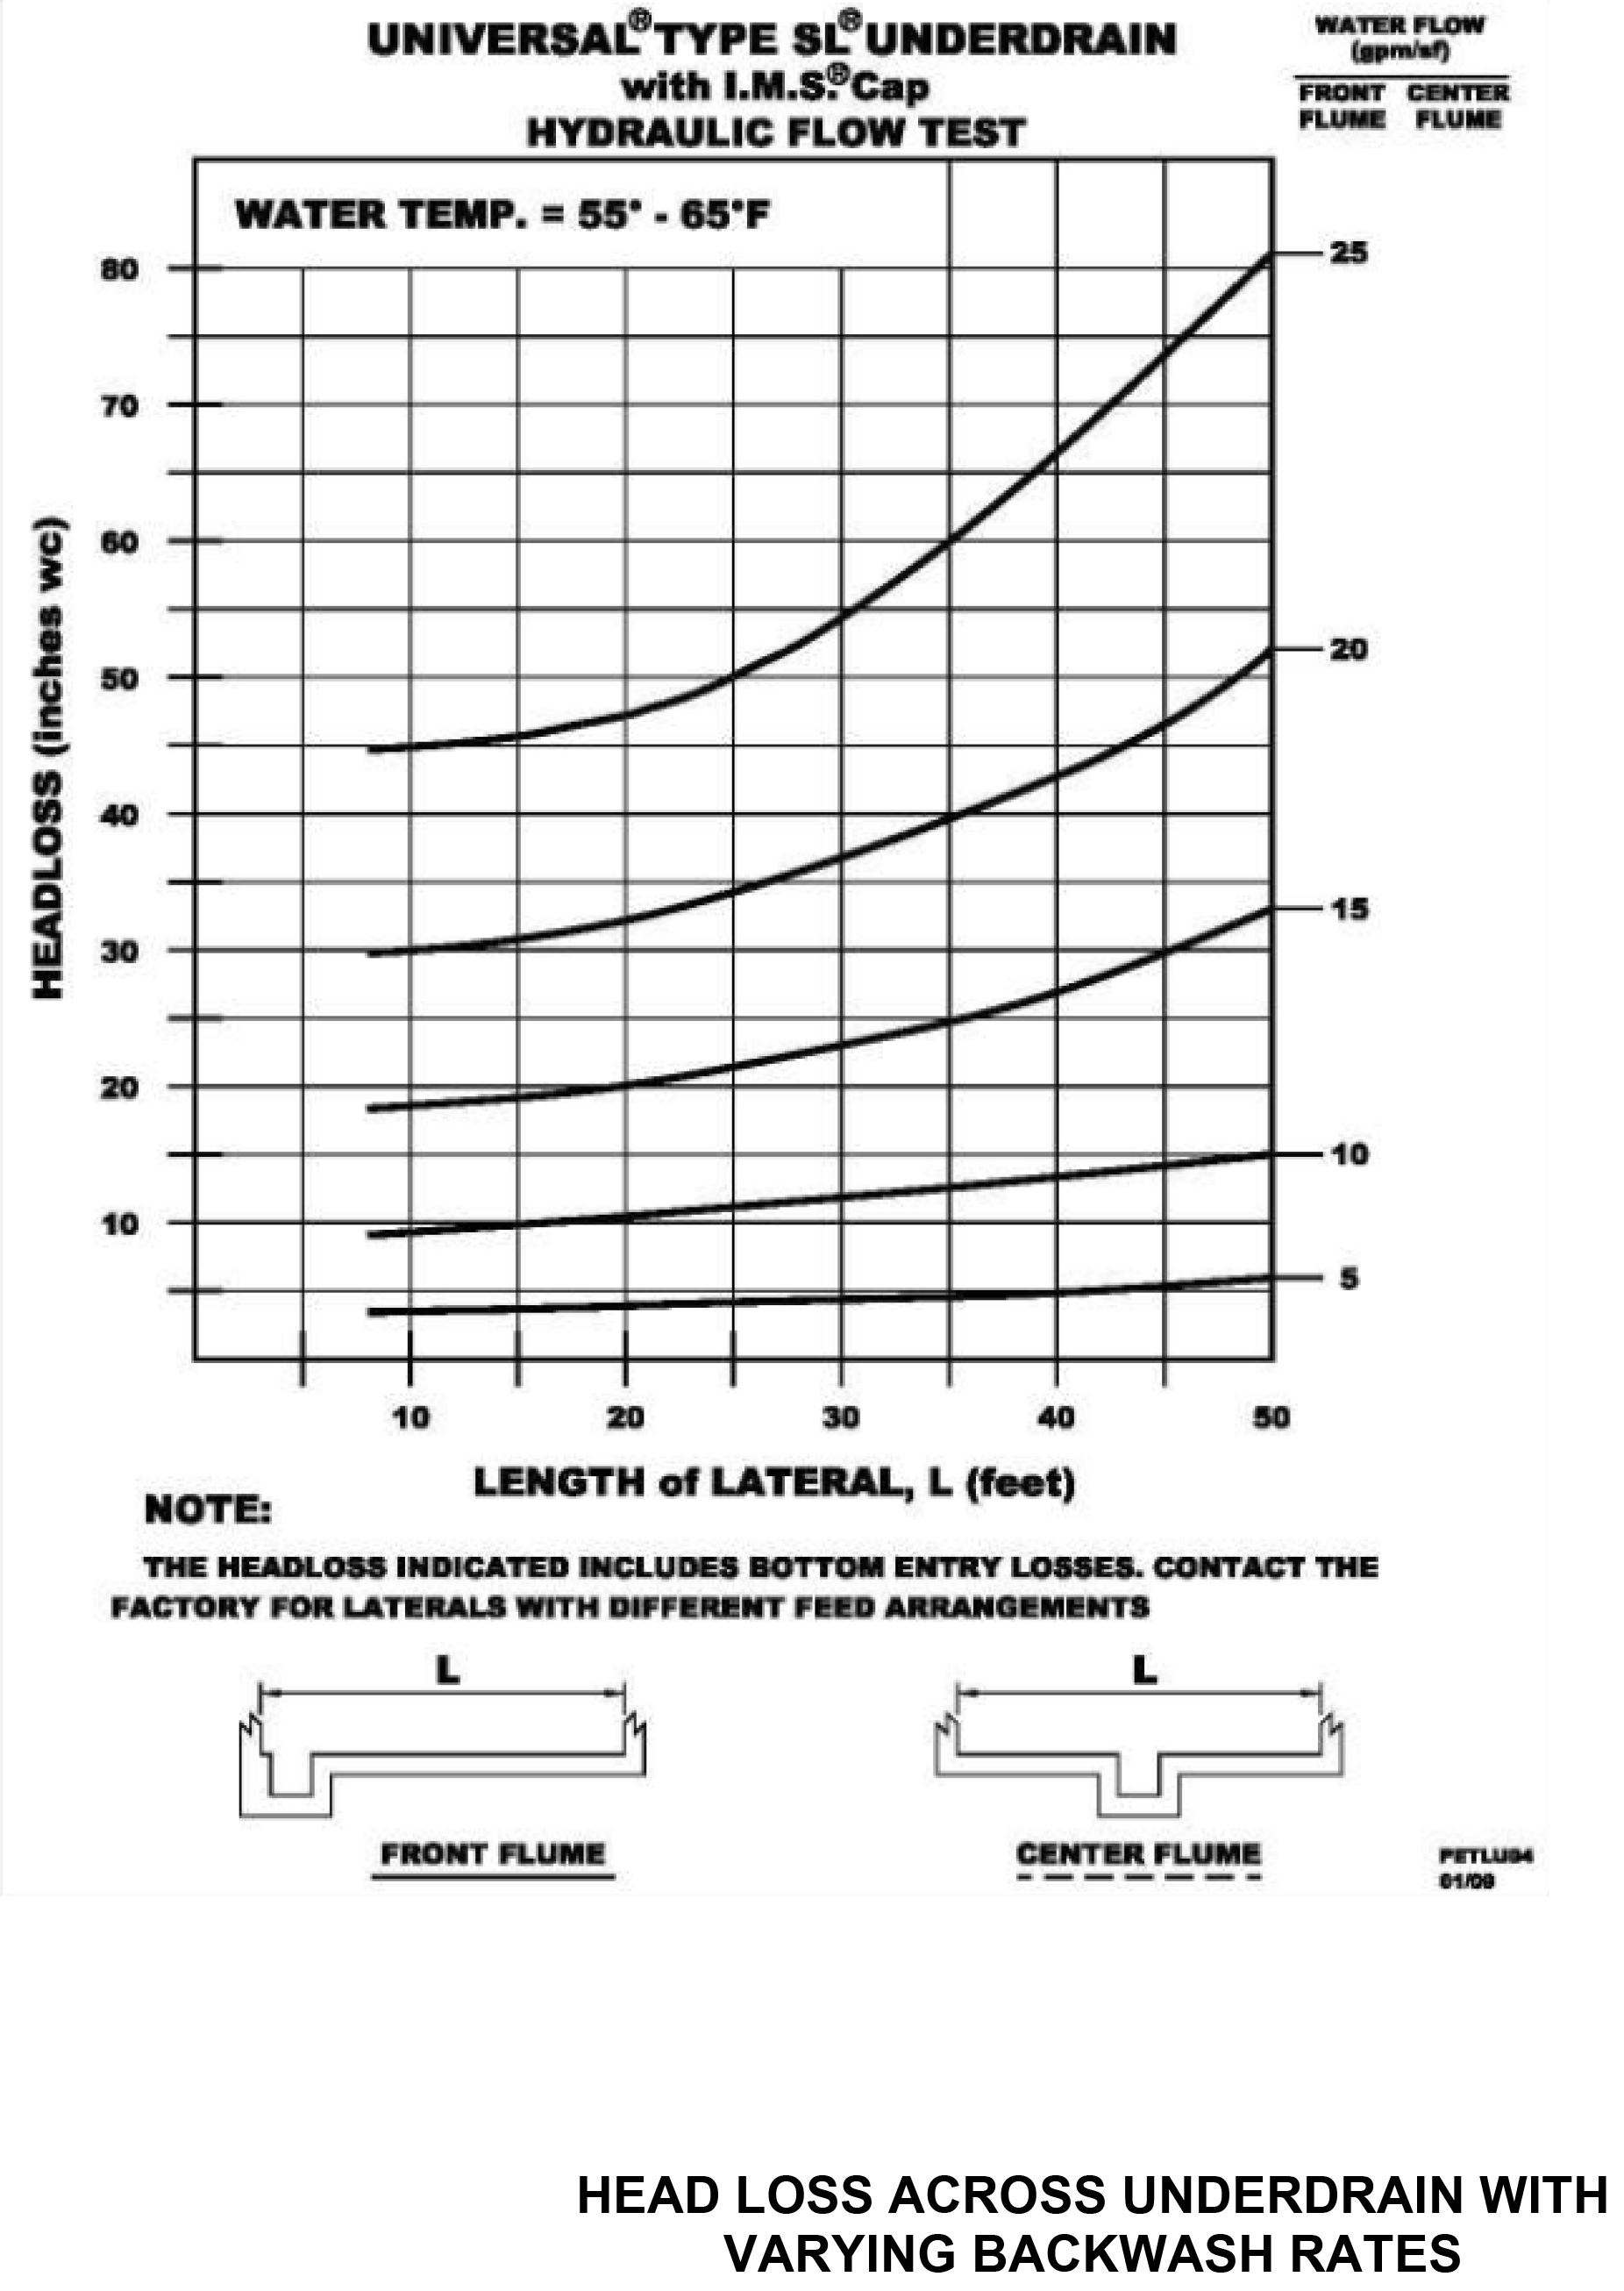
CITY OF TAMPA
DAVID L. TIPPIN WTF MASTER PLAN
Based on discussions with the operators, the backwash pump pressure can be as high as 15 psi during normal operation. This is not an issue if the filter underdrains are not plugged, because the losses across the filter underdrains are not above 5.2 psi. When the filter is plugged, however, the flow is limited through the underdrain, and all head losses occur in this location (across the underdrain).
With the backwash pumps' direct connection to the filters, underdrain over-pressurization can occur. The same situation can occur with the air scour blowers, since they are positive displacement blowers, unless the pressure relief valve on the blowers is set to relieve at pressures less than 5.2 psi. Figure 3.16 shows the air losses across the underdrains with different air scour rates.
Another potential concern with the IMS cap is that the porous underdrain clogs from calcium carbonate deposition. While the underdrains were not inspected during the condition assessment work, performing such an investigation is prudent before implementing any filter renovation project.
This concern was reinforced when severe calcium carbonate deposition was observed downstream of the filters in the Hawkey Box and associated equipment. This deposition meant that calcium-depositing water either existed as it passed through the filtration system or was created subsequent to filtration by adding pH-increasing chemicals to the filtered water.
In 2006, Filters No. 1, 4, and 6 all experienced uplifting failures. These failures were attributed to grout issues and were corrected. These failures are a demonstration of the forces involved in the backwashing process.
Figure 3.17 shows the poor distribution of backwash water for different lateral lengths. The small filters have lateral lengths of 10 feet that cause maldistribution of about 0.4 percent, and the large filters have a lateral length of 16 feet that causes a maldistribution of about 0.7 percent, assuming a backwash rate of 18 gpm/sq ft.
Regarding the Ten States Standards' recommendations for underdrain design, the DLTWTF meets the following requirements:
- Porous plate bottoms shall not be used where iron or manganese may clog them or with waters softened by lime.
- Head loss should be minimized in the manifold and laterals.
- Washwater should be evenly distributed and the rate of filtration should be even over the entire area of the filter.
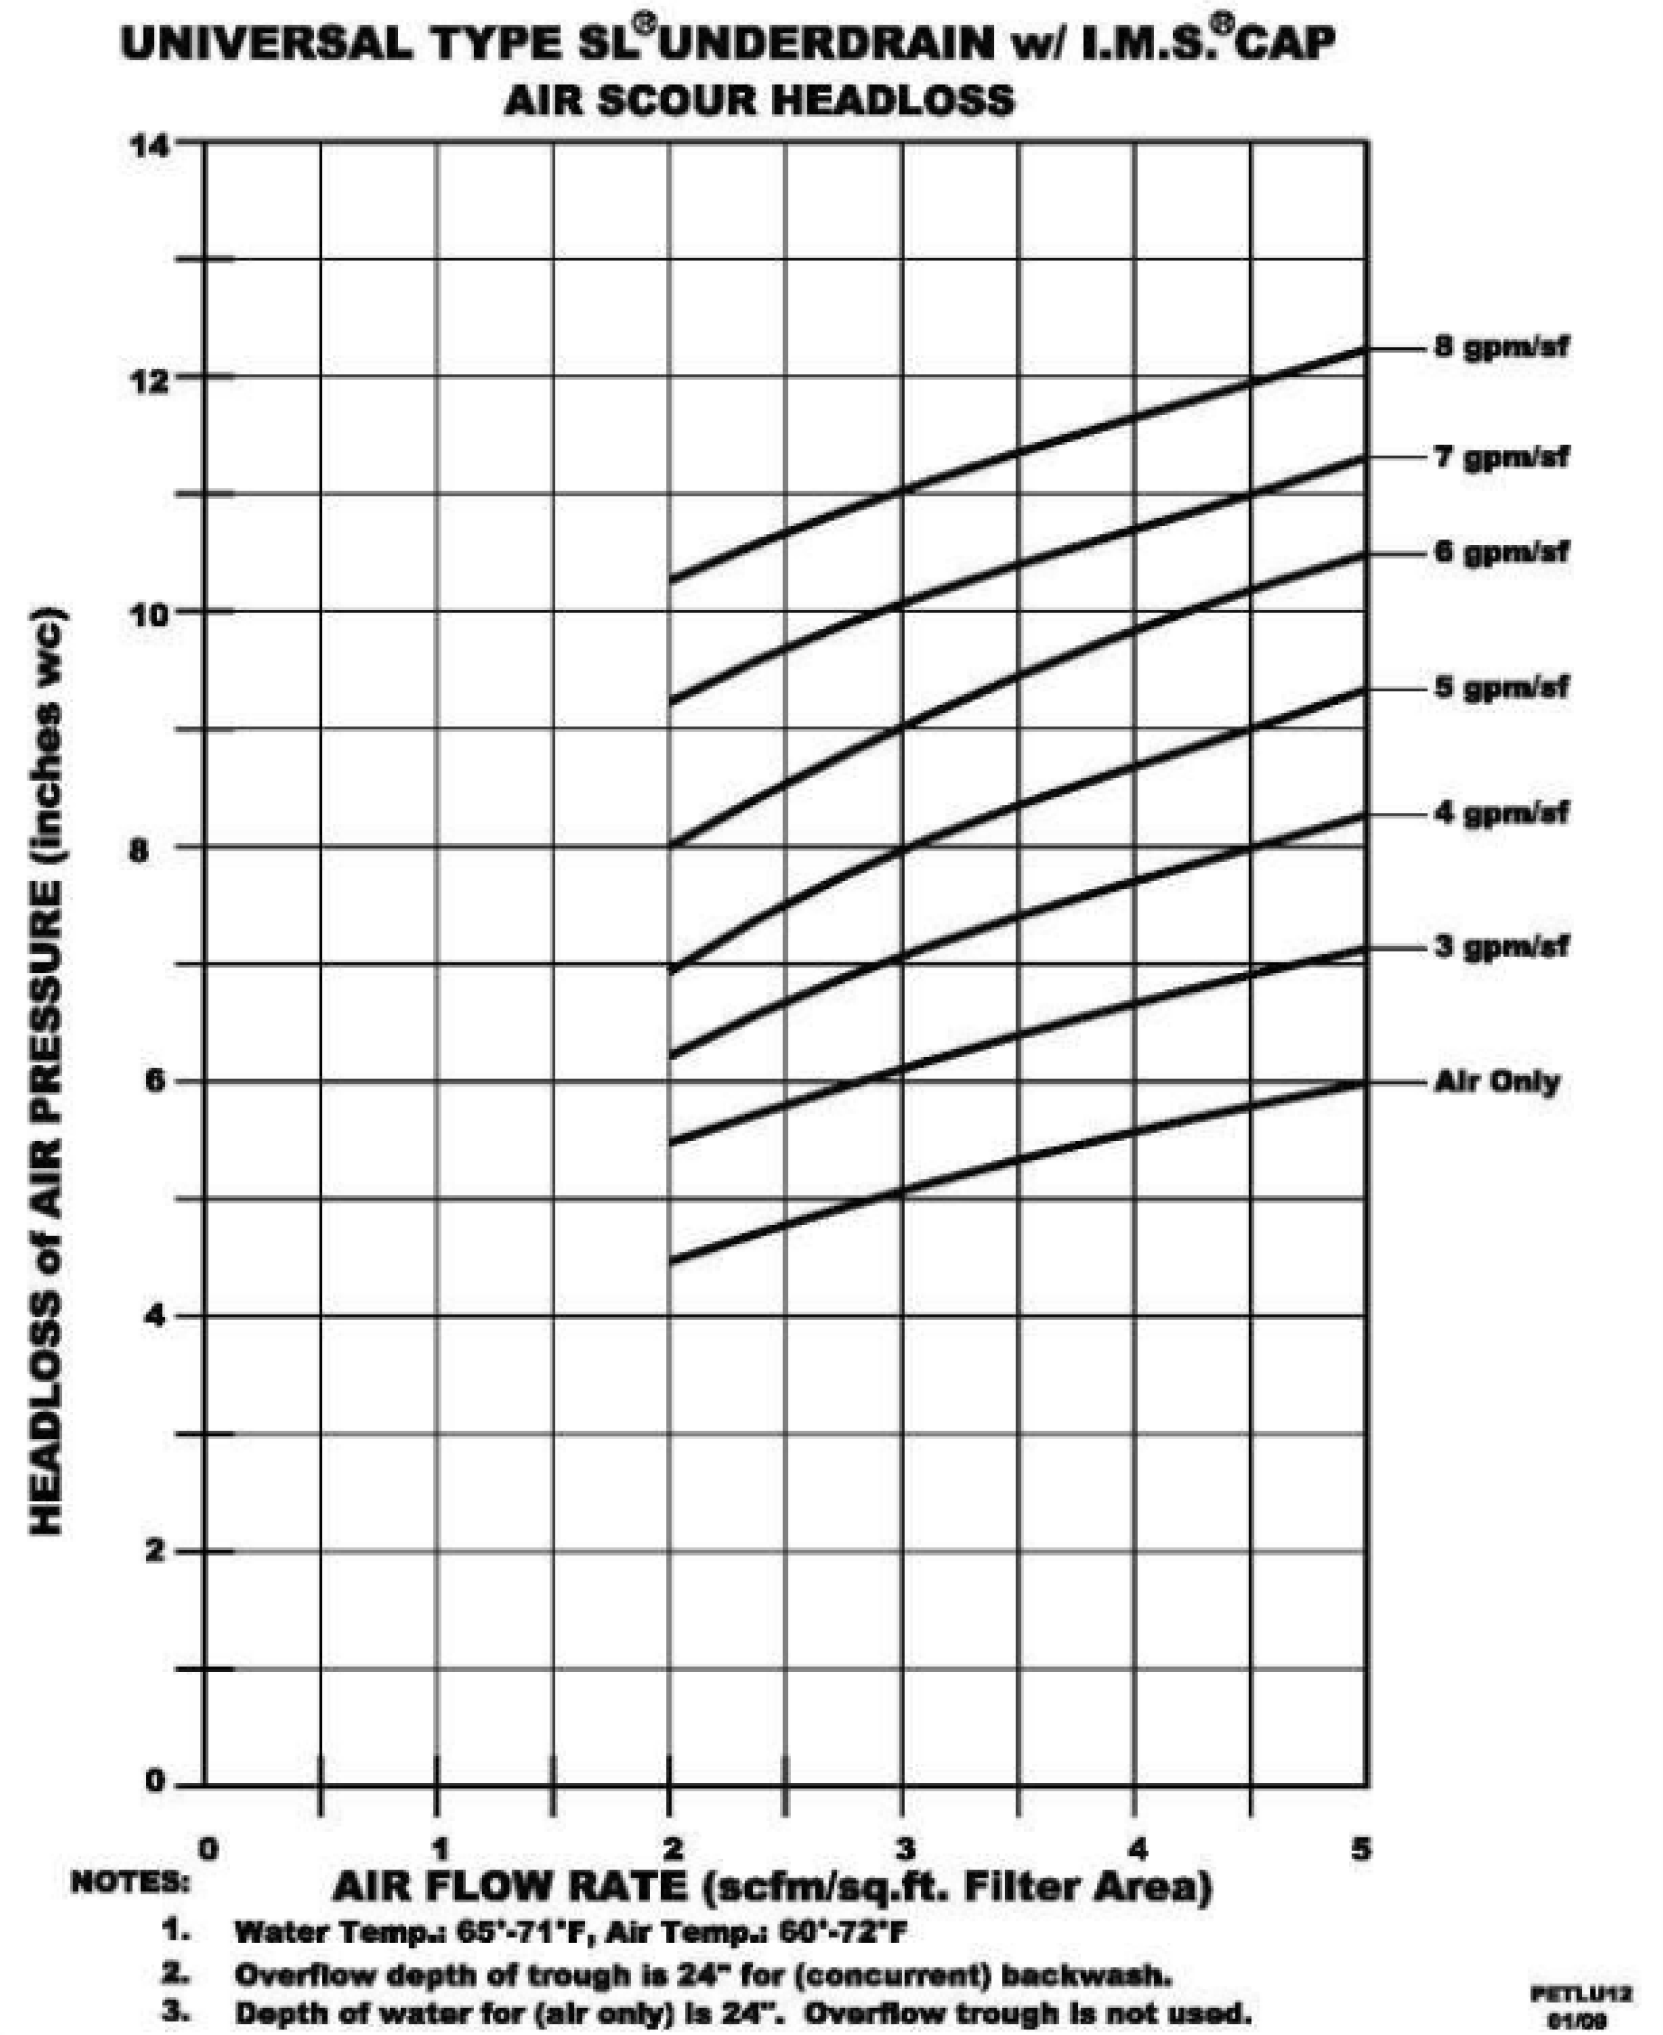
CITY OF TAMPA
DAVID L. TIPPIN WTF MASTER PLAN

3.3.6.2.4 Filter Media
As stated previously, the filter media configuration consists of 22 inches of GAC and 12 inches of sand. Based on the effective size, the uniformity coefficient, and the specific gravity, the fluidization rate of the GAC is 13.8 gpm/sq ft, and the fluidization rate of the sand is 17.2 gpm/sq ft.
Although the backwash rate of the sand should be higher than the backwash rate of the GAC, the difference should not be more than 2 gpm/sq ft. The difference between the media is 3.4 gpm/sq ft. The media is not matched, and the sand does not likely fluidize when the backwash rate is 15.6 gpm/sq ft (current rate based on 8,000 gpm backwash). Figure 3.18 shows the required backwash rates for different temperatures.
Table 3.21 reviews the Ten States Standards applicable to this discussion and indicates whether the DLTWTF is in compliance.
In addition to the Ten States Standards, the DLTWTF meets the following requirements:
- For GAC, provisions must be provided for a free chlorine residual and adequate contact time in the water following the filters and prior to distribution.
- Periodic treatment (hydrogen peroxide) of filter material must be provided to control bacterial and other growth.
3.3.6.2.5 Waste Washwater Troughs
The larger filters (1,024 sq ft) have 6 troughs per filter, and the smaller filters (600 sq ft) have 4 troughs per side. The larger filter troughs are 2 feet wide and are spaced 5 feet-4 inches apart, meaning the distance between troughs is 3 feet-4 inches. The smaller filter troughs are 1 foot-9 inches wide, and are 4 feet-3 inches apart.
Based on visual observation, the wash water troughs are large enough for the current backwash rate. Based on the dimensions of the larger filters' troughs, their capacity is approximately 1,900 gpm (for a total 1/2 cell capacity of 11,400 gpm (22.2 gpm/sq ft). Based on the dimensions of the smaller filters' troughs, their capacity is approximately 1,500 gpm (for a total 1/2 cell capacity of 7,500 gpm (25 gpm/sq ft).

| Parameter | Actual Condition | Recommended Condition |
|---|---|---|
| Media Type (must be approved by the reviewing authority) | Clean silica sand | Clean silica sand or other natural synthetic media free from detrimental chemical or bacterial contaminants |
| Total depth of GAC | 22 inches, not applicable at this time | 24 - 30 inches |
| A uniformity coefficient of the smallest material | 1.40 | <1.65 |
| Media effective size and depth | 12 inches of sand with an effective size range 0.45 - 0.55 mm | A minimum of 12 inches of media with an effective size range 0.45 - 0.55 mm |
| Sand with an effective size | 0.45 - 0.55 mm | 0.45 - 0.55 mm |
| Sand with a uniformity coefficient | 1.40 | <1.65 |
| Sand with a specific gravity | >2.5 | >2.5 |
| Sand with an acid solubility | <5 percent | <5 percent |
| L/d Ratio(1) for mono-media and dual-media filters using polymer aid | 1,230 | ≥1,000 |
| (1) The depth of media divided by the effective size (L/d) is a dimensionless value that measures relative storage capacity of the filter. | ||
The DLTWTF meets the following Ten States Standards that apply to washwater troughs:
- The bottom elevation above the maximum level of expanded media during washing (currently, with a 30 percent bed expansion, the bottom of the troughs are above the expanded media).
- A two-inch freeboard at the maximum rate of the wash.
- The top edge level and all at the same elevation.
- Spacing so that each trough serves the same number of square feet of filter area.
- Maximum horizontal travel of suspended particles to reach the trough not to exceed three feet (actual distance is 2.13 feet).
3.3.6.3 Filter Backwash Design and Characteristics
3.3.6.3.1 Backwash Initiation and Backwash Cycle
Filter backwashing is required to remove accumulated solids and biological solids from the filters. Filter backwashing occurs when the following filter criteria are met:
- Effluent turbidity of greater than 0.15 NTU.
- Filter head loss of greater than 6 feet.
- Filter run time of greater than 96 hours.
As noted in the write-up for filter backwashing, the surge tank will overflow at 10 feet, and the operator should stop washing when the surge tank level reaches 9 feet. When operated in hand mode, the filter backwashing process consists of the steps listed below. (The automatic process is assumed to be similar.) Figure 3.19 shows the SCADA screen for the filter.
- Check the surge tank to make sure that the level is low enough for a backwash.
- Place the normal/calibration switch in calibrate mode.
- Place all filter valves in hand.
- Close the influent valve. This begins the drawdown process.
- Put the effluent valve in hand and set the flow rate to 4.0 mgd. When a filter's current flow rate is less than 4.0 mgd, it is recommended that the rate matches the current flow rate. Problems with filter effluent turbidity spikes occur at the end of filter runs and when rates are increased.
- Open the drain valve once the filter level reaches 2.4 feet. The datum (0 ft) is assumed to be the top of the filter media. If correct, the drawdown level would be approximately 8 inches below the top of the trough. Confirm that the drain valve is completely open.
- Close the effluent valve at a level of 1.2 feet (2.0 feet below the trough). The right side of the filter is assumed to be backwashed first.
- Close the left and right side manifold valve.
- Open the right air scour valve.
- Turn on the air scour blower at a rate of 1,400 scfm.
- Operate the air scour blower for 90 seconds.
- Turn off the air scour blower.
- Shut the right air scour valve.
- Open the filter washwater valve.
- Open the right side manifold valve.
- Turn on the backwash pump at low rate backwash flow rate (2,900 gpm), which is equivalent to 5.66 gpm/sq ft. This rate will occur for 30 seconds. Turn up the
- Turn up the backwash flow rate to 5,500 gpm (middle rate). The system will pass through this rate without pausing.
- Turn up the backwash flow rate to 8,000 gpm at high rate backwash flow rate for 5.5 minutes.
- Turn down the backwash flow rate with the same timing as before and pass through the middle and low rate backwash flows.
- Repeat the procedure for the left side of the filter.
- Set the filter-to-waste valve open for 60 seconds at the end of the backwash.
Figure 3.20 shows setpoints from SCADA. The larger filters (No. 1 through 14) take 30 minutes to backwash, and the smaller filters (No. 15 through 30) take 20 minutes. From the backwash procedures, the backwash process is estimated to use approximately 94,000 gallons of backwash water and generate 101,700 gallons of waste washwater (because the gullet is emptied). For the smaller filters, the backwash process is estimated to use 55,000 gallons for backwash water and generate 59,590 gallons of waste washwater.
Given these numbers, the washwater unit run volumes (UBWV) are approximately 92 gallons per sq ft. This is well below the typical UBWV volumes of 200 gallons per sq ft and indicates that backwash durations are low.
The filter media is backwashed with chloraminated water that has been dechlorinated with sodium bisulfite. Dechloramination with sodium bisulfite takes approximately 3 minutes. Further investigation to understand the detention time between the point of sodium bisulfite addition and the filters is recommended.
3.3.6.3.2 Air Scour
The existing air scour system consists of two positive displacement blowers, each with a capacity of 2,560 scfm at 7 psi. This could provide up to 4.26 scfm/sq ft for the smaller filters and 5 scfm/sq ft for the larger filters. Because the blowers are positive displacement blowers, over-pressurization of the filters has a higher potential than with a centrifugal blower.
Air scour applies air evenly to the filter at the beginning of a backwash to dislodge solids off of the media surface. There are two methods for this:
- Air scour as a stand-alone step in the backwash process.
- Simultaneous air/water wash.

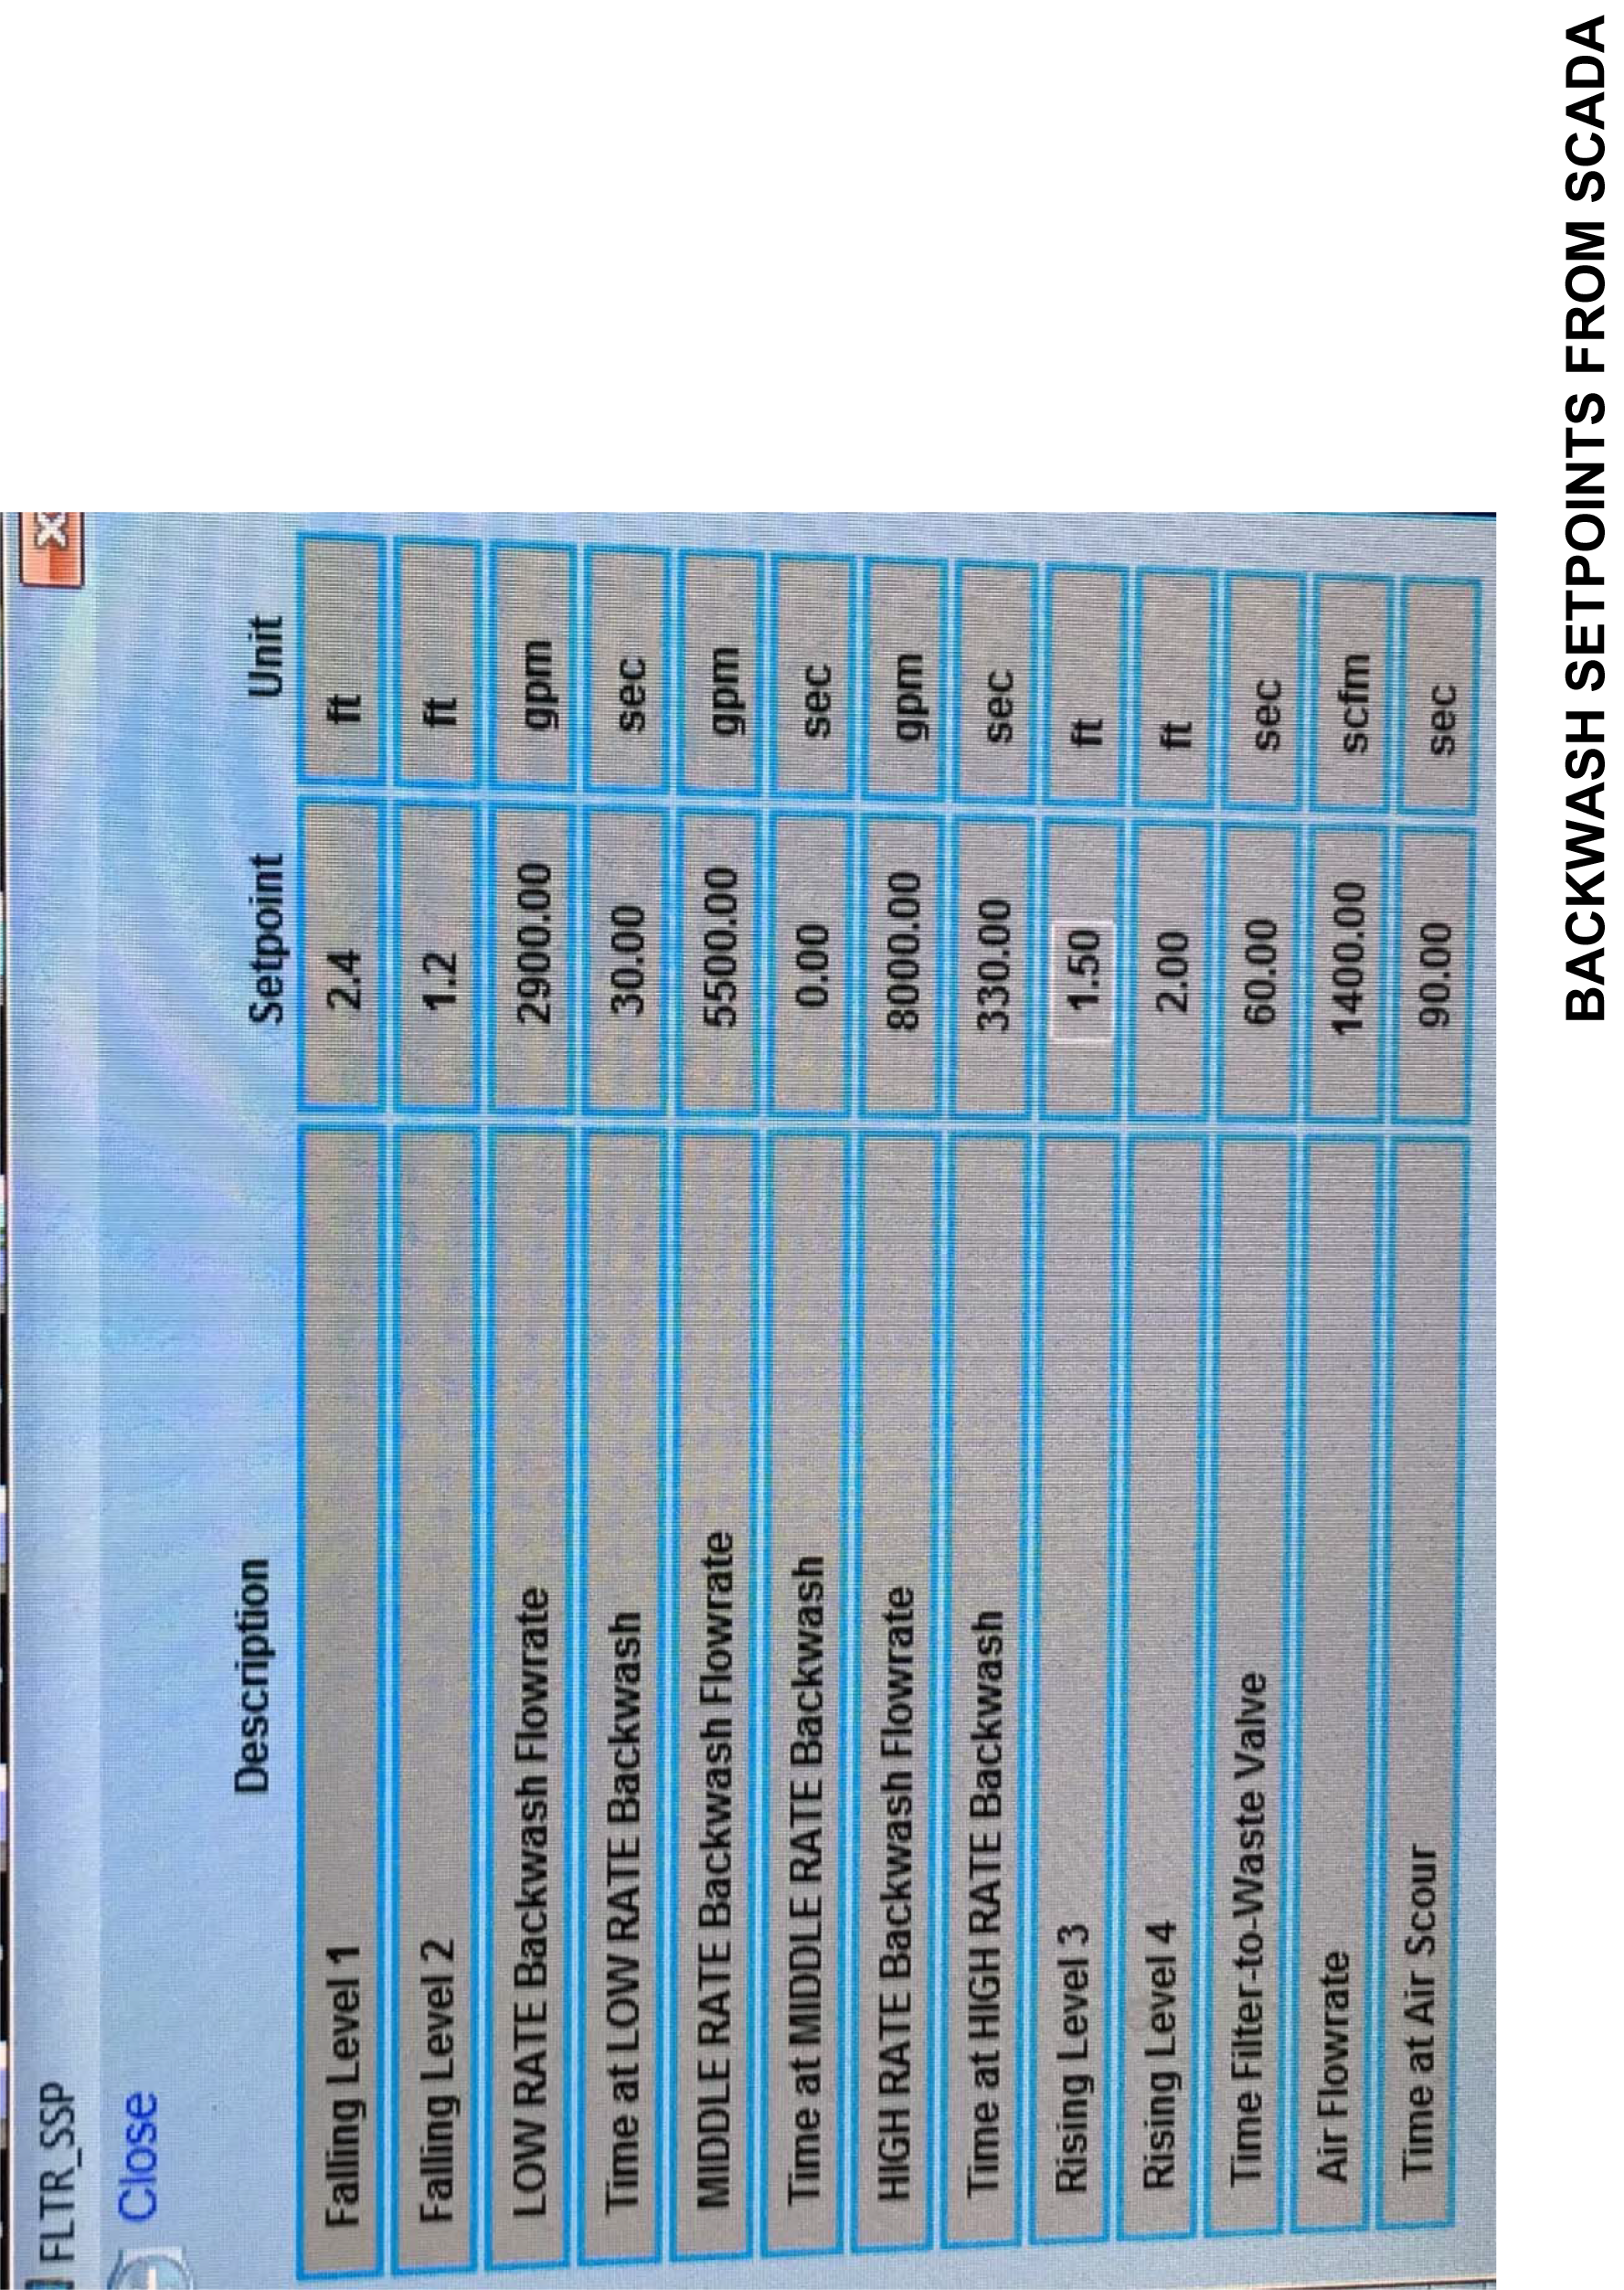
To prevent washing out the media, the plant currently does a simultaneous air/water wash, and then a stand-alone air scour step. The stand-alone air scour method is equivalent to a surface wash and cleans the media and the surface of the GAC to a degree. However, the air channelizes through the media, which limits cleaning.
The challenge with air scour only is that it gives the impression of violent agitation throughout the bed, even though the agitation only occurs in the top 6 to 10 inches. Simultaneous air/water wash is a better way to clean because air scour occurs while a subfluidized backwash occurs. This subfluidization wash collapses the channels of air, forcing the air on a different path through the media. In addition, the subfluidization separates the media particles and leads to a scrubbing action between grains of GAC and sand.
The rate of air scour should be 2.5 to 3 scfm/sq ft for ordinary filters and 3 to 4 scfm/sq ft for deep beds. Since the City is at the transition point between normal and deep bed filters, the rate for the air scour should be close to 3 scfm/sq ft. The current air scour rate is 1,400 scfm for the filters which equates to 2.3 to 2.7 scfm/sq ft.
The DLTWTF meets the following Ten States Standards that apply to filter backwash air scour:
- Air scouring must be followed by a fluidization wash sufficient to restratify the media.
- Air must be free from contamination.
- Air scour distribution systems should be placed below the media and supporting bed interface.
- Piping for the air distribution system shall not be flexible hose, which will collapse when not under air pressure; it shall also not be a relatively soft material that might erode at the orifice opening with the passage of air at high velocity.
- Air delivery piping shall not pass down through the filter media, nor shall there be any arrangement in the filter design that would allow for short-circuiting between the applied unfiltered water and the filtered water.
- The filter underdrains shall be designed to accommodate air scour piping when the piping is installed in the underdrain.
- Design consideration for maintenance and replacement of air delivery piping.
- A method for avoiding excessive loss of the filter media during backwashing must be provided. (This is avoided by air scour alone with backwash flow.)
Conversely, air flow for air scouring the filter must be 3 to 5 scfm/sq ft (0.9 to 1.5 m3/min/m2) when the air is introduced in the underdrain. The system is designed to provide this. However, it does not currently operate this way.
3.3.6.3.3 Backwash Water System
The backwash system includes two separate backwash pumps. These pumps and the backwash supply control valves were replaced in 2000. The pumps are directly connected to the backwash line that feeds the filters.
Based on limited information, the design point of these pumps is believed to be 8,000 gpm at 37 feet of TDH. At the design point, these pumps could provide 13.3 (small filters) to 15.6 gpm/sq ft (large filters). This would be acceptable for the GAC but not for the sand.
Assuming head losses are much lower, these pumps could provide up to 9,500 gpm (and stay on the curve). This would provide backwash rates of 15.8 to 18.5 gpm/sq ft. The shutoff head for these pumps is estimated to be 29 psi. The backwash system has a magnetic flowmeter that measures the backwash flow.
The DLTWTF meets the following Ten States Standards that apply to backwash water systems:
- Filtered water provided at the required rate by washwater tanks, a washwater pump, from the high service main, or a combination of these.
- Washwater pumps in duplicate unless an alternate means of obtaining washwater is available.
- A washwater regulator or valve on the main washwater line to obtain the desired rate of filter wash with the washwater valves on the individual filters open wide.
- A flow meter, preferably with a totalizer, on the main washwater line or backwash waste line, located so the operator can easily read it during the washing process.
- Backwash shall be operator initiated; automated systems shall be operator adjustable.
- No less than 15 minute wash of one filter at the design rate of wash.
- The backwash water delivery system must have 15 gpm/sq ft of filter surface area; however, when air scour is provided, the backwash water rate must be variable and should not exceed 8 gpm/sq ft, unless operating experience shows that a higher rate is necessary to remove scoured particles from filter media surfaces.
- Minimum rate of 15 gpm/sq ft, consistent with water temperatures and specific gravity of the filter media; a rate of 20 gpm/sq ft or a rate necessary to provide for a 50 percent expansion of the filter bed is recommended.
However, appropriate measures should be taken for cross-connection control, even though the filter-to-waste is a cross connection, as mentioned previously. The system design is also required to prevent rapid changes in backwash water flow. This, though, is unknown for the DLTWTF.
3.3.6.4 Existing Process Performance and Ability to Expand
The City of Tampa provided filter performance data on the filters from May 22, 2016 through June 26, 2016. This data included the following information:
- Filter effluent flow rate.
- Filter head loss.
- Filter turbidity.
- Filter effluent valve position.
From this data, filters No. 6 and 25 were selected for analysis. Filter No. 6 is a large filter (1,024 sq ft), and Filter No. 25 is a small filter (600 sq ft). Data was gathered and analyzed in 7 minutes intervals. The data was then examined and broken into separate filter runs based on the reset of head loss.
The following analyses were completed for the filters:
- Head loss over the entire filter run.
- Unit filter run volume (UFRV) versus average flow rate.
- Clean bed head loss (at the beginning of the filter run) versus initial flow rate.
- UFRV versus filter loading rate.
- UFRV versus loading rate (for both filters).
- Clean bed head loss versus loading rate (for both filters).
Figure 3.21, Figure 3.22, Figure 3.23, and Figure 3.24 show the head loss versus filter run for filter No. 6 and 25.
These graphs show the following:
- The tail at the end of the filter run that trends downward is because the City turns the filter flow rate down to produce additional water from the filter.
- Between 5/22 and 6/5, the filter head loss reached 6 feet after 23 to 39 hours for filter No. 6 and 18 to 32 hours for filter No. 25.
- Between 6/13 and 6/26, the filter head loss reached 6 feet after 25 to 35 hours for filter No. 6 and 22 to 40 hours for filter No. 25.
- Although the slope of the head loss accumulation increased slightly as the filter run progressed, the head loss curve was somewhat linear.
- Figure 3.25 compares the UFRV and the loading rate for both filters over the entire range of the data. The UFRVs ranged from 3,228 to 5,726 gallons per sq ft for filter No. 6 and from 2,816 to 9,529 for filter No. 25. In June, an unknown event occurred that doubled the UFRVs for filter No. 25.
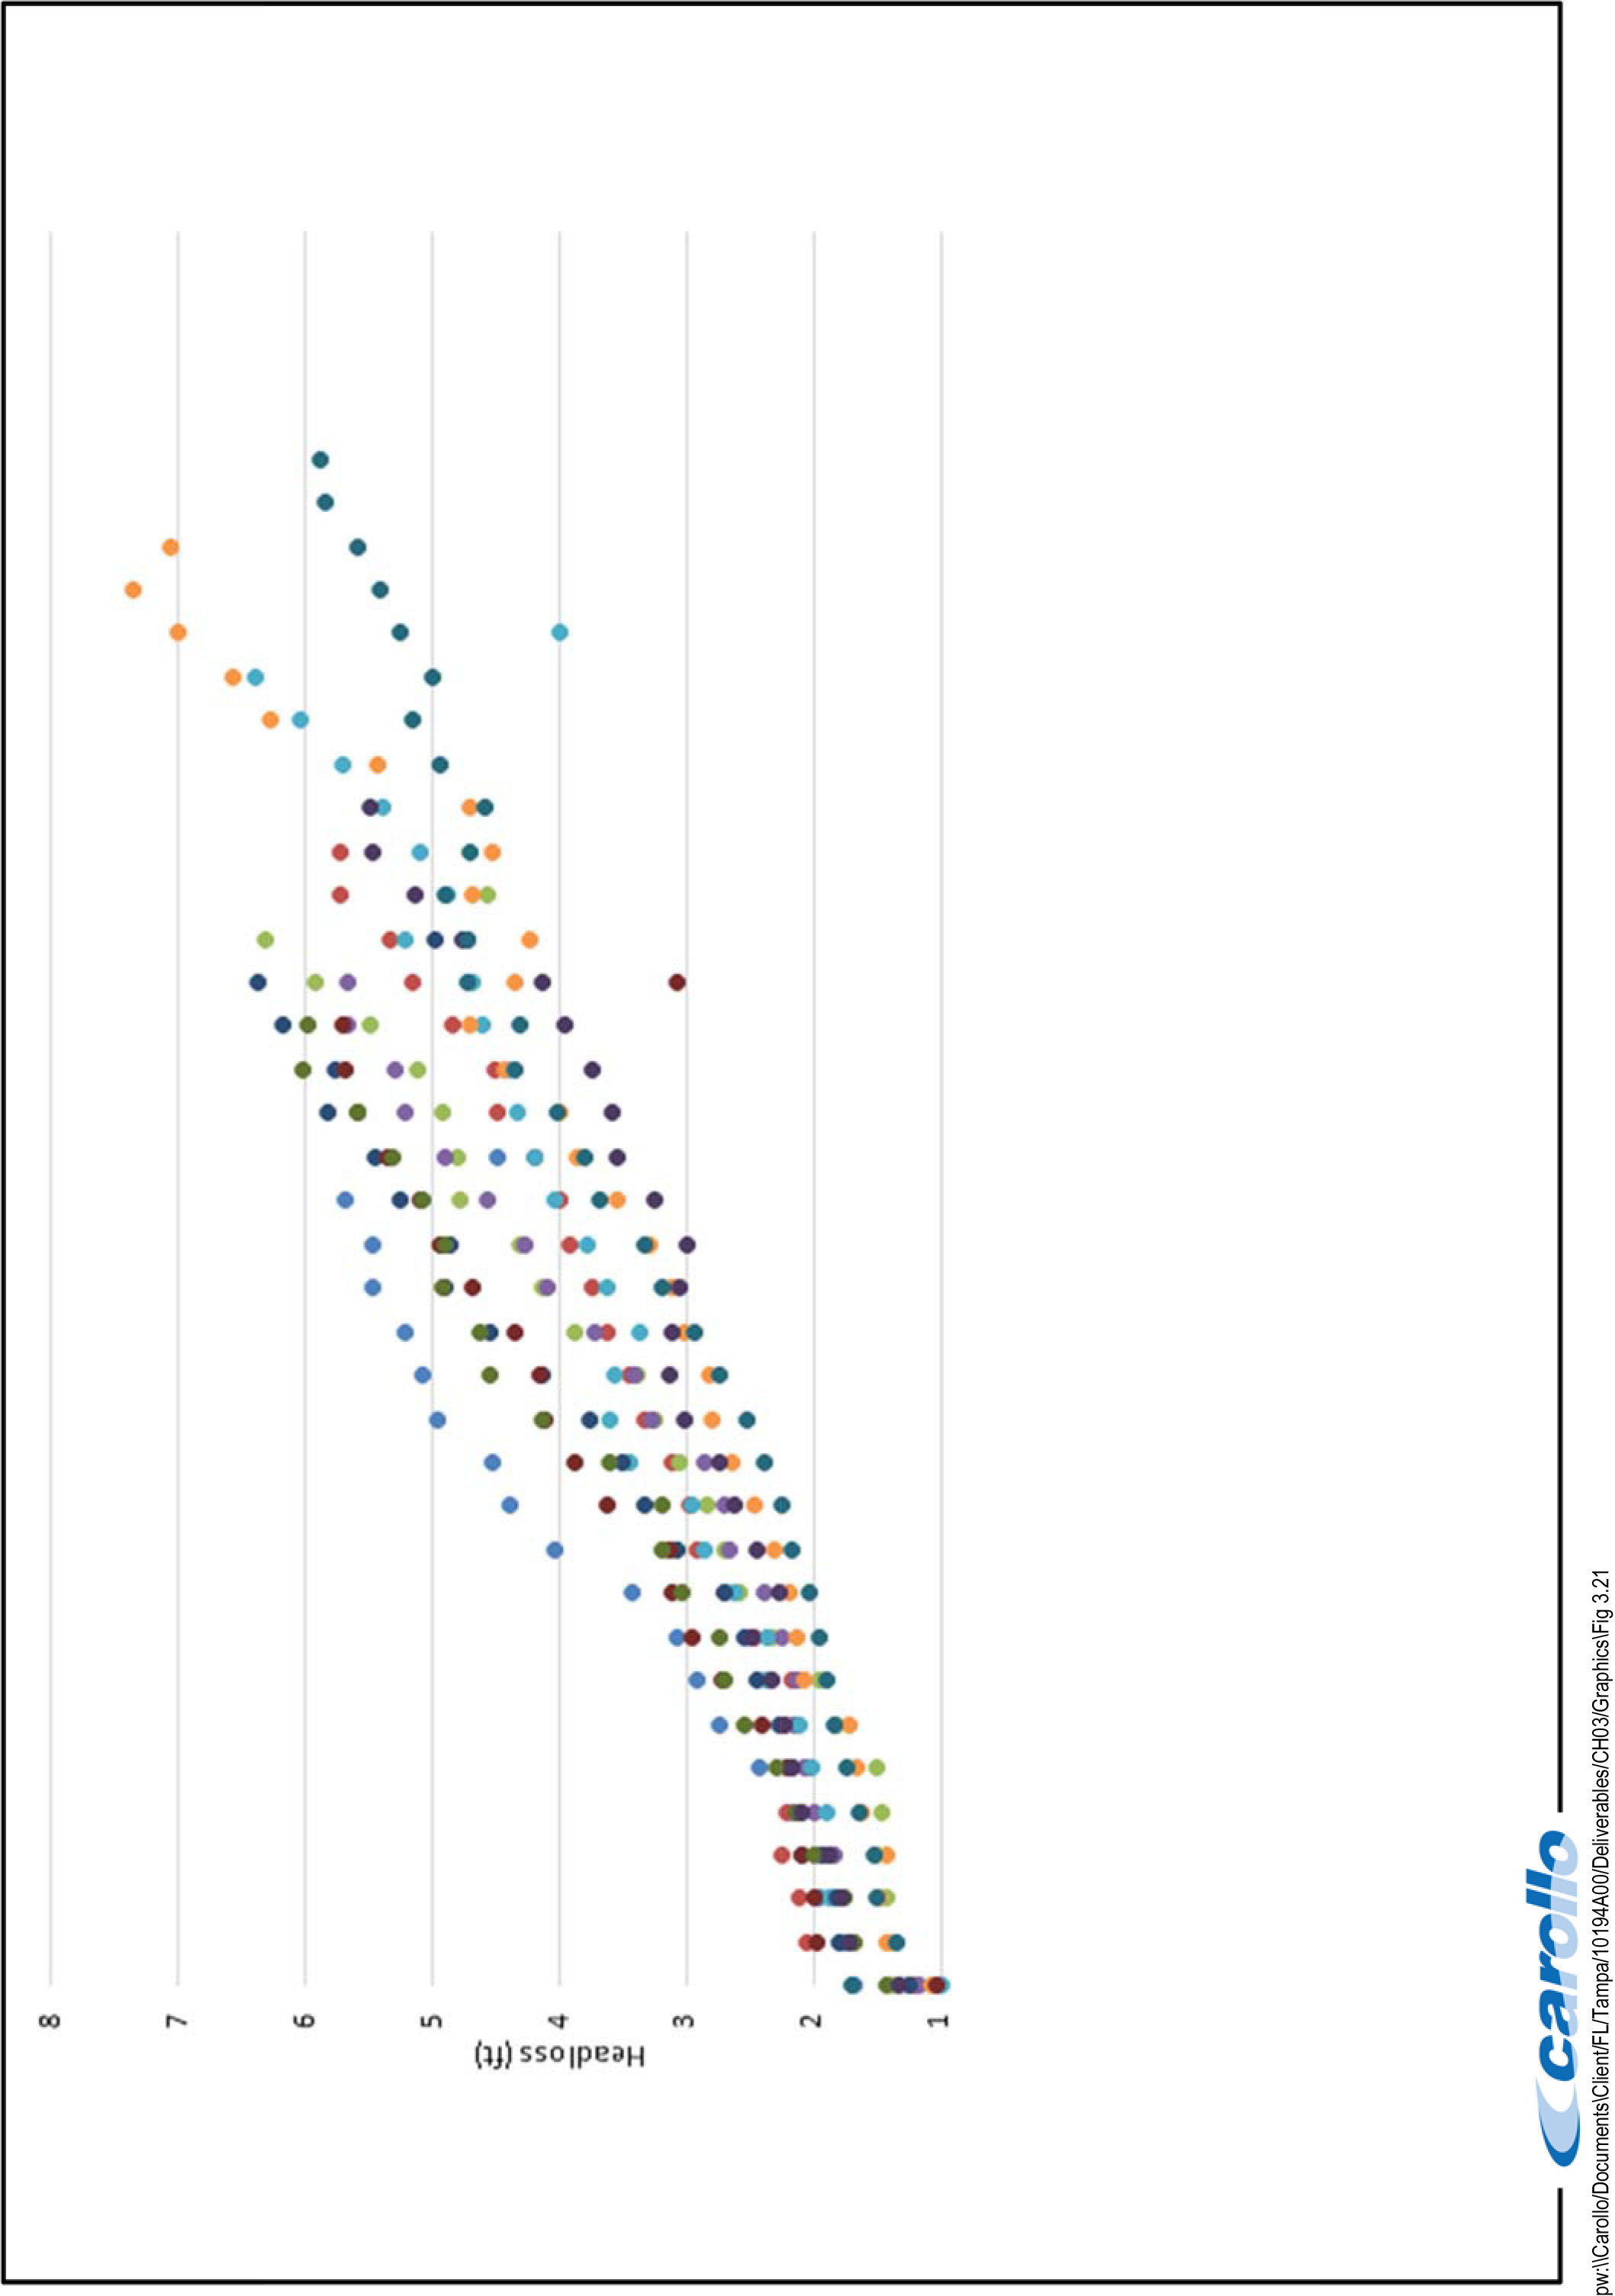
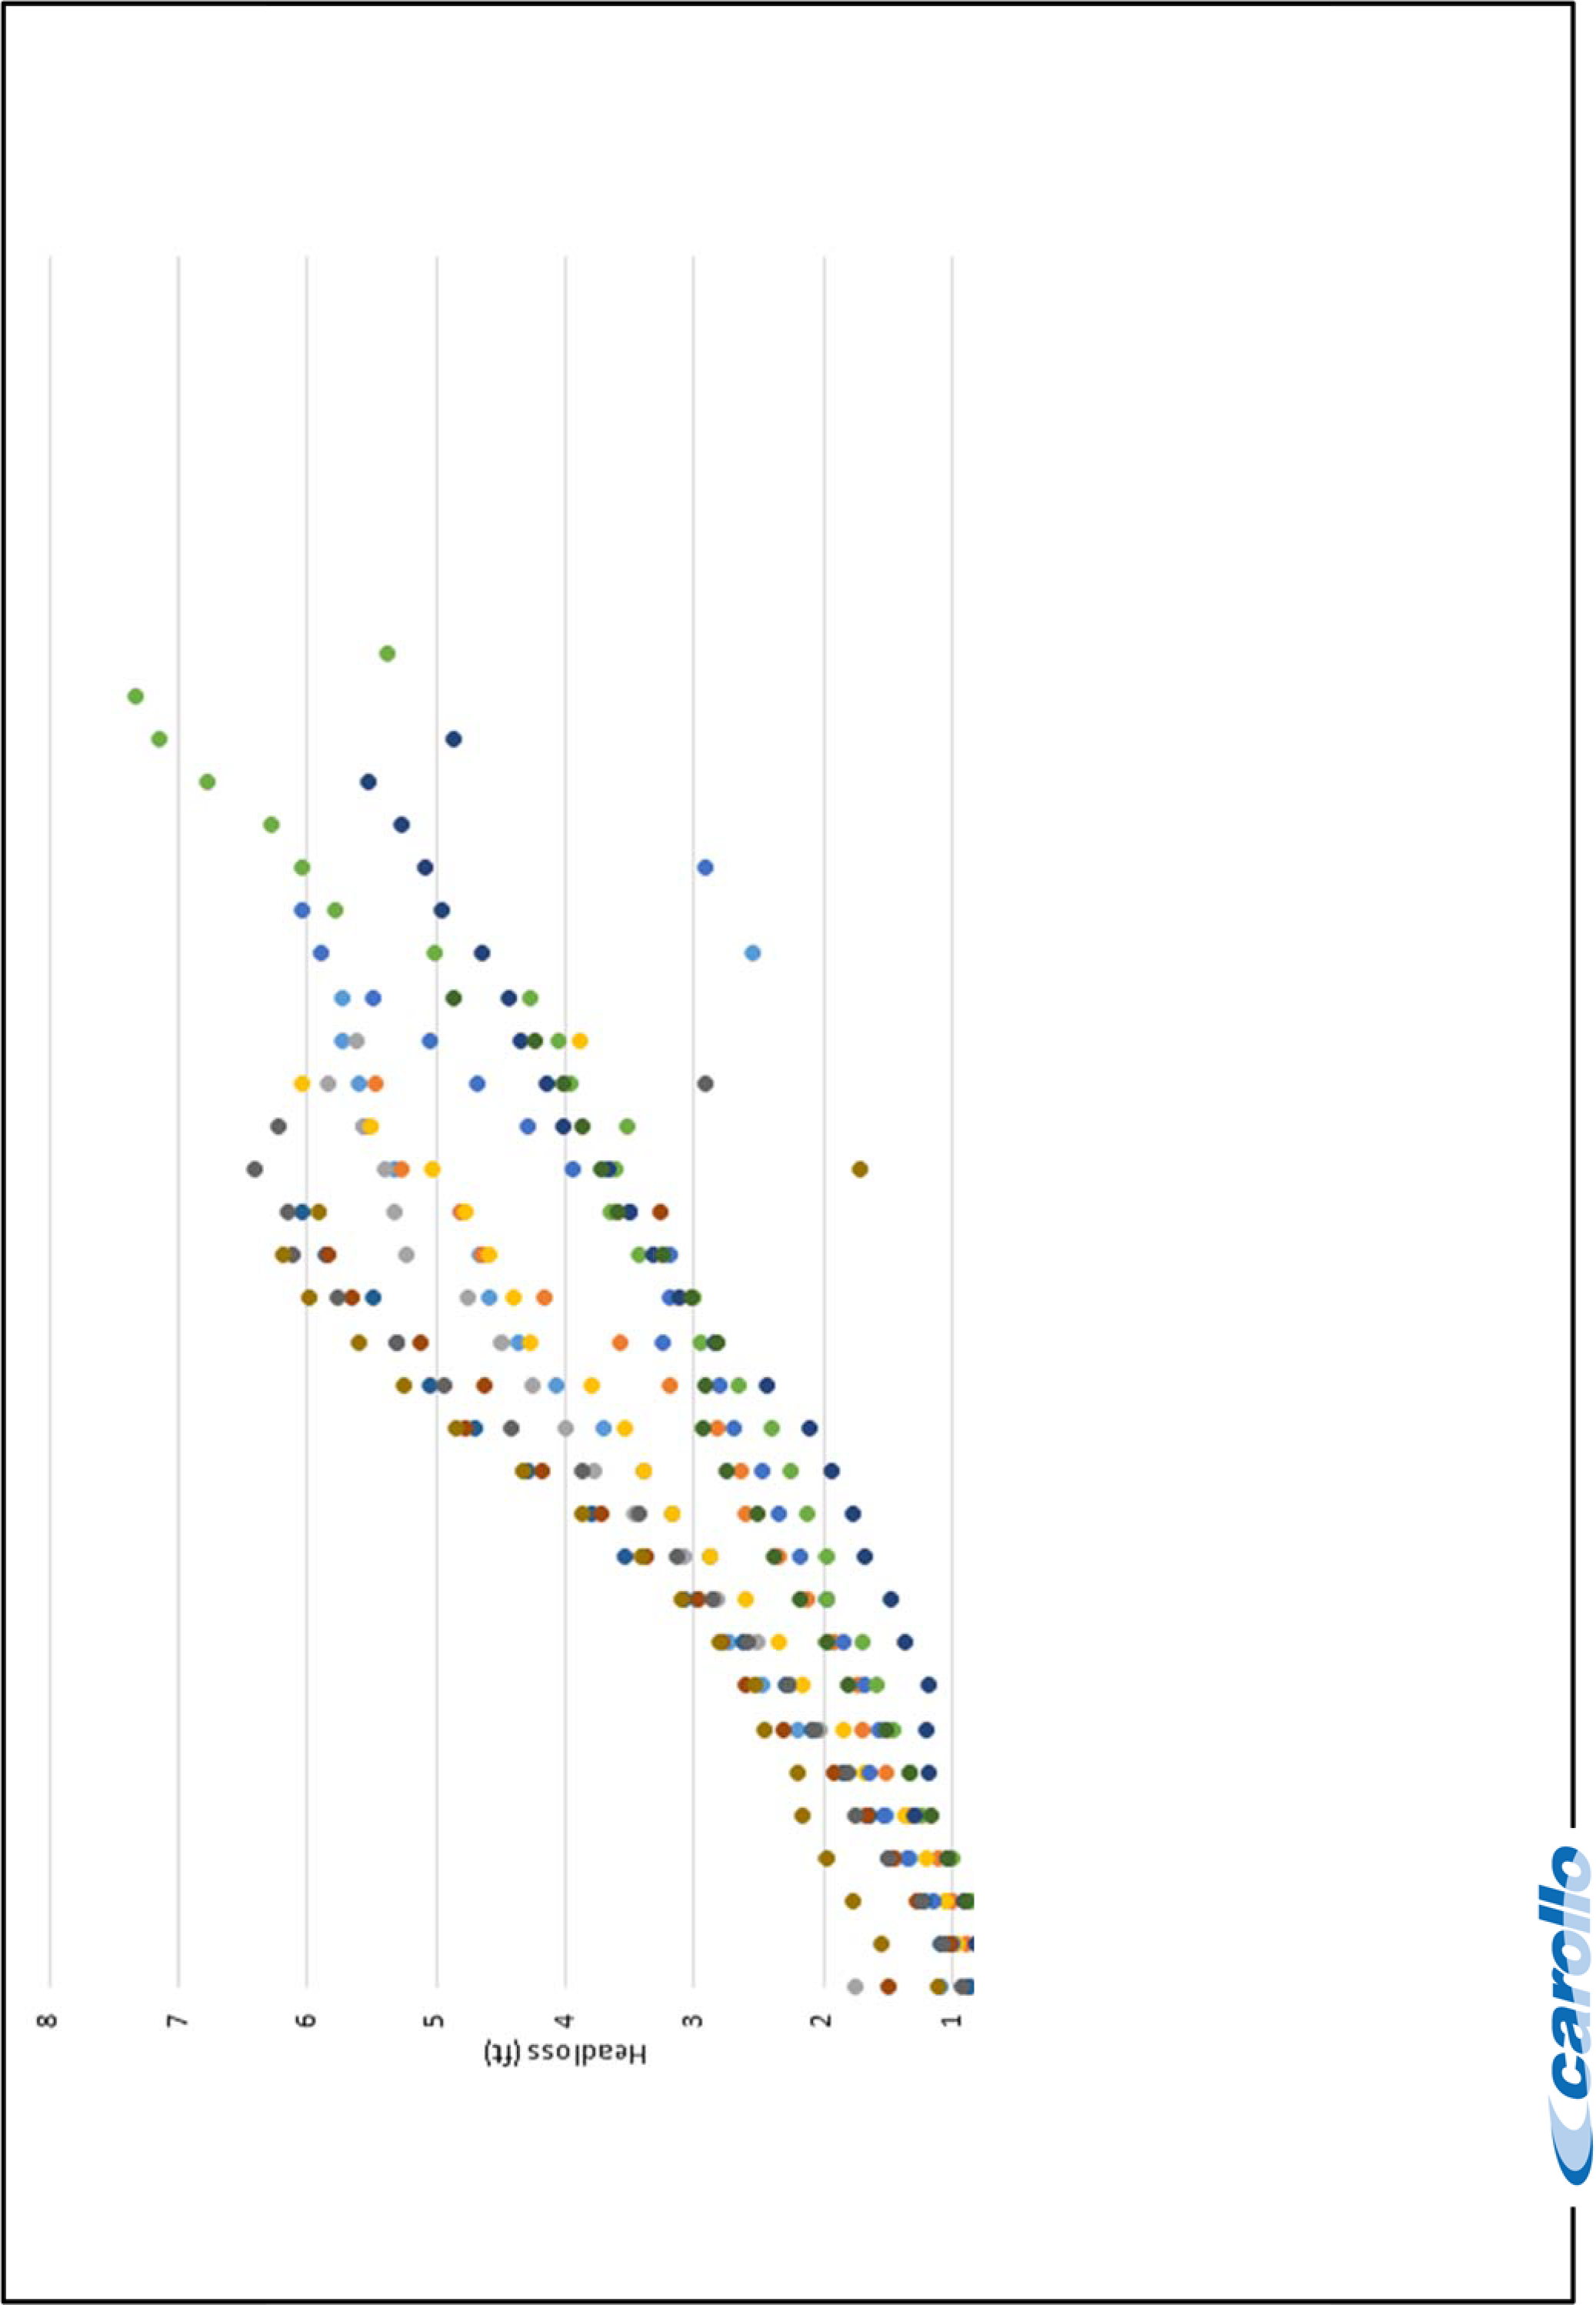
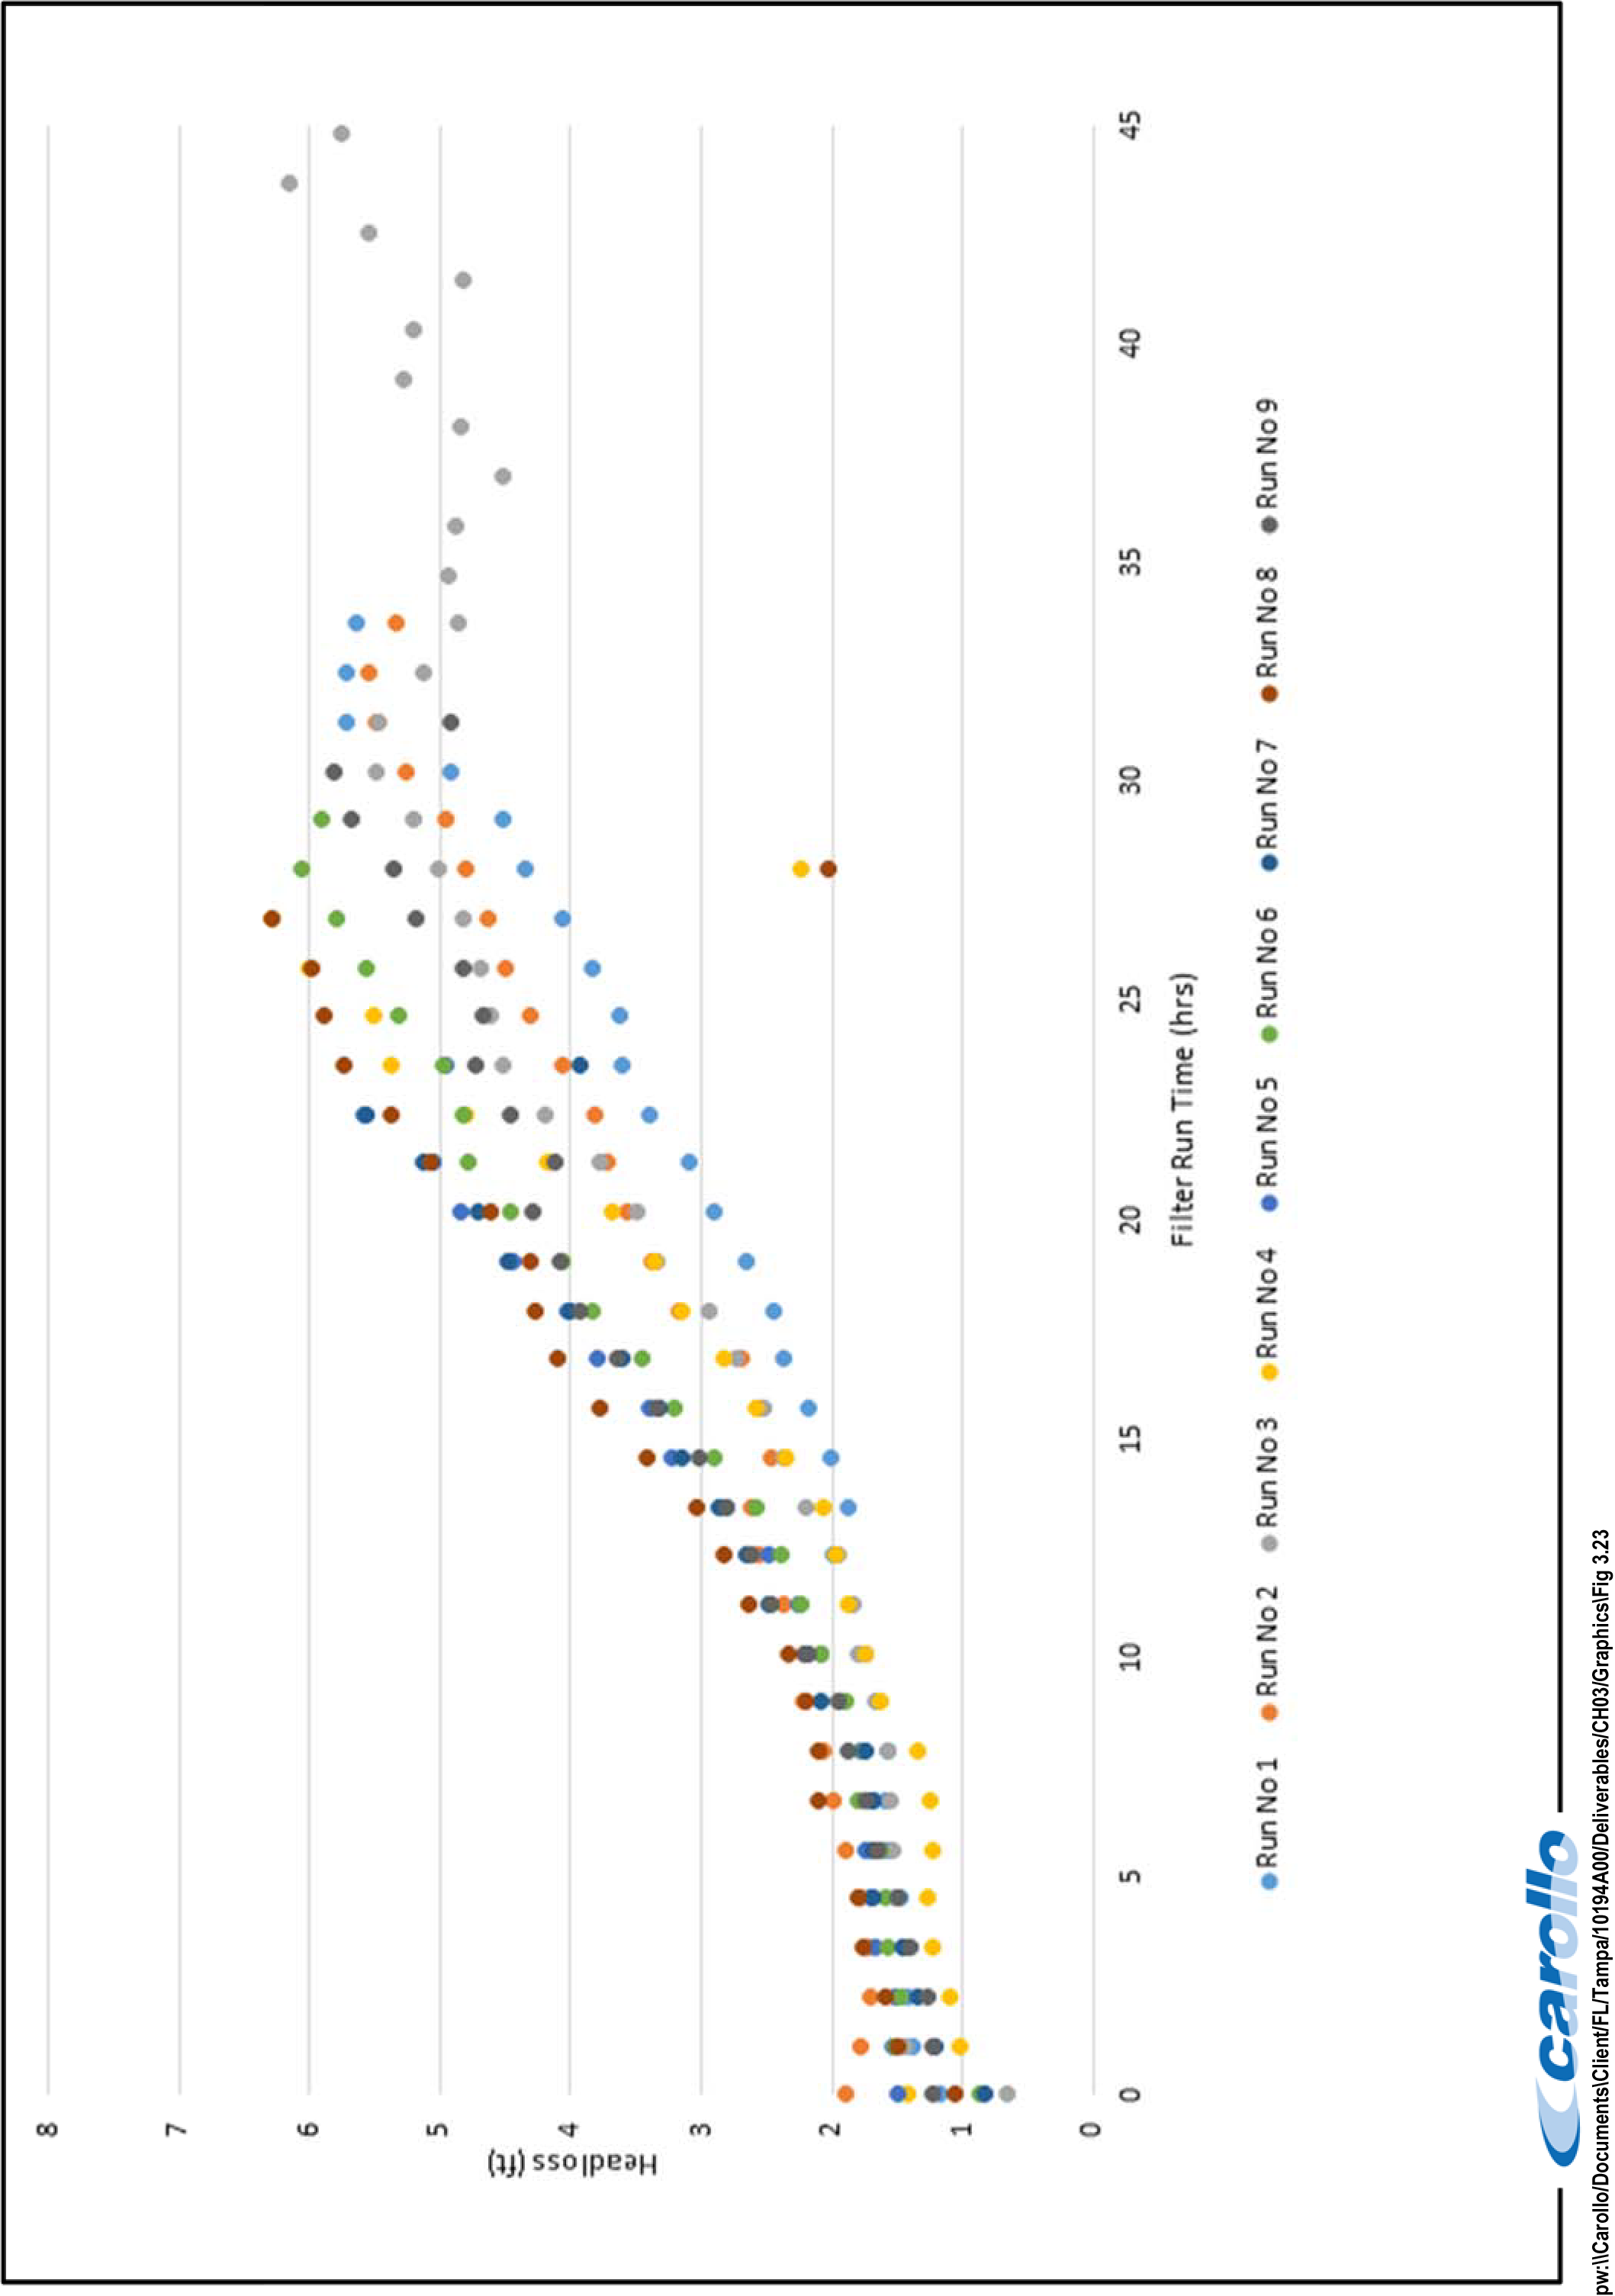
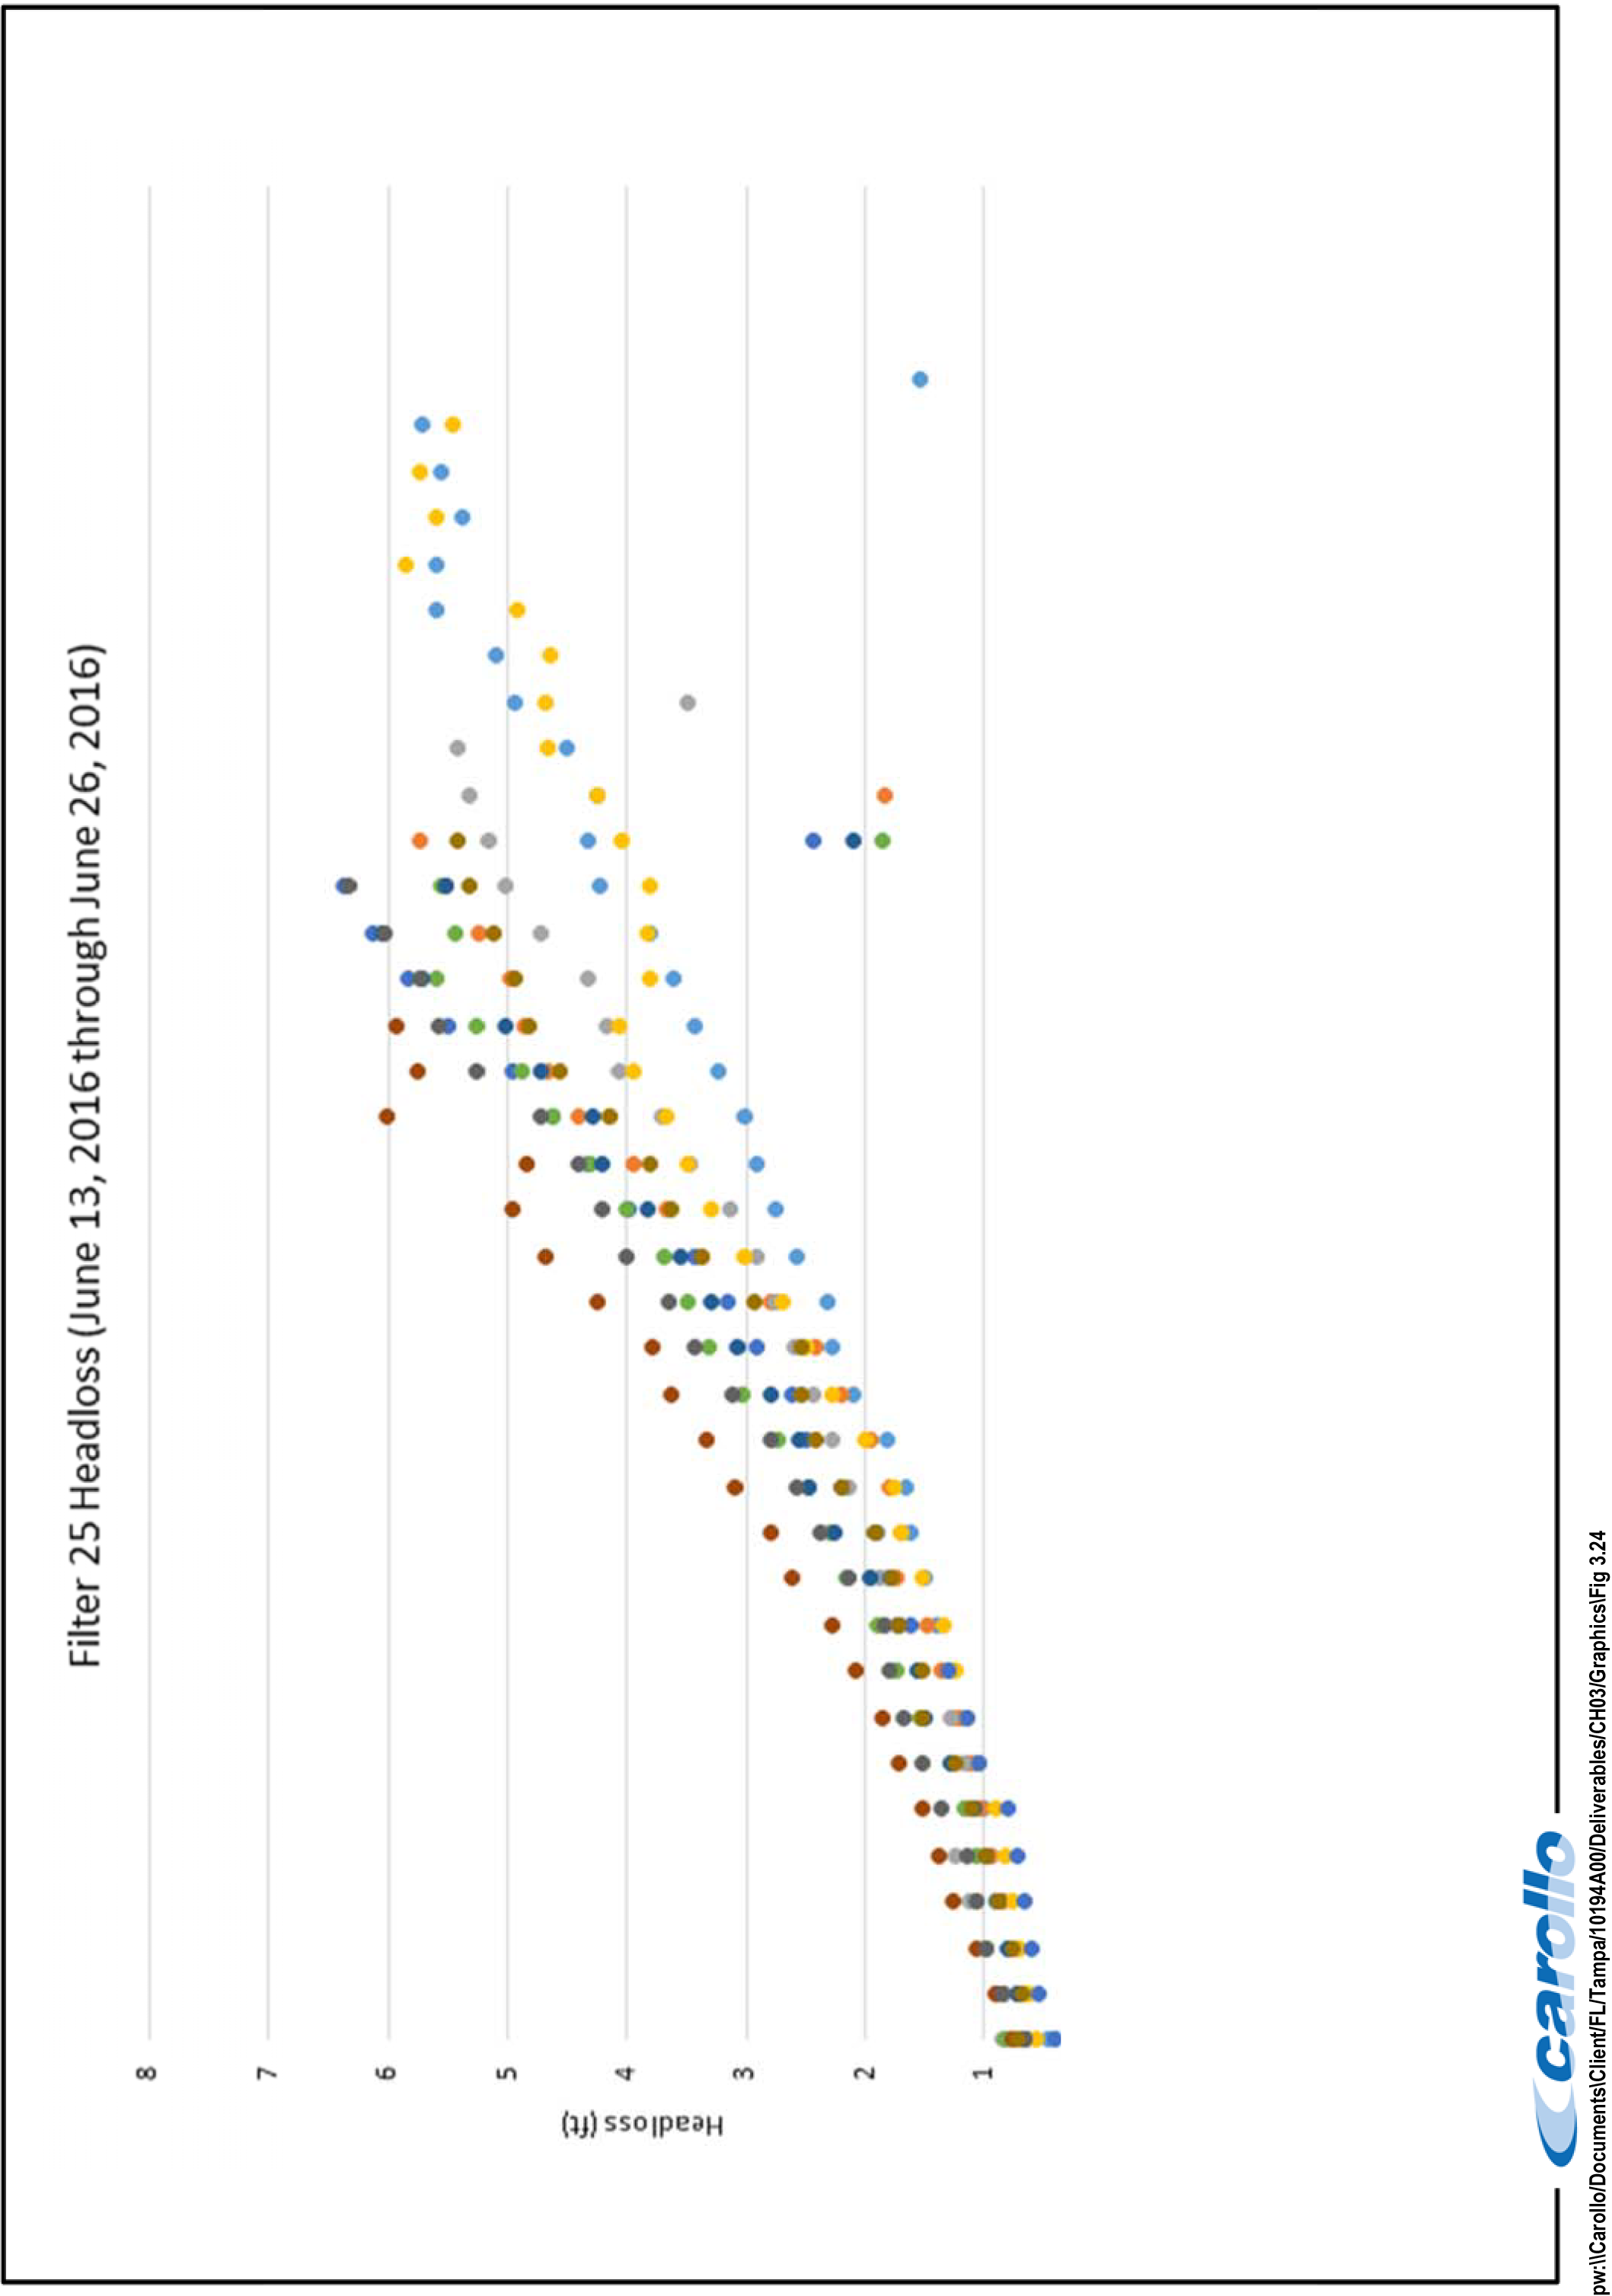
FIGURE 3.24 CITY OF TAMPA DAVID L. TIPPIN WTF MASTER PLAN
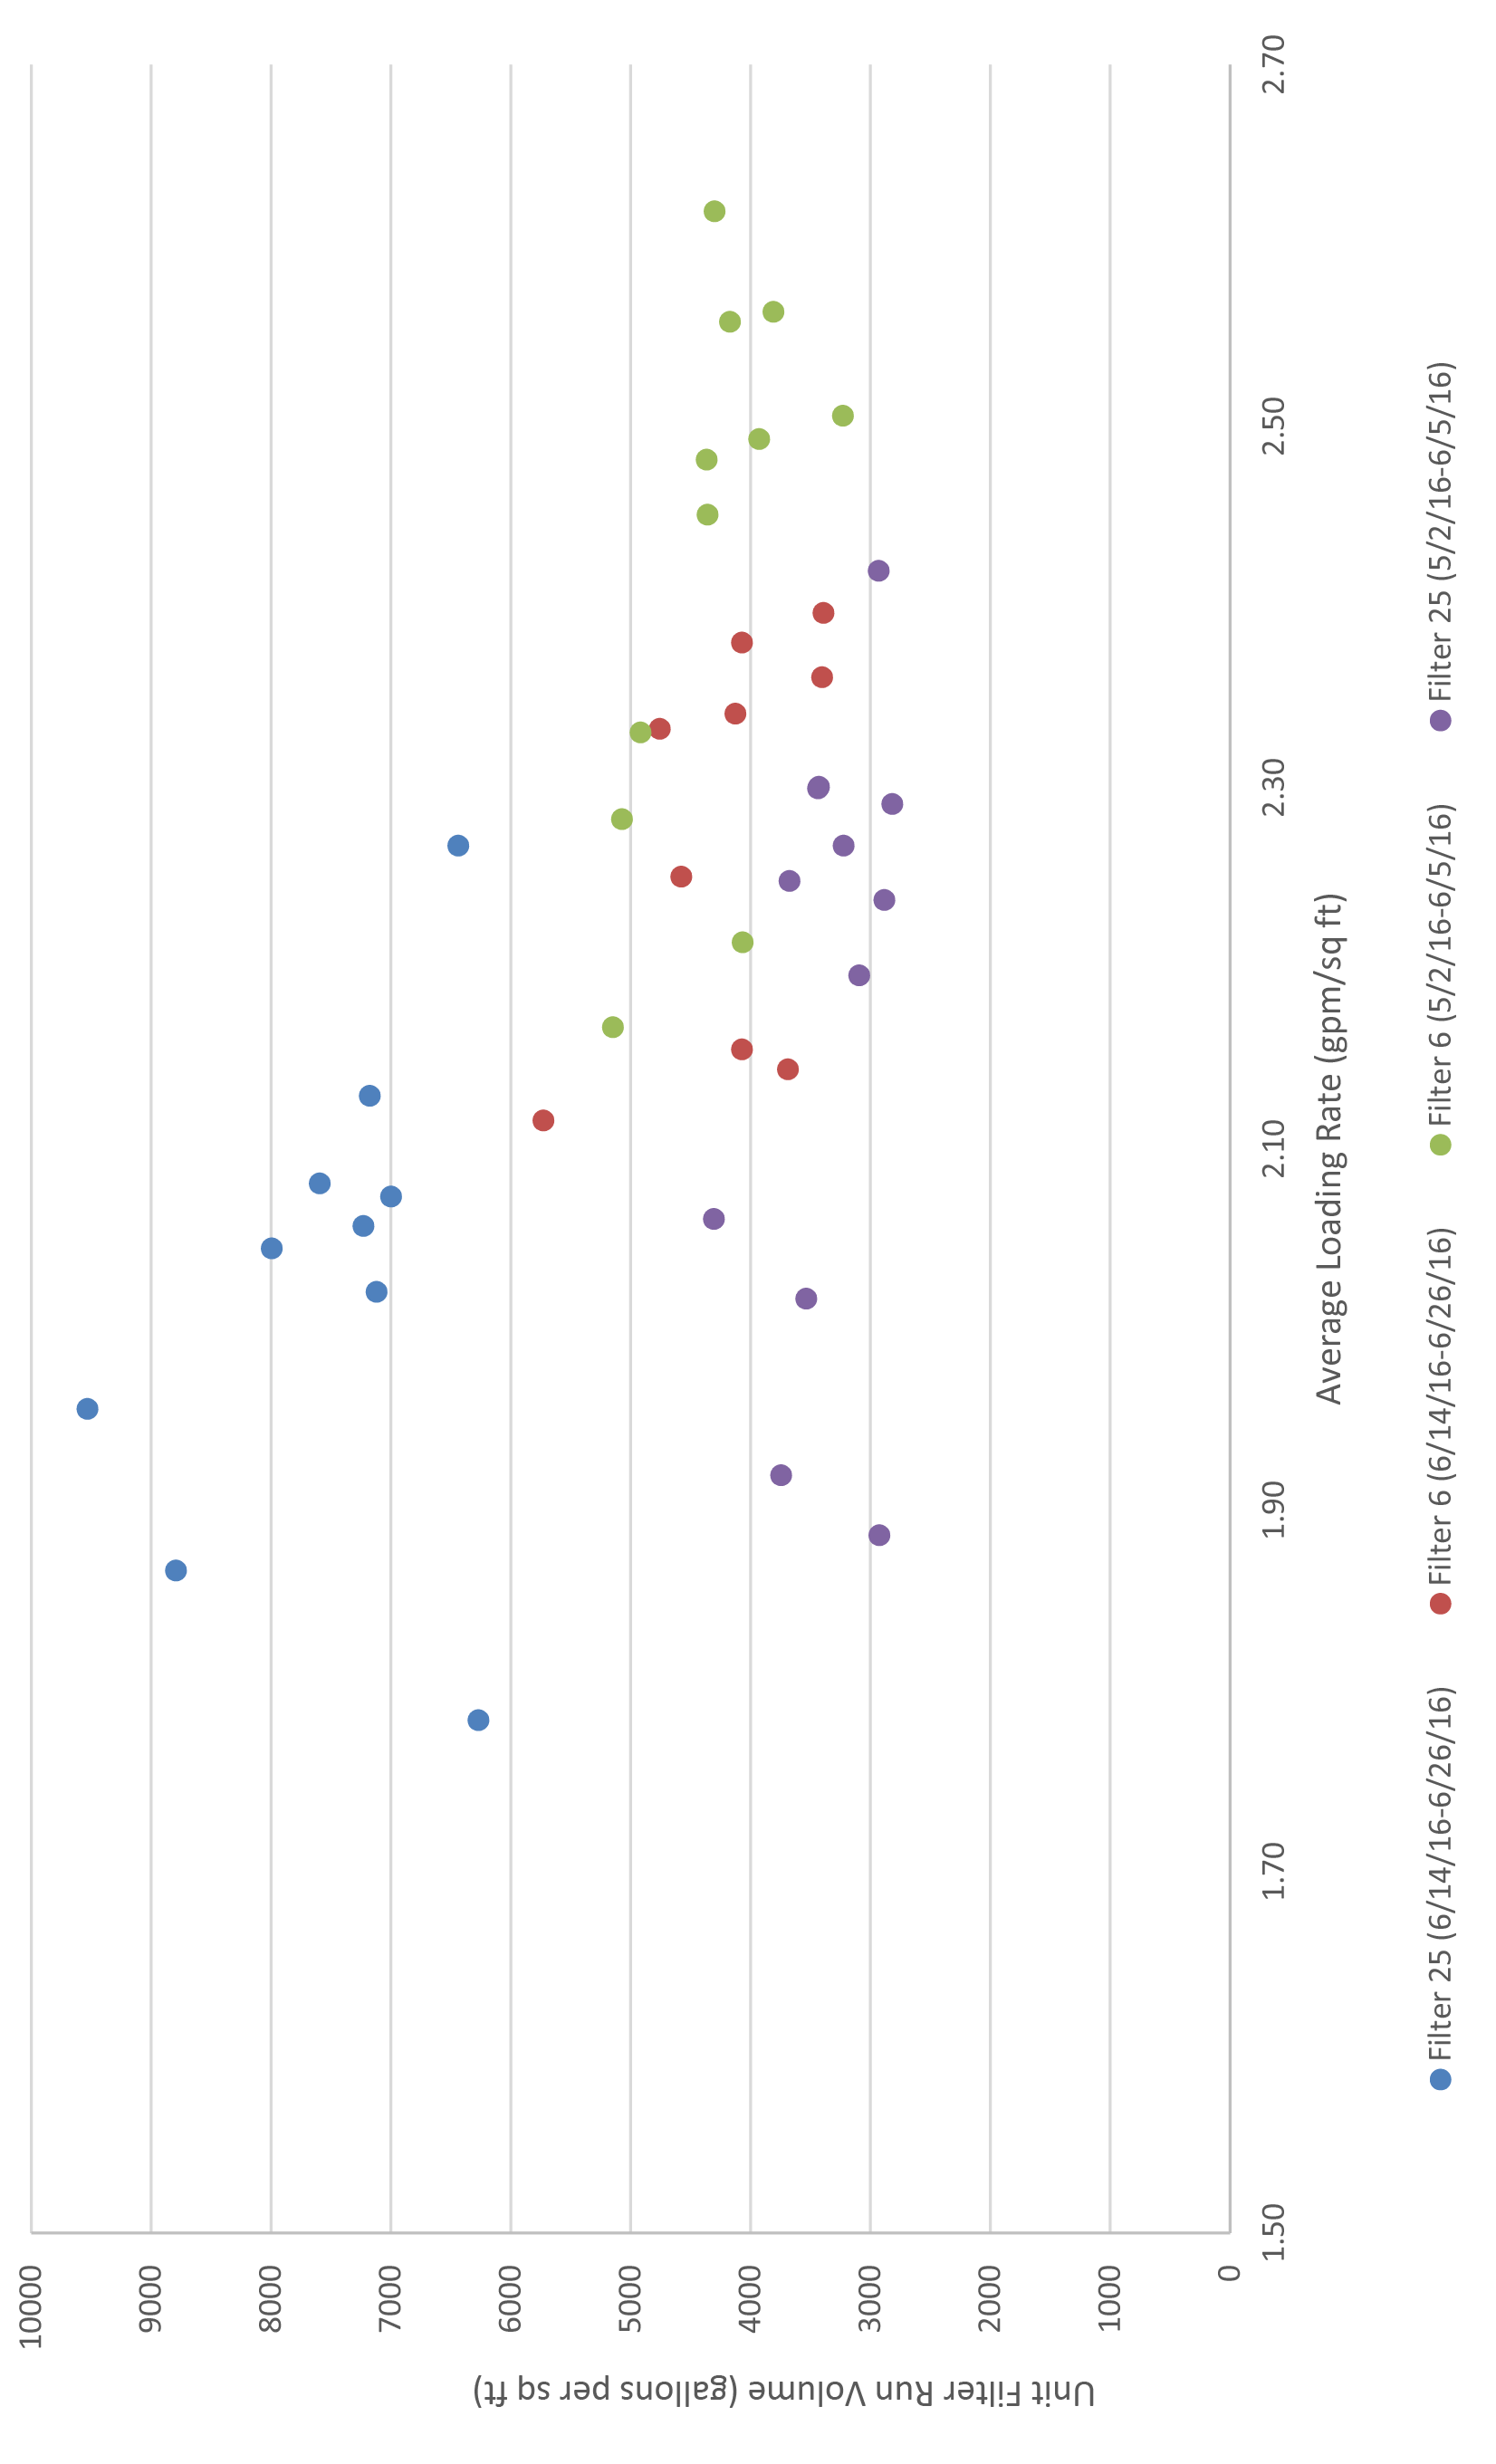
UFRV VS LOADING RATE
FIGURE 3.25
CITY OF TAMPA
DAVID L. TIPPIN WTF MASTER PLAN
Figure 3.26 compares the clean bed head loss with the loading rate for filters No. 6 and 25. As the figure shows, there are wide variations in clean bed head loss at the same loading rates, indicating that the filters do not come clean and solids remain in the filters. For filter No. 6 at a loading rate of 2.34 gpm/sq ft, the head loss on one filter run was 0.83 feet; at the same loading rate, the head loss on another filter run was 1.9 feet.
Average filter run times range from 24 to 36 hours, and filtered water turbidities are 0.05 NTU. The filtration rate during the evaluation was 1.89 to 2.62 gpm/sq ft. The filter backwash cycles are typically initiated by the loss of head across filter rather than turbidity breakthrough. The head loss is likely due to the filter media and not the filter underdrains.
Filter media is periodically added to maintain an adequate filter bed level. Operations noted the ability to backwash only one filter at a time. Due to the filters' configuration and operation, the filter-to-waste connection uses the same connection as the waste washwater gullet without an air gap. This is a cross connection issue.
The major problem with the filters is that run times are shorter than desired, caused by the lack of ample head loss available for filtration (approximately 6 feet). One apparent cause of this problem, as discussed in Chapter 4, is that water backs up into the filtered water flume in the pipe gallery from excess downstream head loss, likely from entrance conditions to the Hawkey Box. Chapter 4 discusses possible solutions to remedy this problem and restore additional head available for filtration.
Other problems with the filtration system are a shallower filter depth than desired, especially for biological active filters, and limitations on backwash procedures controlled by limited distance between the media and the troughs (limiting media expansion). Another problem is that the mismatched media between the existing sand and GAC.
As Figure 3.27 shows, according to the data provided by the City, the TOC removal across the filter generally ranges from 0.70 to 1.25 mg/L (25 to 34 percent). A large portion of this is in the form of DOC, which typically sees removals from 0.60 to 0.90 mg/L (19 to 27 percent).
Numerous full-scale biofiltration facilities have typically achieved TOC removals between 10 to 20 percent, although the removal rates vary widely from below 5 percent to more than 70 percent. Removal depends on the site, the nature of influent organic carbon, and water quality.
Problems with short filter run times associated with high lime doses are also common. The new lime dosing project should help mitigate this issue.
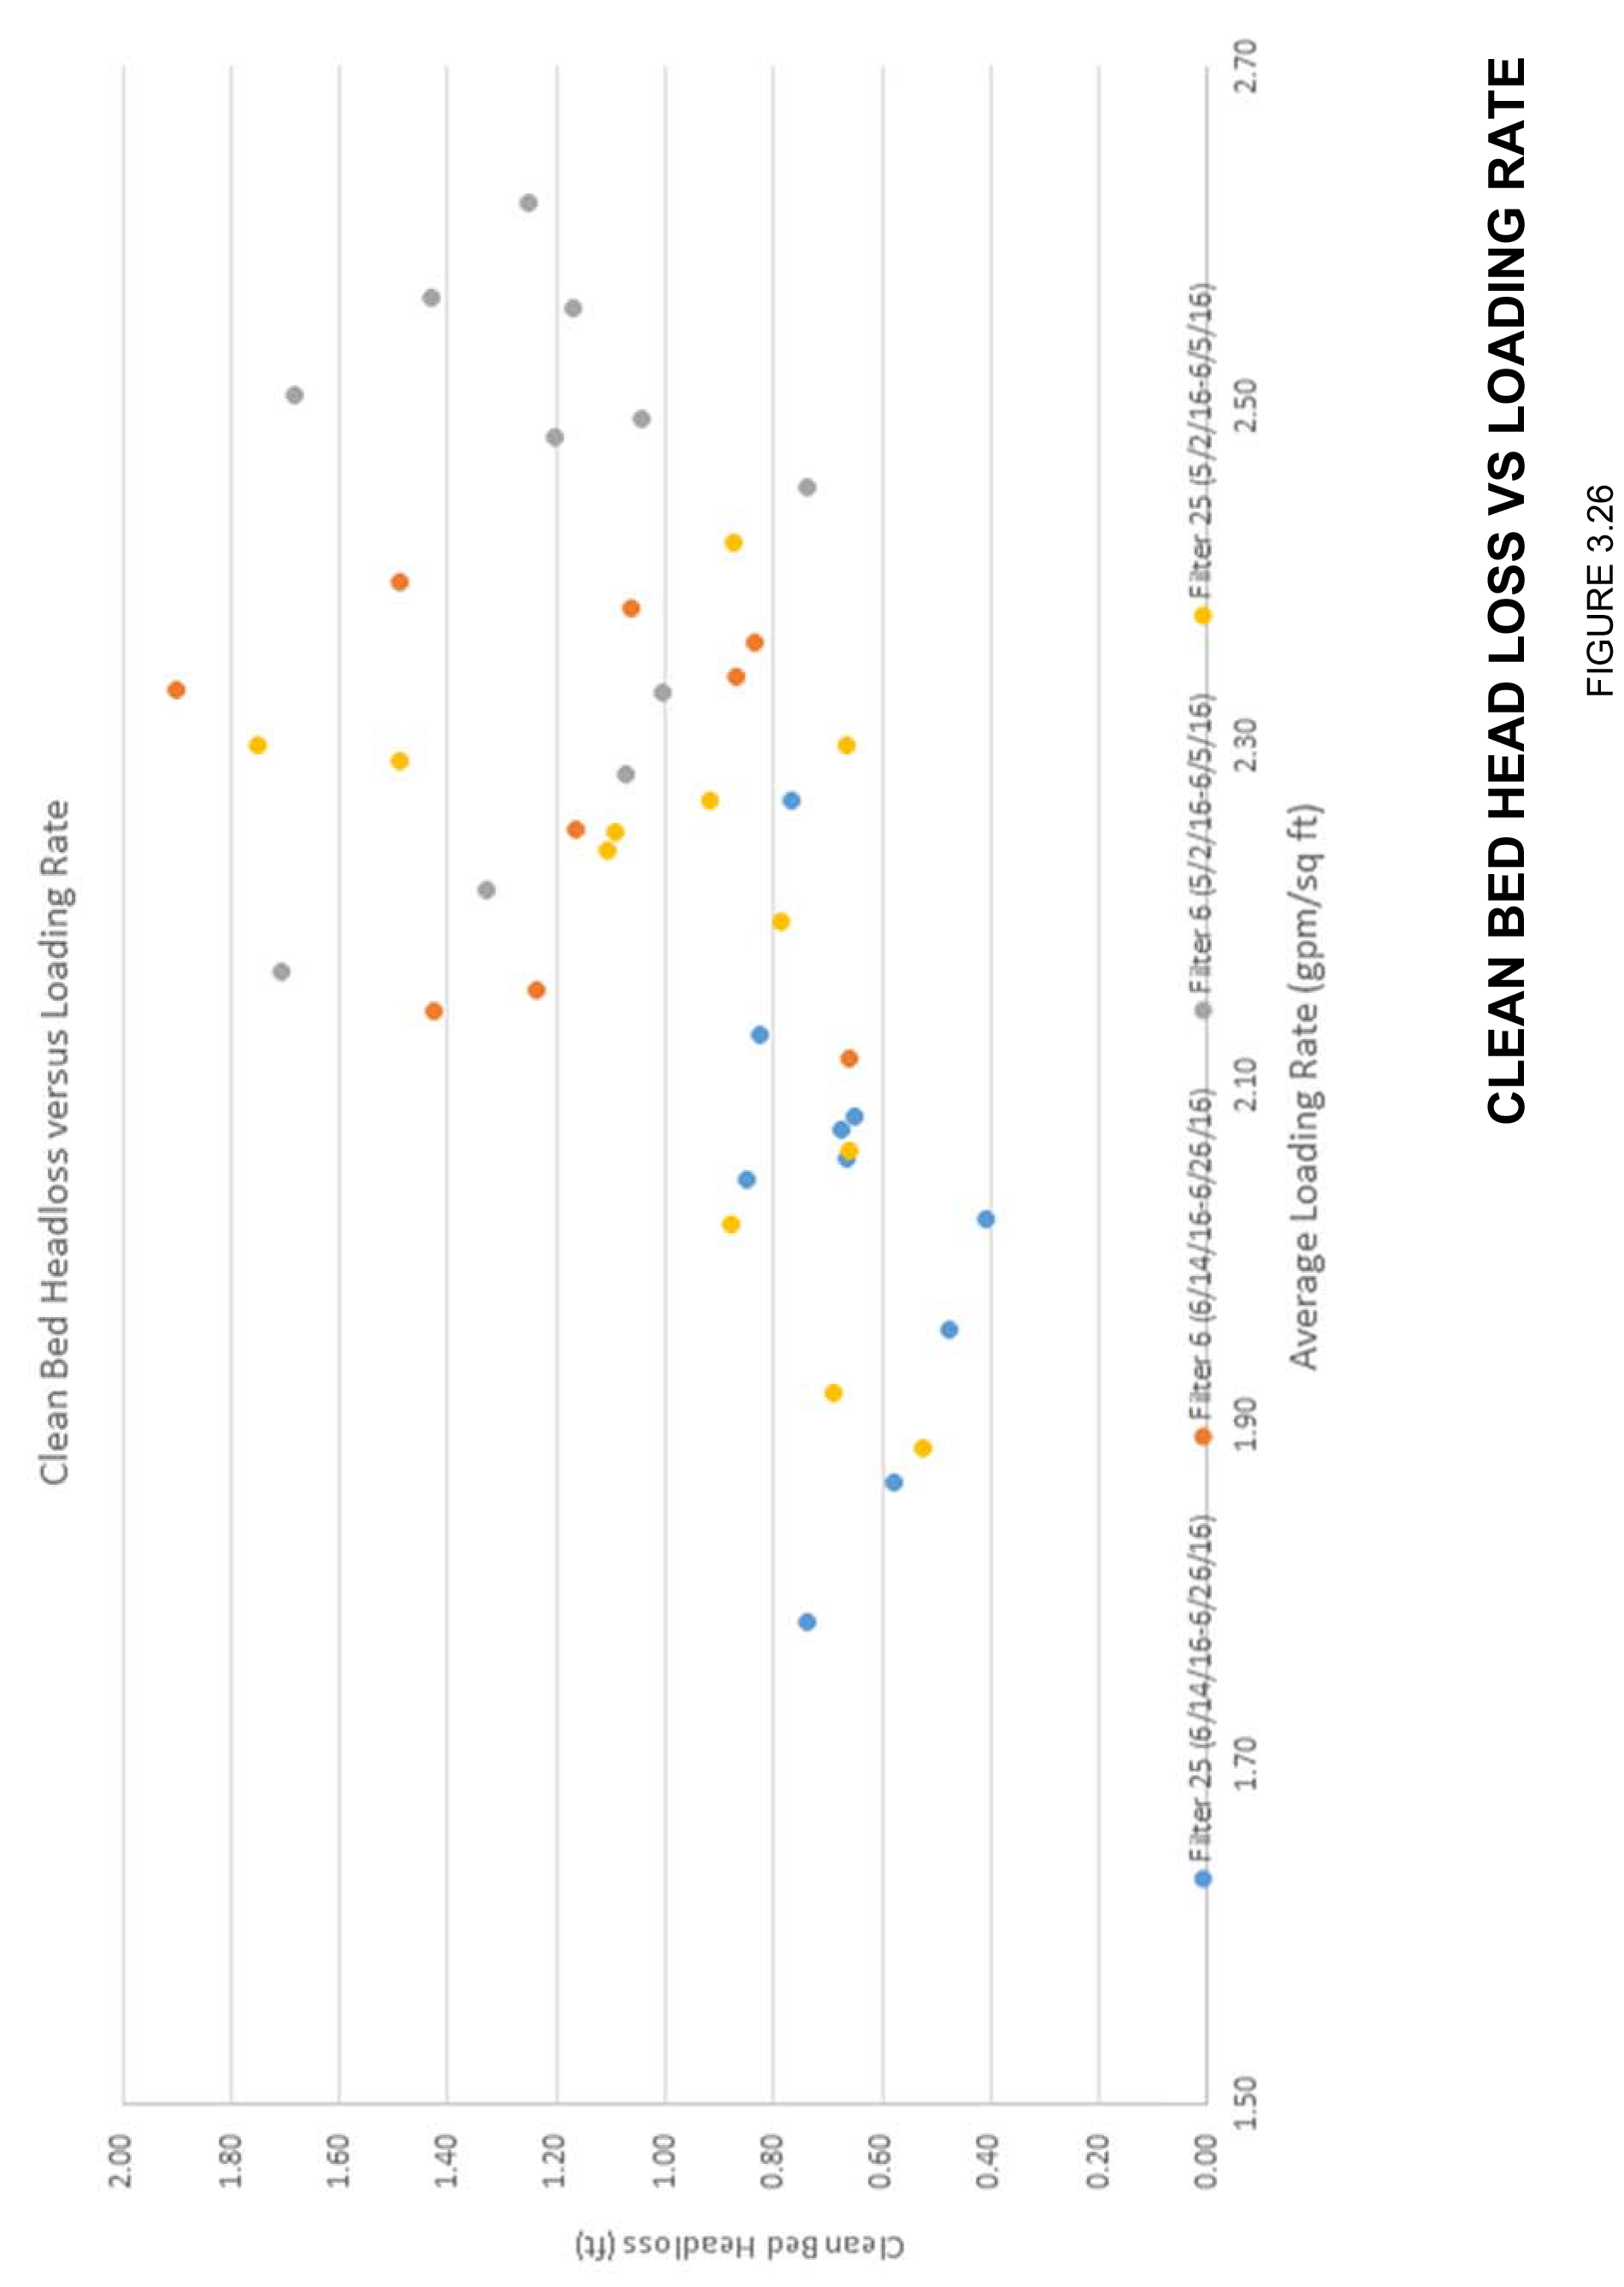

TOC AND DOC REMOVAL ACROSS FILTERS 3, 12, AND 17
FIGURE 3.27
CITY OF TAMPA DAVID L. TIPPIN WTF MASTER PLAN
The loading rate applied to the filters is approximately 2.5 gpm/sf, a modest rate except when combined with shallow bed depths. The loading rate is an important factor for conventional granular media (bio) filters. Many plants, as Chapter 6 discusses, operate at filtration rates in excess of 7 gpm/sf but typically have deeper filter beds. Although excellent particulate filter effluent water quality can be achieved even at high hydraulic loading rates, head loss may become a constraint.
Loading rate and filter bed depth determines the EBCT, which is considered a more important criterion for effective biofiltration. Typically, the ideal EBCT is between 5 and 10 minutes. When ozone precedes biofiltration, biodegradable organic matter can typically be removed within 2 to 4 minutes. EBCT is particularly important for biofilter applications that target trace organic compounds, such as MIB, Geosmin, endocrine disruptors, and pharmaceutically active compounds, which tend to be more resistant to biodegradation than typical biodegradable organic matter.
The ability to expand the capacity of these 30 filters to process flow rates higher than 120 mgd is questionable for two reasons: the resulting decrease in EBCT (which could affect contaminant removal) and increased head loss from the higher filter loading rates.
Based on maintaining a minimum EBCT of 5 minutes and the current head loss limitations, a maximum loading rate of 2.9 gpm/sq ft results, equating to an overall filter firm capacity (with two filters out of service) of 91.5 mgd. Operating the existing filters at this capacity is recommended. Additional recommendations to improve this system are at the end of this chapter.
3.3.7 Chemical Systems
The DLTWTF uses a number of chemical systems for process treatment, such as:
- Ferric sulfate
- Sulfuric acid
- Hydrogen peroxide
- Polymer
- Lime
- Caustic Soda
- Ammonia
- Chlorine
- Fluoride
Chemical feed rates are controlled by influent flow rate and water quality. The following sections detail the existing chemical systems, including their application, dosages, and
storage capacities. Each chemical system was also evaluated for plant flows through 140 mgd and for its ability to meet storage requirements.
There was noted discrepancy between the current calculated days of storage capacity and the original design storage capacity. This was because the original design assumed the dosages were measured as pure chemicals (i.e., ferric sulfate). The calculations and results in this chapter used the City's reported chemical dosages, which are typically reported as delivered product (i.e., mg/L of ferric sulfate stock solution). As a result, in some cases, the original design calculations underestimated the amount of available storage, since the City overestimated the dosages. Figure 3.28 shows the chemical dose application points site-wide.
3.3.7.1 Ferric Sulfate
3.3.7.1.1 Description
Ferric sulfate (36 percent Fe2(SO4)2 solution) is used as a coagulant for both the Actiflo™ and conventional treatment processes. The positively charged ferric sulfate destabilizes negatively charged particles and encourages precipitation of metal hydroxides in the water so they can be removed in the sedimentation step.
Typically, ferric sulfate is fed by gravity to the conventional treatment rapid mix basins and Actiflo™ raw water lines. However, metering pumps are available when gravity feed is not possible. According the DLTWTF's O&M Manual, the appropriate ferric sulfate dosage is determined by jar testing for organics removal and motorized control valves with a magnetic flowmeter to control the feed rate.
Table 3.22 details the original design of the ferric sulfate system.
| Parameter | Units | Value |
|---|---|---|
| No. of Storage Tanks | - | 3 |
| Storage Tank Capacity | gal | 62,000 |
| Total Storage Capacity | gal | 186,000 |
| Days of Available Storage(1) | days | 14.9 |
| Average Dose | mg/L as ferric sulfate | 165 |
| Designed Plant Flow Rate | mgd | 100 |
| No. of Feed Pumps (duty/standby) | - | 2/1 |
| Feed Pump Capacity (each) | gpm | 30 |
| Maximum Dose | mg/L | 315 |
| Notes: (1) Original design storage determined by average dose and 80 percent design plant flow rate. | ||
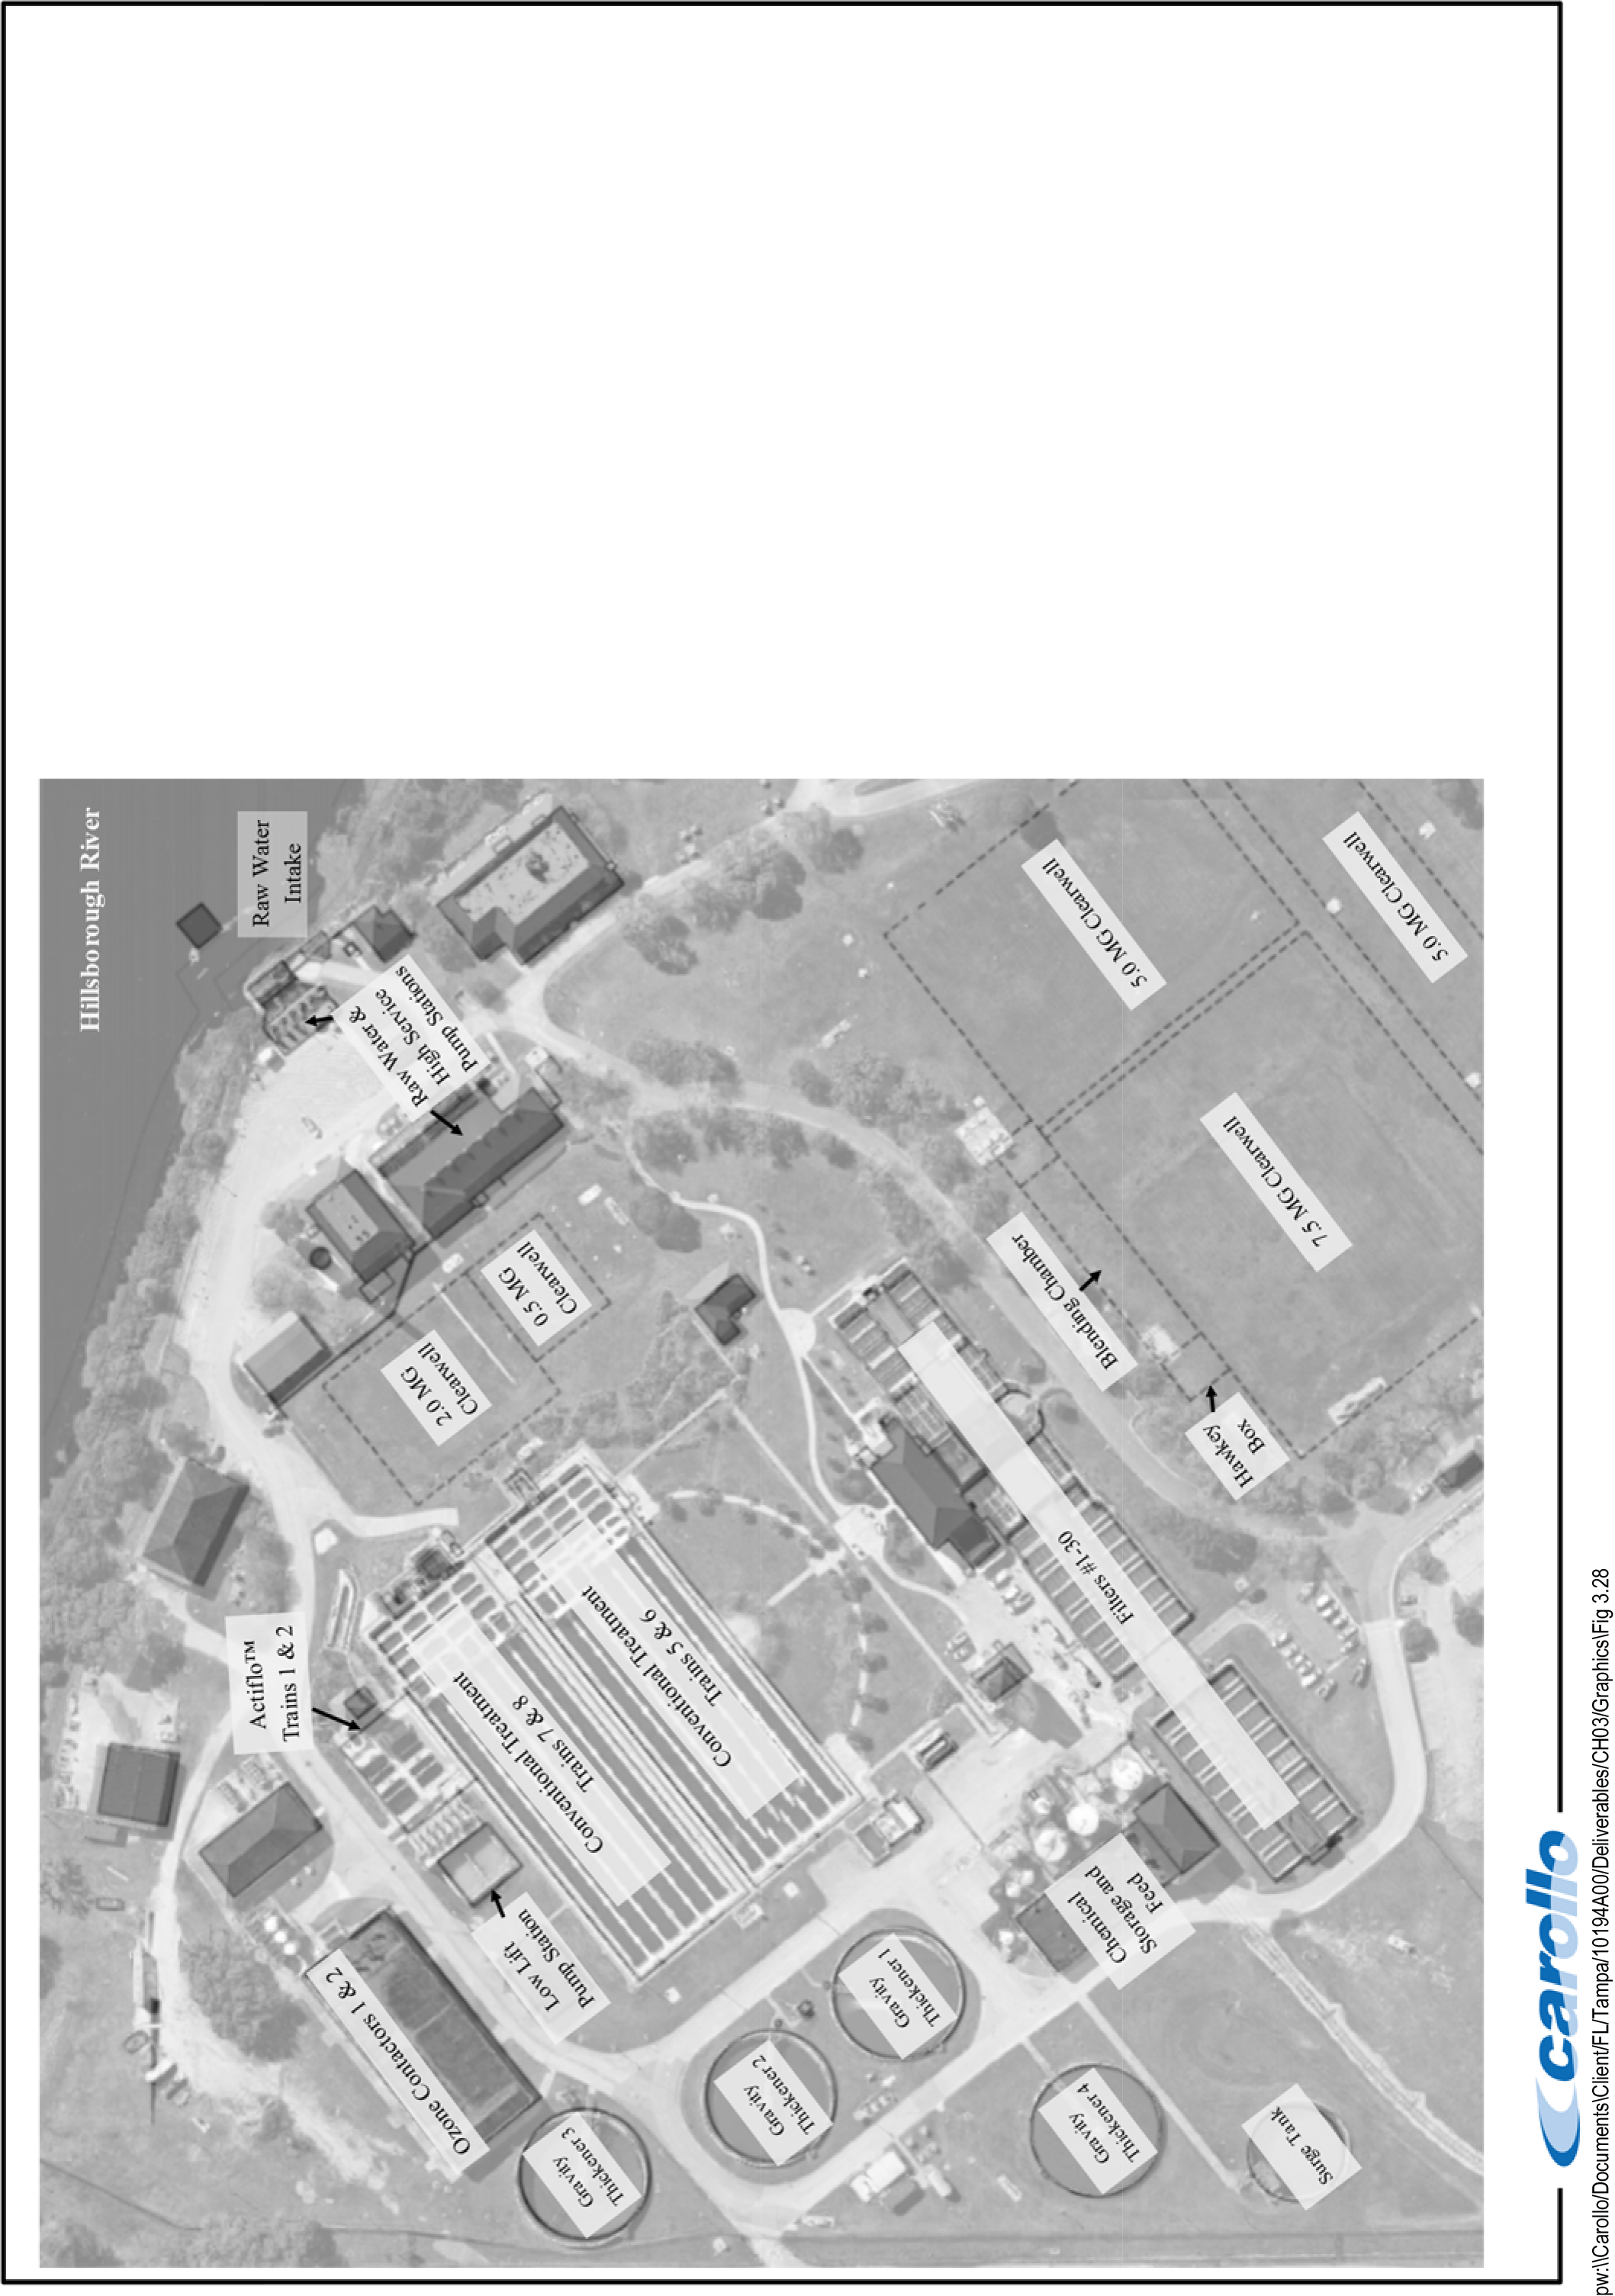
3.3.7.1.2 Existing Process Performance and Ability to Expand
For 2014 and 2015, the average ferric sulfate dose was 121.5 mg/L as delivered product. As Figure 3.29 shows, at this dosage, there is nearly 17 days of available storage.
3.3.7.2 Sulfuric Acid
3.3.7.2.1 Description
A 93 percent sulfuric acid solution is dosed into the raw water before the Actiflo™ and conventional treatment trains. The goal is to reduce the pH to between 3.8 and 4.3 (according the O&M Manual) for optimal organics removal. The acid is injected (in-line in the Actiflo™ system and in the rapid mix basin for the conventional system) before ferric sulfate and controlled via motorized valves and the measured pH in the coagulation tank.
The sulfuric acid system original design is shown in Table 3.23.
| Parameter | Units | Value |
|---|---|---|
| No. of Storage Tanks | - | 3 |
| Storage Tank Capacity | gal | 10,000 |
| Total Storage Capacity | gal | 30,000 |
| Days of Available Storage(1) | days | 15.3 |
| Average Dose | mg/L as sulfuric acid | 42.0 |
| Designed Plant Flow Rate | mgd | 100 |
| No. of Feed Pumps (duty/ standby) | - | 1/1 |
| Feed Pump Capacity | gpm | 8 |
| Notes: (1) Original design storage determined by maximum dose and 80 percent design plant flow rate | ||
3.3.7.2.2 Existing Process Performance and Ability to Expand
Figure 3.30 shows the days of available storage at a 2014/2015 average sulfuric acid dose of 59.8 mg/L as delivered product. As the figure shows, 6.6 days of storage are available at the 140 mgd plant flow rate. Additional acid storage will therefore be required in case of plant expansion and continued current operations (i.e. enhanced coagulation).
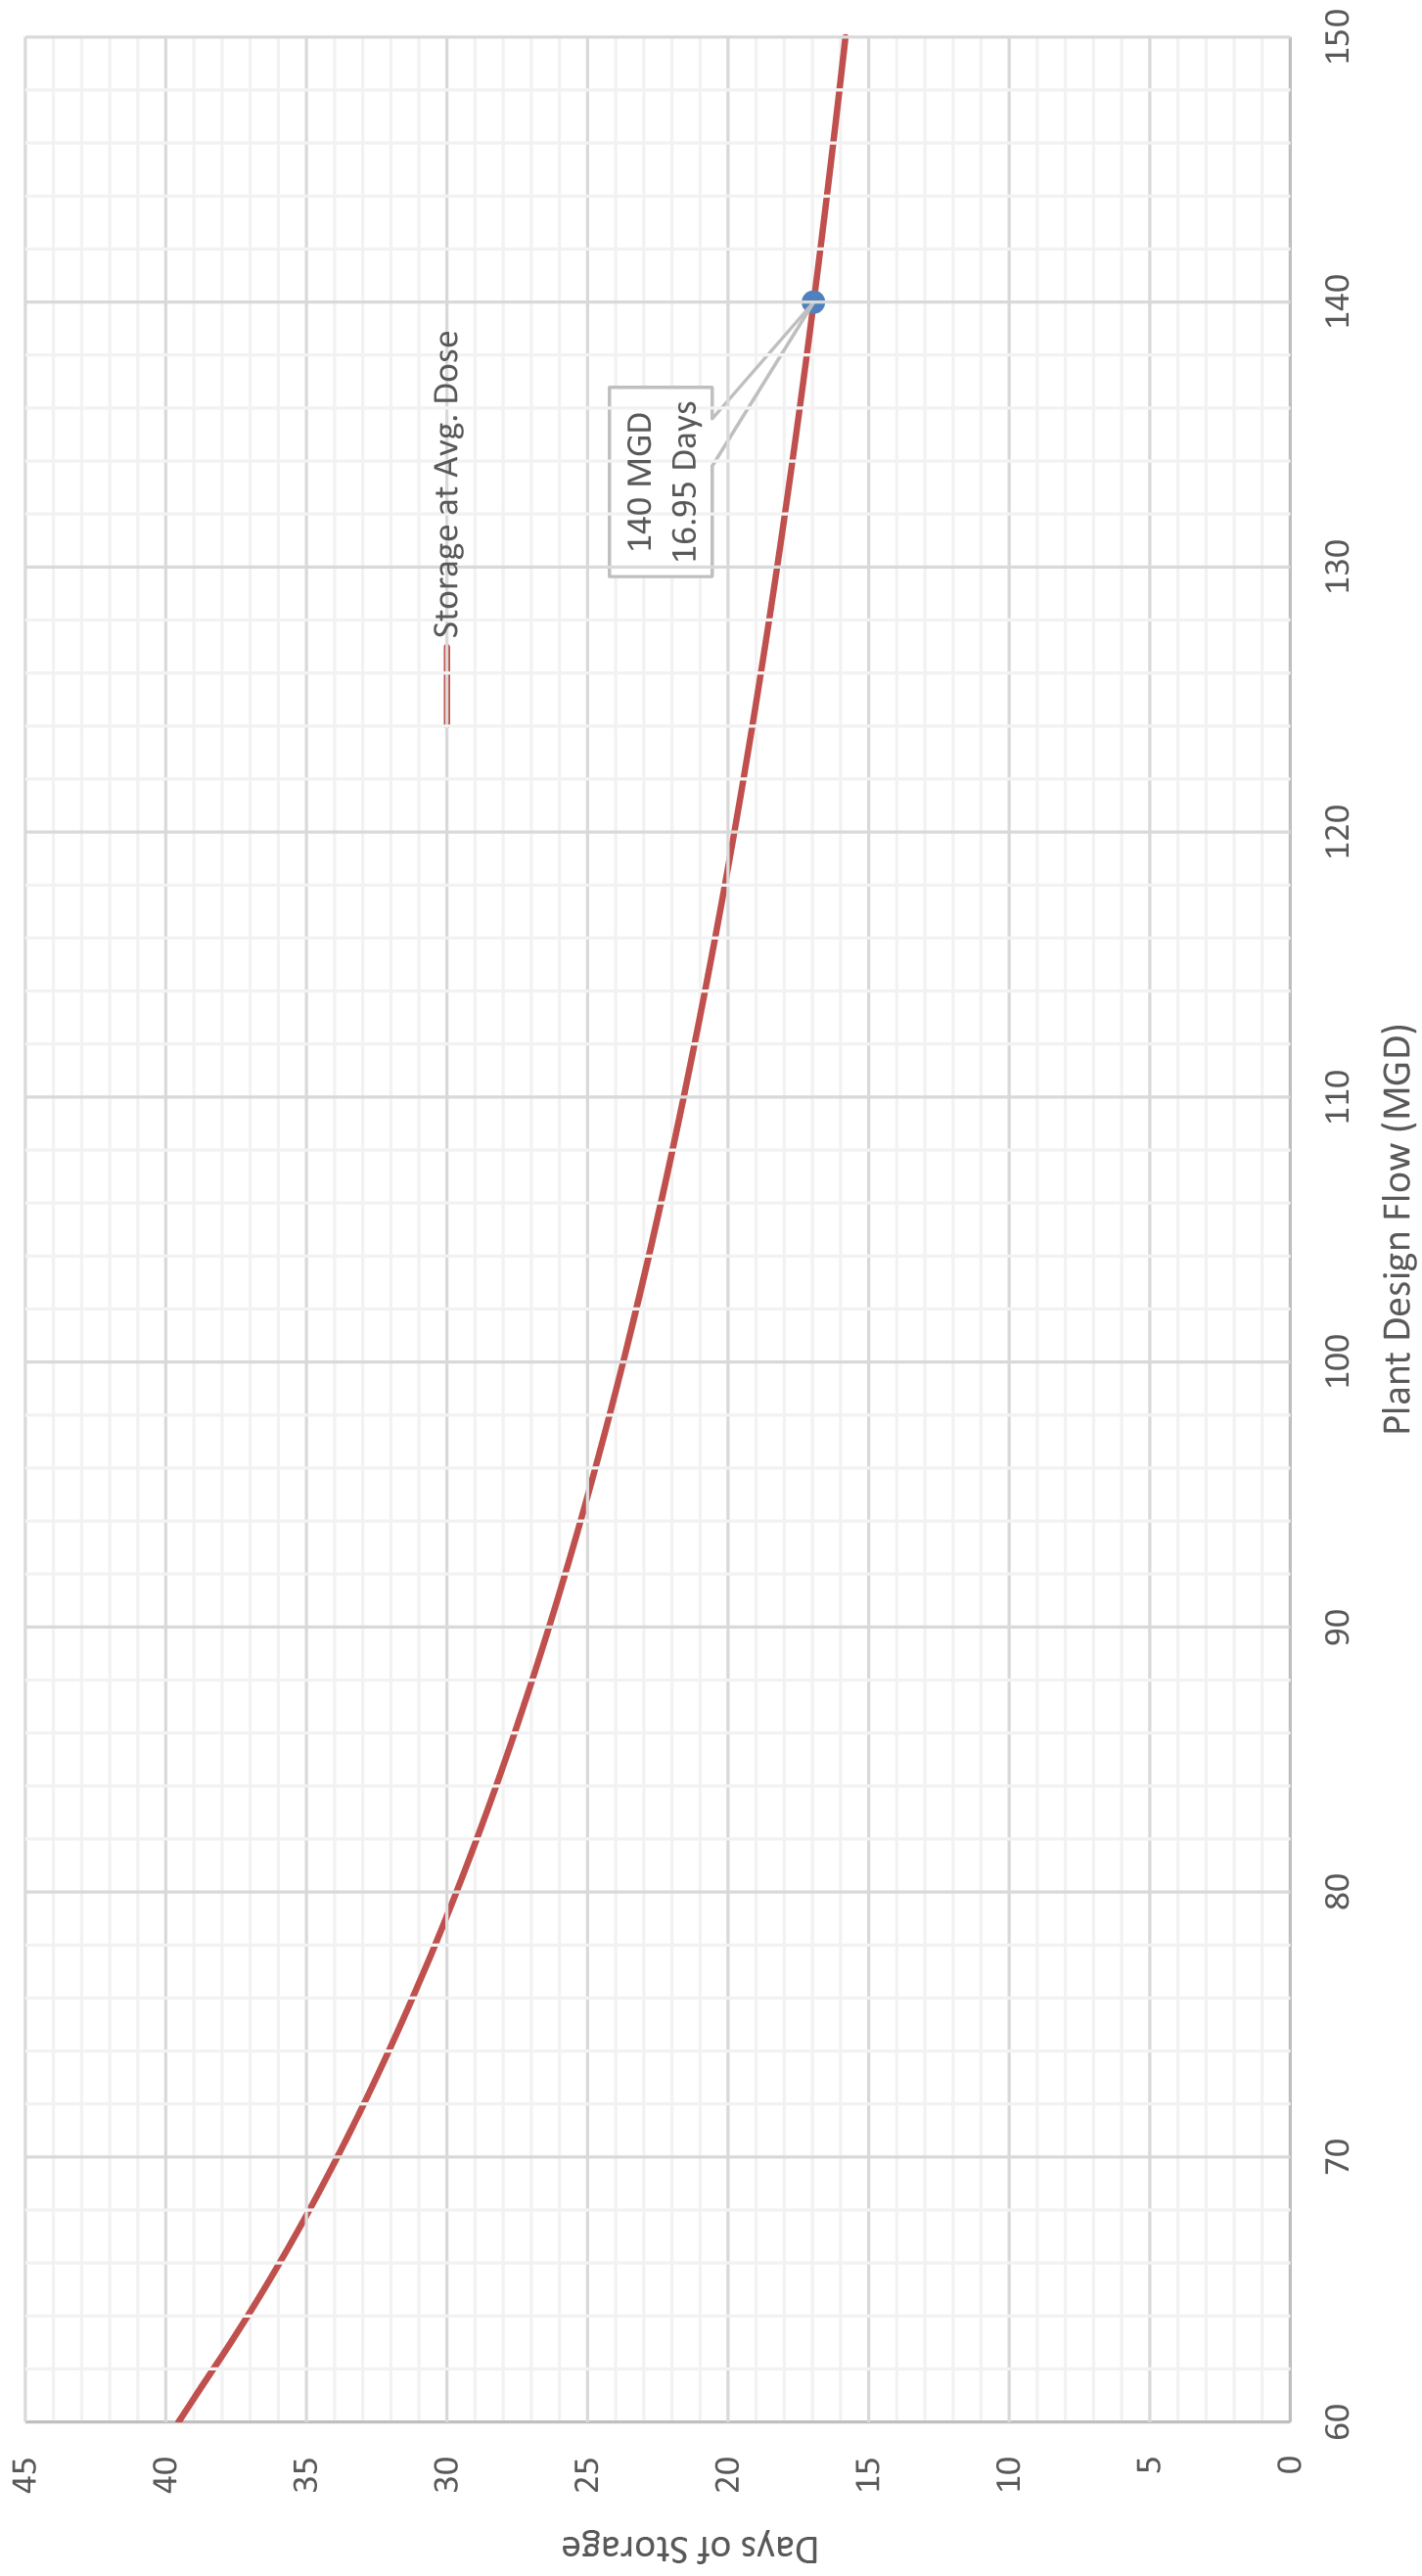

3.3.7.3 Hydrogen Peroxide
3.3.7.3.1 Description
Hydrogen peroxide can be used to quench ozone residual or to promote advanced oxidation for taste and odor control. The DLTWTF uses it for both functions. Depending on the water quality goal, the chemical can be added after ozonation or within the ozone contactor Cell 6.
The 35 percent hydrogen peroxide solution is dosed at the settled water junction box. During times of elevated taste and odor compounds, hydrogen peroxide is dosed with ozone to create free radicals, which are strong oxidants, to meet demands.
The system’s original design is shown in Table 3.24.
| Parameter | Units | Value |
|---|---|---|
| No. of Storage Tanks | - | 2 |
| Storage Tank Capacity | gal | 2,100 |
| Total Storage Capacity | gal | 4,200 |
| Days of Available Storage(1) | days | 20.0 |
| Average Dose | mg/L | 0.98 |
| Designed Plant Flow Rate | mgd | 100 |
| No. of Feed Pumps (duty/ standby) | - | 2/1 |
| Feed Pump Capacity | gph | 6.0 |
Notes:
(1) Original design storage determined by maximum dose and 80 percent design plant flow rate.
3.3.7.3.2 Existing Process Performance and Ability to Expand
Hydrogen peroxide was not used between July 2013 and December 2015 but has been minimally used recently with average doses being 0.10 mg/L or less. Therefore, the DLTWTF is assumed to have adequate storage volume to meet future demands at the 140 mgd plant capacity, however consistent average doses over 1.00 mg/L will required additional storage.
3.3.7.4 Polymer
3.3.7.4.1 Description
Polymer is used as a coagulant aid in the Actiflo™ and conventional treatment processes to encourage floc formation via adsorption and inter-particle polymer bridging. It is dosed in the Actiflo™ hydrocyclones and maturation tanks, as well as the conventional treatment flocculation basins, between Stages 2 and 3. The polymer dose is determined by jar testing procedures, and the feed system is controlled by the target polymer dose and the raw water flow rate.
Table 3.25 details the original design of the polymer system. The pumps that feed the conventional treatment basins have a design capacity of 8.0 to 16.0 gpm for a 0.1 to 0.3 mg/L dose. Conversely, the pumps that feed that Actiflo™ system can provide 0.7 to 8.0 gpm, for a 0.6 to 0.8 mg/L dose. This is something to consider when comparing the performance of the conventional treatment basins to the Actiflo™ basins.
| Parameter | Units | Value |
|---|---|---|
| No. of Dry Storage Tanks | - | 2 |
| Dry Storage Hopper Capacity | lbs | 250 |
| Total Dry Storage Capacity | lbs | 500 |
| No. of Mixing Tanks | - | 2 |
| Mixing Tank Capacity | gal | 3,000 |
| Total Mixing Tank Capacity | gal | 6,000(1) |
| Days of Available Storage (dry pallets) | days | 14 |
| Days of Available Storage (dry polymer hopper) | days | 1 |
| Mix Tank Detention Time | hr | 1 |
| Design Dose | ppm | 0.60 |
| Designed Plant Flow Rate | mgd | 100 |
| No. of Feed Pumps (duty) | - | 6 |
| Feed Pump Capacity (Conventional/Actiflo™) | gpm | 8.0-16/0.7-8.0 |
Notes:
- (1) Originally designed to be a completely redundant system. Therefore only 3,000 gallons of mix tank volume are available for use at any point in time.
3.3.7.4.2 Existing Process Performance and Ability to Expand
Considering the original design dosage and the 140 mgd flow rate, 84.0 gallons per day of pure polymer is required. Since the solution in the mix tank is 0.1 percent polymer, approximately 3,500 gallons per hour are required, resulting in a required mixing tank storage volume of at least 4,100 gallons to meet in-plant needs without the redundant mix tank. At this dose and flow, approximately 700 lb/day of dry polymer would be required. Given the existing design, this only provides 10 days of dry pallet storage and 17 hours of dry hopper storage. If the redundant mix tank is used, the City could avoid having to expand this system.
Based on observations and typical polymer system in the industry, it is recommended the City re-evaluate the existing system design. The current polymer system is made by an unknown manufacturer of polymer equipment (AccuRate) and mixing is critical to proper polymer activation. Also, Acrylamide is on EPA’s radar to regulate and proper activation reduces require dose. The solution in the mix tanks appears to be poorly activated as denoted by the “fish eyes” in the solution.
Additionally, the storage of dry polymer is limited to 250 lbs and is manually loaded. A system of this size should as a minimum be 1,000 lbs supersac (max use will be 700 lbs/day). The pumps utilized to transfer polymer are air driven diaphragm pumps. These type of pumps create a lot of shear breaking the polymer chains and reducing the effectiveness.They are also extremely difficult to accurately meter.
If the polymer is held more than 24 hours the activated polymer starts to lose its effectiveness and degrades. The tank system should automatically reduce the volume depending on the polymer demand to maintain the correct aging time. The water utilized for polymer activation should be de-chloraminated to improve activation. This could be done with a GAC unit that quenches the chloramine. For these reasons, the polymer system should be re-designed.
3.3.7.5 Lime
3.3.7.5.1 Description
Calcium oxide, also known as lime, is used for pH adjustment of the process water after sedimentation. The DLTWTF feeds lime at the end of the conventional treatment sedimentation basins before the water is blended with Actiflo™ settled water in the low lift pump station. Lime is needed because the settled water has a low pH and the desired ozone pH is between 6.5 and 7.5. The DLTWTF has two lime slakers to create the lime slurry before it is pumped and fed to the end of the sedimentation basins.
Table 3.26 shows the original design criteria for the lime system.
| Parameter | Units | Value |
|---|---|---|
| No. of Dry Storage Tanks | - | 1 |
| Dry Storage Tank Capacity | lbs | 333,500 |
| Days of Available Storage | days | 17.8 |
| Average Dose | mg/L of Lime | 26.9 |
| Designed Plant Flow Rate | mgd | 100 |
| Slaker Capacity | lb/hr | 2,000 |
Notes:
- (1) Based on 2014 and 2015 averages provided by the City.
3.3.7.5.2 Existing Process Performance
Lime is used for pH adjustment. However, staff noted a higher hardness concentration when the ASR wells are used at the DLTWTF's raw water source. During these times, operations will dose lime until it reaches 60 pounds per minute (ppm). If the pH has not been adequately adjusted at this dose, caustic is then used to increase the pH.
Lime addition could be more effective if dosed into the entire flow. Presently, lime is added in a small application zone downstream of each sedimentation basin. This causes localized pH values high enough to create calcium carbonate precipitation, which, after forming, does not adequately re-dissolve before filtration.
Staff report that high lime doses consistently cause excess particulate capture in the filters, adversely effecting filter performance, specifically headloss. Not only does this cause shorter filter run times, it forces staff to reduce their lime dose in preference to sodium hydroxide, a far more costly means for pH adjustment.
The ability to span the entire end of the sedimentation basin with a lime slurry feed line would greatly improve the plant's ability to increase lime dosages. It will also reduce the use of caustic soda without compromising filter performance. Replacing the traveling bridge system with a newer and more efficient sludge collector system would also greatly simplify the logistics of designing, installing, and operating a lime application/feed system that would eliminate, or at least minimize, calcium carbonate precipitation at the point of (or downstream of) lime addition. Also worth considering is pH adjusting the entire flow stream (settled Actiflo™ and settled conventional waters).
Additionally, the lime slaking process may compromise the quality of lime introduced into the system. These considerations include, but are not limited to:
- Chemical composition of the limestone.
- Particle size should be relatively uniform and temperature controlled closely to prevent soft-burned and hard-burned quicklime.
- Kiln temperature.
- Residence time within kiln.
- Surface area of slaked lime.
- Lime to water ratio.
- Degree of agitation.
- Viscosity of slurry.
These factors influence the quality of lime produced and therefore have a great impact on the overall process efficiency. As stated, this system is undergoing a new design where Carollo has reviewed and provided subsequent recommendations.
As Figure 3.31 shows, at the 2014/2015 average lime dose of 37.8 mg/L and 140 mgd, approximately 7.56 day of storage is available. Additional storage will be needed if the plant is expanded and current process operations continued.
3.3.7.6 Caustic Soda
3.3.7.6.1 Description
Sodium hydroxide, also known as caustic soda, is typically used to increase the pH of process water. At the DLTWTF, 50 percent caustic is used to increase the pH of the water prior to the ozonation process. Caustic can be fed into the low lift pump station discharge header box, the settled water junction box, or the Hawkey Box.

Table 3.27 details the original caustic system design.
| Parameter | Units | Value |
|---|---|---|
| No. of Storage Tanks | - | 3 |
| Storage Tank Capacity | gal | 20,000 |
| Total Storage Capacity | gal | 60,000 |
| Days of Available Storage(1) | days | 17.0 |
| Average Dose | mg/L as NaOH | 31.2 |
| Designed Plant Flow Rate | mgd | 100 |
| No. of Feed Pumps (duty/ standby) | - | 2/1 |
| Maximum Dose | mg/L | 70.7 |
Notes:
- (1) Original design storage determined by average dose and 80 percent design plant flow rate.
3.3.7.6.2 Existing Process Performance and Ability to Expand
Plant staff noted that caustic is used only when lime alone cannot increase the pH sufficiently without impairing filter performance. As stated previously, a lower dose of caustic can be used in lieu of lime to prevent calcium carbonate precipitation. However, caustic is very costly (since it depends on PVC and petroleum costs), and this operation (use of lime and caustic together) is not favored economically or for overall finished water quality.
As Figure 3.32 shows, at an average delivered product dose of 18.95 mg/L, 34.6 days of storage is available at 140 mgd.
3.3.7.7 Ammonia
3.3.7.7.1 Description
Anhydrous ammonia is used with chlorine to form monochloramine for secondary disinfection. Typically, monochloramine is favorable as a secondary disinfectant when the potential for disinfection byproduct formation in the treated water is high.

Table 3.28 shows the original design of the existing system.
| Parameter | Units | Value |
|---|---|---|
| No. of Storage Tanks | - | 2 |
| Storage Tank Capacity | gal | 2,000 |
| Total Storage Capacity | gal/lbs | 4,000/21,640 |
| Days of Available Storage(1) | days | 25.5 |
| Average Dose | mg/L as ammonia | 1.20 |
| Designed Plant Flow Rate | mgd | 100 |
| No. of Ammoniators | - | 3 |
| Average Dose(1) | mg/L | 1.48 |
| Maximum Dose | mg/L | 2.50 |
Notes:
- (1) Original design storage determined by average dose and 80 percent design plant flow rate.
3.3.7.7.2 Existing Process Performance
The average dose for 2014 and 2015 was 1.48 mg/L as ammonia. As Figure 3.33 shows, this dose provides only 12 days of available storage at the 140 mgd flow rate. Therefore, more storage capacity will be required when the plant is expanded if this system is not already replaced by that time.
3.3.7.8 Chlorine
3.3.7.8.1 Description
Chlorine is used with ammonia to form monochloramine for secondary disinfection. The system includes four chlorine evaporators, six chlorinators, a rail car unloading system, and a chlorine booster pump (used when the ASR wells are online).
Chlorine and ammonia are also used to reduce bromate formation through ozonation. Chlorine is added with lime at the end of the basins, and ammonia is added at the low-lift pump station.
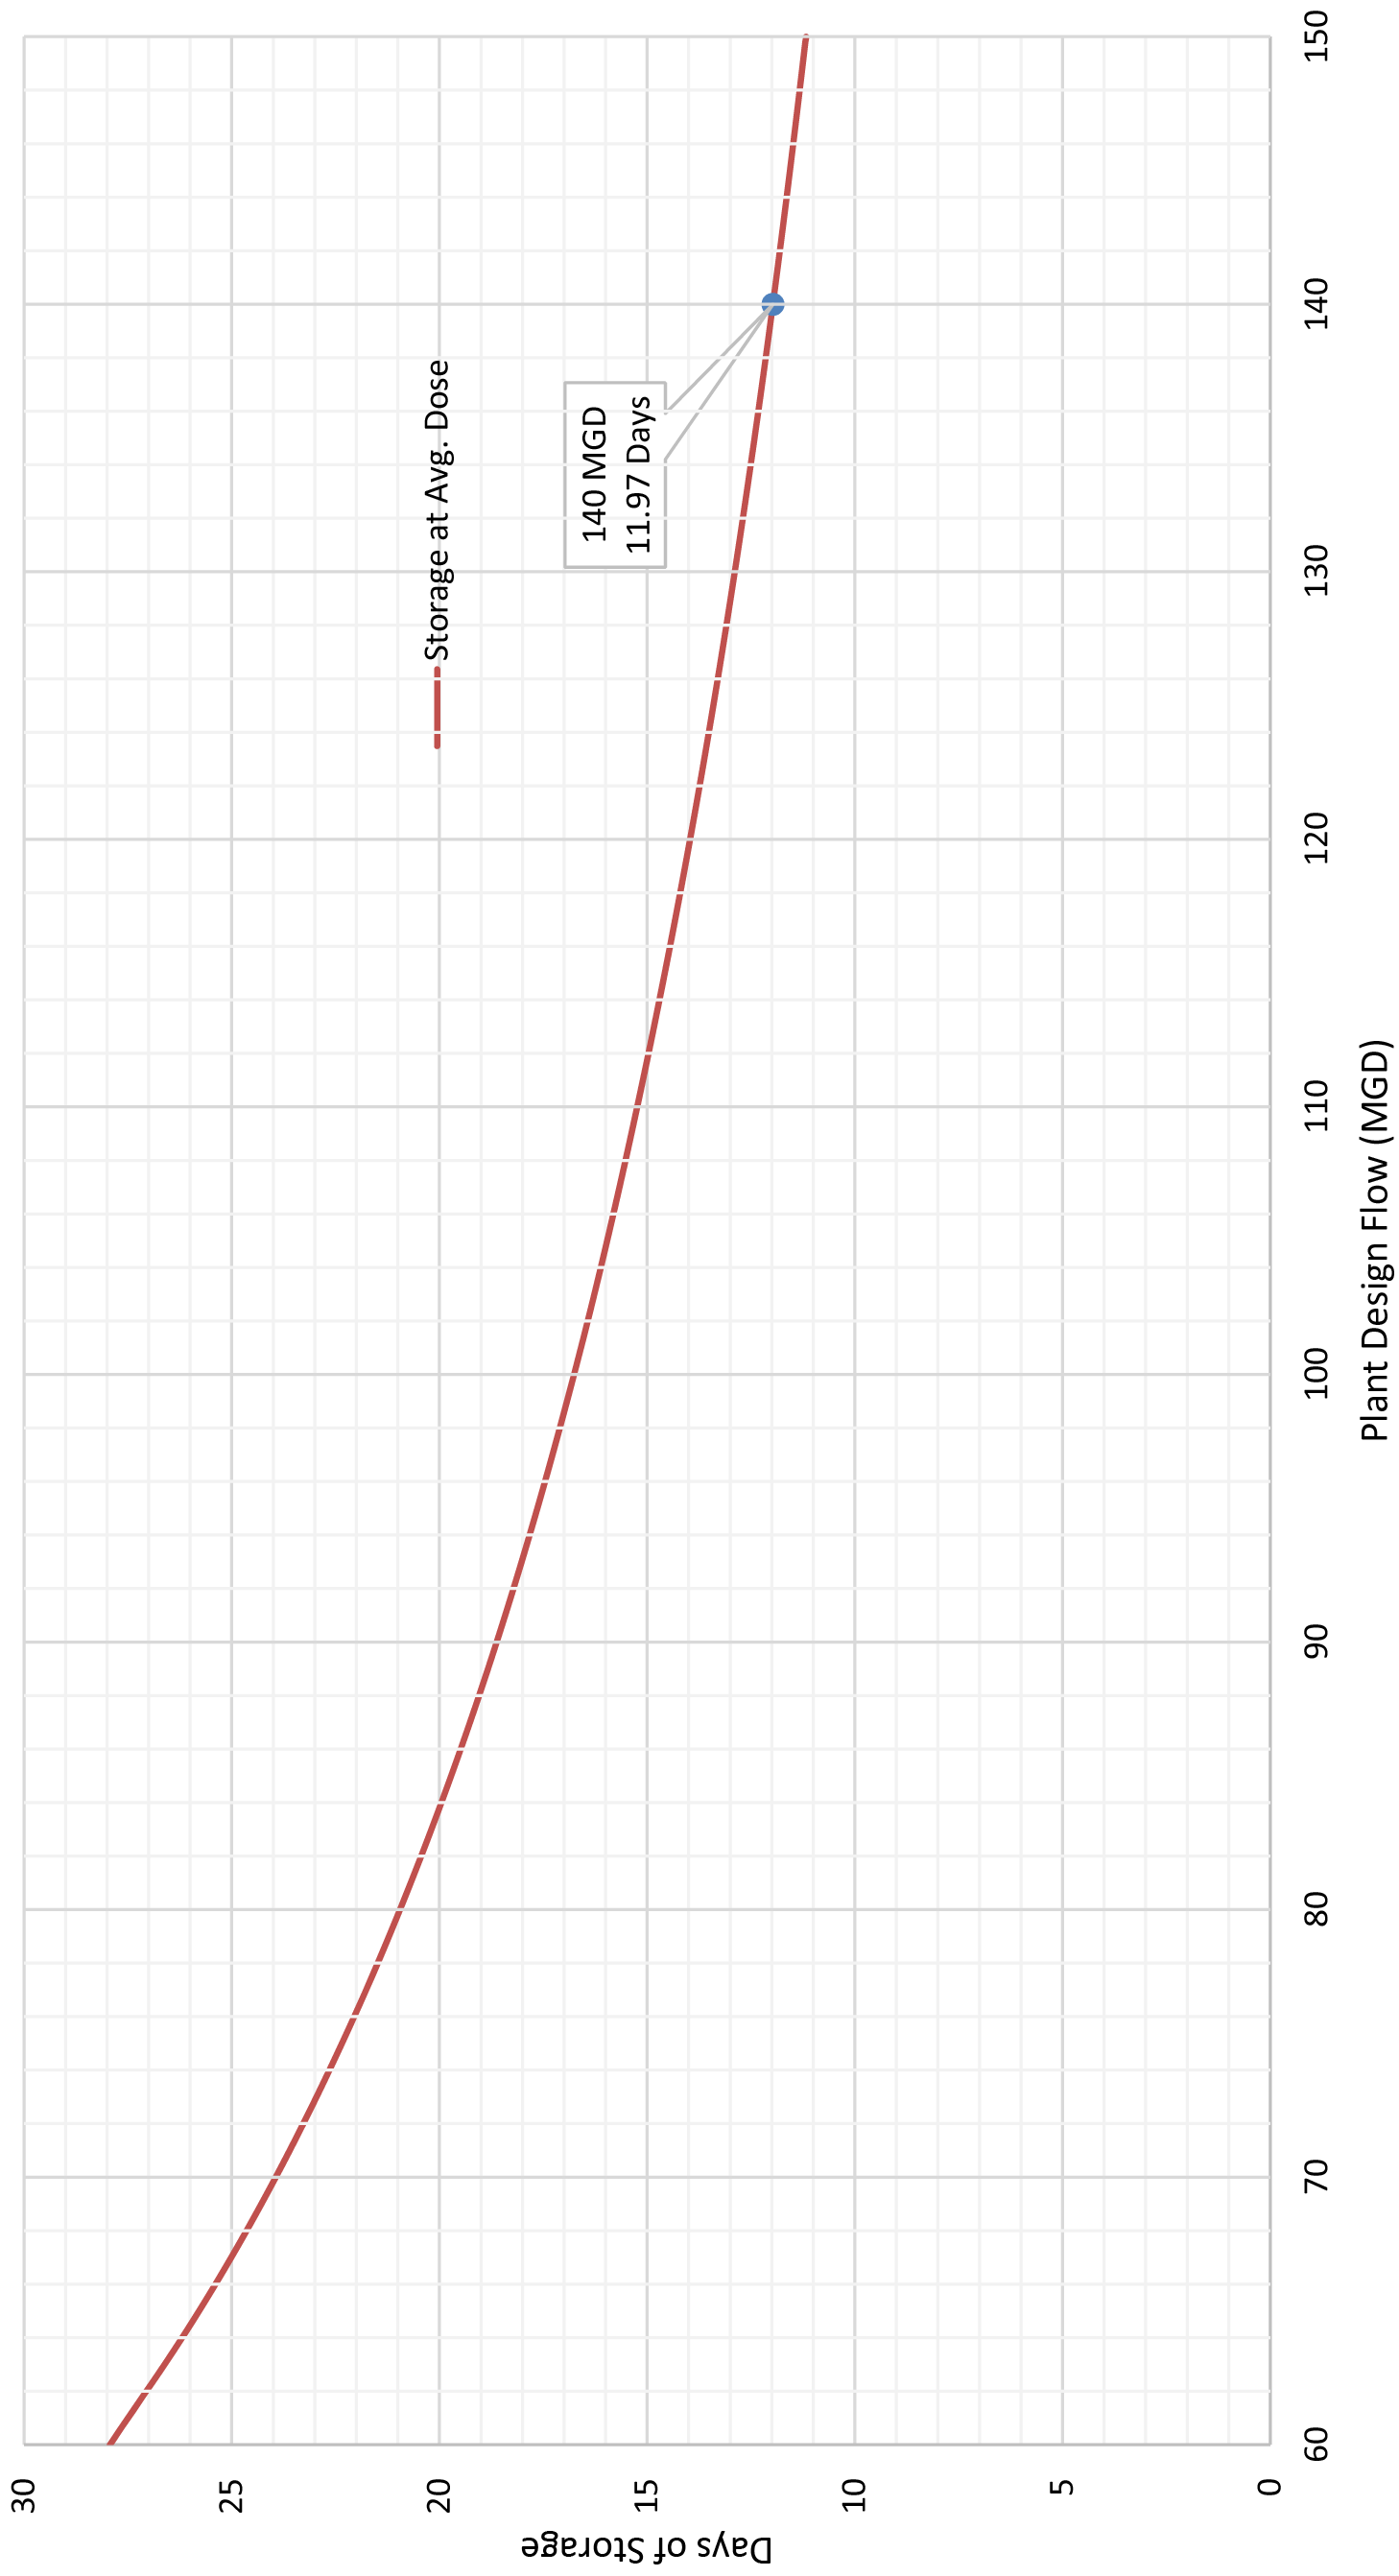
Table 3.29 details the original design of the chlorine system.
| Parameter | Units | Value |
|---|---|---|
| No. of Rail Cars | - | 1 |
| Rail Car Capacity | tons | 90 |
| Total Capacity | tons | 90 |
| Days of Available Storage(1) | days | 54 |
| Maximum Dose | mg/L as chlorine | 5.0 |
| Designed Plant Flow Rate | mgd | 100 |
| No. of Evaporators | - | 4 |
| Evaporator Capacity | ppd | 10,000 |
| Total Evaporator Capacity | ppd | 40,000 |
Notes:
- (1) Original design storage determined by maximum dose and 80 percent design plant flow rate.
3.3.7.8.2 Existing Process Performance
The actual average daily dose in 2014 and 2015 was 6.58 mg/L as chlorine. Figure 3.34 shows the storage capacity at this dosage with plant flows up to 150 mgd. At a 140 mgd plant flow rate, 23.4 days of storage are available based on one 90-ton rail car. The Chlorine Storage and Feed System Alternatives Evaluation, as detailed in Appendix 5A, explains this and provides recommendations for replacing the existing system with an on-site generation system.
3.3.7.9 Fluoride
3.3.7.9.1 Description
To prevent tooth decay, fluoride is dosed into finished water prior to distribution. The DLTWTF uses 23 percent hydrofluosilicic acid as its source of fluoride, which is stored in a 10,000 gallon bulk storage tank. One of three pumps feeds fluoride into either the settled water junction box or the blend chamber.
FIGURE 3.34
CHLORINE STORAGE CAPACITY AT VARIOUS PLANT FLOW RATES
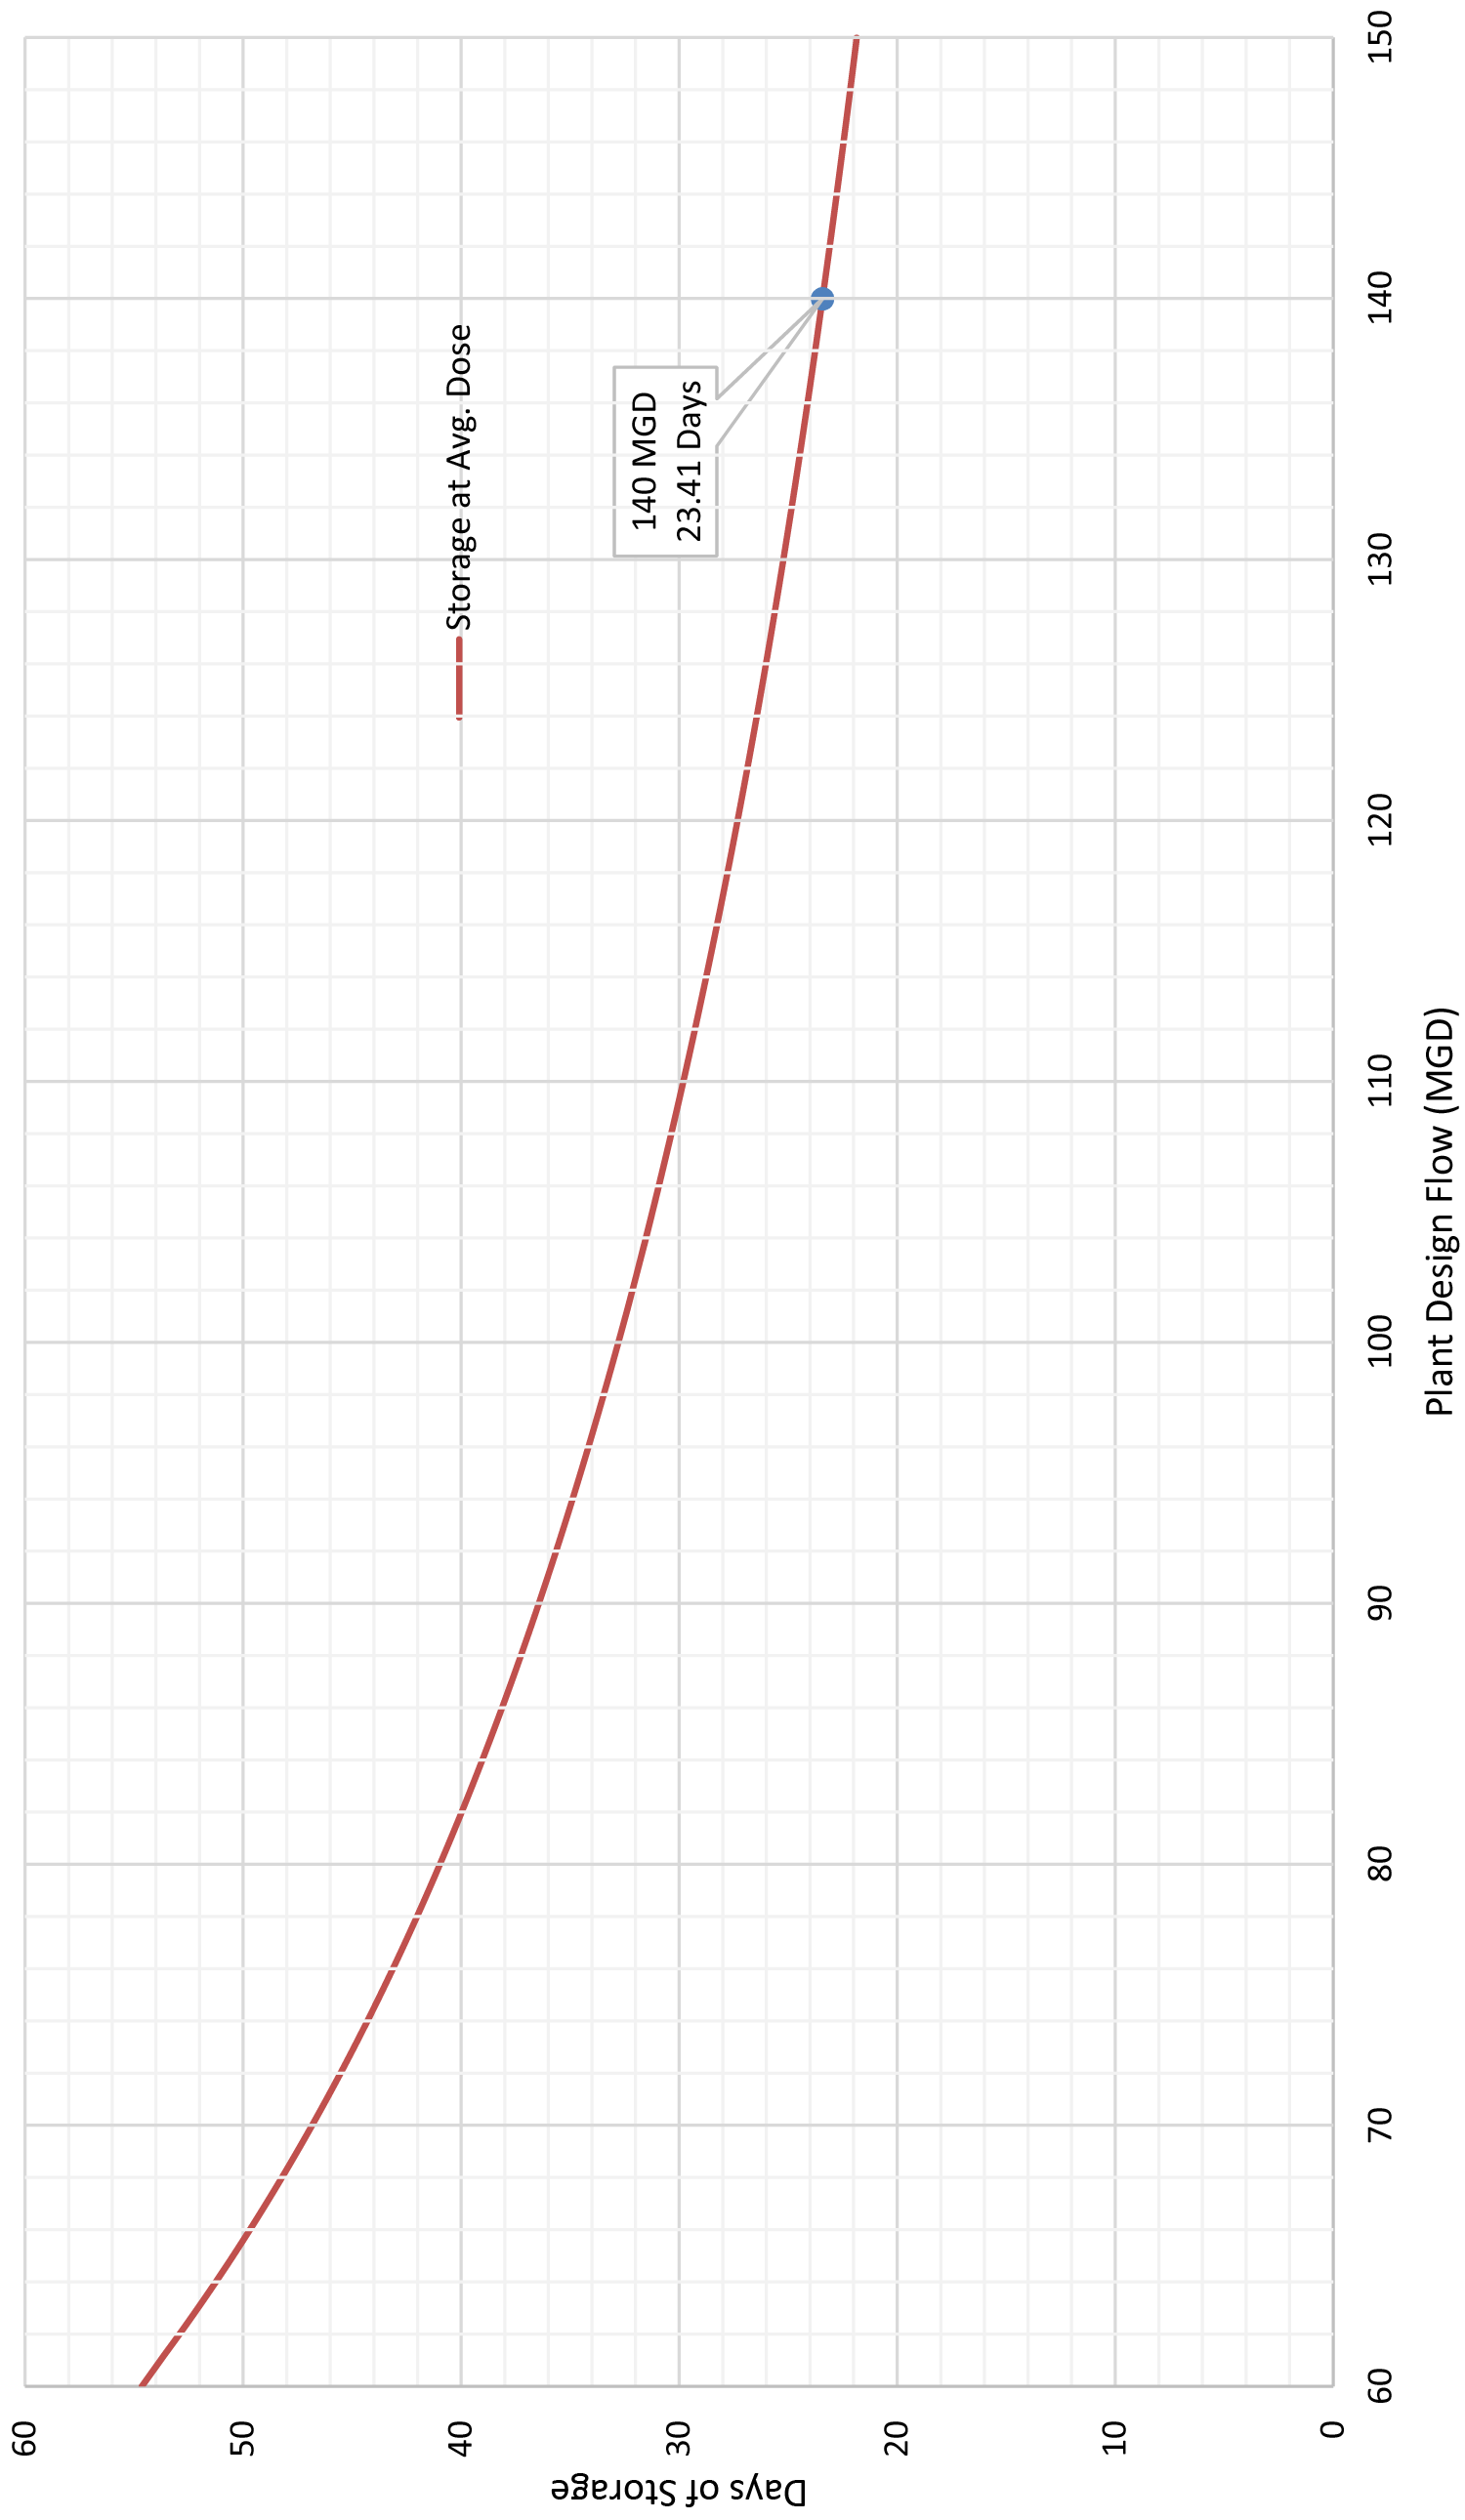
CITY OF TAMPA
DAVID L. TIPPIN WTF MASTER PLAN
Table 3.30 shows the original design details for the fluoride system.
| Parameter | Units | Value |
|---|---|---|
| No. of Storage Tanks | - | 1 |
| Storage Tank Capacity | gal | 10,000 |
| Days of Available Storage(1) | days | 47.0 |
| Average Dose | mg/L as F | 0.50 |
| Maximum Dose | mg/L as F | 1.1 |
| Designed Plant Flow Rate | mgd | 100 |
| No. of Feed Pumps (duty/ standby) | - | 2/1 |
| Feed Pump Capacity | gpm | |
| Notes: (1) Original design storage determined by average dose and 80 percent designed plant flow rate. | ||
David L. Tippin Water Treatment Facility Master Plan City of Tampa
3.3.7.9.2 Existing Process Performance and Ability to Expand
The actual average dose is 0.31 mg/L as F. The corresponding days of available storage at 140 mgd would be 50.4 days, as shown in Figure 3.35. The existing storage is sufficient for future flows based on these calculations.
FIGURE 3.35
FLUORIDE STORAGE CAPACITY AT CURRENT AVERAGE DOSE AND VARYING FLOWS
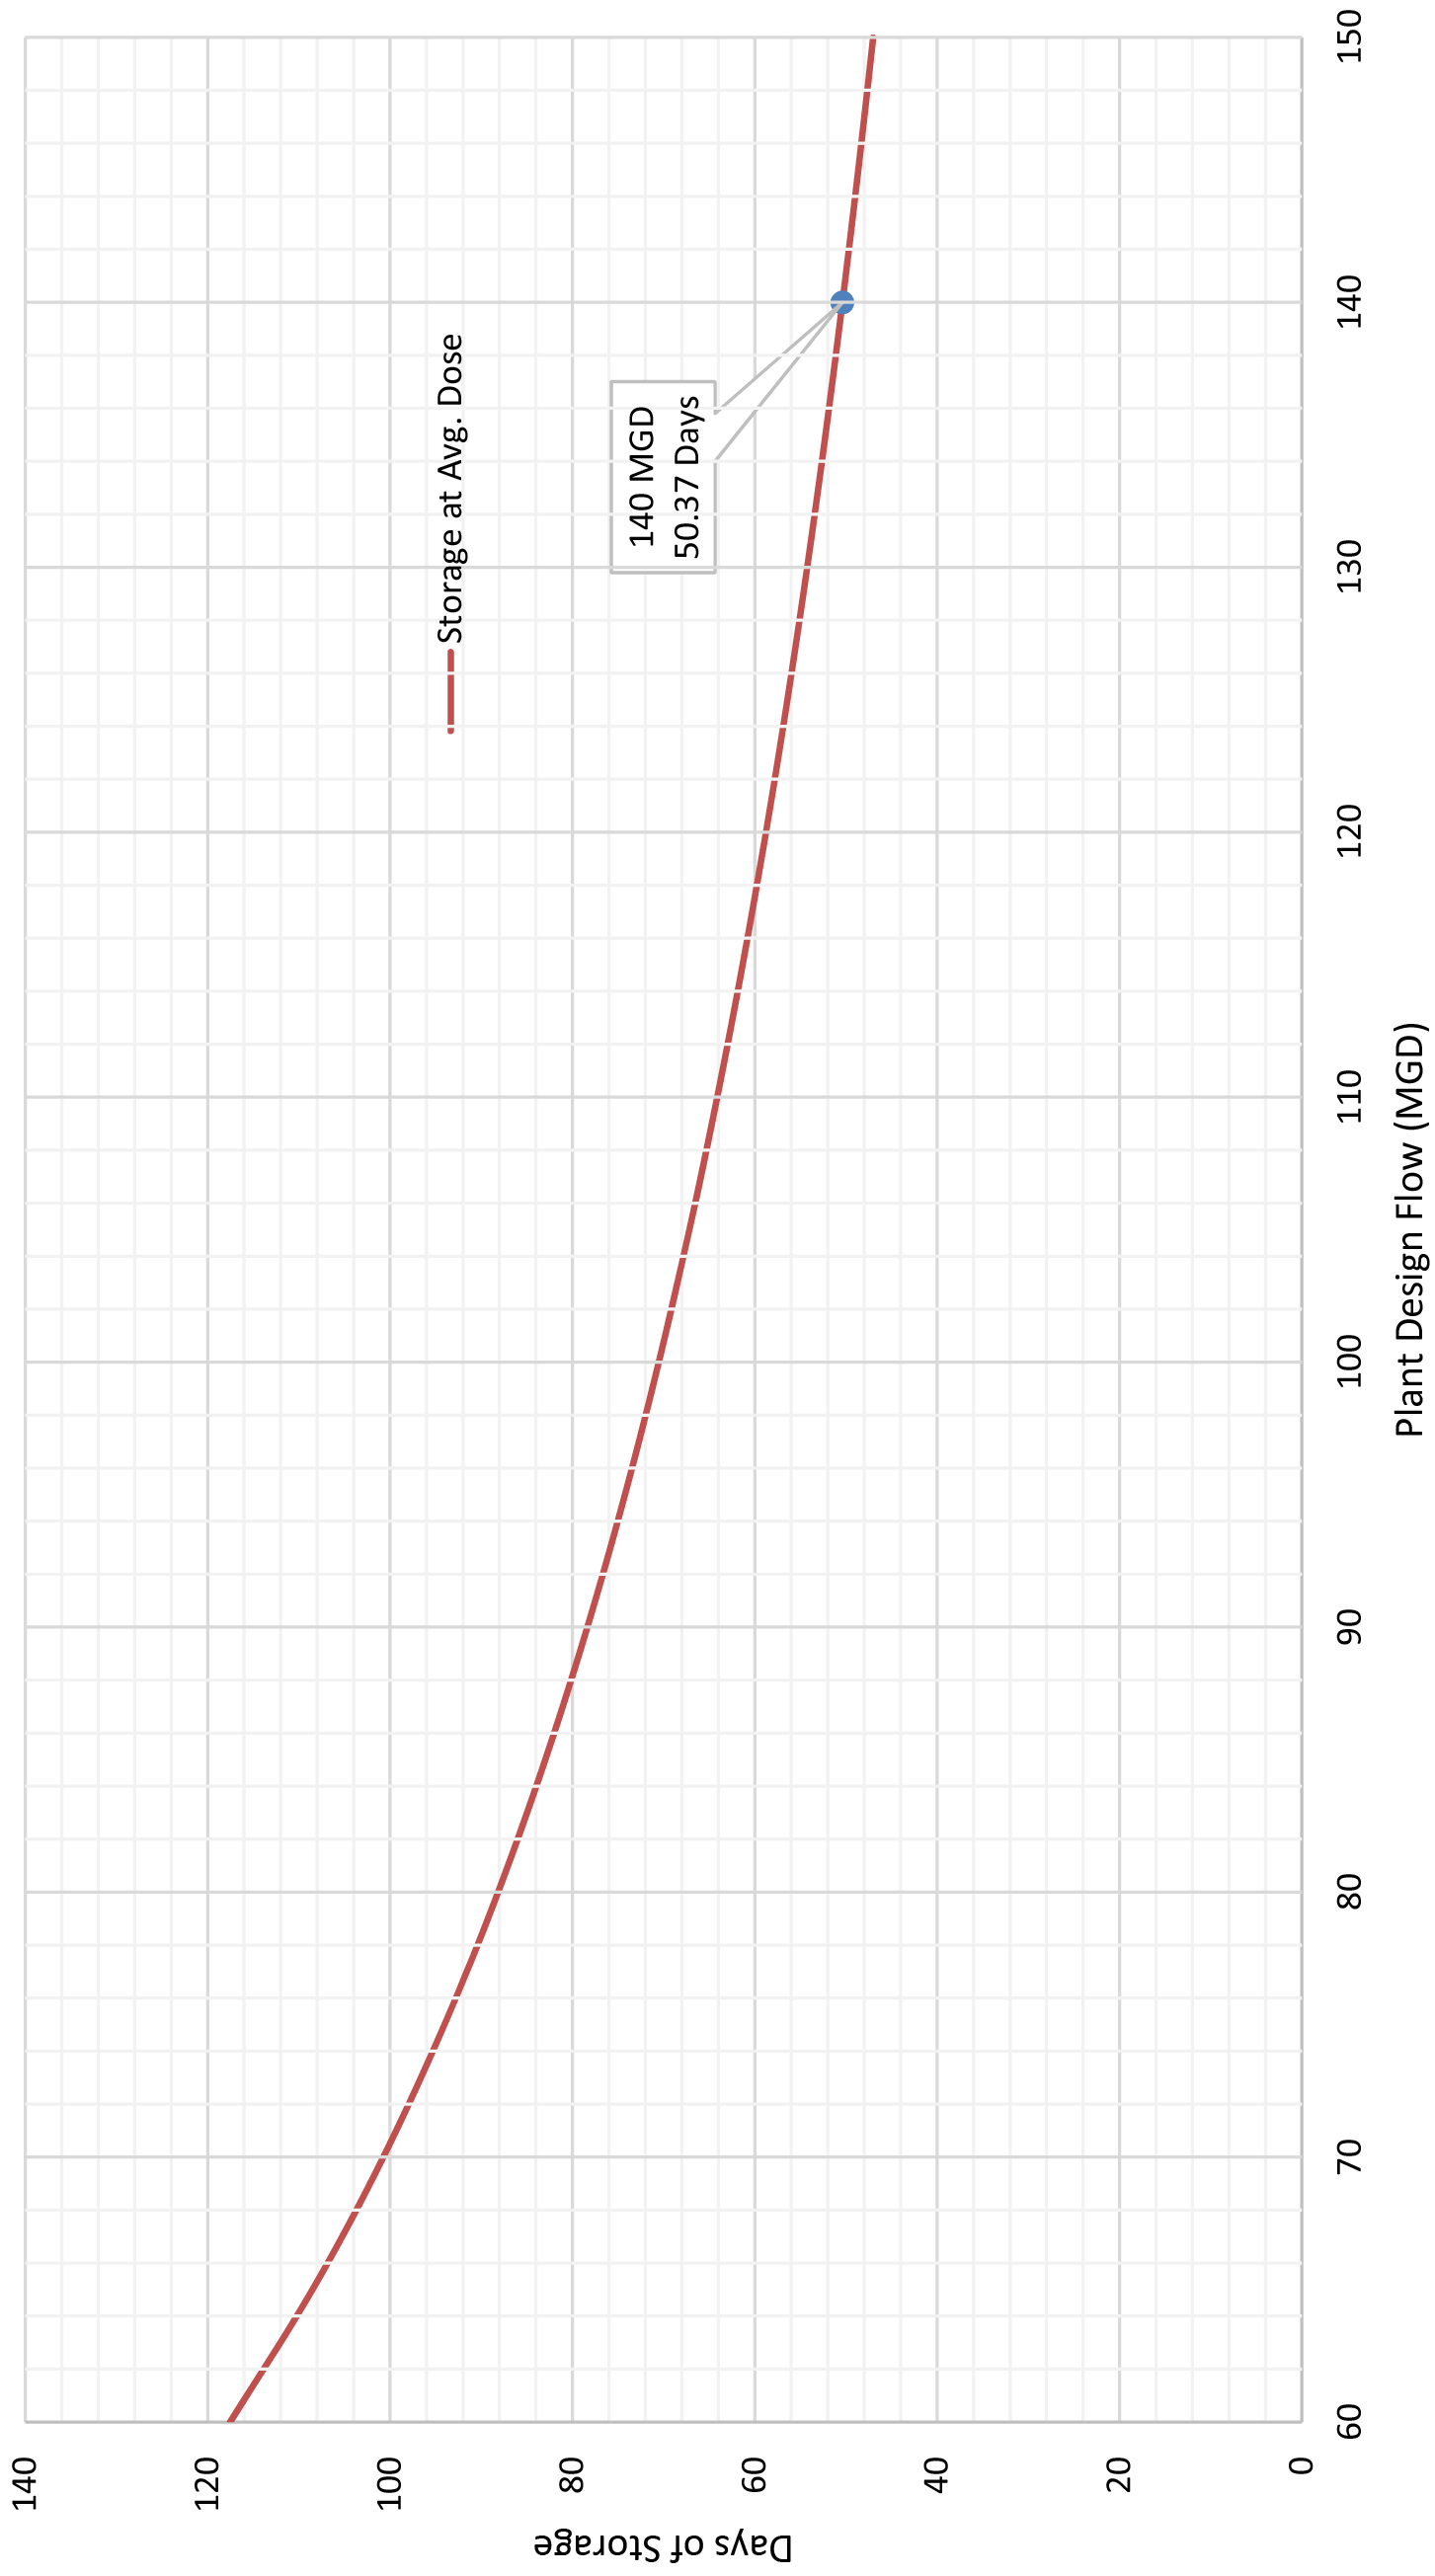
3.3.7.10 Summary of Chemical Systems
Table 3.31 shows the average dose for 2014 and 2015 and the resulting available storage for each chemical. The Ten States Standards require 30 days of storage. However, additional information on the frequency of deliveries and the desired storage requirements should be determined by the City, since previous designs did not consider the standard.
| Parameter | Units | Value |
|---|---|---|
| Ferric Sulfate | ||
| Average Dose | mg/L | 121.5 |
| Available Storage at 140 mgd Plant Flow | days | 17 |
| Sulfuric Acid | ||
| Average Dose | mg/L | 59.8 |
| Available Storage at 140 mgd Plant Flow | days | 6.6 |
| Hydrogen Peroxide | ||
| Average Dose | mg/L | <0.10 |
| Available Storage at 140 mgd Plant Flow | days | 20 |
| Polymer | ||
| Average Dose | mg/L | 0.49 |
| Available Storage at 140 mgd Plant Flow | days | 14 (for dry pallets) |
| Lime | ||
| Average Dose | mg/L | 37.8 |
| Available Storage at 140 mgd Plant Flow | days | 7.5 |
| Caustic | ||
| Average Dose | mg/L | 18.95 |
| Available Storage at 140 mgd Plant Flow | days | 34.6 |
| Ammonia | ||
| Average Dose | mg/L | 1.48 |
| Available Storage at 140 mgd Plant Flow | days | 12 |
| Chlorine | ||
| Average Dose | mg/L | 6.58 |
| Available Storage at 140 mgd Plant Flow | days | 23.4 |
| Fluoride | ||
| Average Dose | mg/L | 0.31 |
| Available Storage at 140 mgd Plant Flow | days | 50.4 |
3.3.8 Waste Washwater, Sedimentation Basin Solids, and Thickening System
3.3.8.1 Description
Residuals produced at the DLTWTF receive preliminary treatment on site with equalization of waste wash water and gravity thickening of both sedimentation basin solids and waste wash water. The DLTWTF has four gravity thickeners (GTs) that settle residuals and increase residuals concentration. The decant from the thickeners is routed back to the head of the plant, while the thickened residuals are sent off-site for further processing.
The system consists of a surge tank, four gravity thickeners, two splitter boxes, and two sludge pumping stations. The GTs receive residuals from the conventional, Actiflo™, and surge tank systems. Specifically, GT No. 1 and No. 2 receive residuals from the conventional system, GT No. 3 from the Actiflo™ system, and GT No. 4 from the surge tank system (with the ability to route Actiflo™ sludge to GT No. 4).
Splitter Box No. 1 and 2 share a common concrete structure and feed GT No. 1 and 2, whereas GT No. 3 and GT No. 4 receive flow directly from the Actiflo™ system and surge tank pumps, respectively. Since the mechanism for GT 4 has been out of service, GT 3 receives all the flow from Actiflo™ and the surge tank. Figure 3.36 shows the existing solids process flow diagram.
The surge tank receives filter backwash water, where two large filter backwashes produce 203,400 gallons and two small filter backwashes produce approximately 120,000 gallons. Currently, the three pumps have dual duties, transferring the washwater from the surge tank to the thickener and providing recirculation water to combat solids deposition in the tank. As a result, the available volume within the surge tank is limited, as described in Chapter 4.
Table 3.32 shows the original design criteria for the gravity thickeners and surge tank, based on the record drawings and O&M Manuals.
| Parameter | Units | Value |
|---|---|---|
| No. of Gravity Thickeners | - | 4 |
| Diameter (all GTs) | ft | 105.0 |
| Side Water Depth (all GTs) | ft | 12.0 |
| Volume (each GT) | gal | 778,000 |
| Influent Design Flow Rates | ||
| Gravity Thickener 3 & 4 (avg/min/peak) | gpm | 2,060/480/4,000 |
| Parameter | Units | Value |
|---|---|---|
| Residuals Withdrawal Rates | ||
| Gravity Thickener 3 & 4 (avg/peak) | gpm | 400/800 |
| Hydraulic Loading Rate (max day/peak) | ||
| Gravity Thickener 1 & 2 | gpd/sq ft | 306/687 |
| Gravity Thickener 3 | gpd/sq ft | 214/631 |
| Solids Loading Rate | ||
| Gravity Thickener 1 & 2 | lb/day/sq ft | 2.7 |
| Gravity Thickener 3 | lb/day/sq ft | 3.5 |
| Weir Loading Rates (max day/peak) | ||
| Gravity Thickener 1 & 2 | gpm/ft | 5.3/11.9 |
| Gravity Thickener 3 | gpm/ft | 4.1/12.1 |
| Waste Washwater Surge Tank | ||
| Diameter | ft | 80 |
| Capacity | gal | 415,000 |
| Side water depth | ft | 10 |
| No. of Pumps | - | 3 |
| Pump Rating | gpm at TDH | 2,335 at 44' |
| TOC in Returned Filtrate to Plant | ||
| Pre-settled sample | mg/L | 87 |
| Settled sample | mg/L | 51 |

EXISTING SOLIDS PROCESS FLOW DIAGRAM FIGURE 3.36 CITY OF TAMPA DAVID L. TIPPIN WTF MASTER PLAN
3.3.8.2 Existing Process Performance and Ability to Expand
The theoretical solids loading rates were estimated using the following equations: 5KHE@O HK=@EJC N=PA L >5HQ@CA 2NK@Q?PEKJ :H>//); ∗ (HKS :/)&?/5QNB=?A #NA= KB 6DE?GAJAN :OM BP;. Where:
- 5HQ@CA 2NK@Q?PEKJ
- L 8.34 ∗ :PKP=H OQOLAJ@A@ OKHE@O ?KJ?AJPN=PEKJ :IC/.; E 2.9 ∗ BANNE? @KO=CA E LKHUIAN @KOA :IC/.; E IE?NKO=J@ HKOO BNKI #?PEBHK™ :IC/.; E 61% NAIKRA@ :IC/.;
Because a typical total suspended solids concentration is between 0.5 and 3.0 times the raw water turbidity, a factor of 1.5 was used. The average ferric sulfate dosage in 2014 and 2015 was 121.5 mg/L, the average dry polymer dose was 0.51 mg/L, and the average Actiflo™ microsand loss was 0.61 mg/L. Additionally, the GTs have a diameter of 105 feet, with one assumed to be out of service. Therefore, the solids loading rates experienced are as follows:
- At 80 mgd plant flow, solids loading rate is 1.74 lb/day/sq ft.
- At 120 mgd plant flow, solids loading rate is 2.61 lb/day/sq ft.
- At 140 mgd plant flow, solids loading rate is 3.05 lb/day/sq ft.
The theoretical amount of solids produced each year at 80, 120, and 140 mgd are 14.4, 21.6, and 25.2 million pounds per year, respectively. Therefore, the solids loading rate is exceeded for GTs No. 1 and No. 2 at the 140 mgd flow condition.
The sludge flow data provided did not help determine the actual hydraulic and weir loading rates. However, these values were estimated by assuming that 0.25 percent of the total plant flow enters the GTs from the conventional and Actiflo™ processes, and that 2.5 percent of the total plant flow is filter backwash wastewater from the surge tanks to the GTs. Table 3.33 shows these results. Intended operation assumes that GT 4 would be back on-line and would receive flow from the surge tank.
As the table shows, hydraulic and weir loading rates are exceeded for plant flows at and above 80 mgd for GT 4. However, actual sludge flow rates should be confirmed.
Splitter Box 1 and 2 have experienced overflow issues, and, theoretically, the sludge systems are interconnected. However, staff noted that they cannot use the thickeners in alternative arrangements due to hydraulic constraints. Furthermore, the sludge from the Actiflo™, conventional, and surge tank systems has a different consistency and character, which can affect operations and efficiency, since sludge dewatering systems are typically designed to process one type of sludge. Additionally, the varied sludge types can cause issues with the off-site processing facility.
| Parameter | Units | 80 mgd | 120 mgd | 140 mgd |
|---|---|---|---|---|
| Hydraulic Loading Rate | ||||
| GT 1 | 5.77 | 11.6 | 14.4 | |
| GT 2 | 5.77 | 11.6 | 14.4 | |
| GT 3 | 11.55 | 11.6 | 11.6 | |
| GT 4 | 231 | 346 | 404 | |
| Weir Loading Rate | ||||
| GT 1 | 0.11 | 0.21 | 0.26 | |
| GT 2 | 0.11 | 0.21 | 0.26 | |
| GT 3 | 0.11 | 0.21 | 0.21 | |
| GT 4 | 4.21 | 6.32 | 7.37 | |
Filtrate from the dewatering process is returned to the influent flow stream and reprocessed at the plant. While this concept does conserve recycled water, it does so at a high (comparative) cost. The TOC from a sample taken on November 3, 2016, was 87 mg/L prior to settling. It dropped to 51 mg/L after the particulate settled out from the returned flow stream.
Studies have shown that TOC adsorption depends greatly on pH, and that it can re-solubilize from the ferric hydroxide flow when the pH is raised. Depending on where the returned flows are discharged, a portion of the TOC previously removed during processing by chemical precipitation is likely being returned to the plant influent.
Processing the solids at lower pH values to minimize desorption of TOC may help. Avoiding the use of this recycled flow stream most of the time, especially during high river flows, could also help. Recommendations to remedy these issues are included at the end of this chapter.
3.3.9 Finished Water Systems
3.3.9.1 Hawkey Box and Blending Chamber
3.3.9.1.1 Description
The Hawkey Box follows the filtered water flume and precedes the blending chamber, which both receive the total plant flow. Recently, the mixer inside the existing Hawkey Box, originally installed to mix chlorine and ammonia, was removed due to recommendations from the hydraulic assessment.
The blending chamber follows the Hawkey Box and uses baffle walls for a serpentine flow to provide contact time for disinfection prior to distribution to the clearwells. Chlorine, fluoride, and caustic are added at the Hawkey Box, and ammonia is added at the downstream end of the blending chamber.
3.3.9.1.2 Existing Process Performance and Ability to Expand
The precipitation of calcium carbonate in the Hawkey Box and downstream facilities is an issue likely due to adding caustic soda. Table 3.34 shows the water quality of the combined flow after filtration and adding 6.5 mg/L of chlorine, as well as the required amount of caustic soda to achieve pH 7.9. The result is an increase in pH and a positive calcium carbonate precipitation potential. At the addition point of caustic soda, localized pH, and the resulting CCPP may be higher.
| Coagulation pH | Raw Water Alkalinity (mg/L As CaCO₃) | Lime Dose (Overall Dose) | Resulting pH In Combined | CCPP Combined Flow (mg/L As CaCO₃) |
|---|---|---|---|---|
| 3.9 | 46 | 36/0.3 | 7.9 | -0.10 |
| 3.9 | 143 | 60/59 | 7.9 | 18.6 |
| 5.5 | 46 | 27/5 | 7.9 | -1.30 |
| 5.5 | 143 | 60/43,5 | 7.9 | 18.6 |
These structures can process the expanded flow, but they would induce higher head conditions upstream. Chapter 4 discusses this and makes recommendations to remedy the hydraulic issues. Therefore, no additional recommendations are required for process control.
3.3.9.2 Clearwell Systems
3.3.9.2.1 Description and Ability to Expand
Five clearwells are on site, ranging from 0.5 to 7.5 million gallons. The chloraminated water flows through each clearwell in the following path:

7.5 MG → 5.0 MG → 5.0 MG →0.5 MG → 2.0 MG
Next, one of three high service pump stations sends the flow to distribution. These pumps require a minimum depth (submergence) of water within the clearwells to operate. Because of this requirement, only 60 percent of the storage volume within the clearwell is estimated to be useable. Chapter 2 and 4 detail the recommendations for improving the high service pumping and clearwell systems.
3.4 RECOMMENDED PROCESS IMPROVEMENTS
The selected alternative will address most of the process issues identified in this evaluation, which Chapter 5 discusses. However, there are some process improvements that are required and are separate from the alternative process options. Each improvement is detailed in subsequent sections.
Items noted for rehabilitation or replacement because of the condition or hydraulic assessments are noted in Chapter 2 and 5, respectively and included in 15-year CIP. This section presents alternative ideas for specific items that do not change the treatment process as a whole and presents ideas for the City's consideration.
3.4.1 On-site Sludge Handling Improvements
Due to the configuration and operations of the current solids flow, a number of issues may be occurring, including:
- Different sludge consistencies and characteristics between each gravity thickener.
- TOC desorption from sludge due to unintended pH differences between sludges (i.e., high pH filter backwash wastewater [FWW] sludge combining with low pH conventional basin sludge).
- GT No. 3 acting as a clarifier for the diluted filter backwash wastewater.
Given these issues and the need for expansion, Figure 3.37 shows the proposed additions and changes to the solids flow, including:
- Monitor sludge, supernatant, and thickened sludge flows to and from the GTs and surge tank
- For FWW sludge handling:
- Convert GT No. 4 to a clarifier that will receive FWW flows from existing surge tank.
- Add a new GT to follow clarifier.
- Add a new surge tank to receive additional FWW flows, followed by a new clarifier and new GT.
- Direct belt filter press filtrate to the existing surge tank.
- Dedicate Actiflo™ Sludge to GT No. 3 (as previously intended).
- Add new supporting pump stations.

PROPOSED SOLIDS FLOW DIAGRAM FIGURE 3.37 CITY OF TAMPA DAVID L. TIPPIN WTF MASTER PLAN
These improvements would enhance the sludge consistency between gravity thickeners and sludge transferred to the off-site solids processing facility while also allowing for more redundancy, functionality, and expansion for future flows. Final design of this system should take into consideration the following:
- Any sludge collection improvements within conventional basins and impact on sludge concentration.
- Changes in sludge consistency and character from process improvements or changes in treatment.
- Confirmation of solids, hydraulic, and weir loading rates (understanding these values could help eliminate new GT No. 5 and allow for primary clarifier FWW to go to one GT [new GT No. 4]).
- Sludge processing equipment at the off-site sludge processing facility and abilities to process sludge produced because of these changes.
- The geographic locations of the new facilities and the associated hydraulics.
Figure 3.38 shows possible proposed locations, however there is ample space available at the off-site sludge processing facility that can also be utilized for these new systems.
3.4.1.1 Conventional Basin Sludge Collection
Based on the results from the condition assessment, the existing traveling bridge sludge collectors are outdated and maintenance intensive. Installing a new sludge collection mechanism system in each train is thus recommended. The two major types recommended for additional consideration are chain and flight and super scraper.
The chain and flight type systems consist of continuous chains with cross flights that span the width of the basin. Flights trace the bottom of the basin and push the settled sludge along the bottom to a cross collector or trough, where the sludge is removed from the basin. Because of the system's robustness, it can remove heavier solid loads than other sludge removal means.
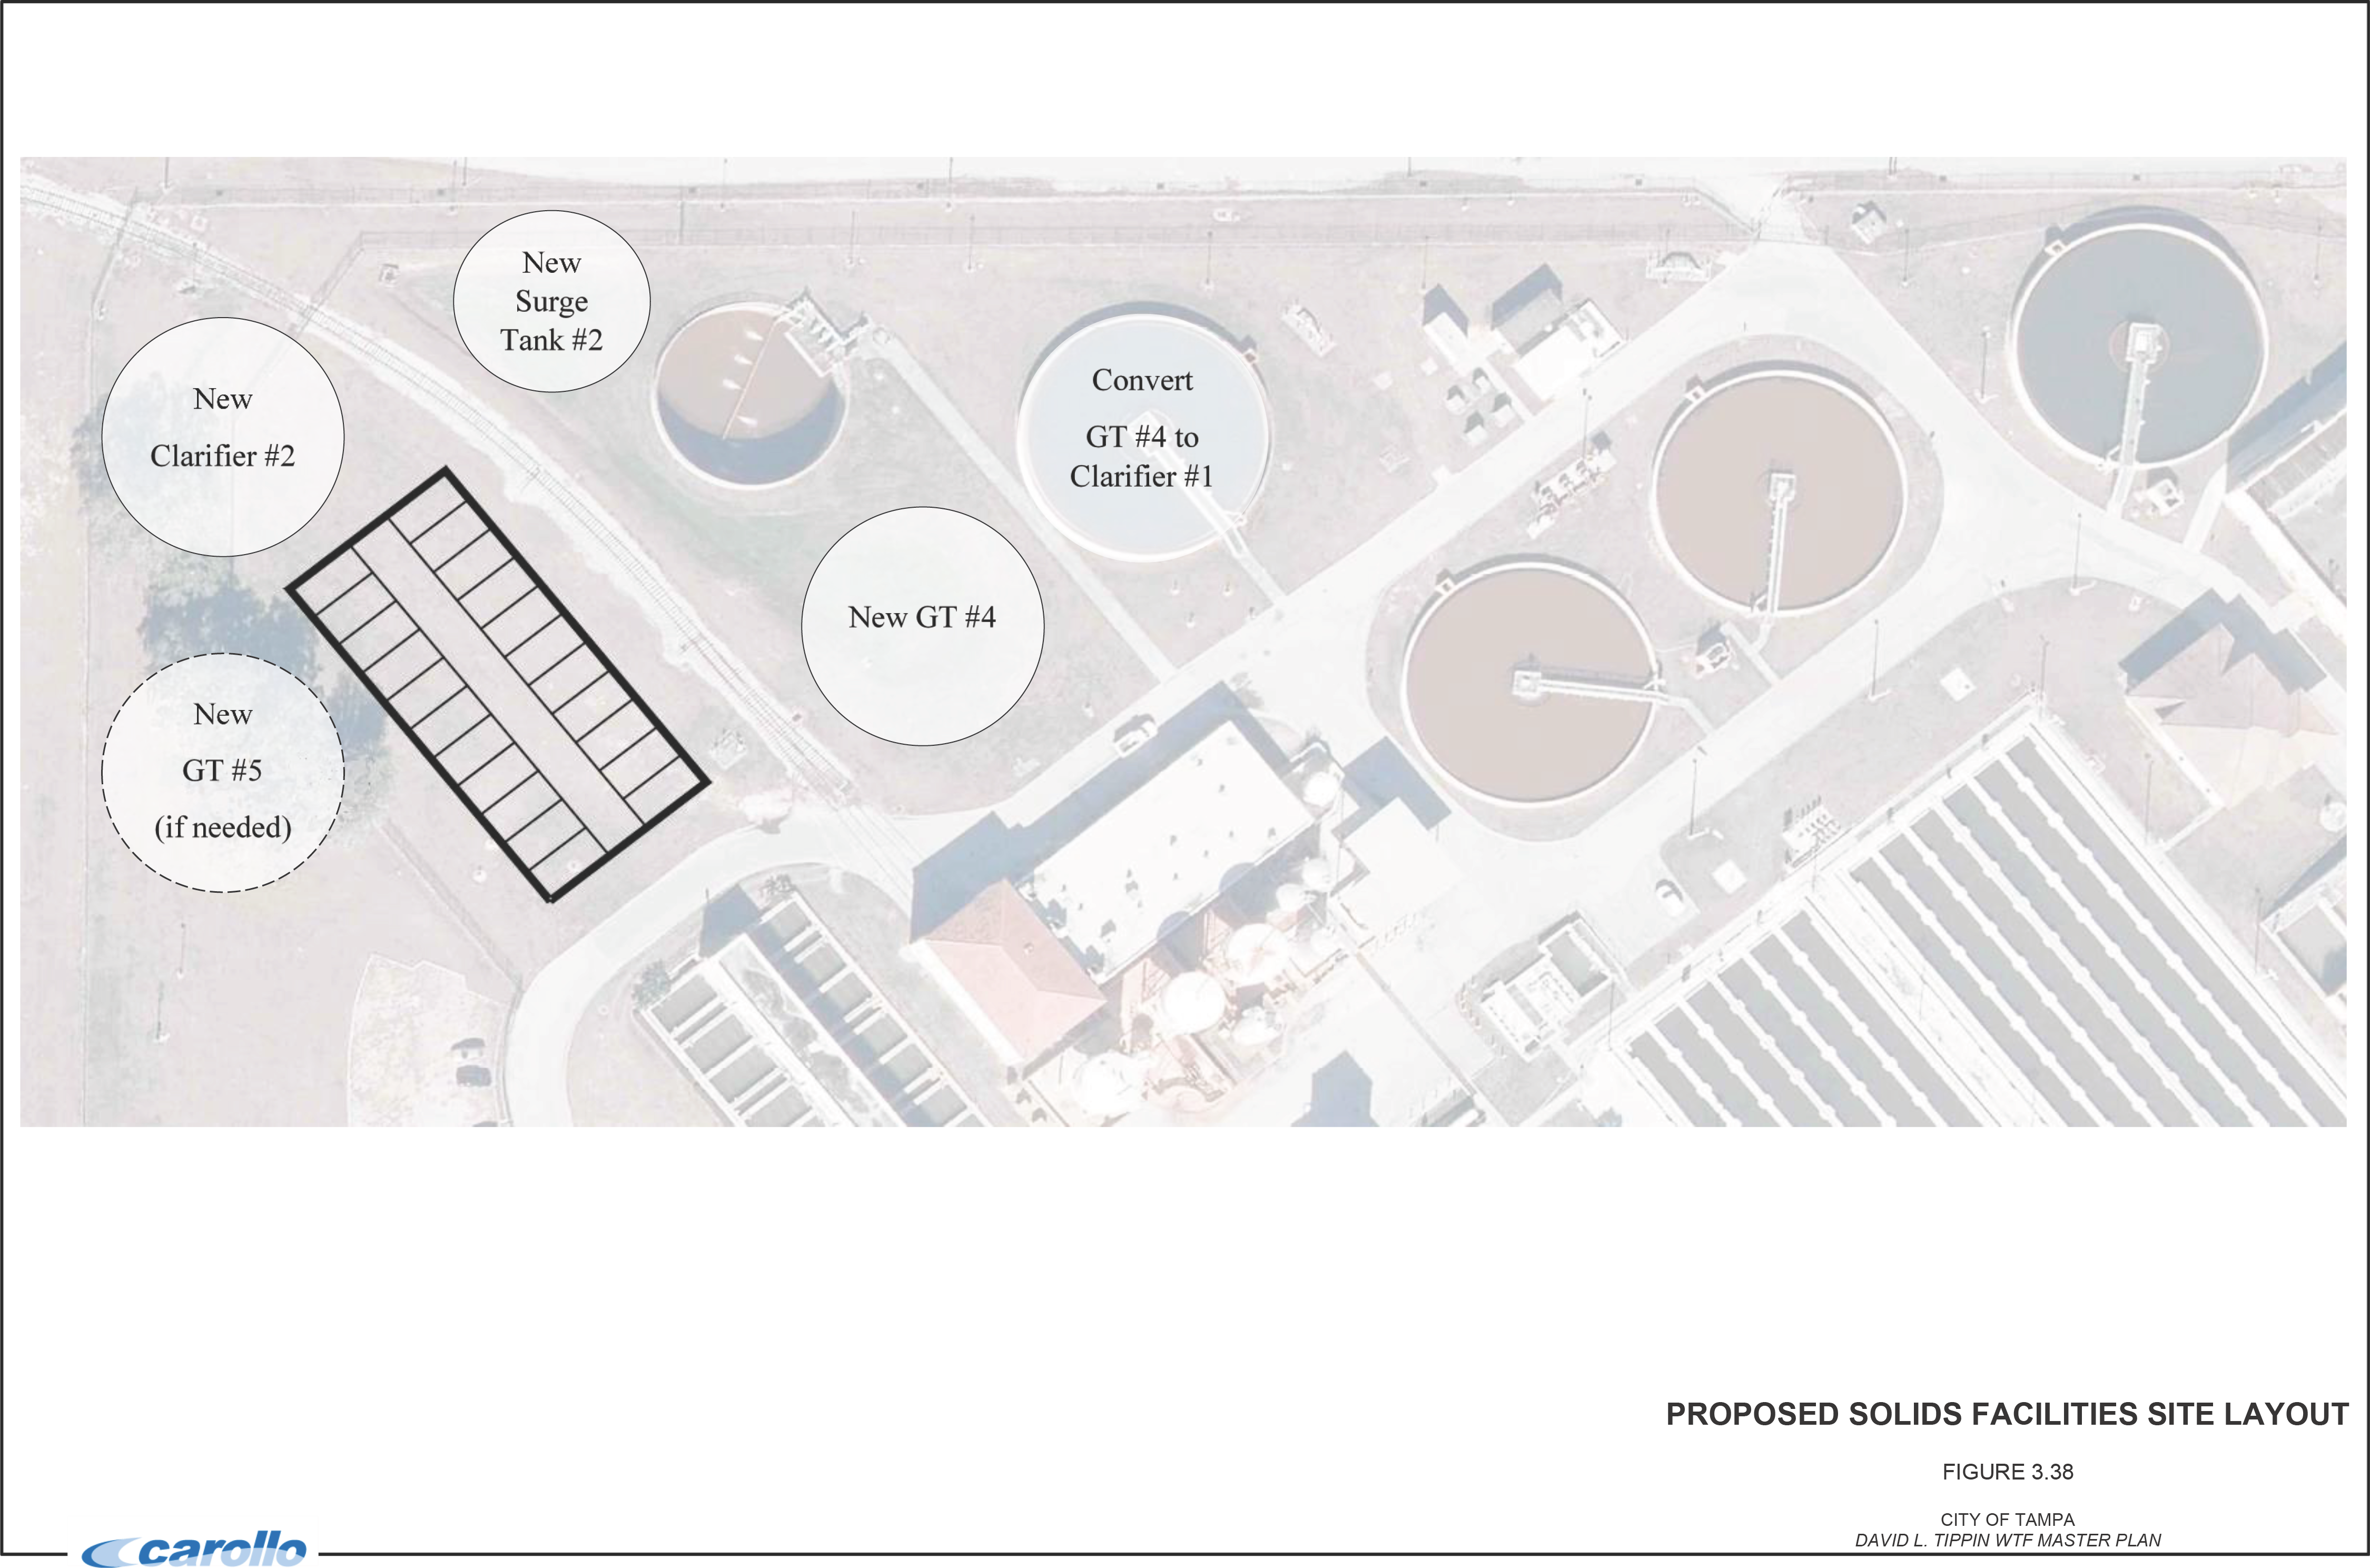
In addition, heavy-duty, overload-protected drives are available in multiple shaft configurations that include jaw clutches to provide individual collector isolation for operational flexibility. Unlike the traveling-bridge and scraper systems, stresses from heavier sludge and thicker sludge blankets are less of a concern, and overload protection is available to avoid catastrophic failure. For maintenance, spare parts are readily available.
The super-scraper type system uses reciprocating scrapers that use blades to push sludge along the basin to a cross collector or trough, where they are then removed. Part of this equipment's sludge removal mechanism is the continuous ratcheting motion under the sludge blanket creates a sludge removal flow. Essentially, the sludge blanket is in resuspension as the blades pass through it.
All submerged components of this system are stainless steel, meaning the materials cost more and are more robust than other sludge removal systems. Nonetheless, stainless steel may be required considering the low pH process waters.
Because of their design, super-scraper type systems can easily be installed in existing basins, although the existing concrete columns may need to be modified. Final design should consider the sludge concentration and expected flows to determine the most suitable sludge removal technology. Figure 3.39 shows an example of each system.
3.4.2 Ozone Generation and Production Systems
As stated previously, a future ozone production rate of 6,700 lb/day at 10 percent ozone concentration is required and exceeds the current system's capacity. Therefore, a new ozone generation system that can meet these requirements is recommended, along with supporting appurtenances, including the power supply units. The three major suppliers of these ozone generation systems are:
- Wedeco (a Xylem brand).
- Suez (formerly known as Ozonia).
- Aqua-Aerobic Systems (formerly known as Metawater and Fuji).
These suppliers have similar performance and design, using high-voltage alternating current between electrodes to produce ozone. However, each manufacture has different designs. For example, the Aqua-Aerobics generators have a more sophisticated (and complicated) cooling system with two independent loops. Final design should consider these design differences and each supplier's ability to meet the required production rate and the percent ozone concentration at which the production rate is met.
ALTERNATIVE SLUDGE COLLECTION SYSTEMS

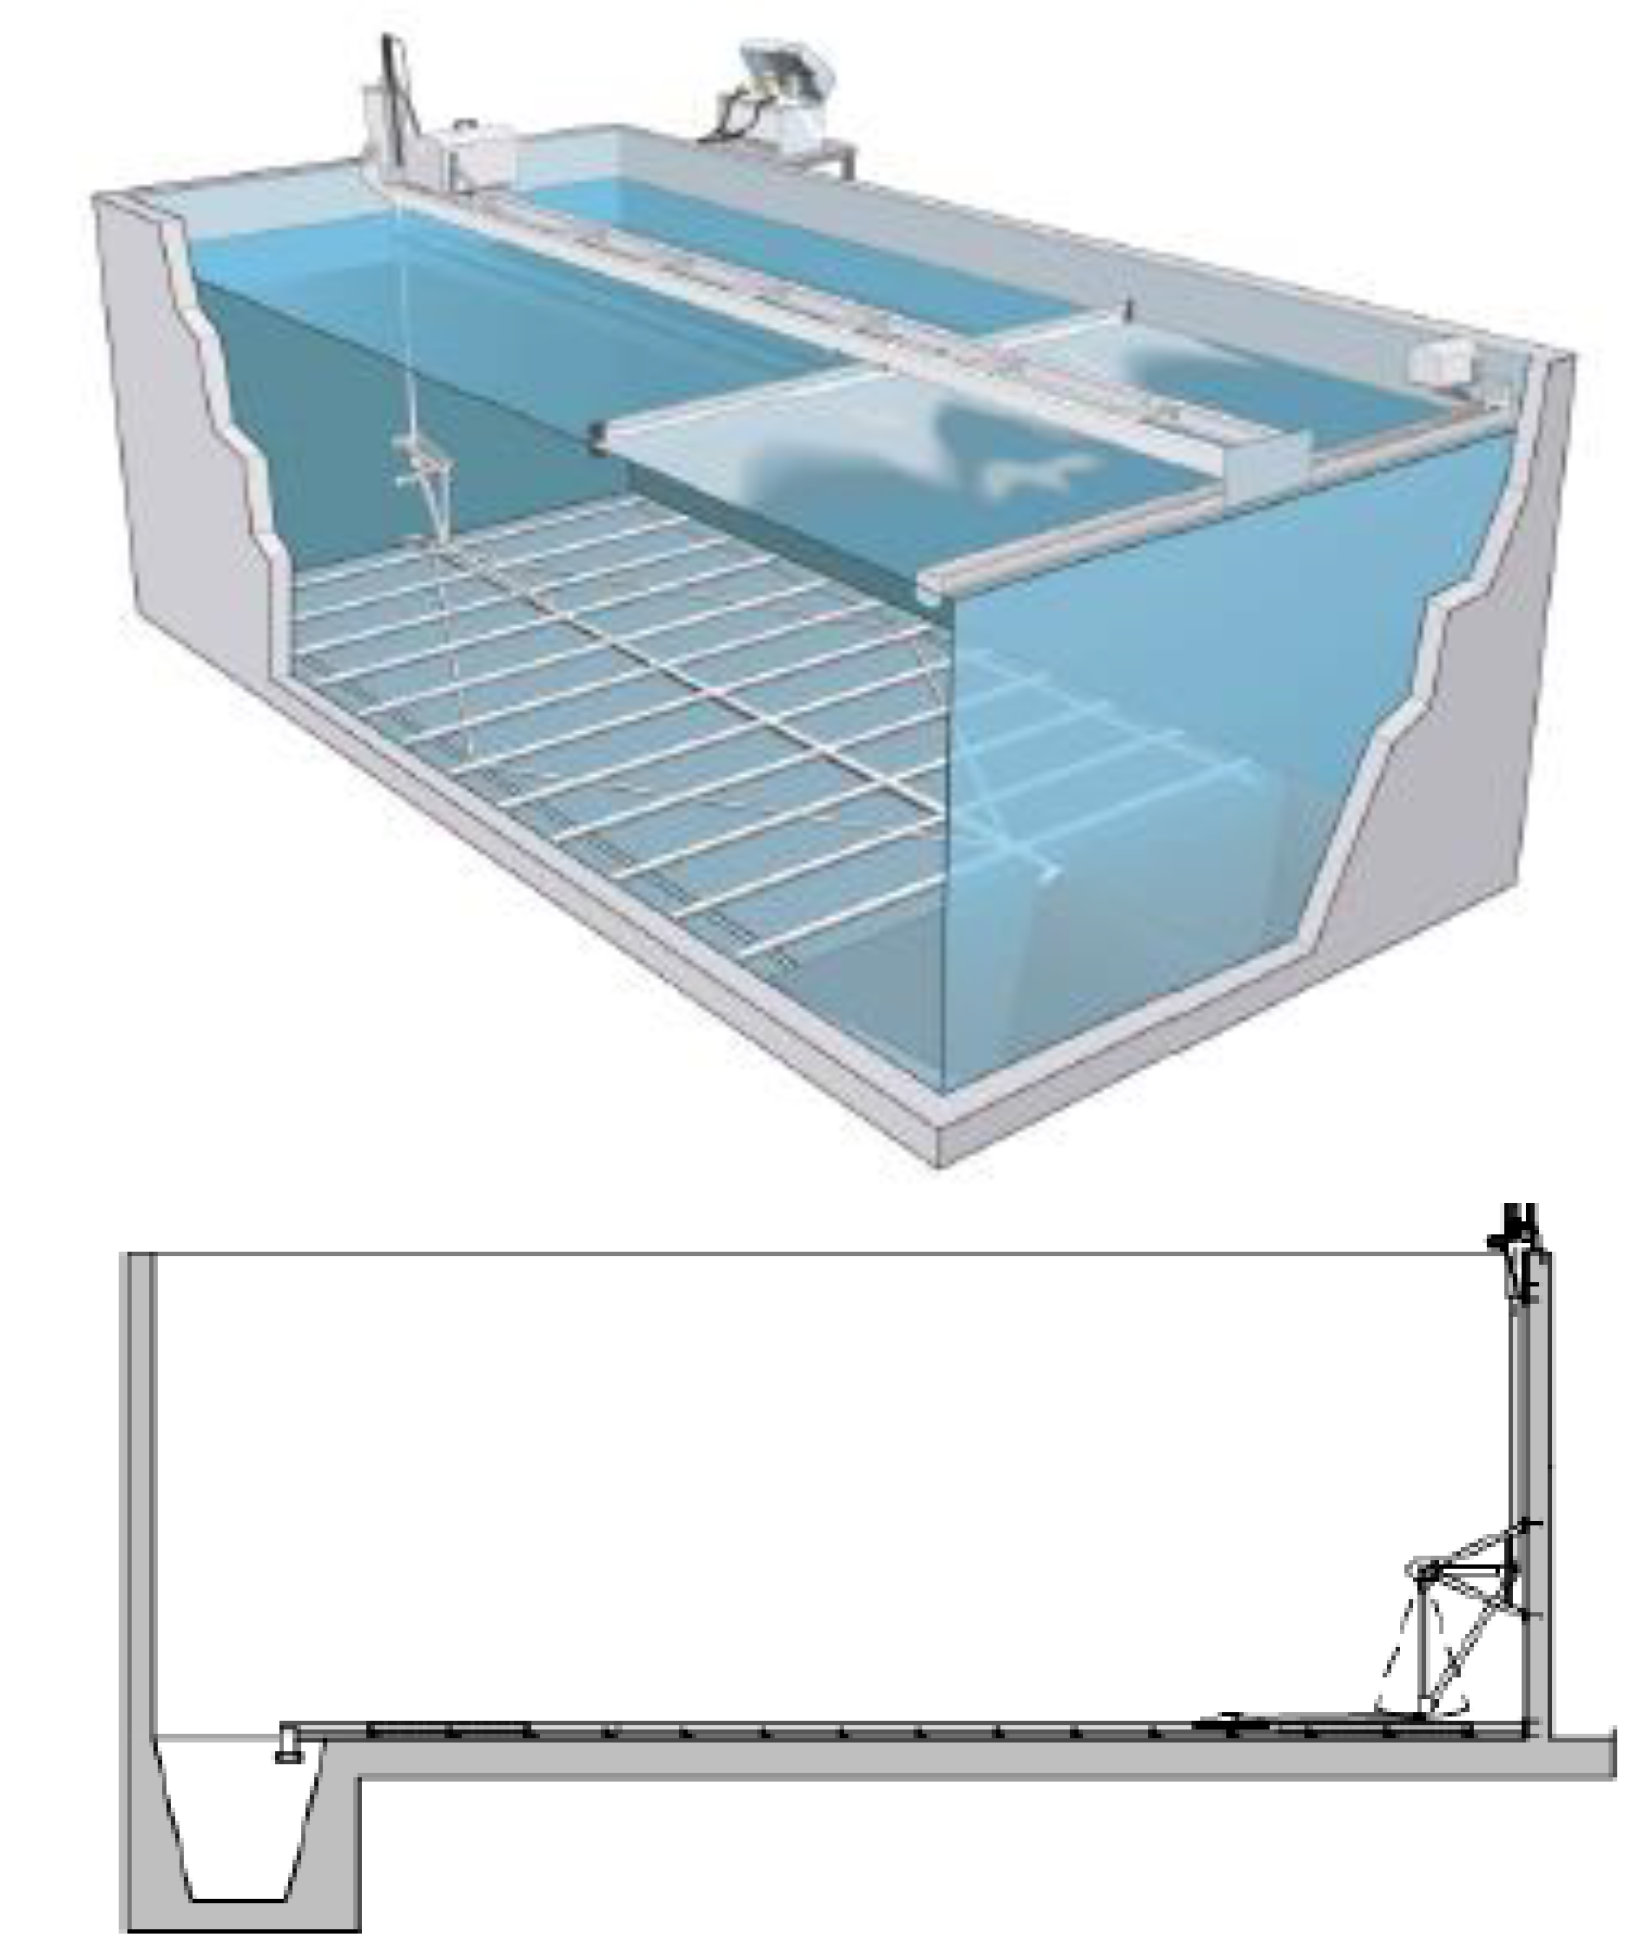
FIGURE 3.39
CITY OF TAMPA DAVID L. TIPPIN WTF MASTER PLAN
At the expanded production rate and ozone product gas concentration of 5 percent vs 10 percent by weight, the available storage of liquid oxygen is only 2.7 or 5.4 days, respectively. Therefore, the liquid oxygen storage may require expansion when the new ozone generation system is implemented.
Similarly, the liquid oxygen vaporizers may need to be expanded if 5 percent ozone product gas concentration is used. However, as stated previously, additional information on the frequency of delivery and availability of liquid oxygen should be considered when determining the appropriate storage capacity.
The contactors, ozone destruct units, and diffusers are adequately sized for future ozone production rates and flows. Frequent cleanings of the contractors are required due to sand carryover from the Actiflo™ process and calcium carbonate precipitation. Therefore, to minimize the amount of maintenance and the need to access the contactors overall, replacing the existing diffusers with gasketless type is recommended as an alternative.
Figure 3.40 shows an example of a ceramic diffuser without steel components, gaskets, or cements. This type of diffuser reduces maintenance, since gaskets on traditional diffusers wear more easily due to the high concentration of ozone exposure over time.
Alternatively, an ozone gas dispersion system like the one provided by Statiflo, as shown in Figure 3.41, would eliminate the need for diffusers within the contactors. This option would provide similar ozone transfer efficiencies as the current system, typically between 85 and 95 percent. This approach would require significant power and pumping to pressurize 10 to 20 percent of the plant flow (typical) through a venturi to create the vacuum to draw in the ozone gas.
Furthermore, significant head loss would occur through the static mixer, which is not accounted for in the current hydraulic profile, although the final design should quantify these impacts. Side stream equipment would also require significant maintenance due to the additional appurtenances and instrumentation needed for operation. This application and system is more appropriate for facilities processing less than 100 mgd and lacking a fine bubble diffusion contactor.
The existing contactors could be retrofitted, although this is seldom performed. Nonetheless, the final design should consider its application, costs, feasibility, and impacts to water quality if this option is pursued.
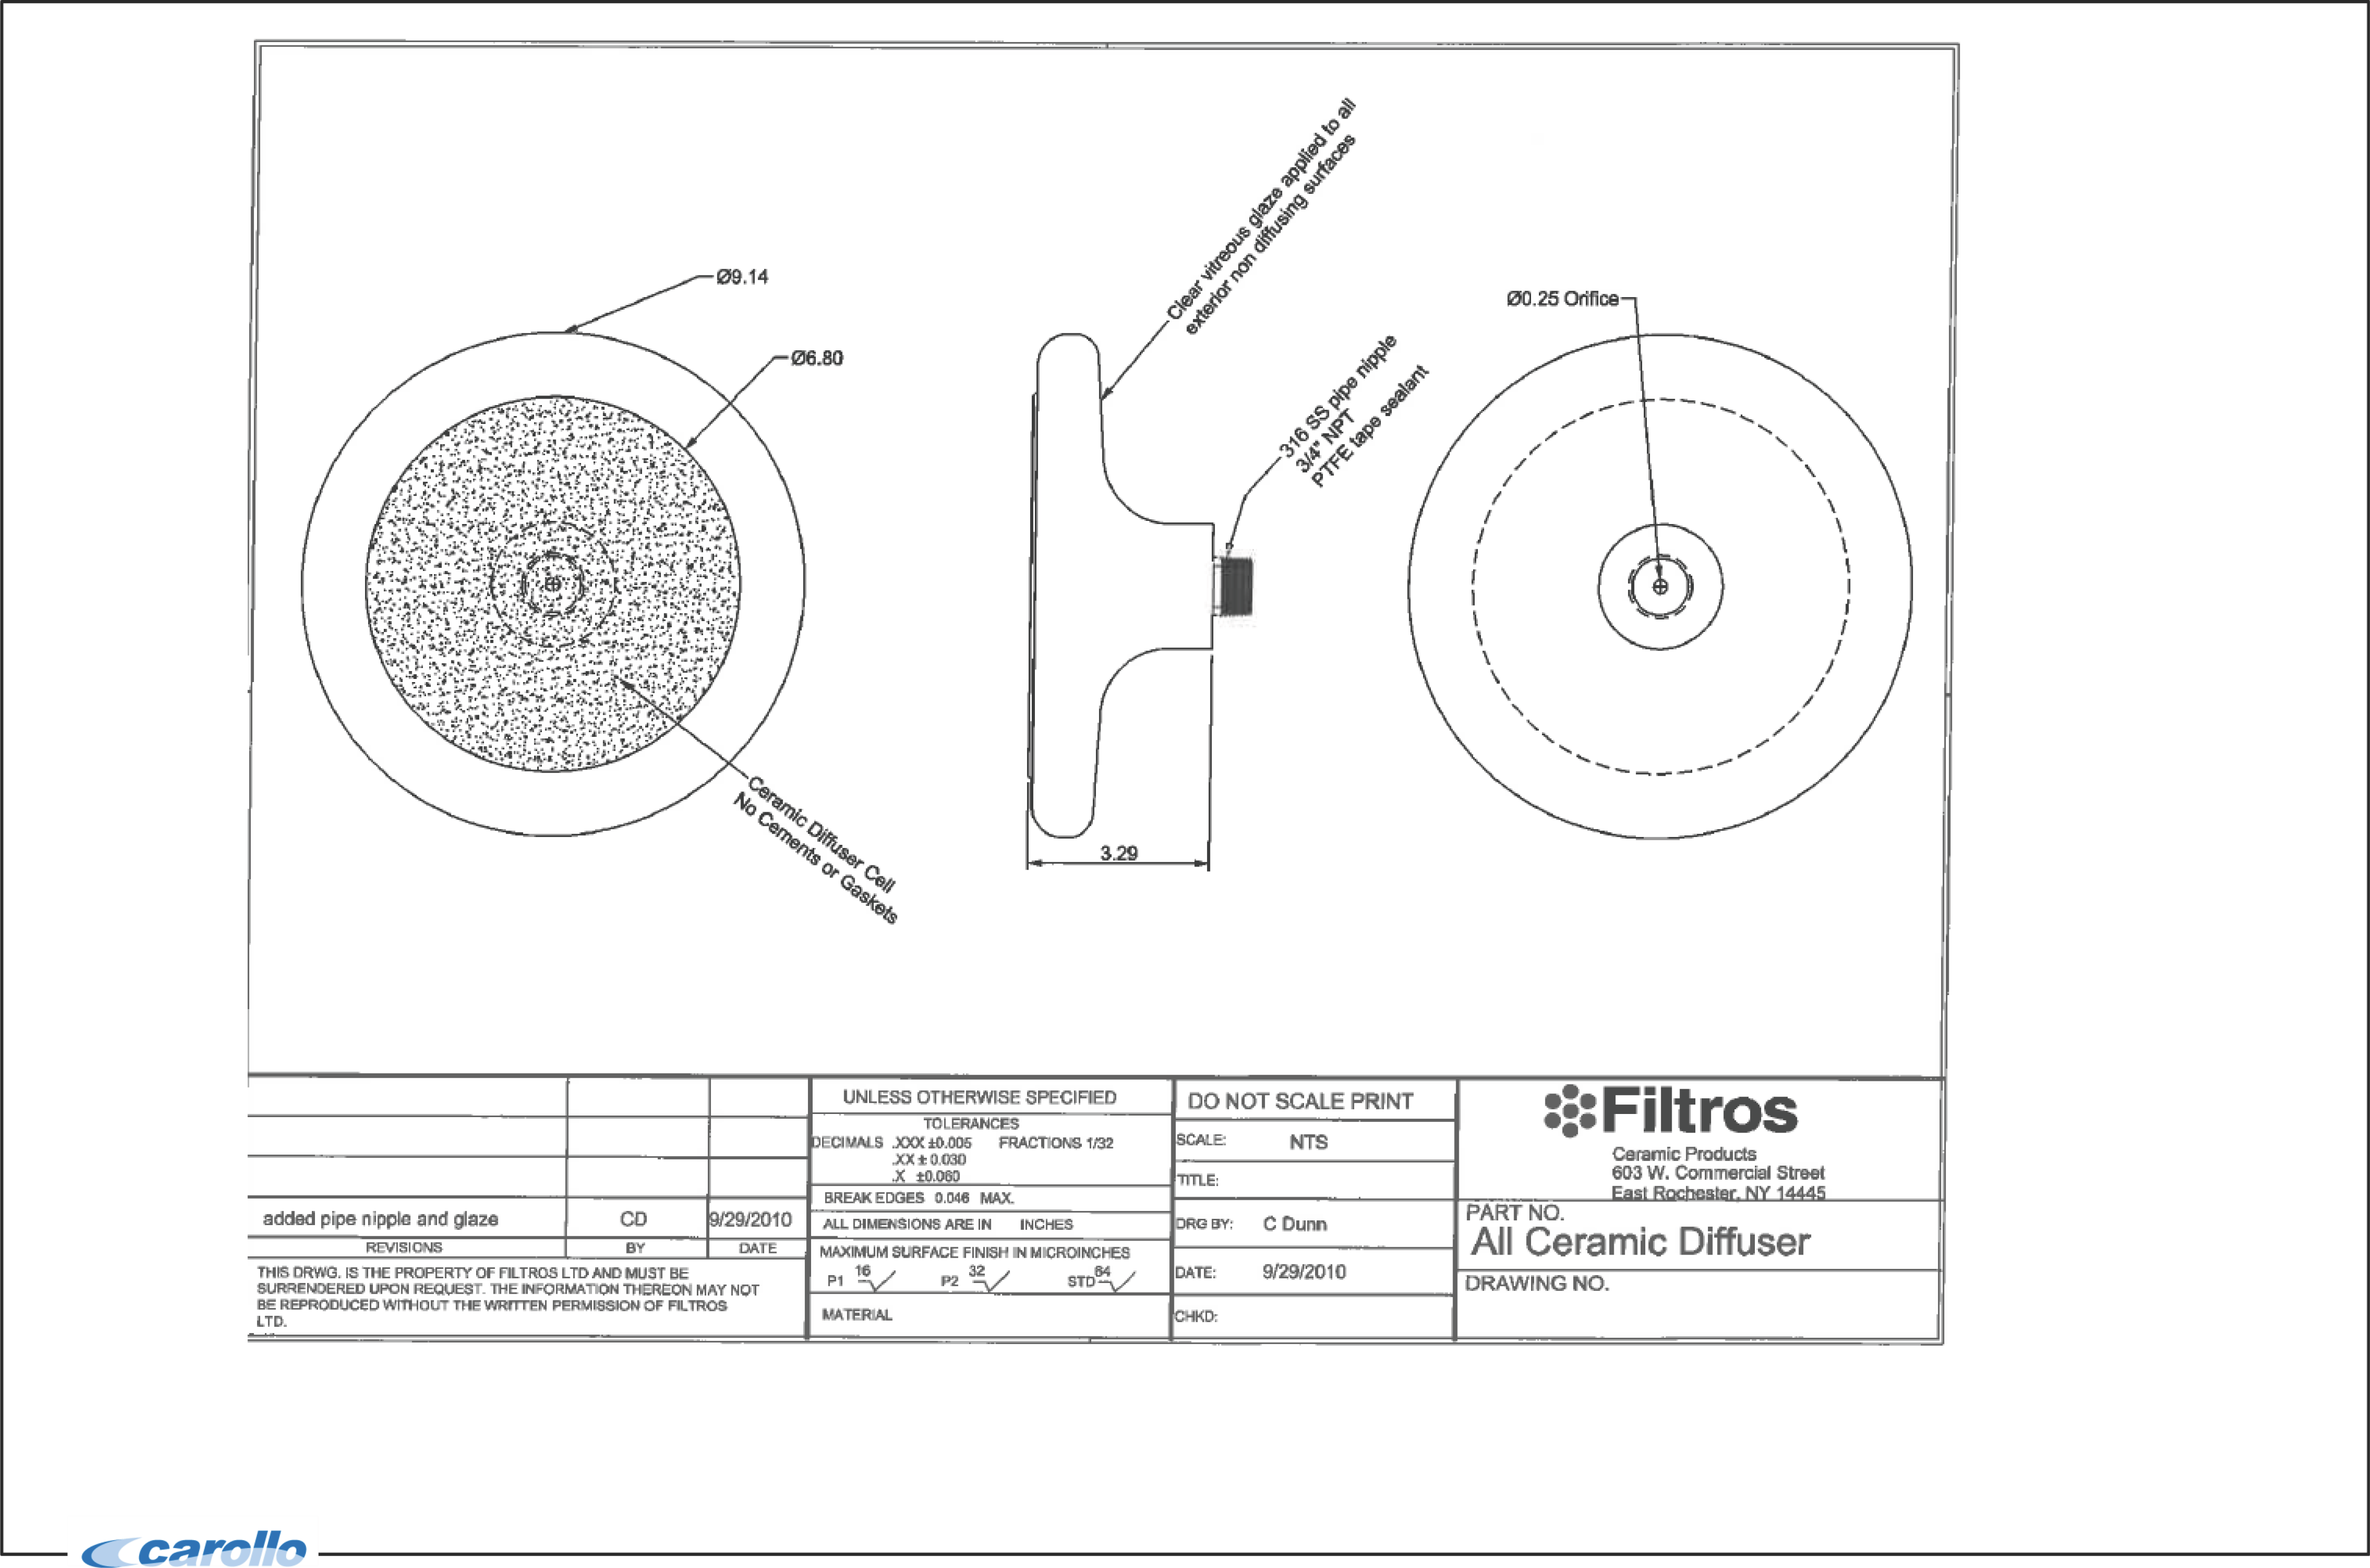
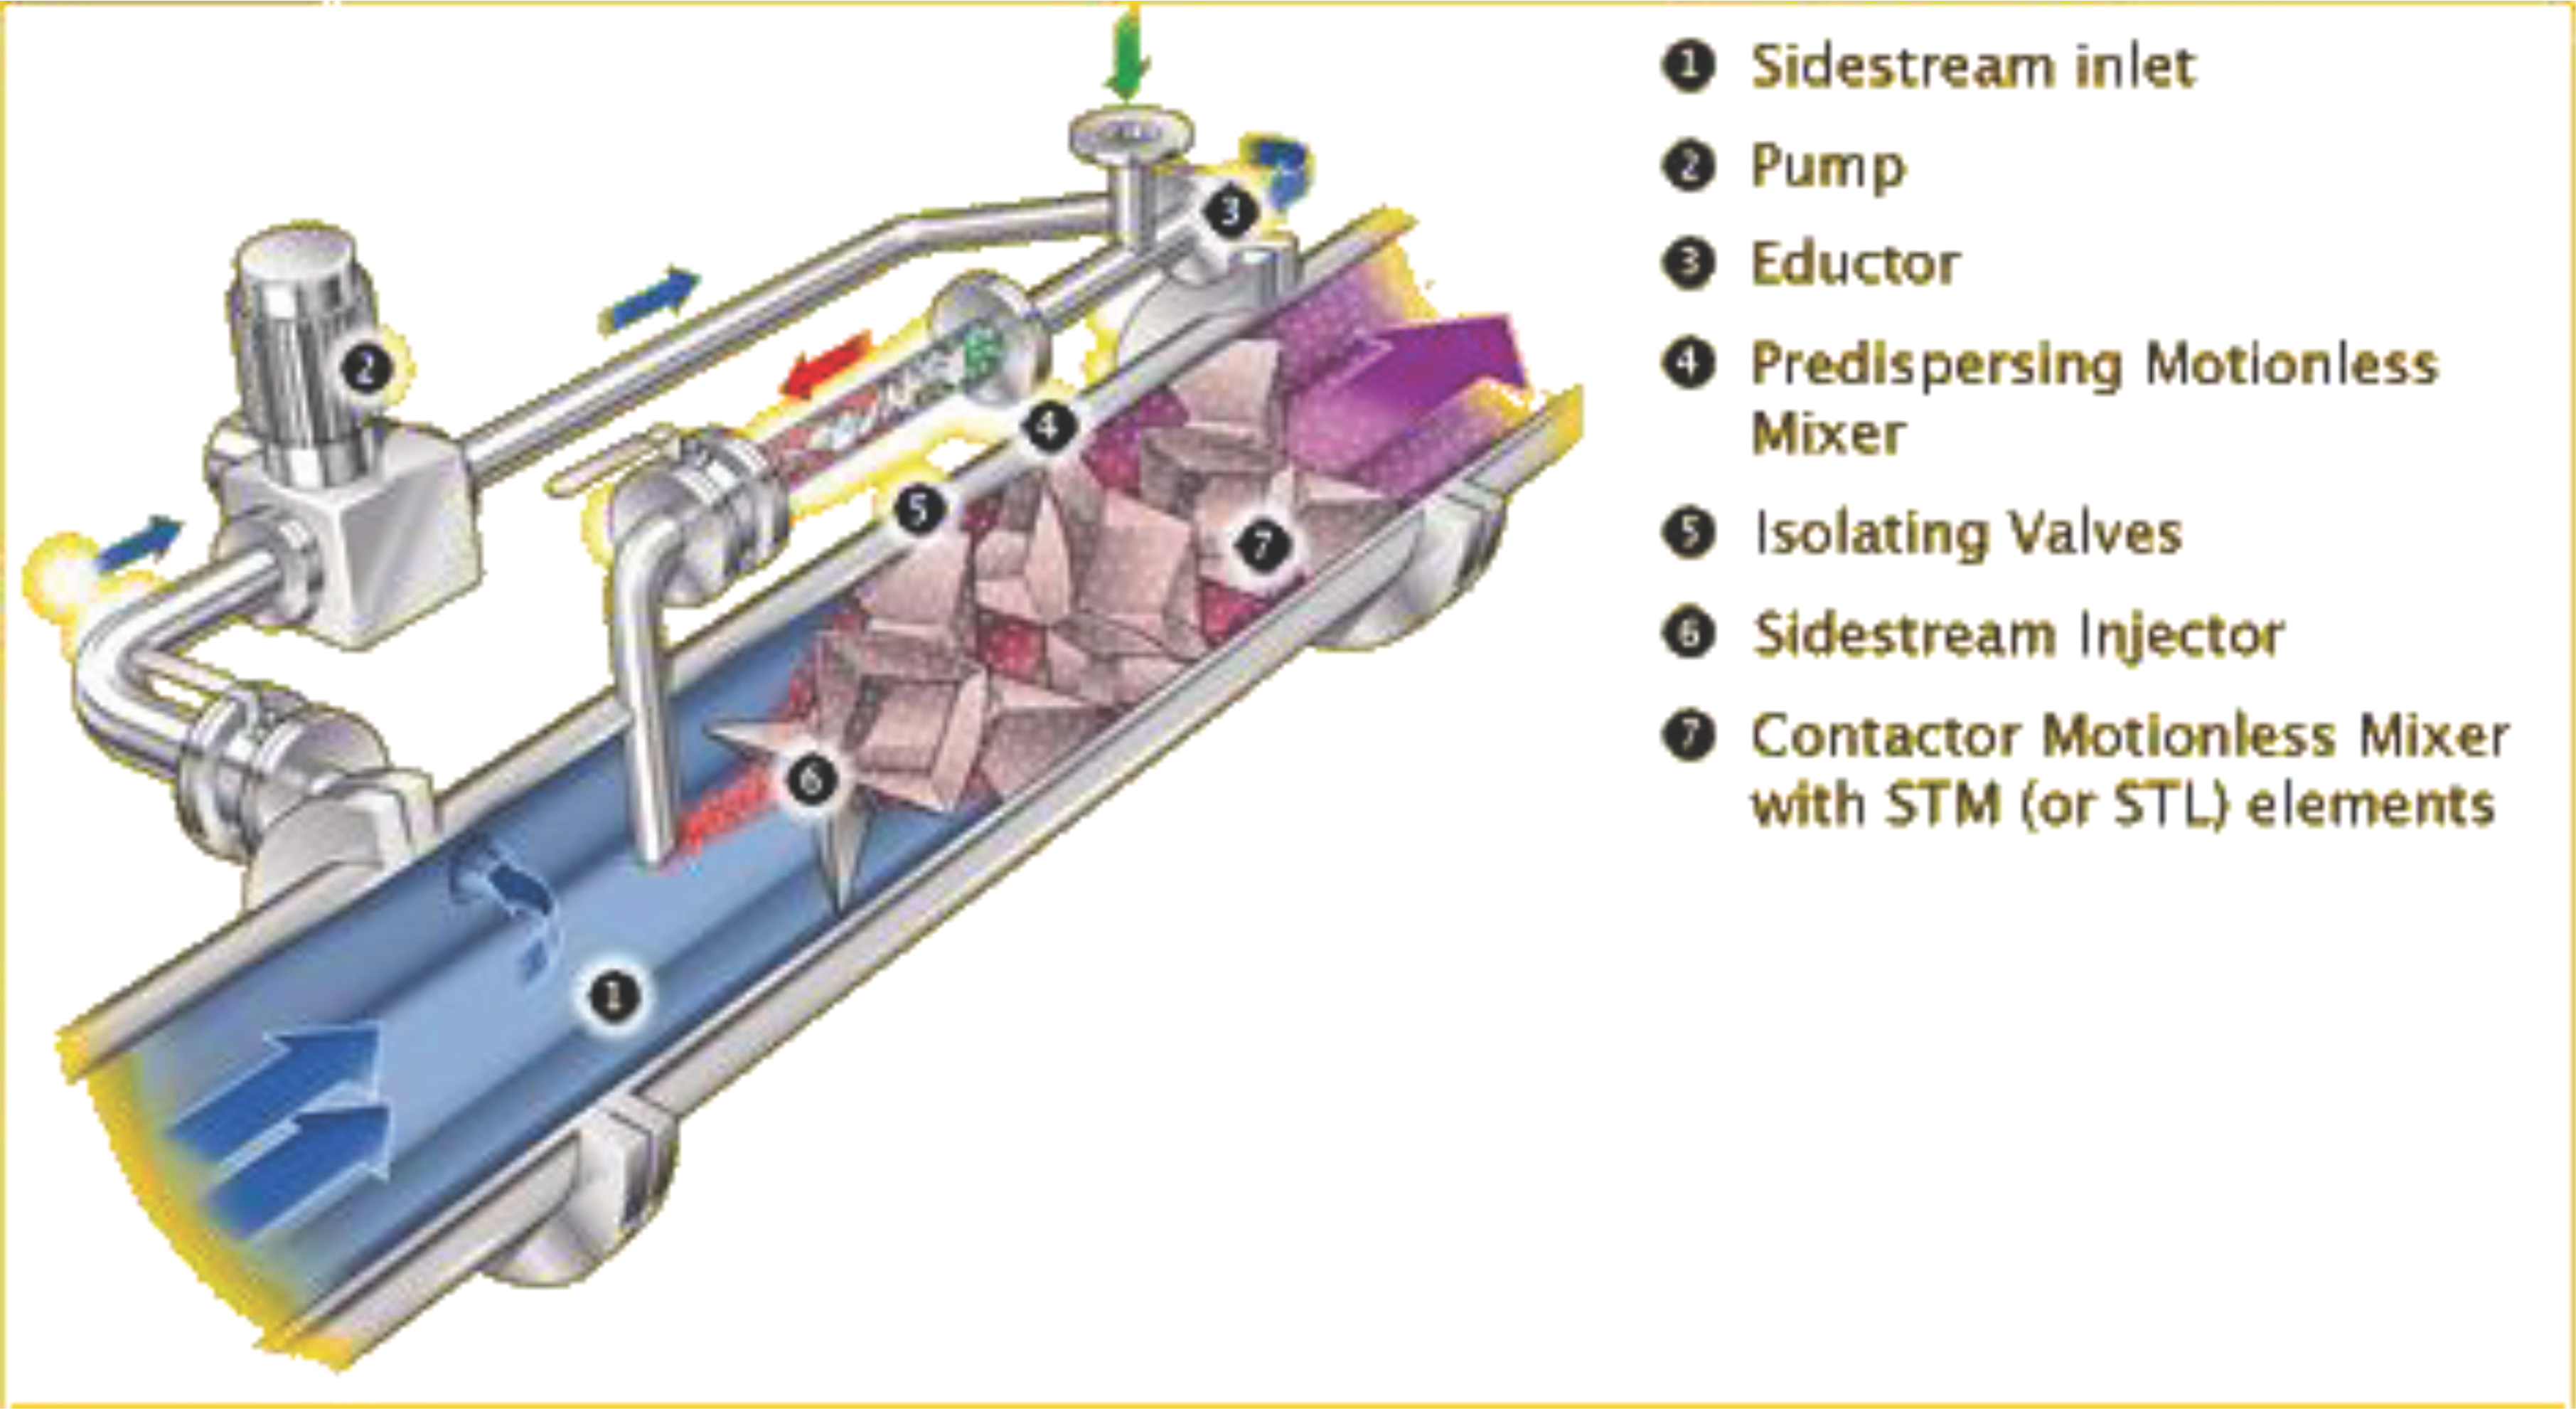
CITY OF TAMPA
DAVID L. TIPPIN WTF MASTER PLAN
3.4.3 Chemical Systems
Additional storage capacity is required to bring the chemical supplies up to the Ten States Standard of 30 days of available storage at the future flow of 140 mgd. Table 3.35 shows each chemical with the current capacity and recommended additional capacities to meet these needs. The additional capacity required was determined using the average dose for each chemical from 2014 and 2015 and assuming 140 mgd flow.
| Chemical | Average Dose in 2014 & 2015 (mg/L) | Current Storage Capacity | Current Available Days of Storage | Additional Capacity Required |
|---|---|---|---|---|
| Ammonia | 1.48 | 4,000 gal | 12.0 | 6,100 gal |
| Ferric Sulfate | 121.5 | 186,000 gal | 17.0 | 144,000 gal |
| Sulfuric Acid | 59.8 | 30,000 gal | 6.6 | 107,000 gal |
| Lime | 37.8 | 333,500 lbs | 7.5 | 989,000 lbs |
| Chlorine | 6.58 | 90 ton | 23.4 | 25.2 ton |
| Caustic | 18.95 | 60,000 gal | 34.6 | None |
| Polymer | 0.49 | 7000 / 500 lbs(3) | 10 / 0.71(4) | 21,100 / 1,100 gal(5) |
| Fluoride | 0.31 | 186,000 gal | 50.4 | None |
| Hydrogen Peroxide | 2.23(1) | 4,200 gal | 4.2 | 7,200 |
| Sodium Bisulfite | 9.0(2) | 5,500 gal | 11.3 | 9,100 |
Notes:
- (1) Average based on usage in 2008 and 2009 since less than 1.00 mg/L was reported in the years following.
- (2) Average provided by City via email.
- (3) There is storage space for dry pallet storage for 7,000 lbs and dry hopper storage of 500 lbs.
- (4) There are 10 days of dry pallet storage and 17 hours of dry hopper storage.
- (5) To meet 30 days of dry pallet storage, an additional 21,100 pounds of storage is required. The 1,100 gallons is the additional mix tank volume required, assuming a completely redundant system (to reflect current operation). If the existing redundant system can be used to meet demands, expansion may not be required.
Although the standards require 30 days of storage, additional information on frequency of deliveries and the City's desired storage requirements should be considered, since previous designs did not follow this standard. These additional capacities are based on current average doses, and if treatment processes change (i.e., adding an ion exchange system as
a pretreatment), chemical doses may also change. The final design should quantify the chosen alternative's impacts for each chemical and provide revised required storage capacities.
If the City deems 15 days of storage adequate for the DLTWTF, then only the ammonia, sulfuric acid, hydrogen peroxide, polymer, and lime systems need expansion, as shown in Table 3.36. This assumes average doses will not change; if doses are to change, then the design engineer should re-evaluate the capacity of these systems.
| Chemical | Average Dose in 2014 & 2015 (mg/L) | Current Storage Capacity | Current Available Days of Storage | Additional Capacity Required |
|---|---|---|---|---|
| Ammonia | 1.48 | 4,000 gal | 12.0 | 1,100 gal |
| Sulfuric Acid | 59.8 | 30,000 gal | 6.6 | 38,300 gal |
| Lime | 37.8 | 333,500 lbs | 7.5 | 328,000 lbs |
| Polymer | 0.49 | 7000 / 500 lbs | 10 / 0.71 | 2,800 lbs / 200 lbs / 1,100 gal(3) |
| Hydrogen Peroxide | 2.23(1) | 4,200 gal | 4.2 | 3,000 gal |
Reinstating a permanent sodium bisulfite system is also recommended, with the design allowing for 15 days of storage. The final design should consider the contact time needed for the sodium bisulfite to completely quench the washwater before the filters receive it.
Additionally, re-design of the polymer system is recommended as previously noted in Section 3.3.7.4.
Alternatively, in conjunction with the hydraulic improvements for the 7.5 MG clearwell noted in Chapter 4, a portion of the existing clearwell could be used to store unchlorinated water, which could then be used for filter backwashing without needing quenching.
3.4.4 Carbonate Softening
An alternative for solving the calcium carbonate precipitation issue, increasing filter run times, reducing chemical costs and solids production, and potentially removing more TOC is carbonate softening. By removing and limiting the amount of carbonate (alkalinity) in the process water, the amount of calcium carbonate precipitation from lime or caustic addition would be limited. Figure 3.42 shows the proposed process flow diagram.
As the figure shows, the raw water would be dosed with sulfuric acid to reduce the pH just enough to provide 50 mg/L as CaCO3 (or the desired finished water alkalinity) in the form of bicarbonate (HCO3). The remaining carbonate would be in the form of carbonic acid (H2CO3) that can be easily removed as carbon dioxide via a packed tower stripping process, a proven process used before lime softening plants that treat groundwater.
The process water then flows to the conventional and Actiflo™ systems, where it is dosed with 110 mg/L of ferric sulfate. Since most of the alkalinity has been removed, the buffering capacity of the process water is reduced. As a result, ferric sulfate at that dose can bring the pH to 3.8 for enhanced coagulation.
After sedimentation, and also due to the lowered alkalinity, lime alone can be used to raise the pH to 7.0 before ozone. This is possible because with the limited carbonate, calcium carbonate precipitation is greatly reduced, and more calcium can thus be added to the water. In this case, no caustic is needed. Finally, a low dose of caustic after filtration can be implemented for final pH adjustment.
This method would allow the CCPP to remain negative and non-depositing throughout the treatment process. The final caustic adjustment would provide a slightly positive CCPP to protect the distribution system while not depositing significant amounts of calcium carbonate within the rest of the DLTWTF (i.e., clearwells). Figure 3.43 shows this concept graphically. The carbonate softened water does not have the same deposition characteristics as the current conditions because the carbonate is limiting. Unlike the current conditions, small changes in pH do not make large changes in the finished water's depositing characteristics.
Sulfuric acid is the only chemical dose that would continue to change. The required dose would be based on lowering the influent alkalinity to 50 mg/L as CaCO3 (in bicarbonate form). Coagulation pH is believed to have more of an effect than coagulant dose. As a result, as long as the ferric dose remains high (~110 mg/L) and the pH is maintained, the same ferric dose could be used even during high TOC. Since the coagulation pH and process water alkalinity would be maintained, the lime dose (before ozone) and caustic dose (after filtration) would also remain constant.
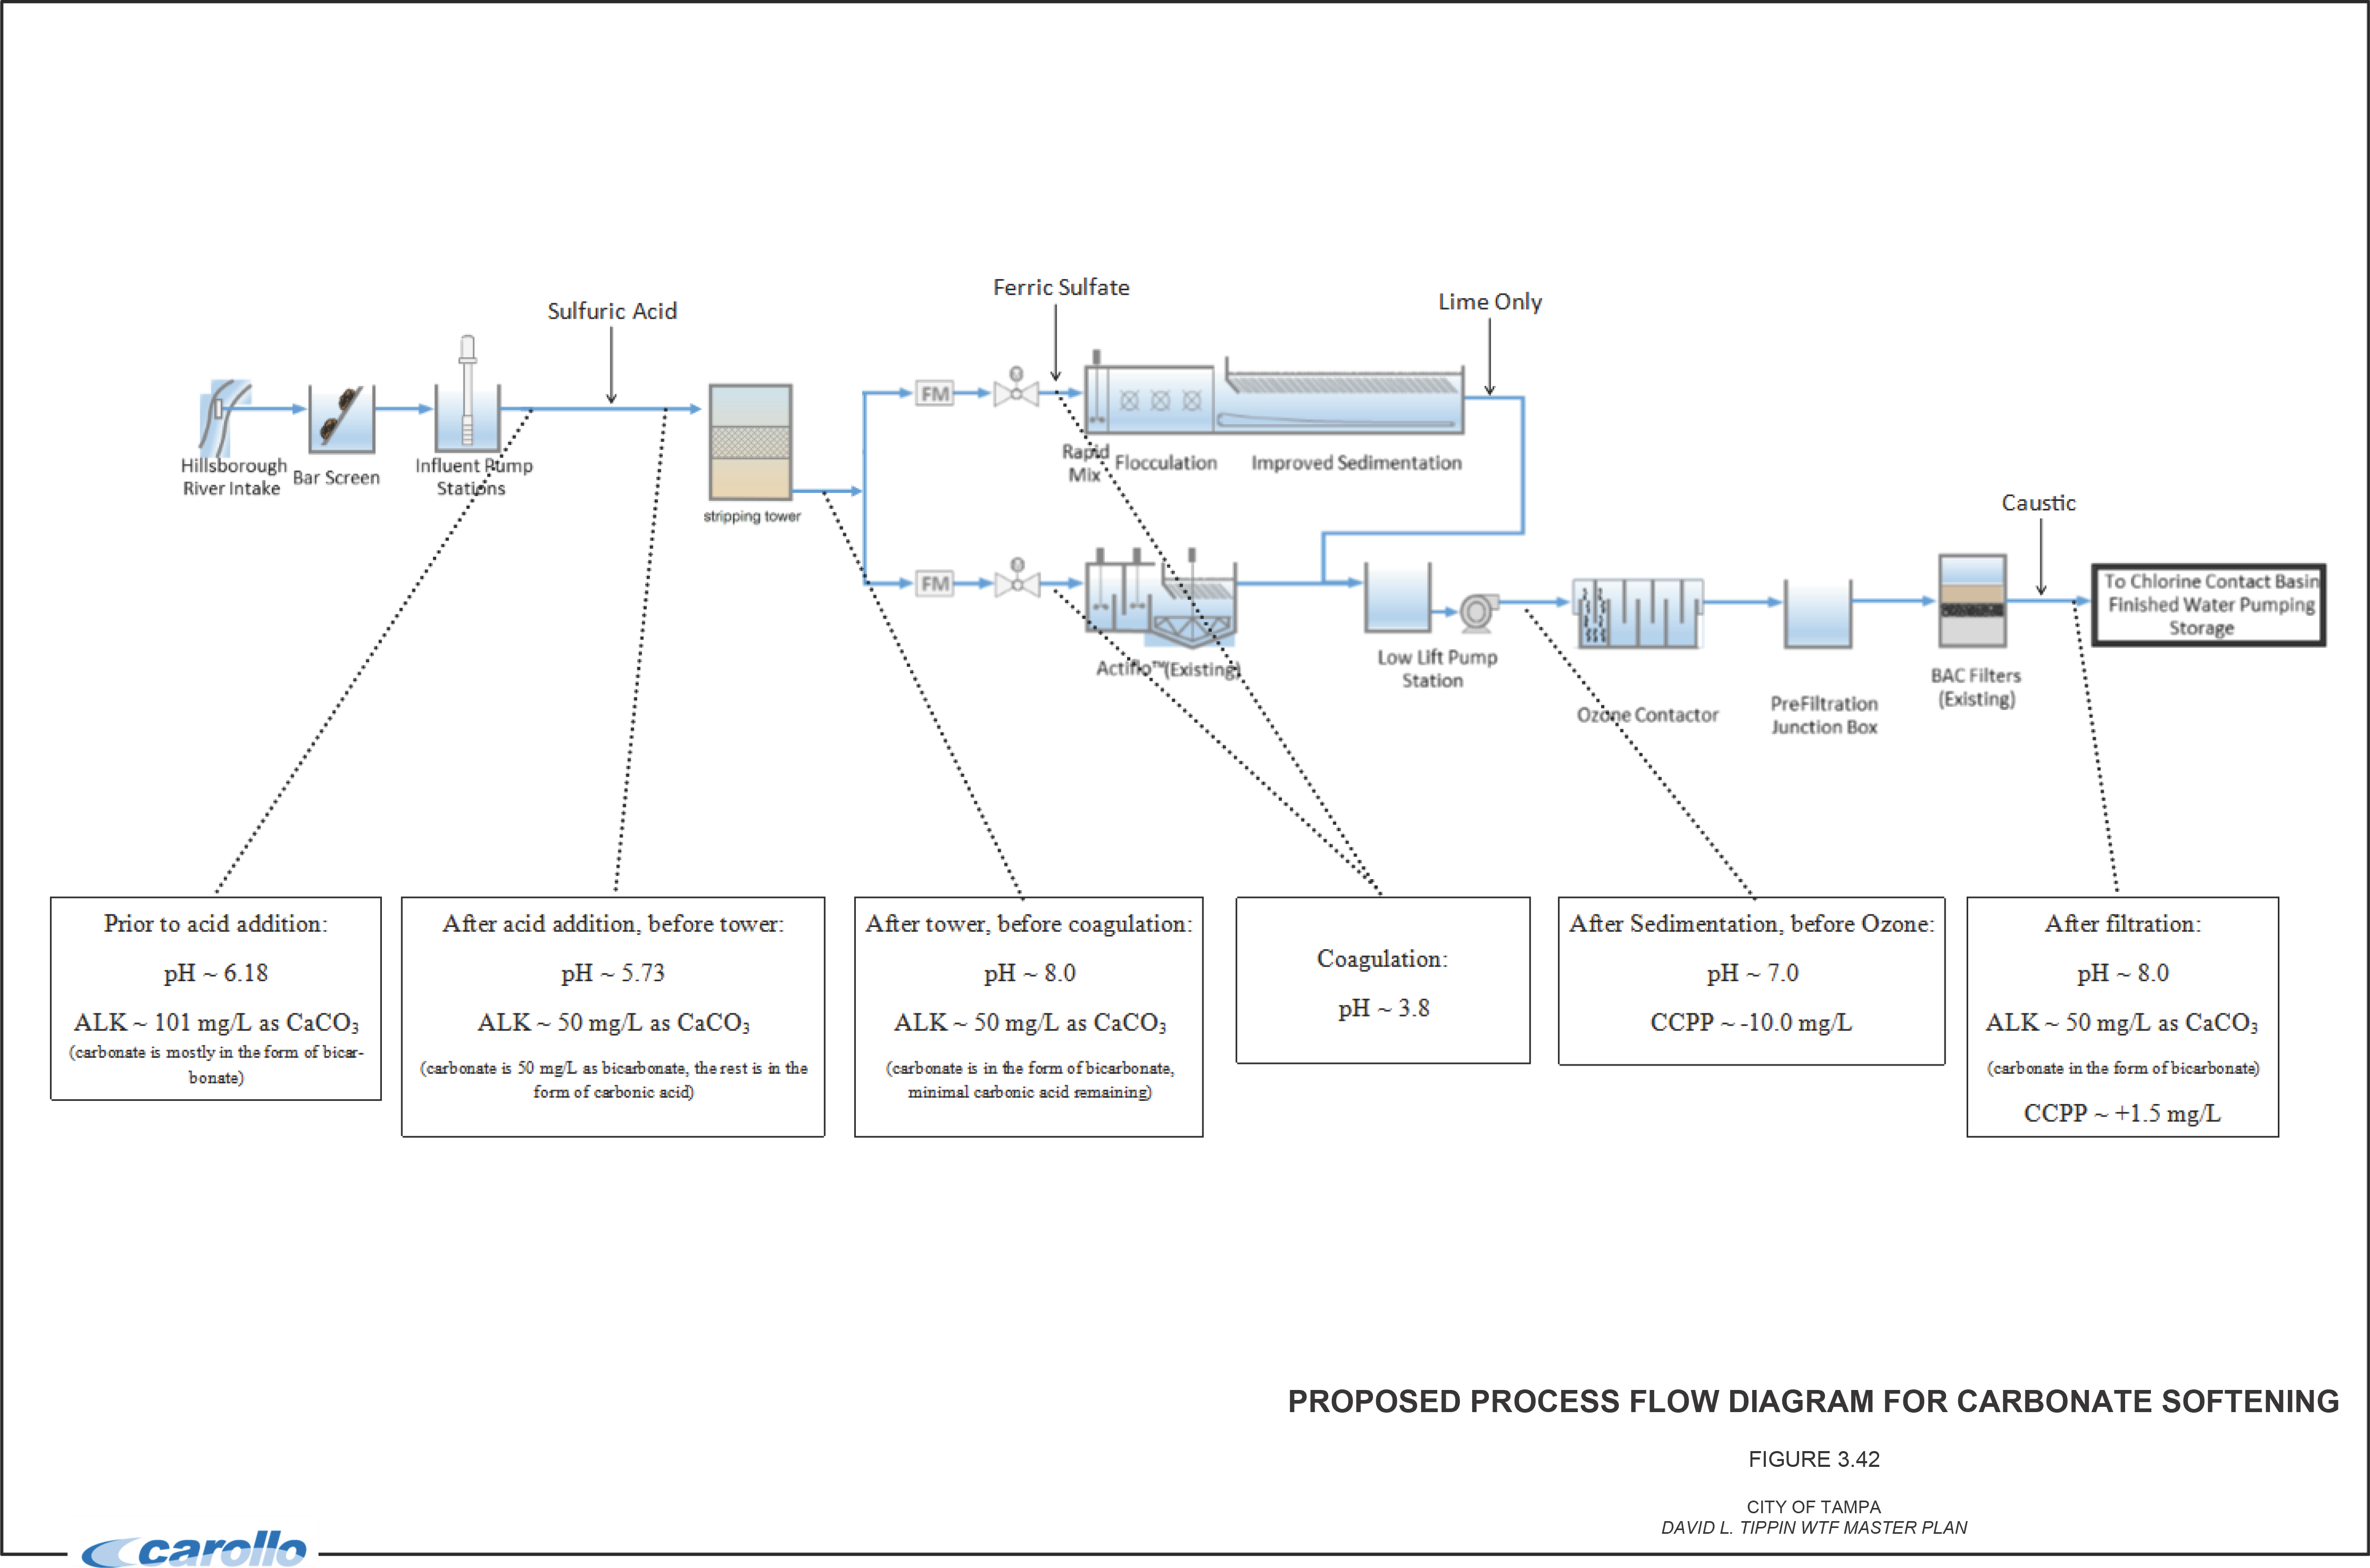
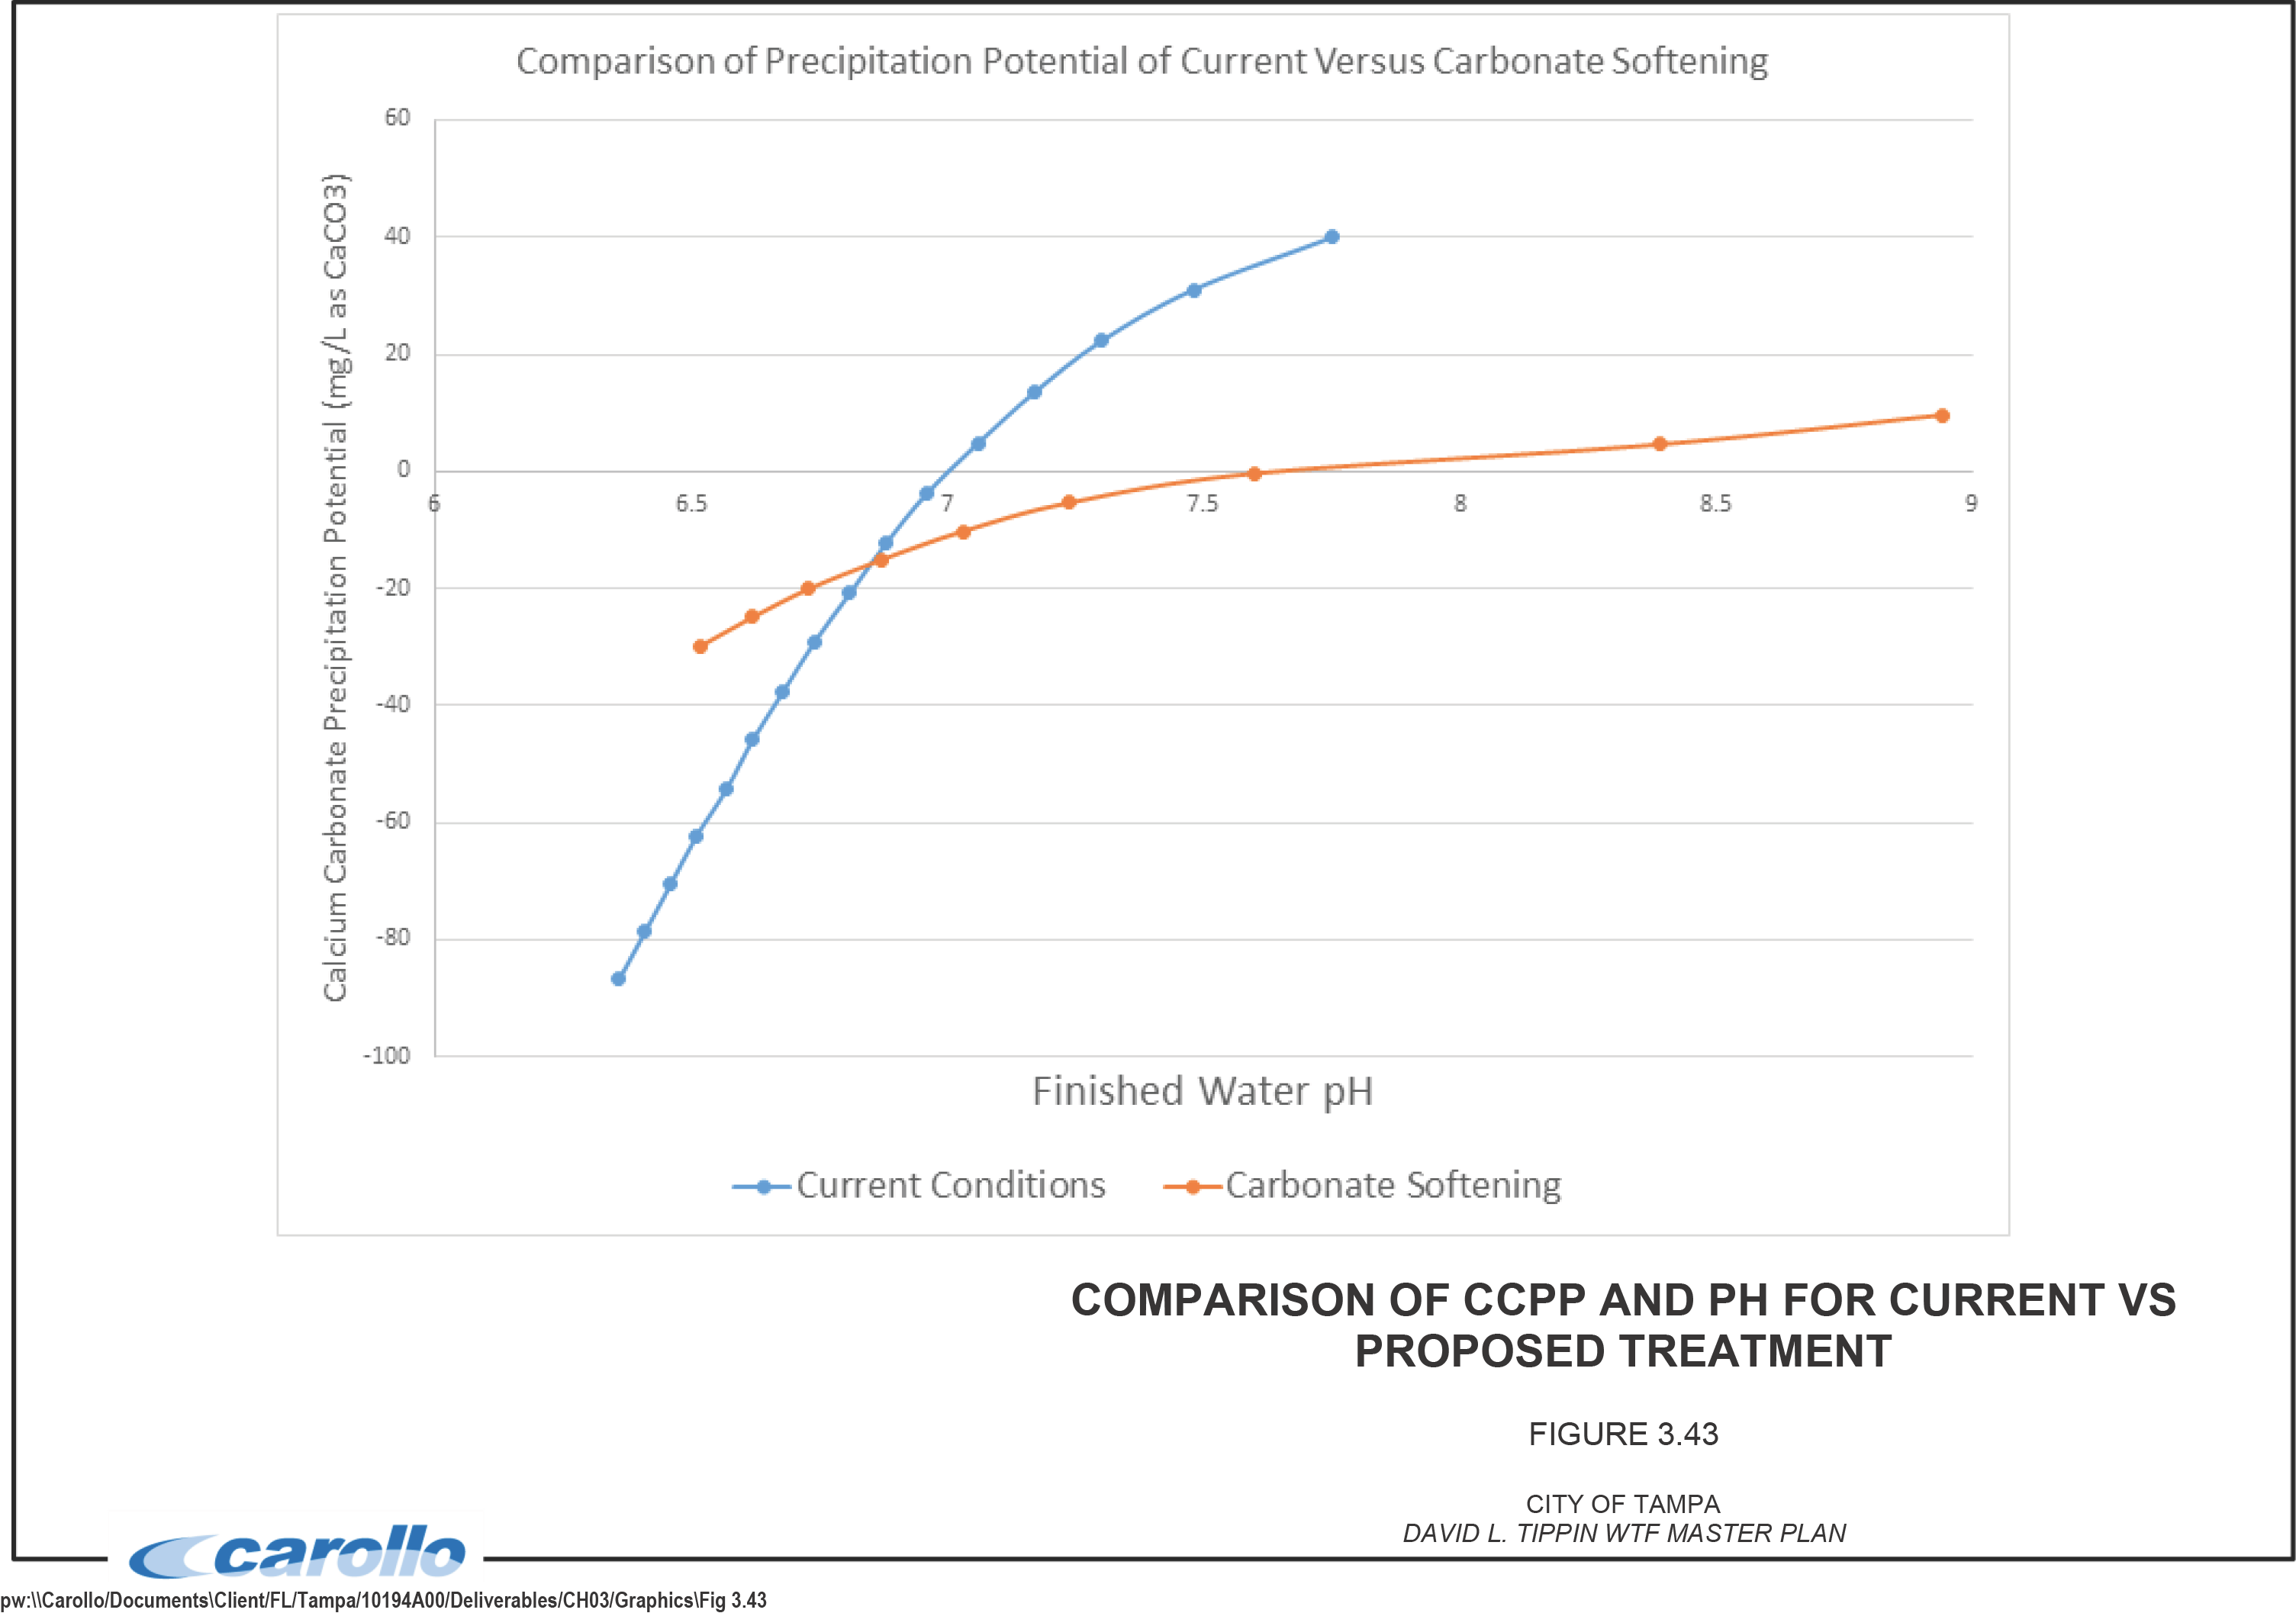
Before implementing this option, piloting would be required. However, if successful, this could lead to significant chemical costs savings and an approximate 10 percent reduction in solids generation annually on the order of $1,200,000 savings per year. Additionally, this system would have a significant footprint at the DLTWTF which should be considered.
3.4.5 Filtration
Improving the existing filters is needed, as is providing new filters to meet future demands of up to 140 mgd. The following improvements are recommended for the filters:
- Raise the filter troughs approximately 1 foot to allow for additional driving head, more allowable head loss, increased filter run times, and improvement in UBWV (in addition to the hydraulic improvements up and downstream of the filters).
- Inspect condition of filter underdrains and IMS caps to determine if replacement is needed.
- Implement a new lime dosing strategy and/or carbonate softening option to assess impacts on filter performance.
- Implement simultaneous air/water backwash mode.
- Replace all filter media with GAC and sand that match to provide a backwash rate difference no more than 2 gpm/sq ft between the media. This will enhance media fluidization and provide more efficient backwash and filter cleaning. Completing the hydraulic and filter trough improvements is recommended, as is testing the existing media to evaluate any resulting fluidization improvements. If the improvements are significant, replacing the media is not required.
- Conduct a study to determine if filter to waste could be replaced with rinse to waste to address the cross contamination issue.
As noted previously, operating the existing filters at 92 mgd capacity is recommended to meet an EBCT of 5 minutes. Therefore, an additional 48 mgd of filter capacity is required. This assumes no improvement to filter performance based on hydraulic and process improvements.
As Chapter 5 discusses, piloting higher loading rates using optimized pilot filter columns (simulating the hydraulic and process improvements recommended for the filters) is recommended to determine the extent to which the number of new filters could be scaled back (or potentially eliminated). This filter column testing, and perhaps full-scale testing, is recommended regardless of the selected alternative.
3.5 SUMMARY OF RECOMMENDATIONS
Table 3.37 summarizes the recommendations based on the process evaluation for items that will not change based on different alternatives presented in Chapter 5 (with the exception of the chemical system). The process issues these recommendations do not address will be addressed in the proposed alternative treatment options. Where appropriate, process improvement projects will be implemented in conjunction with condition and hydraulic projects near or in a given process (i.e., ozone process improvements will be completed in conjunction with condition items in need of repair or replacement).
| Project | Scope |
|---|---|
| On-site Sludge Handling Improvements | New surge tank, clarifier, and two gravity thickeners |
| Ozone System Improvements | New ozone generators, expanded LOX storage, additional LOX vaporizers |
| Chemical Systems Expansion | Expanded ammonia, sulfuric acid, hydrogen peroxide, polymer, and lime systems(1) |
| Filter System Improvements | Raise filter troughs, inspect underdrains, adjustment of filter backwash method, replacement of media |
Note: (1) If average chemical doses change then these systems need to be re-evaluated. Additionally, if a new aqueous ammonia system is implemented as plan by the City then expansion may not be required. Due to the recommendations in Chapter 5 (new proposed process flow) and for purposes the master plan, it is assumed only hydrogen peroxide will require expansion (if average dose levels are greater than 1.00 mg/L).