©Black & Veatch Holding Company 2017. All rights reserved.
FINAL
MASTER PLAN REPORT
Potable Water Master Plan
B&V PROJECT NO. 190020
PREPARED FOR
City of Tampa
1 OCTOBER 2018

0
Professional Engineer: Si Amanda Schwerman Printed Name 70751 License No. Datt, /

0

Table of Contents
LIST OF TABLES
List of Tables
- Table 3‐1: Population Projection Summary ............................................................................................................... 17
- Table 3‐2: Summary of Projected Demands ............................................................................................................... 18
- Table 3‐3: NRW Category Average % Breakdown ................................................................................................... 19
- Table 3‐4: NRW per Planning Year ................................................................................................................................ 19
- Table 3‐5: System‐wide Demand Ratio Summary ................................................................................................... 20
- Table 3‐6: Demand Projections ....................................................................................................................................... 20
- Table 4‐1: Available SCADA Data .................................................................................................................................... 27
- Table 4‐2: Calibration Goals .............................................................................................................................................. 27
- Table 5‐1: Distribution System Performance Criteria ............................................................................................ 31
- Table 5‐2: Pump Station Regulatory Capacity Assessment ................................................................................. 33
- Table 5‐3: Potable Water Storage Regulatory Capacity Assessment ............................................................... 34
- Table 5‐4: Percent of the System Meeting Pressure Criteria ............................................................................... 35
- Table 5‐5: Percent of the System Meeting Velocity and Headloss Criteria .................................................... 35
- Table 5‐6: Percent of the System Meeting Fire Flow Goals .................................................................................. 36
- Table 6‐1: Water Main Capacity Improvement Summary .................................................................................... 44
- Table 6‐2: Fire Flow Improvement Summary ........................................................................................................... 44
- Table 6‐3: Recommended Improvements ................................................................................................................... 48
- Table 8‐1: Likelihood of Failure and Consequence of Failure Criteria ............................................................ 63
- Table 8‐2: Pipe Segments with TWD Assigned Installation Date Discrepancy ............................................ 64
- Table 8‐3: Pipe Segments with Assumed Installation Date ................................................................................. 65
- Table 8‐4: Minimal Remaining Active Pipe Segments ............................................................................................ 65
- Table 8‐5: Average Life Expectancy ............................................................................................................................... 67
- Table 8‐6: Criteria Weightings ......................................................................................................................................... 68
- Table 8‐7: Total and Annual Replacement Costs ...................................................................................................... 69
- Table 9‐1: Water Main Unit Costs ................................................................................................................................... 72
- Table 9‐2: Capital Improvement Plan Summary ...................................................................................................... 73
LIST OF FIGURES
- Figure 2‐1: Existing System Map ..................................................................................................................................... 10
- Figure 2‐2: Existing System Flow Diagram ................................................................................................................. 11
- Figure 2‐3: Interconnection Location Map ................................................................................................................. 16
- Figure 3‐1: Demand Projection Comparison .............................................................................................................. 18
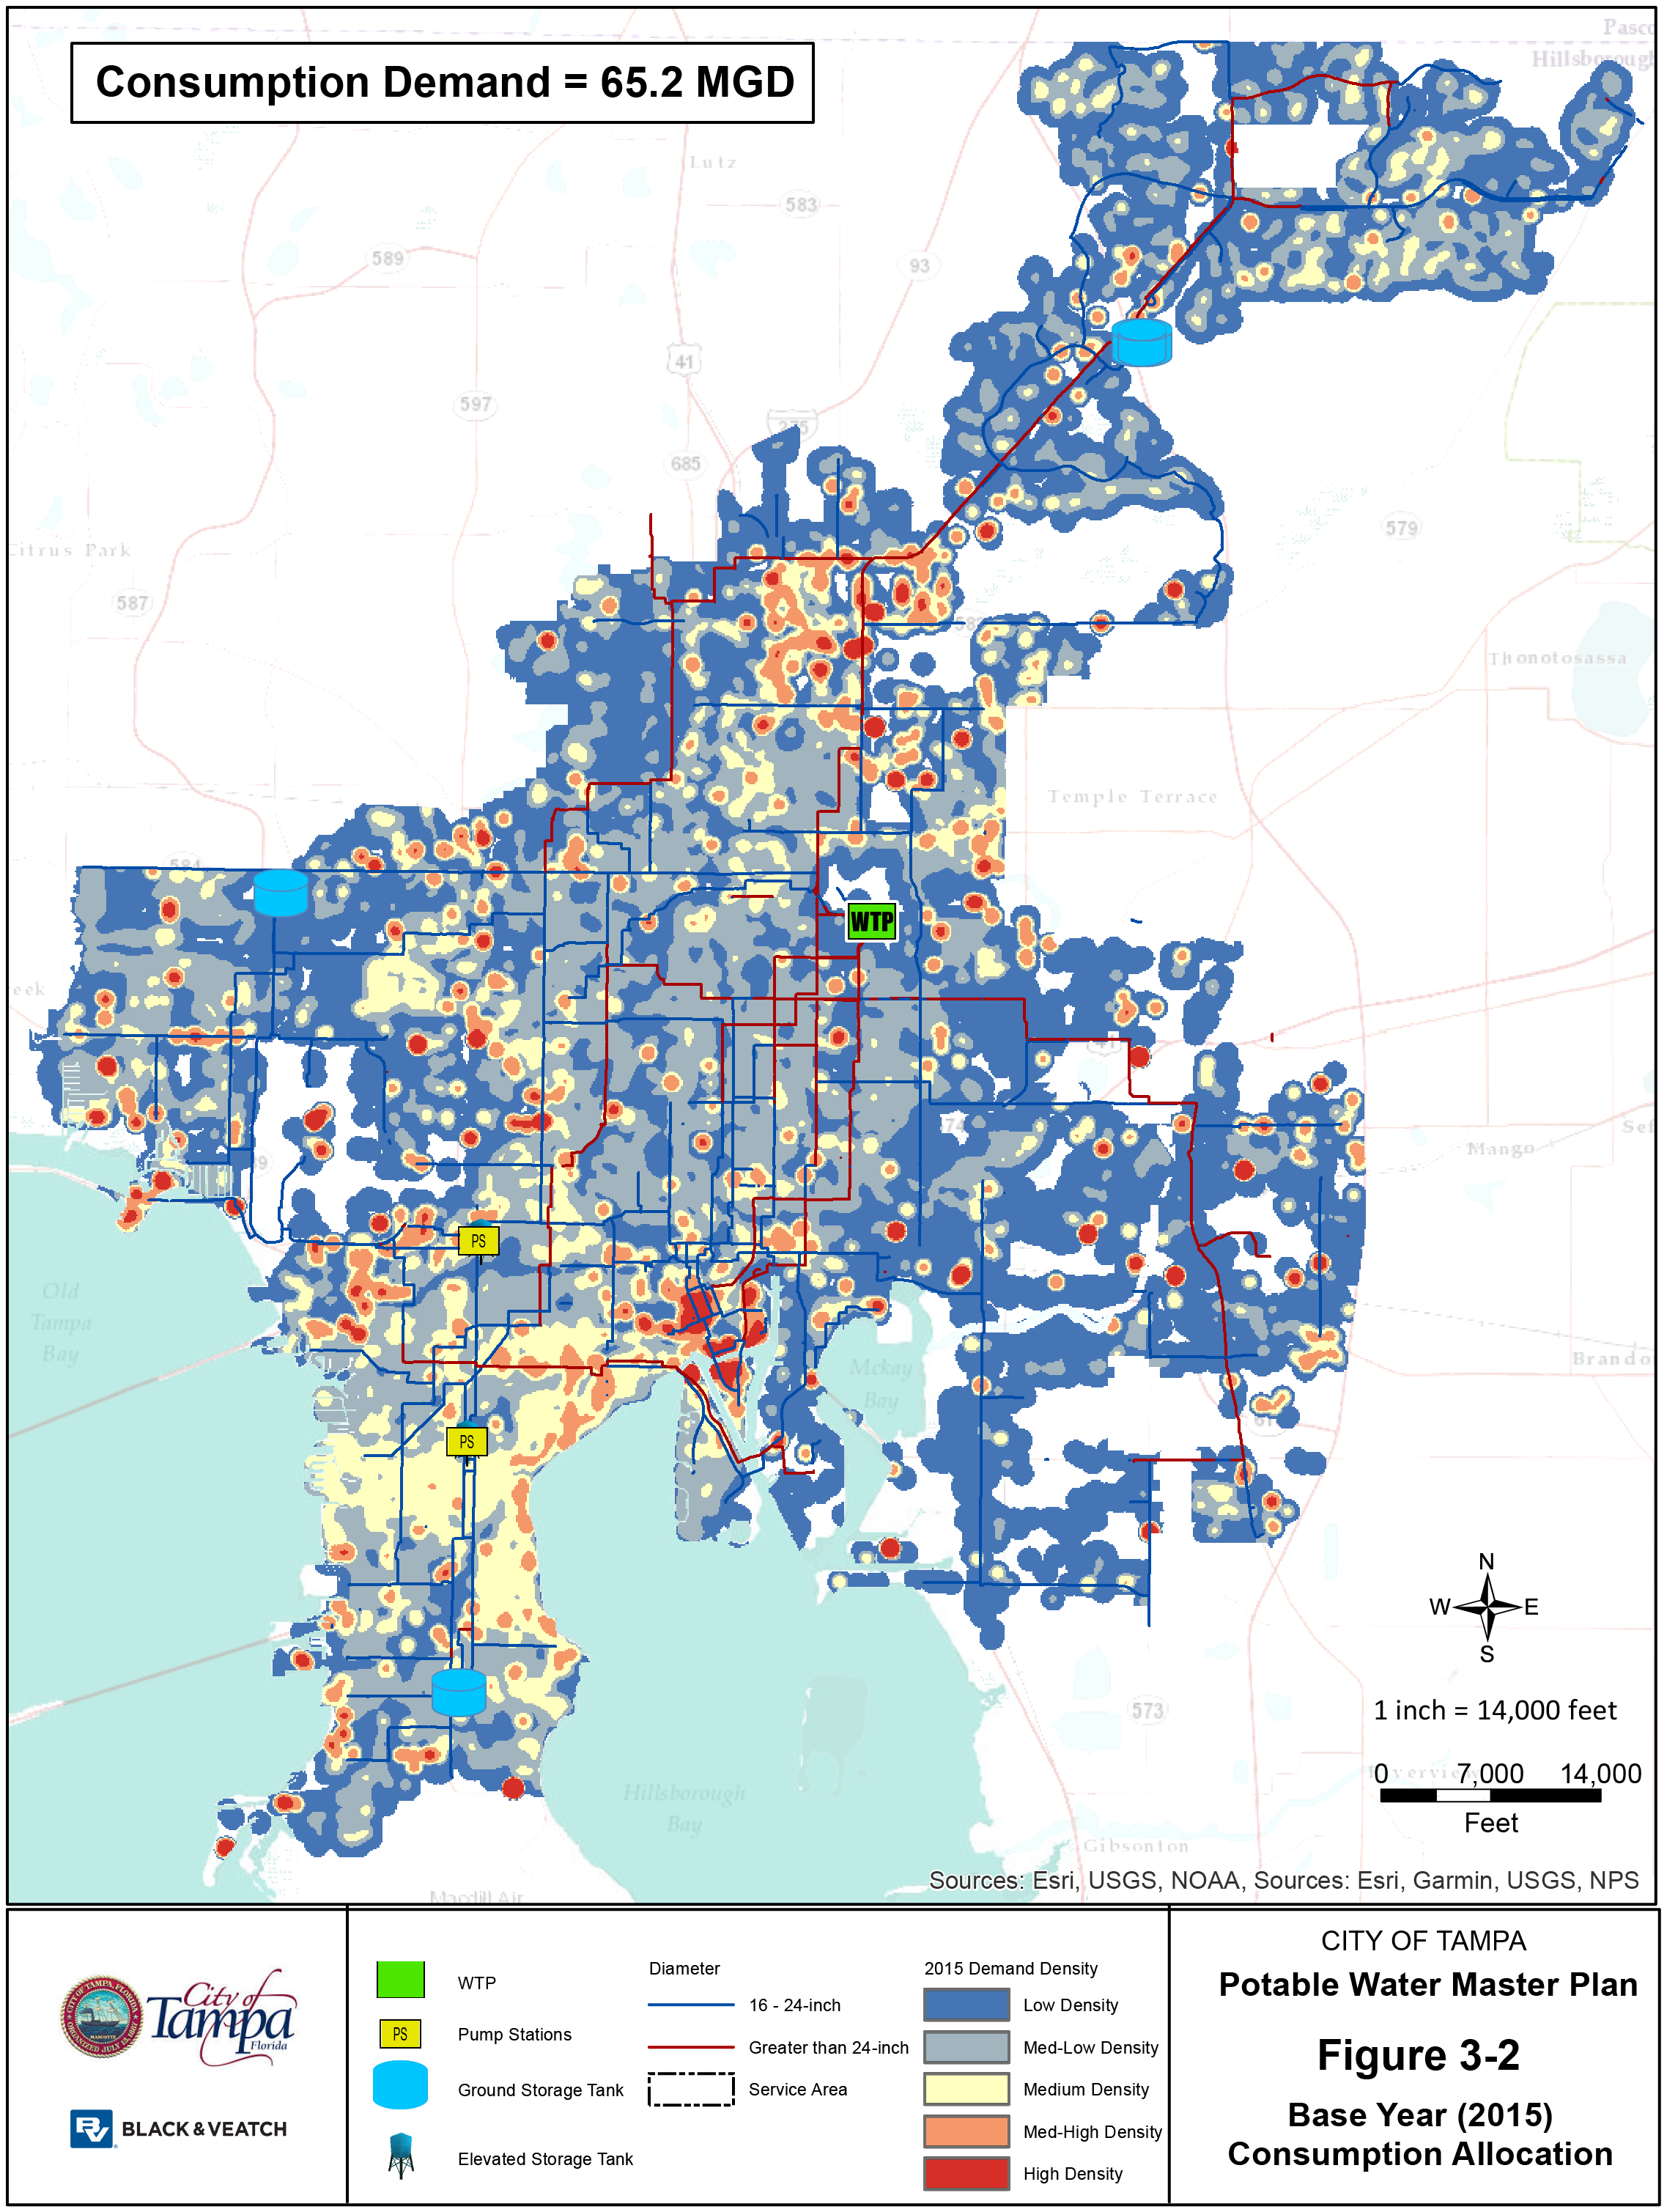
- Figure 3‐2: Base Year (2015) Consumption Allocation ......................................................................................... 21
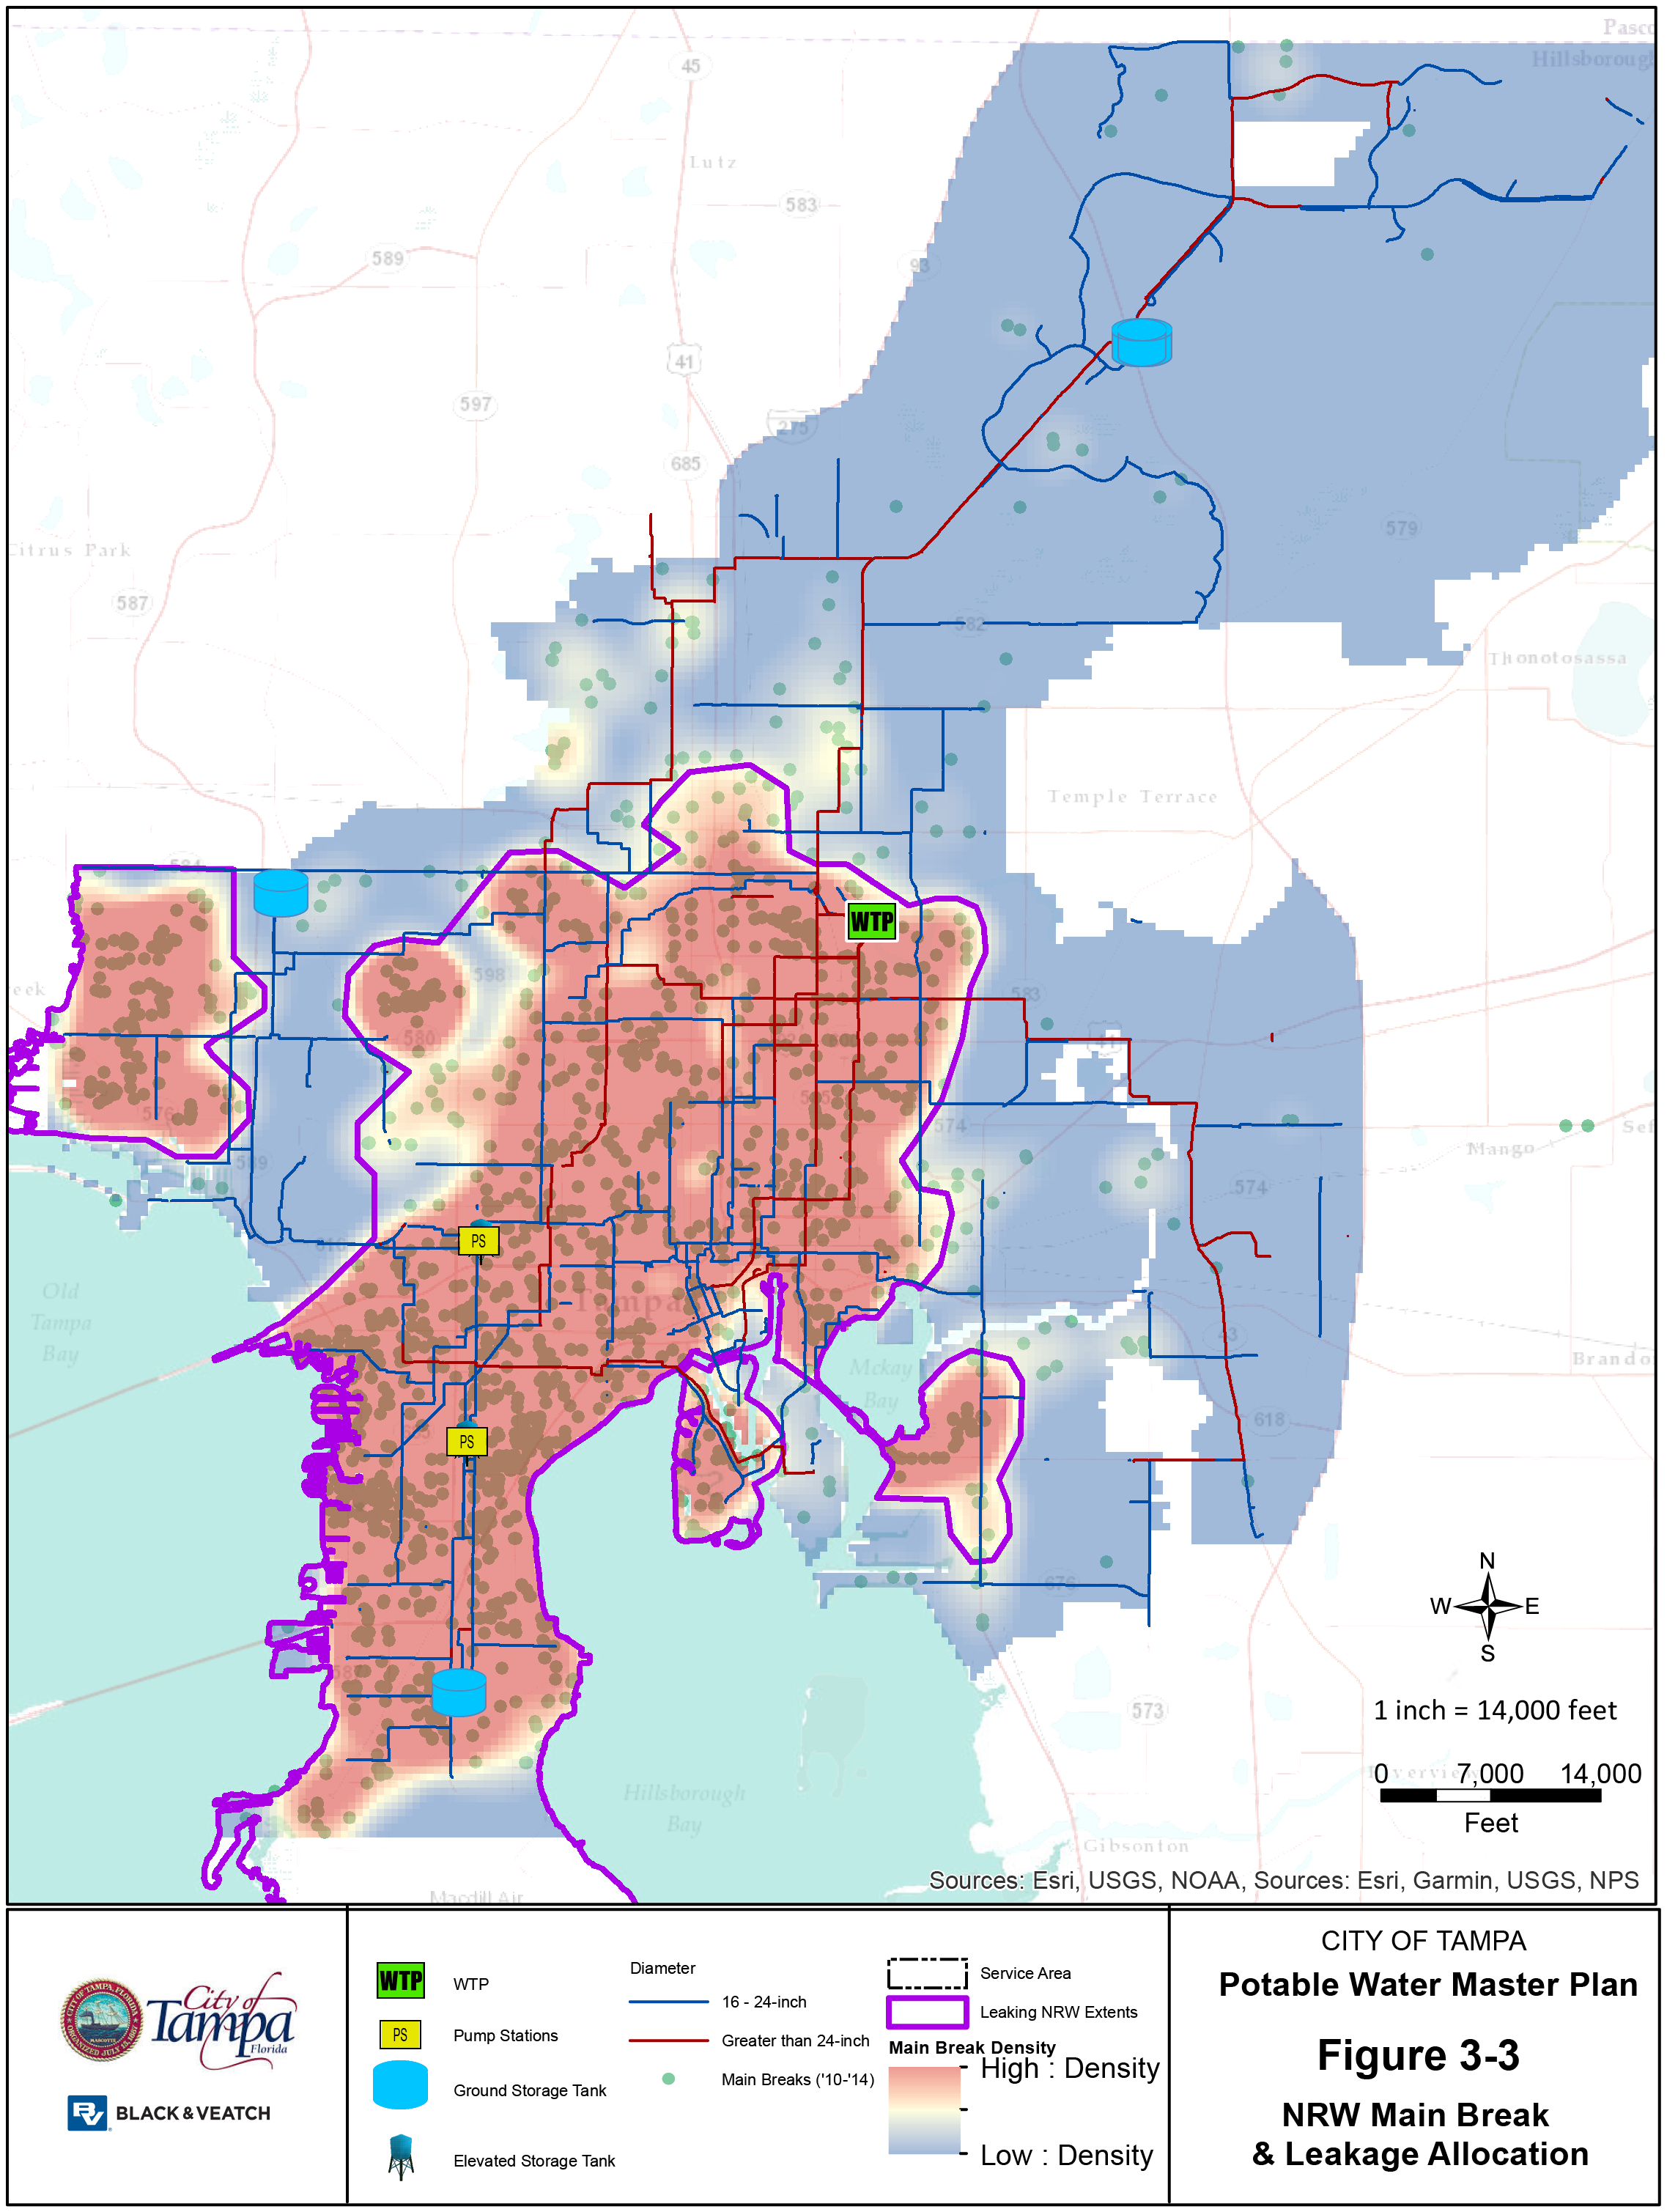
- Figure 3‐3: NRW Main Break and Leakage Allocation ........................................................................................... 22
- Figure 3‐4: DLTWTF MDD Diurnal Pattern ................................................................................................................ 23
- Figure 3‐5: North Tampa MDD Diurnal Pattern ....................................................................................................... 24
- Figure 3‐6: South Tampa MDD Diurnal Pattern ........................................................................................................ 24
- Figure 3‐7: MacDill MDD Diurnal Pattern ................................................................................................................... 25
- Figure 3‐8: System‐wide ADD Diurnal Pattern ......................................................................................................... 25
LIST OF APPENDICES
| Appendix | Title |
|---|---|
| Appendix A | Population and Demand Projection Technical Memorandum |
| Appendix B | Distribution System Improvements Technical Memorandum |
| Appendix C‐a | Model Update and Calibration Technical Memorandum |
| Appendix C‐b | Hydraulic Model Recalibration Technical Memorandum |
| Appendix D | Distribution System Assessment Technical Memorandum |
| Appendix E | TPA and TIA Master Meter Technical Memorandum |
| Appendix F | ISO 55001 Assessment Report |
| Appendix G | Asset Management Implementation Plan Technical Memorandum |
| Appendix H | Risked Based Prioritization Technical Memorandum |
| Appendix I | Water Main Data Quality Review and Survival Curve Development Technical Memorandum |
LIST OF ABBREVIATIONS
| Abbreviation | Definition |
|---|---|
| ADD | Average Day Demand |
| AFB | Air Force Base |
| AMD | Average Month Demand |
| ASR | Aquifer Storage and Recharge |
| AWWA | American Water Works Association |
| BEBR | Bureau of Economic and Business Research |
| CIP | Capital Improvement Plan |
| COF | Consequence of Failure |
| DLTWTF | David L. Tippin Water Treatment Facility |
| EPS | Extended Period Simulations |
| EST | Elevated Storage Tanks |
| FDEP | Florida Department of Environmental Protection |
| FF | Fire Flow |
| GIS | Geographic Information System |
| gpm | Gallons per Minute |
| GST | Ground Storage Tanks |
| HGL | Hydraulic Grade Line |
| HL | Head loss |
| HSPS | High Service Pump Station |
| I‐75 | Interstate 75 |
| ISO | International Organization for Standardization |
| LOF | Likelihood of Failure |
| MDD | Maximum Day Demand |
| MG | Million Gallons |
| MGD | Million Gallons per Day |
| mi | Mile |
| MMD | Maximum Month Demand |
| PF | Peaking Factor |
| PHD | Peak Hour Demand |
| R&R | Rehabilitation and Replacement |
| RPS | Repump Stations |
| SCADA | Supervisory Controls and Data Acquisition |
| SOPs | Standard Operating Procedures |
| SWFWMD | Southwest Florida Water Management District |
| TBW | Tampa Bay Water |
| THIC | Tampa‐Hillsborough Interconnect |
| TM | Technical Memorandum |
| TWD or Department | Tampa Water Department’s |
| USF | University of South Florida |
| VFD | Variable Frequency Drives |
| VSP | Variable Speed Pumps |
| WTF | Water Treatment Facility |
1.0 Introduction
1.1 PURPOSE
This report summarizes the methodology, findings and recommendations of the 2018 Potable Water Master Plan Update (Master Plan) for the City of Tampa (City). Black & Veatch worked closely with the Tampa Water Department (TWD) Staff to develop this Master Plan Update, which involved a comprehensive assessment of the TWD potable water distribution system and facilities, as well as targeted reviews of the strategies and procedures used to operate the distribution system. The results of the assessments were used to define a plan for capital improvements that are needed to allow the TWD to meet future conditions and continue providing a safe and reliable drinking water supply for its customers.
The primary purposes of the Master Plan are to:
- Update Potable Water Demand Projections: Review and adopt population and demand projections, which will serve as the basis for the distribution system capacity assessment.
- Review Planning Criteria: Update the system performance criteria that are used to determine when and where improvements are needed within the distribution system
- Update, Calibrate and Leverage the Hydraulic Model: Update the hydraulic model based on system improvements and new facilities that have been completed since the previous model update, and calibrate the model against recent system operating data to confirm accuracy. The updated and calibrated model will then be used as a tool to evaluate the performance of the system under projected future conditions to define recommended system improvement plans.
- Develop Capital Improvement Project Recommendations: Provide TWD with recommended capital improvement projects forecasted through the planning year 2035 to aid TWD in the development and prioritization of improvement projects for its Capital Improvement Plan (CIP).
- Assess and Advance Asset Management and Risk Based Management Approaches: Review and assess the TWD asset management activities and make recommendations to provide TWD with an asset management framework based on industry best practices. Also, develop a risk prioritization approach and assign a risk score and classification to each water main in the City’s service area to allow the prioritization of rehabilitation and replacement efforts to consider risks in addition to age and condition factors.
2.0 Existing System Summary
2.1 SYSTEM OVERVIEW
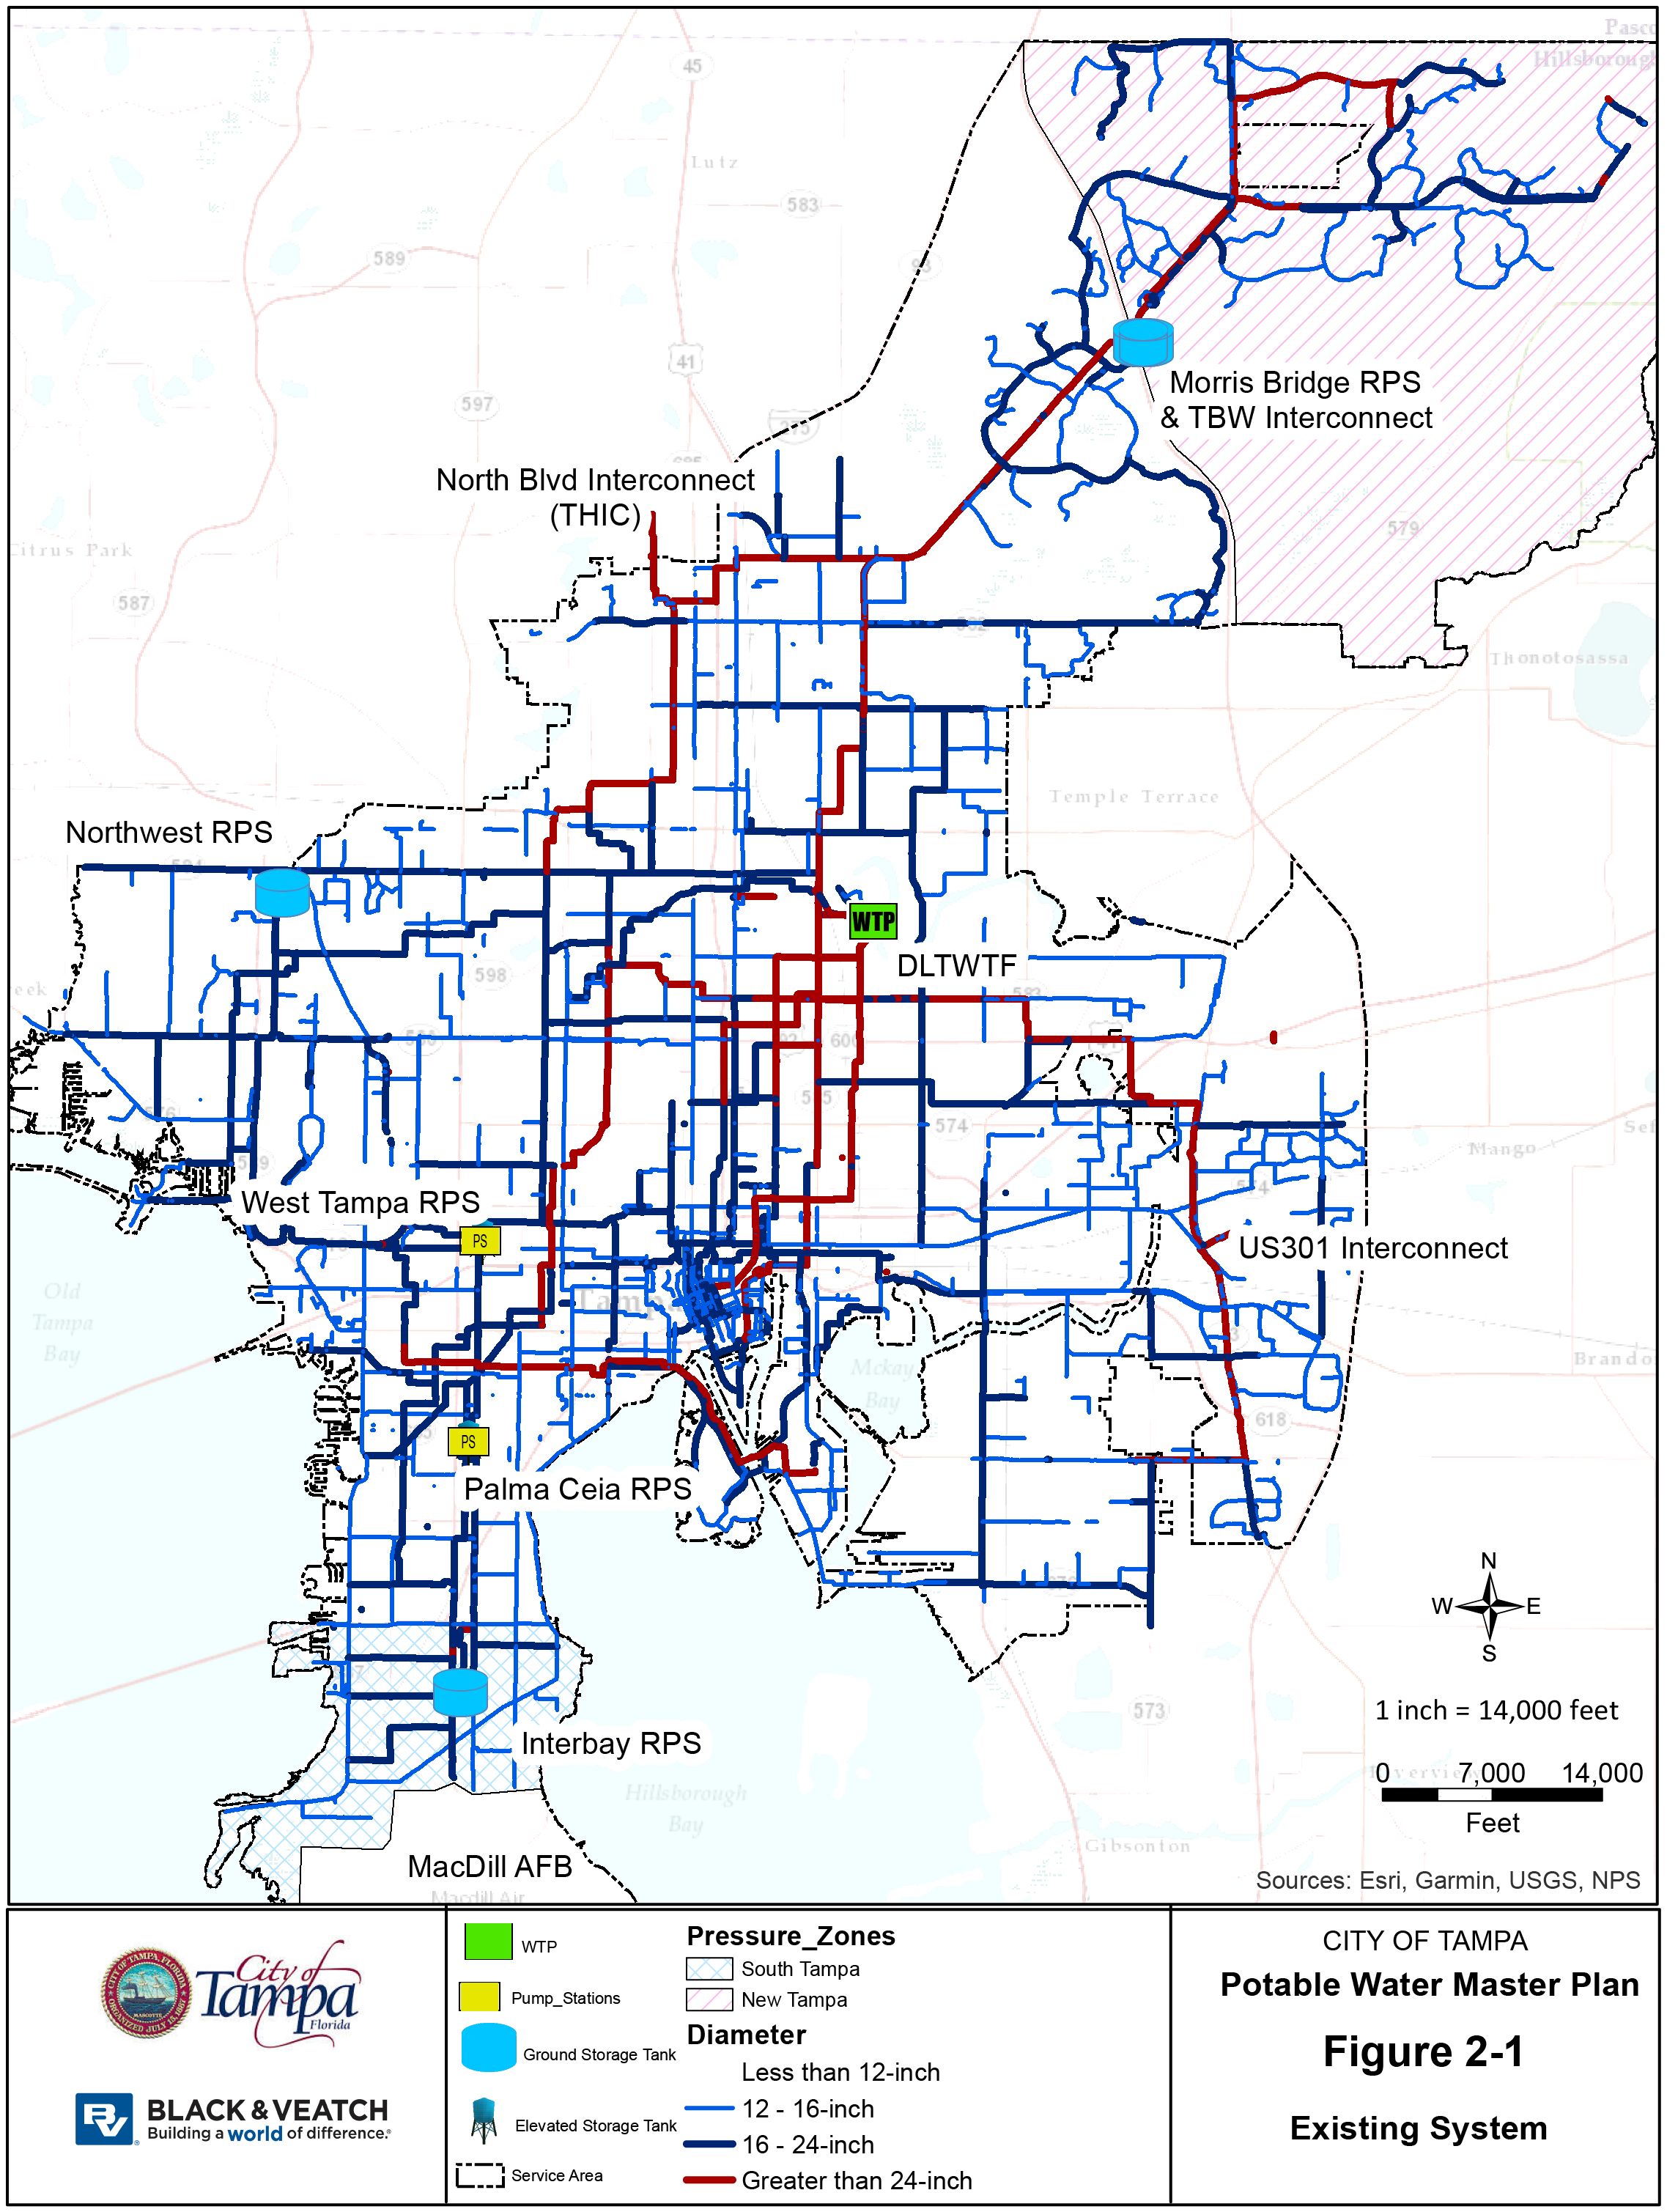
The City of Tampa is a thriving community, with a service population of approximately 600,000 people. The Tampa Water Department (TWD) maintains and operates a potable water distribution system that includes over 2,200 miles of water mains in three pressure zones, five repump stations, 50,000 valves, 14,000 hydrants, and one water treatment facility. The TWD service area encompasses approximately 219 square miles, all within Hillsborough County, and includes the City of Tampa and some surrounding areas of unincorporated Hillsborough County. The boundaries of the TWD service area can be seen in Figure 2‐1.
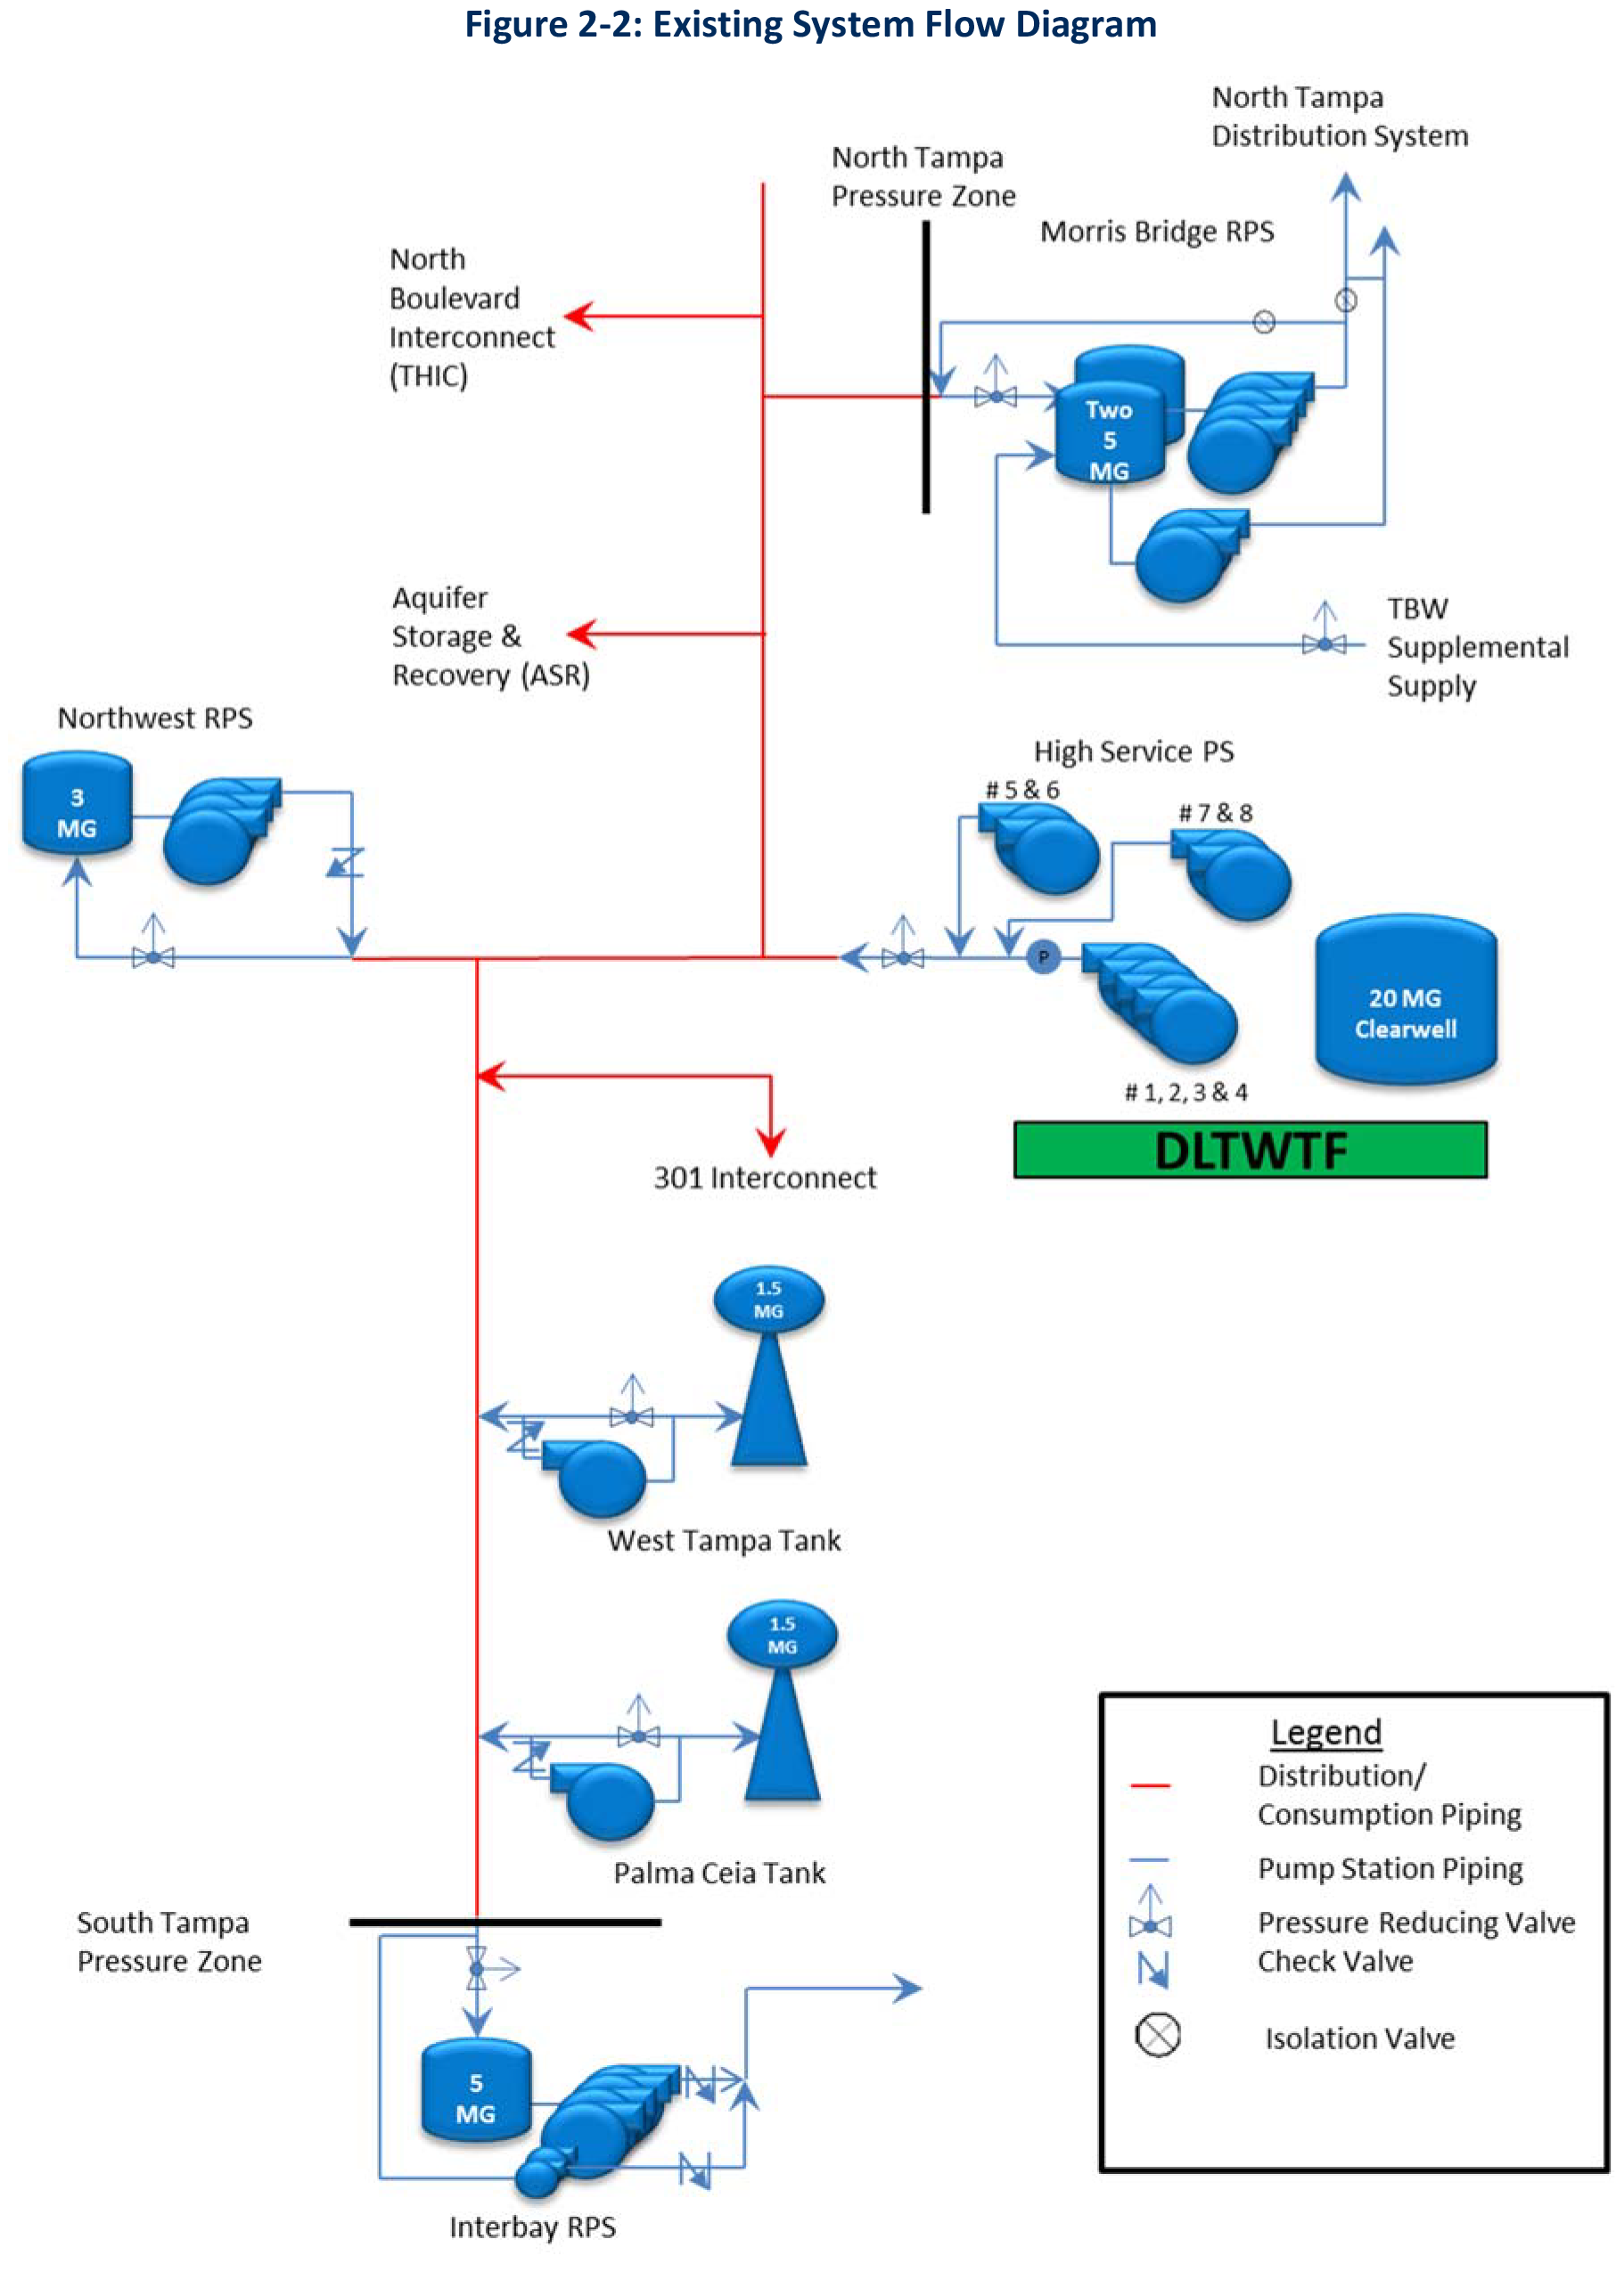
The primary source of potable water supply for the distribution system is the Hillsborough River Reservoir, which is located at the David L. Tippin Water Treatment Facility (DLTWTF). The TWD also operates an aquifer storage and recharge (ASR) program which pumps water into the groundwater aquifer during wet periods and can withdraw the supply back out during dry periods. In addition, TWD has water supply interconnects with the regional wholesale water supply authority, Tampa Bay Water, at the Morris Bridge Repump Station (RPS) and US 301 Interconnect.
The DLTWTF is TWD’s only treatment facility and provides up to 120 MGD of treatment capacity. The DLTWTF has a system of clearwells for finished water storage with an effective capacity of 12.5 million gallons (MG). Following treatment, the DLTWTF’s high service pump station (HSPS) delivers water to the distribution system via eight pumps on two power services.
During the Master Planning process, the TWD modified the operating strategy of the distribution system by creating three separate pressure zones: the DLTWTF, South Tampa, and North Tampa pressure zones. The boundaries for these three pressure zones are currently established by closing system valves. The pressure zones are delineated and supplied as follows:
- The North Tampa pressure zone is located in the northeast portion of the distribution system service area, and is generally north and east of where Interstate 75 crosses through the TWD services area. The North Tampa pressure zone is supplied by the Morris Bridge RPS.
- The South Tampa pressure zone is located in the southern portion of the distribution system service area. The northern boundary of this pressure zone is approximately along Gandy Blvd. The South Tampa pressure zone is fed by the Interbay RPS.
- The DLTWTF pressure zone is located in the center of the distribution system between the North Tampa and South Tampa pressure zones and encompasses the majority of the distribution system. The DLTWTF pressure zone is supplied by the DLTWTF HSPS as well as the Northwest, West Tampa and Palma Ceia RPSs.
The locations of the DLTWTF, the system RPSs, transmission and distribution system piping, and pressure zone boundaries can be seen in Figure 2‐1. A flow diagram schematically depicting facility locations and flow directions can be seen in Figure 2‐2.
2.2 SYSTEM DESCRIPTION
This section provides information regarding the existing system infrastructure and operations that were used to develop the updated hydraulic model of the City of Tampa potable water distribution system. This section also presents the capacities and capabilities of the components that make up the potable water distribution system, including storage, pump stations, distribution piping, and system controls. The system described was used in the modeling and calibration process explained later in this report.
2.2.1 Distribution Piping
The existing distribution system has over 2,130 miles of pipelines ranging from 2‐inches to 54‐inches in diameter. The distribution system is well looped and gridded, which helps to maintain low velocities and headlosses throughout the system. However, the DLTWTF pressure zone also contains a significant quantity of 2‐inch diameter piping, which can experience high headlosses during peak demand periods and restrict available fire flow in these areas.
A summary of the distribution system pipelines by diameter, according to the October 2015 GIS files provided by TWD, is presented in Table 2‐1.
Table 2‐1: Existing Pipeline Summary by Diameter
| Pipeline diameter (inches) | Total length (miles) | Pipeline diameter (inches) | Total length (miles) |
|---|---|---|---|
| 2&3 | 384 | 18 | 0.5 |
| 4 | 74 | 20 | 33 |
| 6 | 664 | 24 | 75 |
| 8 | 578 | 30 | 25 |
| 10 | 10 | 36 | 35 |
| 12 | 318 | 42 | 14 |
| 14 | 1 | 48 | 5 |
| 16 | 102 | 54 | 0.4 |
| Total | 2,327 |
Pipelines below 2‐inches omitted. 2‐inch and 3‐inch combined
2.2.2 Storage
After treatment at the DLTWTF, finished water is initially stored on site in five separate clearwell structures connected by piping with a total of 20 million gallons (MG) of storage capacity and an effective volume of 12.5 MG due to limitation on drawdown to limit pump cavitation and buoyancy of the tanks.
Within the distribution system there are six storage tanks: one each at Interbay, Palma Ceia, West Tampa and Northwest RPSs and two at Morris Bridge RPS. The Interbay, Northwest and Morris Bridge RPSs contain above grade ground storage tanks (GST), while the other two stations contain
elevated storage tanks (EST). However, the system normally operates at a hydraulic grade line (HGL) above the top elevation of the two ESTs. Due to this condition, these elevated tanks function more like ground storage tanks, and pumps have been installed to pump water from the tanks back into the distribution, similar to the RPSs. GST and EST data, including tank bottom elevation and tank total and effective volumes are presented in Table 2‐2.
Table 2‐2: Existing Tank Capacities
| LOCATION | TANK TOTAL VOLUME | TANK EFFECTIVE VOLUME | NOTES |
|---|---|---|---|
| DLTWTF Clearwell | 20.0 | 12.5 | Effective volume per TWD due to pump suction cavitation and tank buoyancy |
| Interbay GST | 5.0 | 5.0 | Tank effluent pipe located at the bottom of tank allowing for full usage of storage |
| Morris Bridge GST | 10.0 | 7.5 | Tank effluent pipe located four feet above the bottom of the tank |
| Northwest GST | 3.0 | 3.0 | Tank effluent pipe located at the bottom of tank allowing for full usage of storage |
| Palma Ceia EST | 1.5 | 1.5 | Tank effluent pipe located at the bottom of tank allowing for full usage of storage |
| West Tampa EST | 1.5 | 1.5 | Tank effluent pipe located at the bottom of tank allowing for full usage of storage |
2.2.3 Pumping
Finished water is pumped from the clearwells by the high service pump station (HSPS) located at the DLTWTF. The target discharge pressure from the HSPS is currently 65 psi, which is set to maintain a minimum distribution system pressure of 40 psi. The distribution system contains three RPSs in the DLTWTF pressure zone. The RPSs are located relatively remote to the DLTWTF and provide the system with the ability to boost pressures during peak periods. Pumping capacity from the HSPS combined with the capacities from the Northwest, West Tampa, and Palma Ceia RPSs yield a pressure zone firm capacity of 160 MGD within the DLTWTF pressure zone.
The North Tampa pressure zone is supplied by the Morris Bridge RPS, which has a total of six pumps in two sets; Pumps 1‐4 and Pumps 5&6. The firm pumping capacity of the Morris Bridge RPS is 66 MGD based on the modeled capacity of pumps #1‐4 alone because the two sets of pumps cannot discharge to the same location simultaneously. However, the Morris Bridge RPS pumps are setup to allow multiple pumping configurations, including allowing pumps #5 and 6 to serve the North Tampa Zone while allowing Pumps 1‐4 to discharge into the DLTWTF zone when purchasing water from Tampa Bay Water.
The South Tampa pressure zone is fed by the Interbay RPS, which also has a total of six pumps; two jockey pumps and four standard pumps. The firm pumping capacity of the Interbay RPS is 15 MGD, which is supplied by pumps #1‐4 alone, because the two pump groups cannot be run concurrently.
The pumping capacity and characteristics of each pump and each RPS in the distribution system are summarized in Table 2‐3.
Table 2‐3: Existing Pump Capacities
| Pump Station (Pump Type/ Install Year) | # | Maximum Capacity (gpm) | Maximum Capacity (MGD) | Rated Capacity (gpm) | Rated Capacity (MGD) | Rated TDH (ft) | Motor (Type) | Typical & Standby Power Capability | Total Pump Station Capacity Max (MGD) | Total Pump Station Capacity Rated (MGD) | Total Pump Station Capacity Rated (MGD) | Total Pump Station Capacity Modeled |
|---|---|---|---|---|---|---|---|---|---|---|---|---|
| Pump Station (Pump Type/ Install Year) | # | (gpm) | (MGD) | (gpm) | (MGD) | (ft) | (Type) | Typical & Standby Power Capability | (MGD) | (MGD) | Rated | Modeled |
| D.L. Tippin WTP‐ High Service Pump Station1 | 1 | NA | NA | 13,900 | 20 | NA | Constant | 2 Utility Feeds & Generators | NA | 164 | 134 | 134 |
| D.L. Tippin WTP‐ High Service Pump Station1 | 2 | NA | NA | 8,150 | 12 | NA | Constant | 2 Utility Feeds & Generators | NA | 164 | 134 | 134 |
| D.L. Tippin WTP‐ High Service Pump Station1 | 3 | NA | NA | 7,850 | 11 | NA | Constant | 2 Utility Feeds & Generators | NA | 164 | 134 | 134 |
| D.L. Tippin WTP‐ High Service Pump Station1 | 4 | NA | NA | 11,200 | 16 | NA | Constant | 2 Utility Feeds & Generators | NA | 164 | 134 | 134 |
| D.L. Tippin WTP‐ High Service Pump Station1 | 5 | NA | NA | 15,800 | 23 | NA | VFD | 2 Utility Feeds & Generators | NA | 164 | 134 | 134 |
| D.L. Tippin WTP‐ High Service Pump Station1 | 6 | NA | NA | 18,125 | 26 | NA | Constant | 2 Utility Feeds & Generators | NA | 164 | 134 | 134 |
| D.L. Tippin WTP‐ High Service Pump Station1 | 7 | NA | NA | 18,350 | 26 | NA | VFD | 2 Utility Feeds & Generators | NA | 164 | 134 | 134 |
| D.L. Tippin WTP‐ High Service Pump Station1 | 8 | NA | NA | 20,750 | 30 | NA | VFD | 2 Utility Feeds & Generators | NA | 164 | 134 | 134 |
| Morris Bridge Repump Station | 1 | 14,000 | 20 | 11,100 | 16 | 152 | VFD | 2 Utility Feeds & Generators | 101 | 78 | 62 | 66 |
| Morris Bridge Repump Station | 2 | 14,000 | 20 | 11,100 | 16 | 152 | VFD | 2 Utility Feeds & Generators | 101 | 78 | 62 | 66 |
| Morris Bridge Repump Station | 3 | 14,000 | 20 | 11,100 | 16 | 152 | VFD | 2 Utility Feeds & Generators | 101 | 78 | 62 | 66 |
| Morris Bridge Repump Station | 4 | 14,000 | 20 | 11,100 | 16 | 152 | VFD | 2 Utility Feeds & Generators | 101 | 78 | 62 | 66 |
| Morris Bridge Repump Station | 5 | 4,161 | 6 | 2,200 | 3 | 150 | VFD | 2 Utility Feeds & Generators | 101 | 78 | 62 | 66 |
| Morris Bridge Repump Station | 6 | 7,000 | 10 | 5,850 | 8 | 188 | VFD | 2 Utility Feeds & Generators | 101 | 78 | 62 | 66 |
| Morris Bridge Repump Station | 7 | 4,200 | 6 | 1,500 | 2 | 79 | VFD | 2 Utility Feeds & Generators | 101 | 78 | 62 | 66 |
| Northwest Repump Station | 1 | 2,600 | 4 | 2,100 | 3 | 150 | Constant | 1 Utility Feed & Generator | 15 | 12 | 6 | 8 |
| Northwest Repump Station | 2 | 2,600 | 4 | 2,100 | 3 | 150 | Constant | 1 Utility Feed & Generator | 15 | 12 | 6 | 8 |
| Northwest Repump Station | 3 | 5,000 | 7 | 4,000 | 6 | 150 | Constant | 1 Utility Feed & Generator | 15 | 12 | 6 | 8 |
| Interbay Repump Station | 1 | 5,000 | 7 | 3,000 | 4 | 150 | VFD | 1 Utility Feed & Generator | 30 | 16 | 12 | 15 |
| Interbay Repump Station | 2 | 5,000 | 7 | 3,000 | 4 | 150 | VFD | 1 Utility Feed & Generator | 30 | 16 | 12 | 15 |
| Interbay Repump Station | 3 | 5,000 | 7 | 3,000 | 4 | 150 | VFD | 1 Utility Feed & Generator | 30 | 16 | 12 | 15 |
| Interbay Repump Station | 4 | 5,000 | 7 | 3,000 | 4 | 150 | VFD | 1 Utility Feed & Generator | 30 | 16 | 12 | 15 |
| Interbay Repump Station | 5 | 1,000 | 1 | 1,000 | 1 | 35 | VFD | 1 Utility Feed & Generator | 30 | 16 | 12 | 15 |
| Interbay Repump Station | 6 | 1,000 | 1 | 1,000 | 1 | 35 | VFD | 1 Utility Feed & Generator | 30 | 16 | 12 | 15 |
| West Tampa Repump | 1 | 7,000 | 10 | 5000 | 7.2 | 50 | Constant | 1 Utility Feed | 10 | 7 | 0 | 0 |
| Palma Ceia Repump | 1 | 6,500 | 9 | 5000 | 7.2 | 45 | Constant | 1 Utility Feed | 9 | 7 | 0 | 0 |
| Footnote | 1. Rated capacity of the DLTWTF pumps are unclear on the pump curves and are assumed values in this table. | |||||||||||
2.2.4 Interconnections
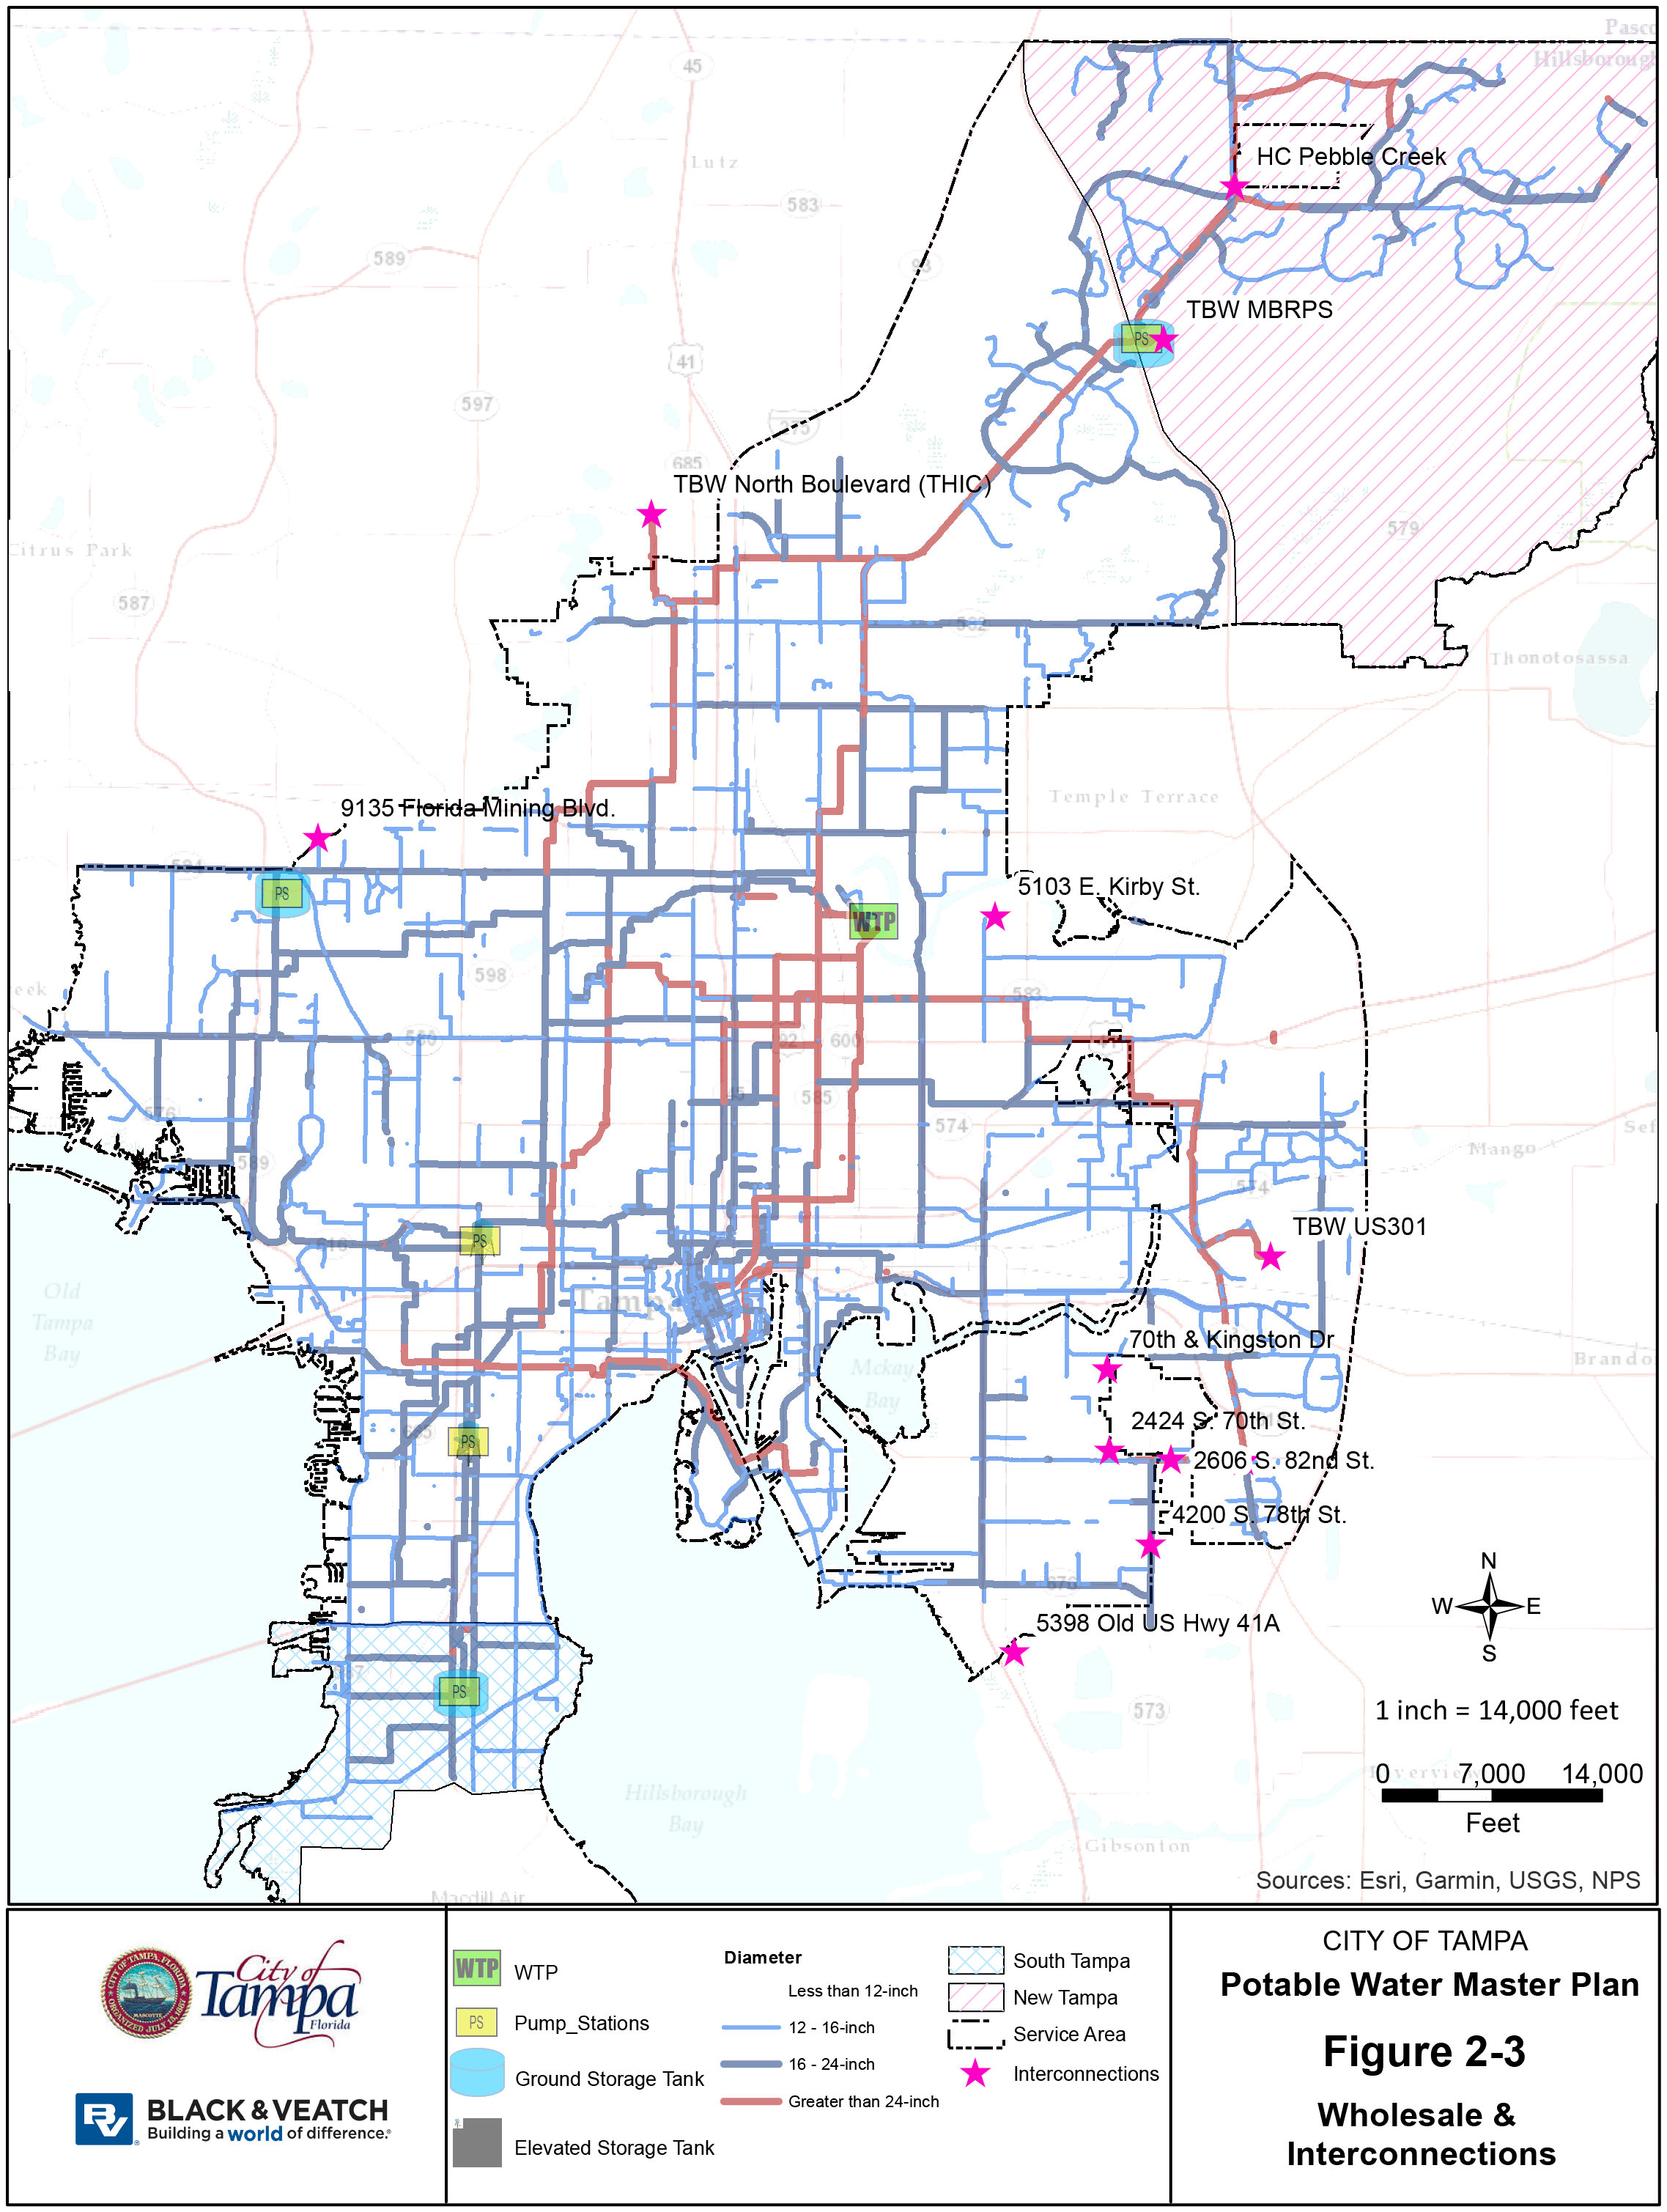
The City of Tampa has two water supply interconnections and several wholesale water delivery interconnections. The two water supply interconnections are with Tampa Bay Water (TBW); 40 MGD at the Morris Bridge RPS and 30 MGD at the US 301 emergency interconnect. The two largest wholesale water delivery connections are at the Tampa‐Hillsborough Interconnect (THIC) also known as the North Boulevard Interconnect supplying water to Hillsborough County, and at the MacDill Airforce Base (AFB). The other wholesale connections are with developments within Hillsborough County and are metered with a residential master meter read monthly rather than a flow meter connected to SCADA. Figure 2‐3 illustrates the location of the Interconnections and wholesale customers.
2.2.5 Planned Improvements
The TWD already has significant distribution system improvements planned for completion prior to the 2020 planning year. These improvements are assumed to be existing in the model for planning year 2020 and future planning years. These planned improvements include:
- The CIAC transmission pipeline. The CIAC pipeline is a 36‐inch transmission main from the DLTWTF HSPS to just south of the Palma Ceia RPS. The CIAC pipeline supplies additional flow south of Kennedy Blvd and increases pressure in the southern DLTWTF pressure zone.
- The KBar pipeline. The KBar pipeline is location in the northeast extents of the North Tampa pressure zone and connects two dead‐ends, increasing looping and available fire flow in the periphery of the service area while decreasing water age.
- Morris Bridge RPS upgrades. A 7th pump will expand the firm capacity of the Morris Bridge RPS and yard piping upgrades will allow multiple pumping configurations, including allowing the station to supply a portion of the DLTWTF zone.
3.0 Population and Demand Projections
3.1 POPULATION PROJECTIONS
Population projections are a critical component of master plans. Updating the hydraulic model included loading new demand projections as well as the updating the spatial allocation of the demands. Black & Veatch compared multiple population projection estimates to reach consensus with the TWD on what to use for the Master Plan. Sources included the Southwest Florida Water Management District (SWFWMD) which uses the University of Florida Bureau of Economic and Business Research (BEBR) data from 2014 and included population spatially distributed across the service area based on parcels; the Exhibit K document prepared by the Tampa Water Department using the high and low Florida Demographic Estimations; and the TBW 2014 Demand projections which use forecasting models that also incorporate factors such as weather and socioeconomic projections.
The SWFWMD estimates were considered to be the “low” population estimate with the Florida Demographic Estimations population projection in Exhibit K considered to be the “high” population estimate. A comparison of the two population projections for planning years analyzed in this Master Plan Update are presented in Table 3‐1. Additional information regarding population projections is presented in Appendix A, Population & Demand Projections Technical Memorandum.
Table 3‐1: Population Projection Summary
| PLANNING YEAR | “LOW” PROJECTIONS | “HIGH” PROJECTIONS |
|---|---|---|
| 2015 | 598,720 | 608,747 |
| 2020 | 611,383 | 651,733 |
| 2025 | 623,894 | 691,240 |
| 2035 | 633,422 | 761,822 |
3.2 DEMAND PROJECTIONS
The same data sources used for the population projections were used to determine the demand projections; SWFWMD, TWD Exhibit K high, TWD Exhibit K low, and TBW 2014 Projections. The different demand forecasts are shown in Figure 3‐1 and summarized in Table 3‐2. The comparison of the four demand projection methodologies and sources provide a window of likely scenarios. The average of the scenarios was selected for use in the Potable Water Master Plan. The solid black line shown in Figure 3‐1 displays the average of all the projections and was selected by TWD for the Master Plan Update. The use of the average demand projections increases the confidence that the analysis will yield applicable results and support conservative, but defendable capital improvement projects.
Figure 3‐1: Demand Projection Comparison
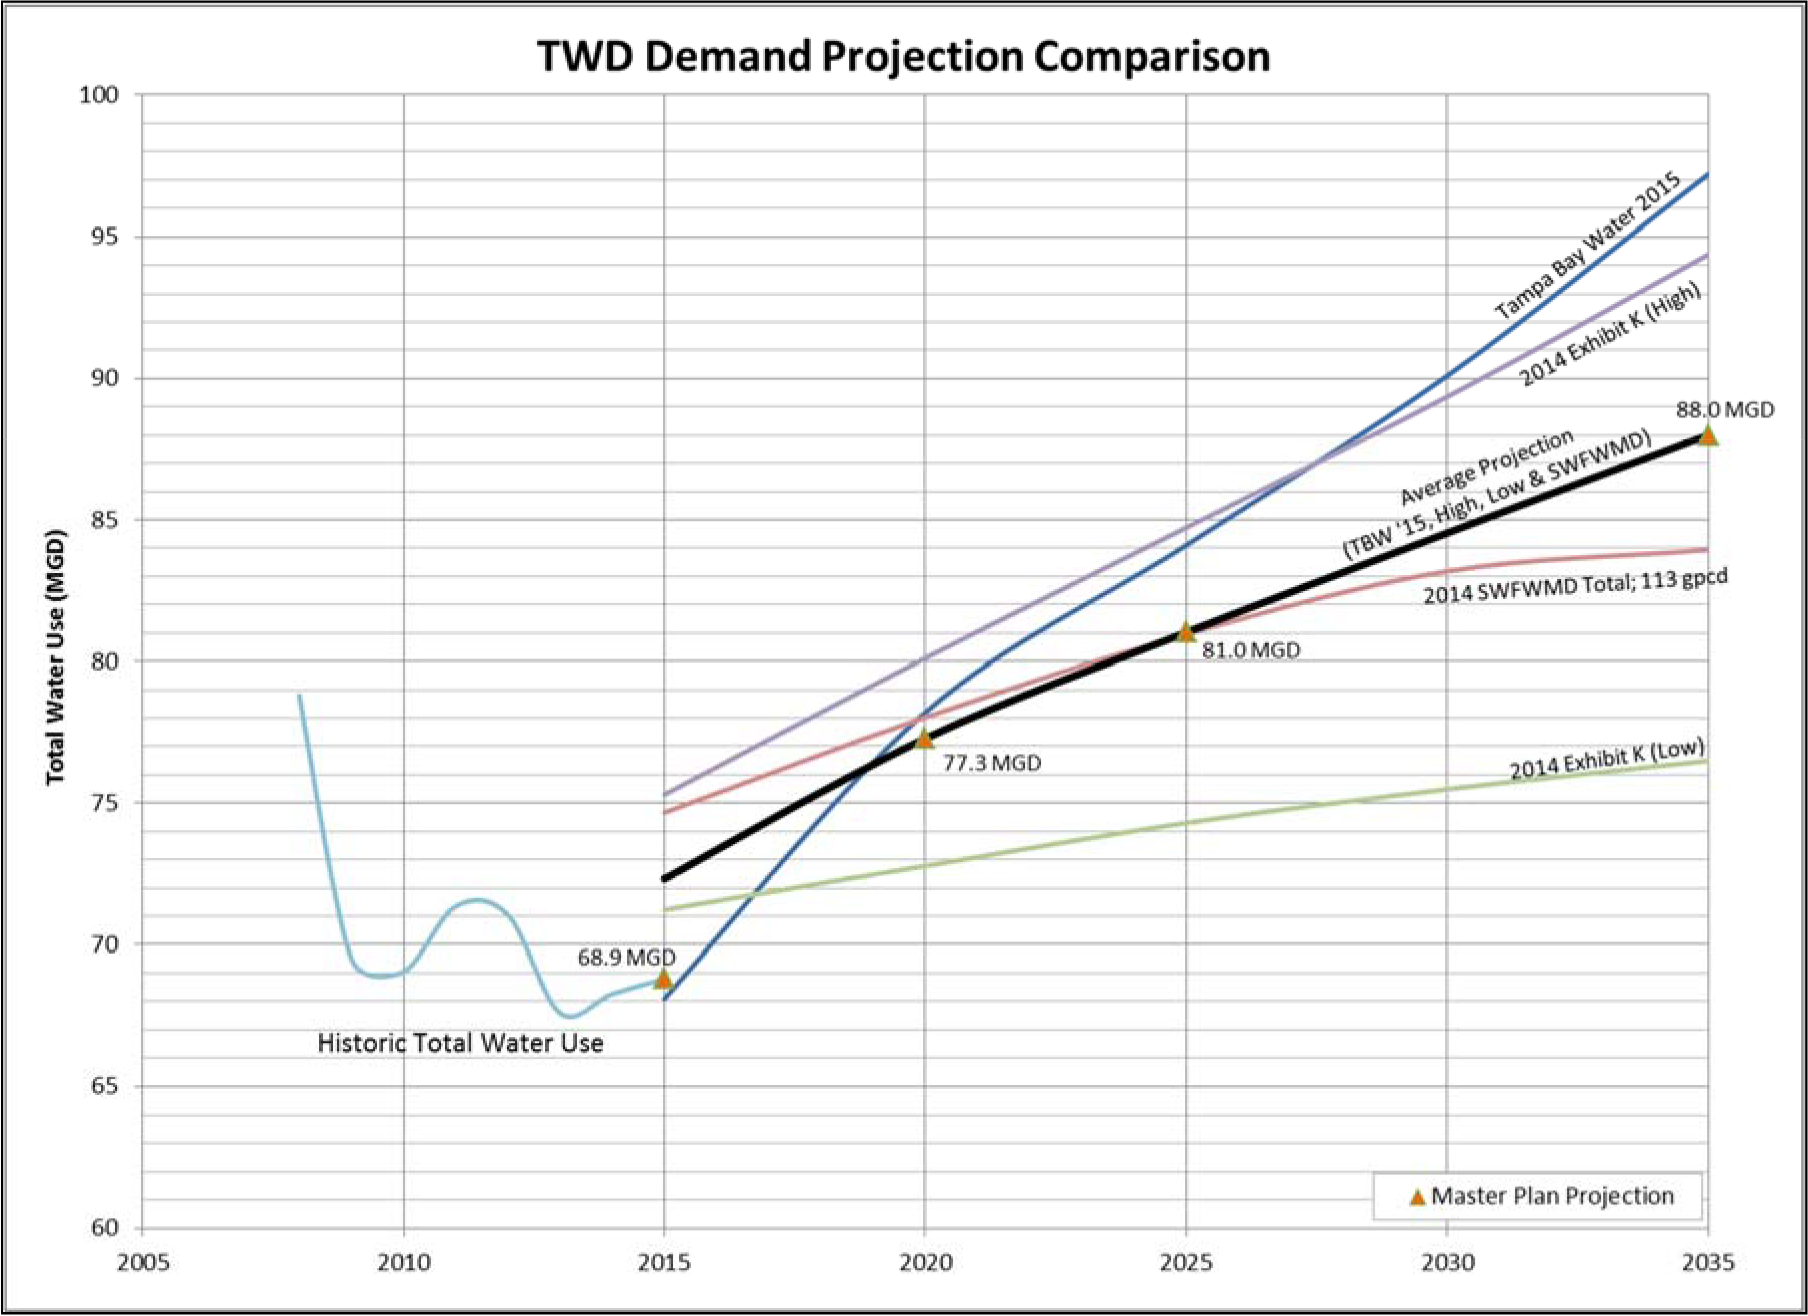
Table 3‐2: Summary of Projected Demands
| YEAR | TWD EXHIBIT K ‐HIGH | TBW | SWFWMD | TWD EXHIBIT K – LOW | AVERAGE |
|---|---|---|---|---|---|
| 2015 | 75.3 | 68.1 | 74.7 | 71.2 | 72.31 |
| 2020 | 80.1 | 78.2 | 78.0 | 72.8 | 77.3 |
| 2025 | 84.7 | 84.1 | 81.0 | 74.3 | 81.0 |
| 2030 | 89.4 | 90.1 | 83.2 | 75.5 | 84.5 |
| 2035 | 94.4 | 97.2 | 83.9 | 76.5 | 88.0 |
1. Actual 2015 demand was 68.9 MGD. The actual demands will be used for the existing system analysis, while the remaining projected demands will be used for future analysis
3.3 NON‐REVENUE WATER
Distribution system demands are comprised of several different uses and are either consumed by customers, referred to as consumption demand and are metered for billing purposes, or are “lost” through water quality flushing, leaks, main breaks, and meter inaccuracies. These “losses” are referred to as non‐revenue water.
Non‐revenue water (NRW) demands are quantities of water lost from the system which are comprised of several categories including: water quality flushing, leakage, main breaks, and meter inaccuracies (apparent losses). NRW is monitored monthly by TWD by comparing total water production and total water consumption. A detailed review of water consumption and production records found that NRW had a five‐year average (2011‐2015) of 11% of total water demand. The NRW was broken down into each source as shown in Table 3‐3.
Table 3‐3: NRW Category Average % Breakdown
| NRW CATEGORY | PERCENT OF NRW |
|---|---|
| Water Quality Flushing | 8% |
| Meter Inaccuracies (apparent losses) | 17% |
| Main Breaks & Leaking | 75% |
| Total | 100% |
NRW was then allocated to each planning year based on the 11% assumption. The adopted planning years demands and non‐revenue water losses are shown in Table 3‐4. Additional details on the calculation and breakdowns of non‐revenue water are available in Appendix A, Population & Demand Projections Technical Memorandum.
Table 3‐4: NRW per Planning Year
| YEAR | TOTAL PROJECTED DEMAND (MGD) | CONSUMPTION DEMAND (MGD) | NON‐REVENUE WATER DEMAND (MGD) | WQ FLUSHING (MGD) | METER INACCURACIES (MGD) | MAIN BREAKS / LEAKAGE (MGD) |
|---|---|---|---|---|---|---|
| 2015 (Base)* | 68.9 | 64.4 | 4.5 | 0.4 | 0.8 | 3.4 |
| 2020 | 77.3 | 68.8 | 8.5 | 0.7 | 1.4 | 6.4 |
| 2025 | 81.0 | 72.0 | 8.9 | 0.7 | 1.5 | 6.7 |
| 2035 | 88.0 | 78.3 | 9.7 | 0.8 | 1.6 | 7.3 |
| *NOTE: 2015 (Base) demands are based on the actual demands recorded (consumptive and NRW). | ||||||
3.4 DEMAND RATIOS
The average day demand (ADD) for each planning year was based on the projected demands and NRW as described above. However, water utilities, including TWD, typically plan for several additional demand conditions including: maximum day demand (MDD) and peak hour demand (PHD). In addition to being used to size new facilities, these conditions are also used to determine the condition of the system utilizing a number of different criteria. For example, FDEP requires pumping capacity to meet or exceed the MDD or PHD plus fire flow depending on the type of storage available.
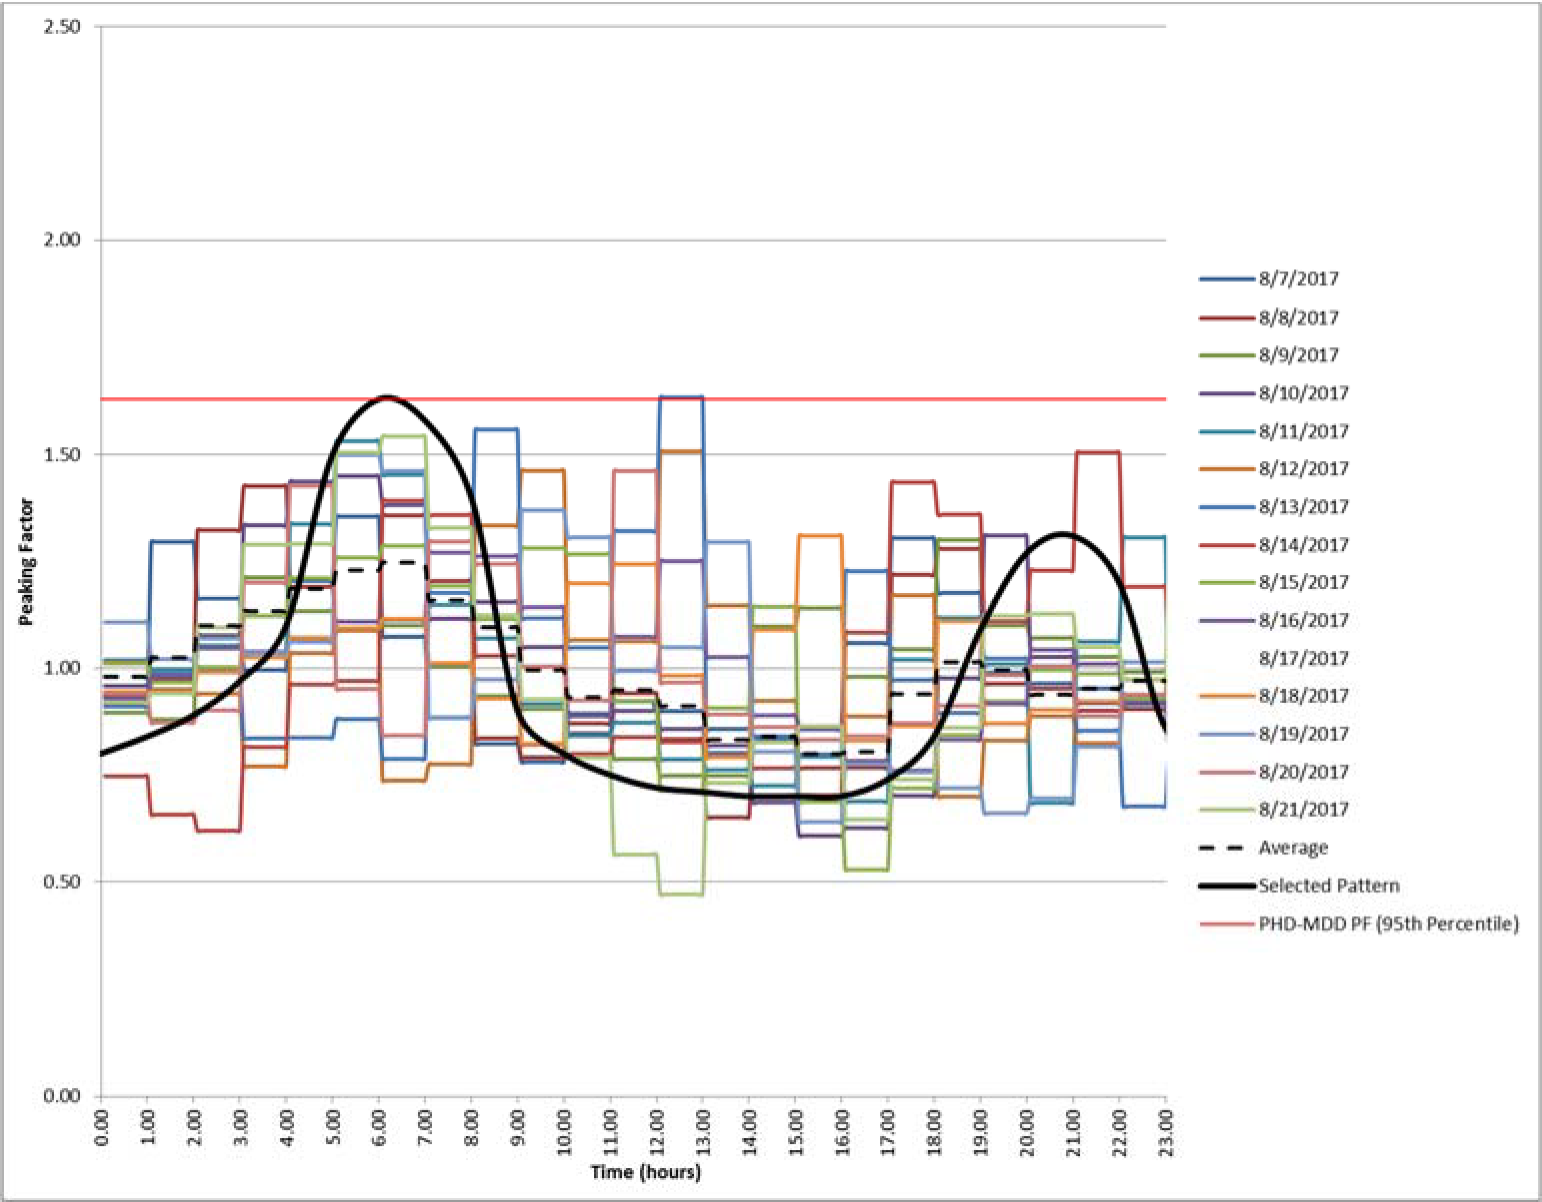
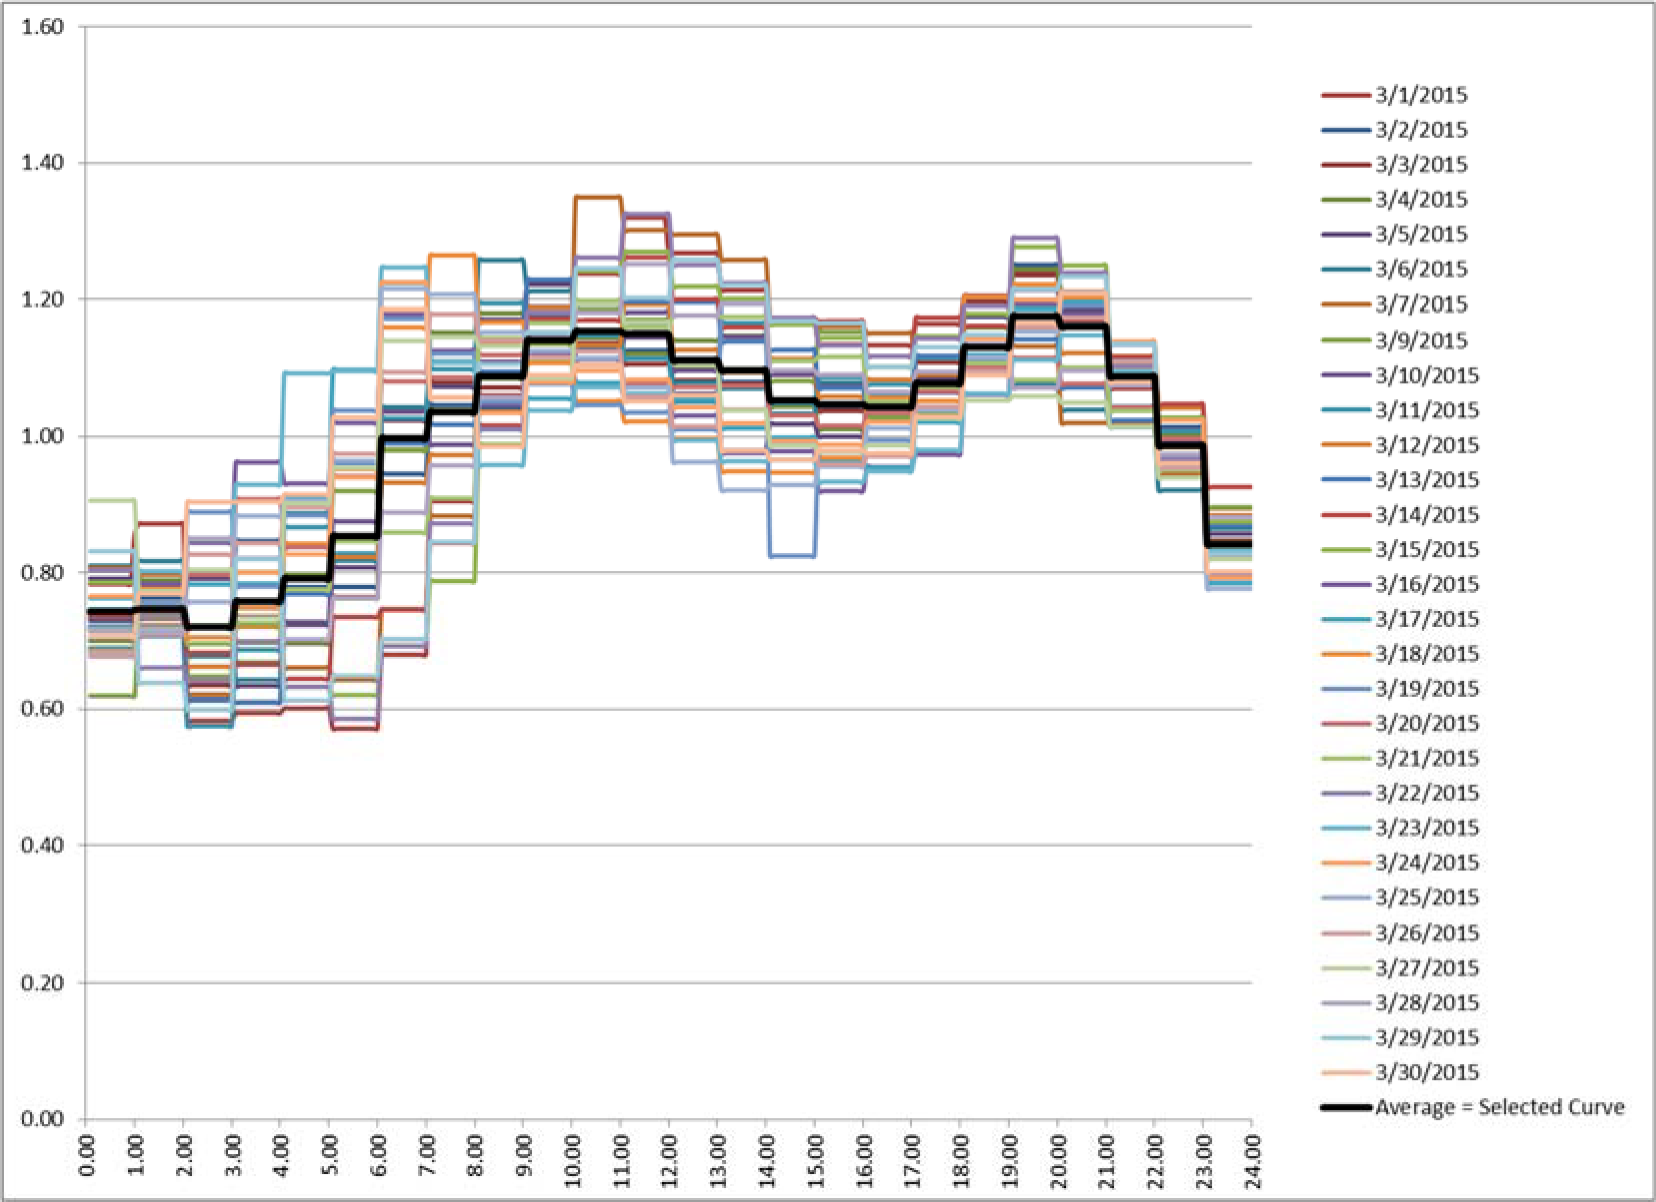
Demand ratios, often referred to as peaking factors, are useful for increasing or decreasing average system demands to match different demand scenarios. This process is used in hydraulic modeling for modifying applied ADD system demands. A summary of demand ratios for the system as one pressure zone was calculated from a 5‐year horizon (2011‐2015) and is presented below in Table 3‐5. The PHD:MDD peaking factors were determined on a per pressure zone basis as a result of the diurnal pattern calculation described further in the section.
Table 3‐5: System‐wide Demand Ratio Summary
| PRESSURE ZONE | MDD:ADD | PHD:MDD | PHD:ADD |
|---|---|---|---|
| DLTWTF | 1.56 | 1.42 | 2.22 |
| North Tampa | 1.56 | 1.63 | 2.54 |
| South Tampa | 1.56 | 1.37 | 2.14 |
3.4.1 Demand Update and Spatial Allocation
Customer billing records are the most current and accurate way to assign real base consumption demands to the hydraulic model. The spatial allocation of demands is almost as important as the demand calculations themselves. To accurately model demands and their impacts on the distribution system, it is important to accurately locate those demands. To determine the location or spatial allocation of the consumption demands, a combination of geocoded customer billing records provided by TWD and population projections by parcel provided by SWFWMD were used. Geocoded records were imported and applied directly to the nearest pipe and node in the model. Non‐revenue water demands, which accounted for eleven percent of total demands, were typically allocated equally across the distribution system. The exception to this occurs where NRW demands are well known, such as at flushing program locations, or where data indicates significant NRW demands have existed, such as in older parts of the system where main breaks are common. Future planning year demand allocations build on the base year consumption allocation, assuming existing use will remain and augmenting with future use based on increases in use derived from the population projections. The base year demand allocation is shown in Figure 3‐2, and the NRW allocation is shown in Figure 3‐3. Table 3‐6 summarizes the demands used for the system analysis and subsequent improvement identifications.
Table 3‐6: Demand Projections
| PRESSURE ZONE | DEMAND BY PLANNING YEAR (MGD) | |||||||||||
|---|---|---|---|---|---|---|---|---|---|---|---|---|
| 2015 | 2020 | 2025 | 2035 | |||||||||
| ADD | MDD | PHD | ADD | MDD | PHD | ADD | MDD | PHD | ADD | MDD | PHD | |
| North Tampa | 4.8 | 7.4 | 10.5 | 6.1 | 9.5 | 13.5 | 7.0 | 10.8 | 15.4 | 8.3 | 13.0 | 18.5 |
| South Tampa | 4.6 | 7.2 | 11.7 | 5.1 | 7.9 | 12.9 | 5.2 | 8.1 | 13.2 | 5.4 | 8.4 | 13.6 |
| DLTWTF | 59.6 | 93.0 | 127.4 | 66.1 | 103.2 | 141.3 | 68.8 | 107.3 | 147.0 | 74.3 | 115.9 | 158.8 |
| Total | 69.0 | 107.6 | ‐ | 77.3 | 120.6 | ‐ | 80.9 | 126.2 | ‐ | 88.0 | 137.3 | ‐ |
3.4.2 Diurnal Pattern Update
In order to conduct a 24‐hour extended period simulation (EPS) analysis, it was necessary to define diurnal demand patterns for each pressure zone that represent the existing system demand patterns as close as possible. This was accomplished through a mass balance calculation using the available SCADA data to relate pump station flows and changes in tank levels to determine system, facility, and pressure zone demands.
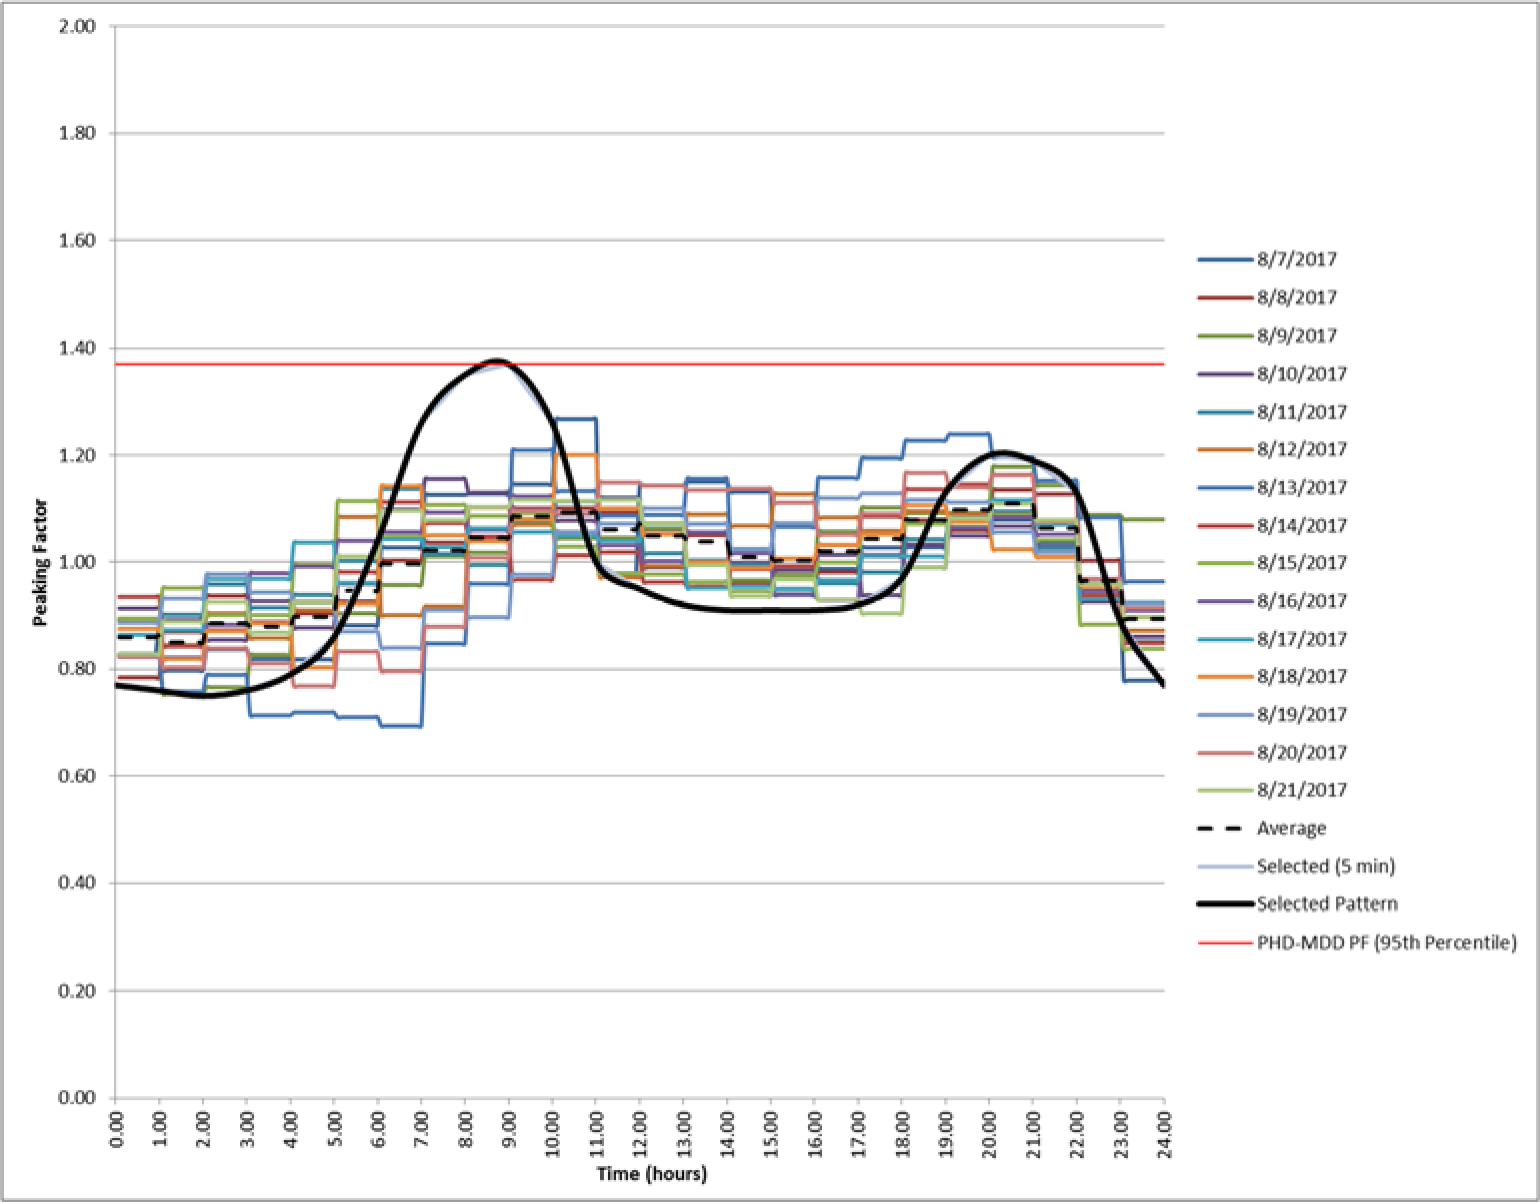
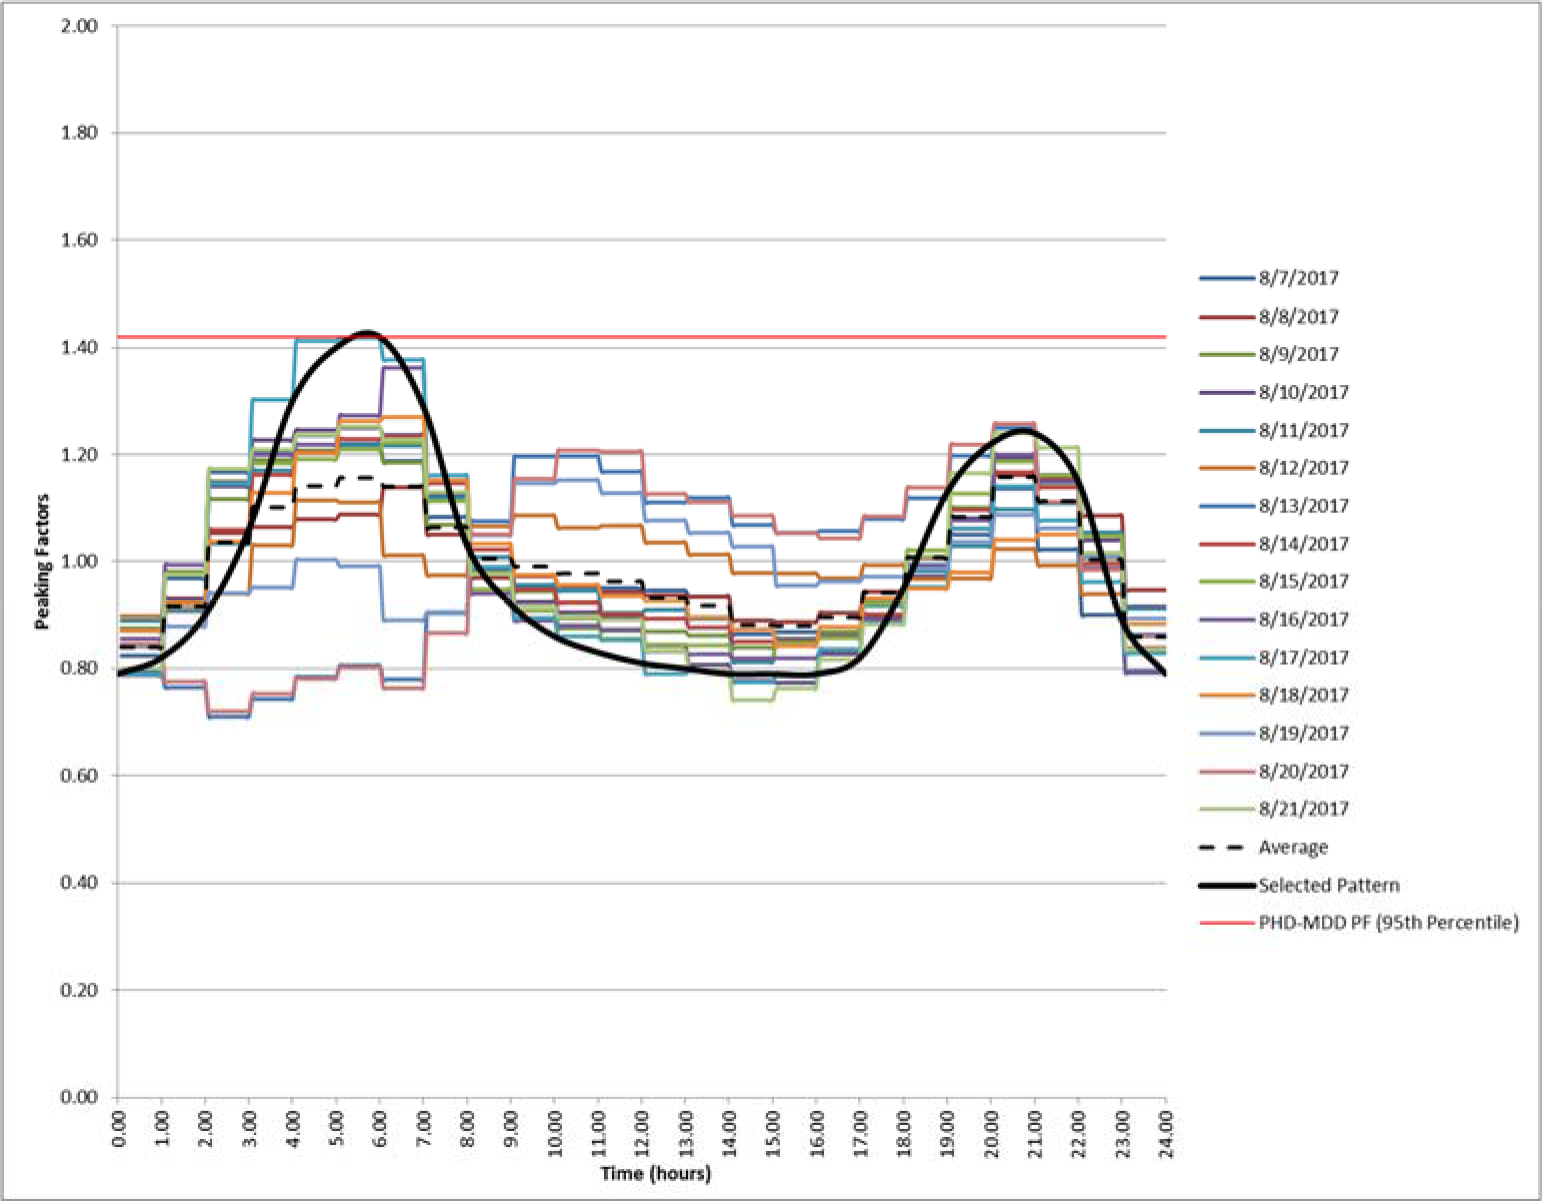
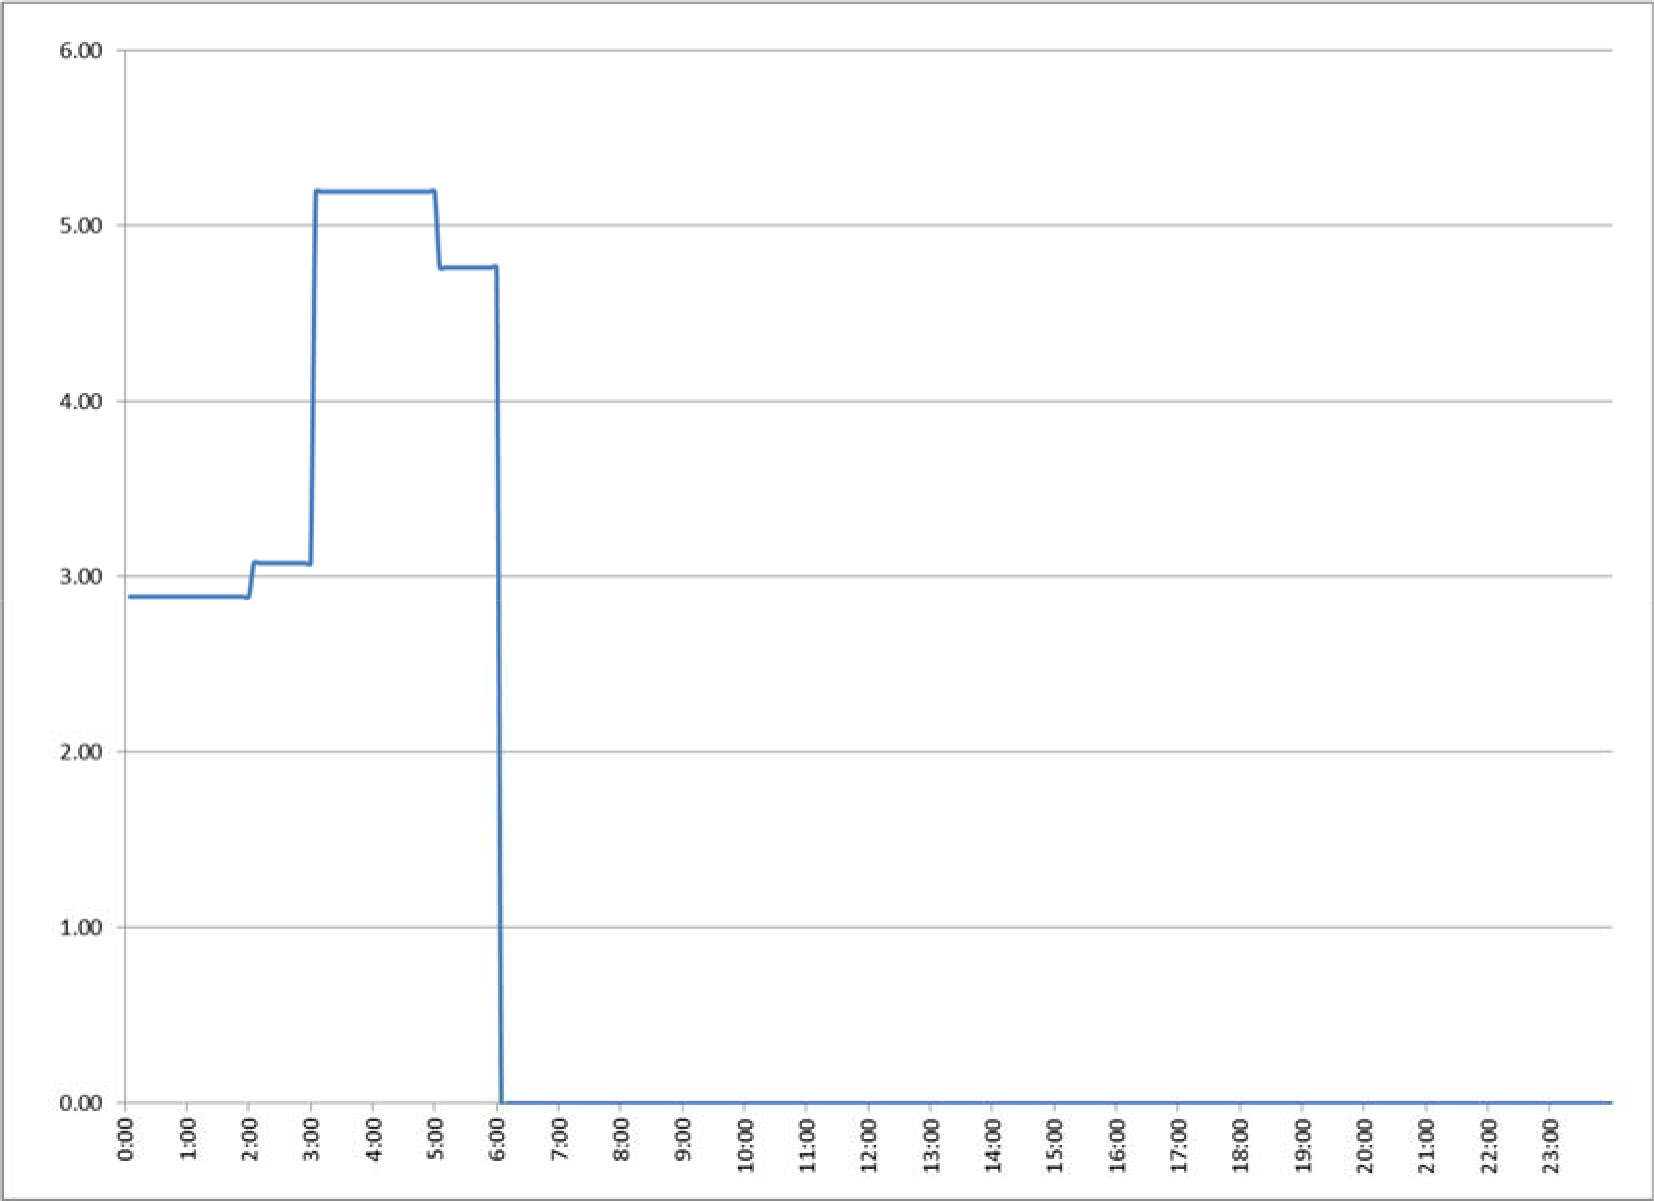
The selected MDD analysis pattern for each of the three pressure zones (DLTWTF, North Tampa, and South Tampa) are illustrated in Figure 3‐4 through Figure 3‐6. An additional diurnal pattern was developed to represent the time‐specific pattern of demands from MacDill Air Force Base (AFB), which draws water from the TWD system to fill its reservoirs and operate its water system. Figure 3‐7 illustrates the selected MacDill AFB demand pattern. The date selection process for demand data and the data processing and aggregation to compile and combine multiple days of data into a single pattern for each pressure zone is detailed in Appendix B, Distribution System Improvements Technical Memorandum.
4.0 Hydraulic Model Update and Calibration
The TWD maintains a hydraulic model (model) of its potable water distribution system to conduct various analyses on the capabilities and capacities of the system. Black & Veatch updated the City’s hydraulic model with 2015 water demand information and prepared the model for extended period simulations (EPS). A 24‐hour EPS is the preferred calibration methodology and provides a clear indication of the ability of the hydraulic model to simulate system operating conditions under a number of settings. In addition, Black & Veatch completed a model calibration process to compare and validate the updated hydraulic model results with actual system operating data that was collected by the City.
Since the previous 2009 master plan and during this 2018 Master Plan update, the TWD has made a significant operational change, switching from operating their system as one large pressure zone, to three pressure zones. In the new operating configuration, pressure zone boundaries were established and the Interbay and Morris Bridge RPSs are used to supply water to the two new pressure zones. There are two hydraulic model calibration technical memorandums included in Appendix C that reflect the change in the system configuration. The results provided in this section of the report are for the most recent calibration effort reflecting the three pressure zone configuration.
4.1 MODEL UPDATE
In order for the TWD to more fully use the capabilities of its hydraulic model in analyzing its distribution system, the model needed to be updated to allow for EPS. To be accurate, EPS simulations require significantly more information, and the update of the TWD’s model for EPS required a number of changes including: collecting and applying system customer demand information, selecting system monitoring data and using that data to calculate changes in system demands at regular intervals to produce diurnal patterns, and collecting information regarding controls and operations of tank fill valves and the system’s pump stations. The model also required the addition of new and updated facilities.
4.2 CALIBRATION FIELD DATA
The TWD records and maintains Supervisory Controls and Data Acquisition (SCADA) data at each of the major system facilities, including the five RPSs and several permanent pressure loggers throughout the distribution system. The availability of this data allowed Black & Veatch to conduct an EPS model calibration of the distribution system following the update of the model. Data from 28 permanent SCADA pressure loggers and nine temporary hydrant pressure loggers was also available for the calibration effort. Table 4‐1 summarizes the available SCADA data.
To calibrate the model for EPS, a date had to be selected for the required 24 hours of data. September 5, 2017 was selected from the available data range (August 23‐September 7, 2017) due to its data consistency, small amount of SCADA data gaps, and high water demand. Diurnal demand patterns for the specific calibration data period were generated following the same process used to generate the diurnal patterns for the pressure zones. Calibration field data and diurnal demand pattern development and application are explained in further detail in Appendix C‐b Recalibration Technical Memorandum.
Table 4‐1: Available SCADA Data
| PUMP STATION, TANK OR LOGGER | PUMP STATUS | PUMP SPEED | TOTAL FLOW | INDIVIDUAL PUMP FLOW | DISCHARGE PRESSURE | TANK LEVEL |
|---|---|---|---|---|---|---|
| D.L. Tippin WTF | Limited (missing data on 6, 7, & 8) | Limited (missing data on 5, 7, & 8) | Yes | ‐ | Yes | N/A |
| Interbay RPS | Limited (lots of “Bad” readings) | Limited (lots of “Bad” readings, missing jockey pumps) | Yes (had a few “Bad” reading which were assumed to be zero) | ‐ | Yes | Yes |
| Morris Bridge RPS | Yes (looks like there is an error with 3 & 4, assumed off) | No | Yes | No | Yes | Yes |
| Northwest RPS | No | N/A | Yes | No | Yes | Yes |
| Palma Ceia RPS | No | N/A | No | No | Yes | Yes |
| West Tampa RPS | Yes | N/A | No | No | Yes | Yes |
| North Boulevard Connection | Yes | No | Yes | No | Yes | N/A |
| Aquifer Storage Recovery (ASR) Recharge Flow | No | N/A | No | Yes | No | N/A |
4.3 CALIBRATION GOALS
The calibration of the system hydraulic model included a total of 10 facility points of calibration (flow & tank levels) and 35 points of calibration at the permanent and temporary pressure loggers conducted over 288 different time steps. To determine the accuracy of the calibration, Black & Veatch set a number of goals and limits that are consistent with best practices for calibrating hydraulic models for water distribution systems. The calibration goals are summarized in Table 4‐2. Refer to Appendix C‐a, Model Update and Calibration Technical Memorandum, for a description of recommended calibration goals.
Table 4‐2: Calibration Goals
| CALIBRATION POINT TYPE | LOCATION | CALIBRATION GOAL |
|---|---|---|
| Tank Level | Interbay, Morris Bridge, Northwest, Palma Ceia and West Tampa | +/‐ 3 ft. |
| Flow | DLTWTF, Interbay, Morris Bridge, Northwest, ASR Recharge | +/‐ 10% |
| Pressures | Various locations | +/‐ 3 psi |
4.4 CALIBRATION RESULTS AND CONCLUSIONS
The results of calibration show a well calibrated model with a very high correlation between the field SCADA data, the tank levels, and pumped flows. One hundred percent of the 2880 data points covering all the facility locations were within the calibration goals. Likewise, the calibration results of the pressure points also had a good correlation with closely matching daily patterns and 95% of the 12,427 data points were within the calibration goal. Time series plots for pump station, tank level, and pressure point calibration data are included in Attachment 1 of Appendix C‐b, Hydraulic Model Recalibration TM. Figure 4‐1 and Figure 4‐2 illustrate the accuracy of the calibration results.
The following steps might be helpful in increasing the percent of goal met: surveying the elevation of each SCADA points and installing AMR/AMI for better demand allocation.
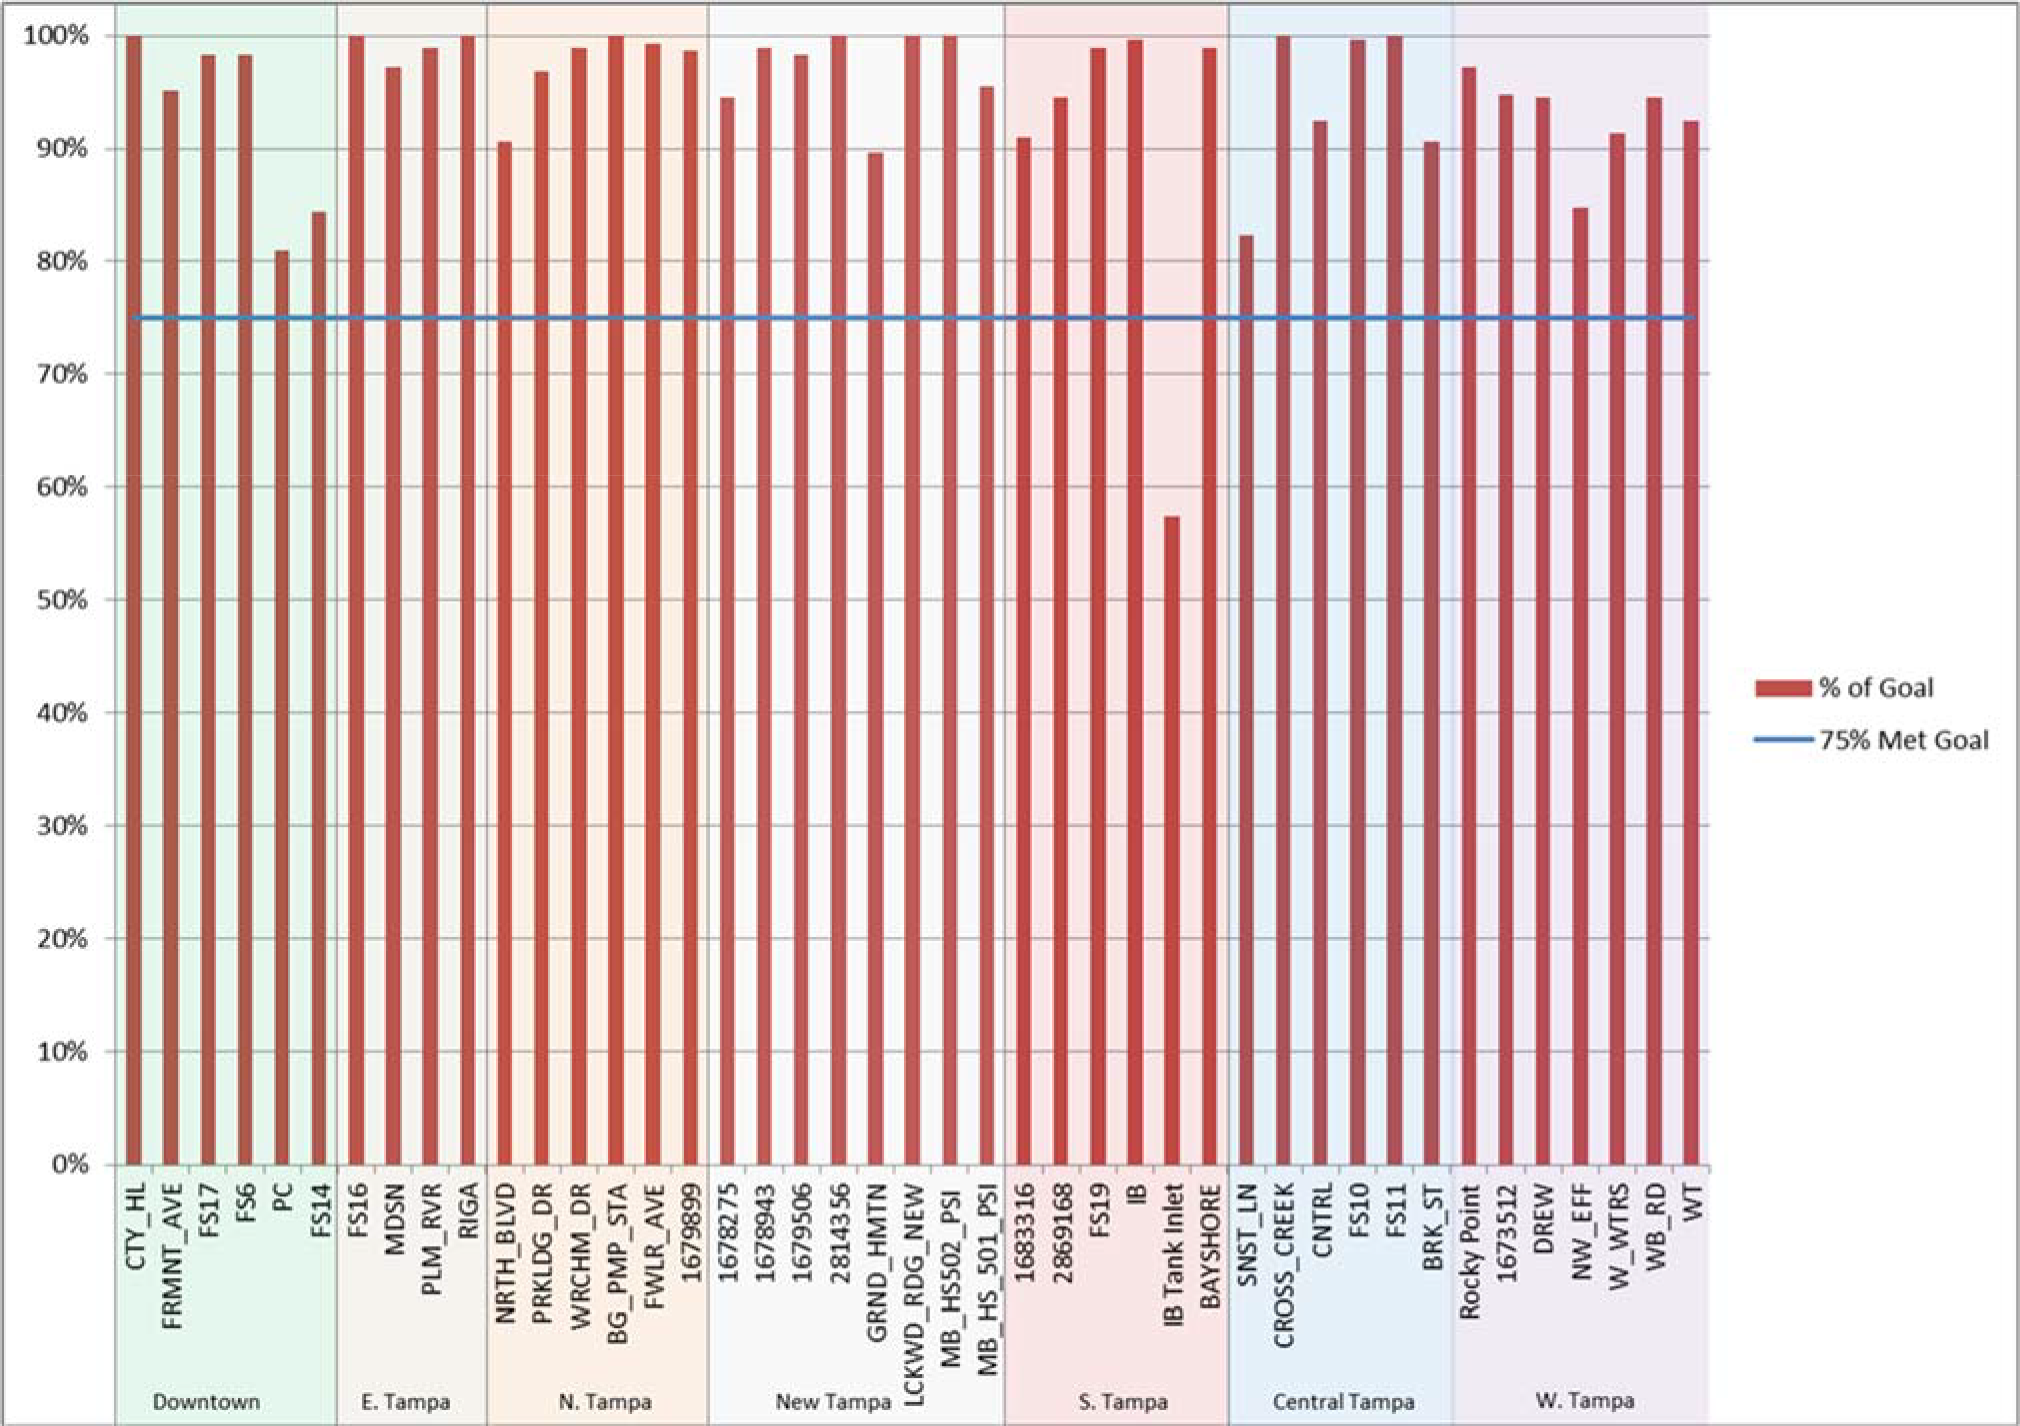
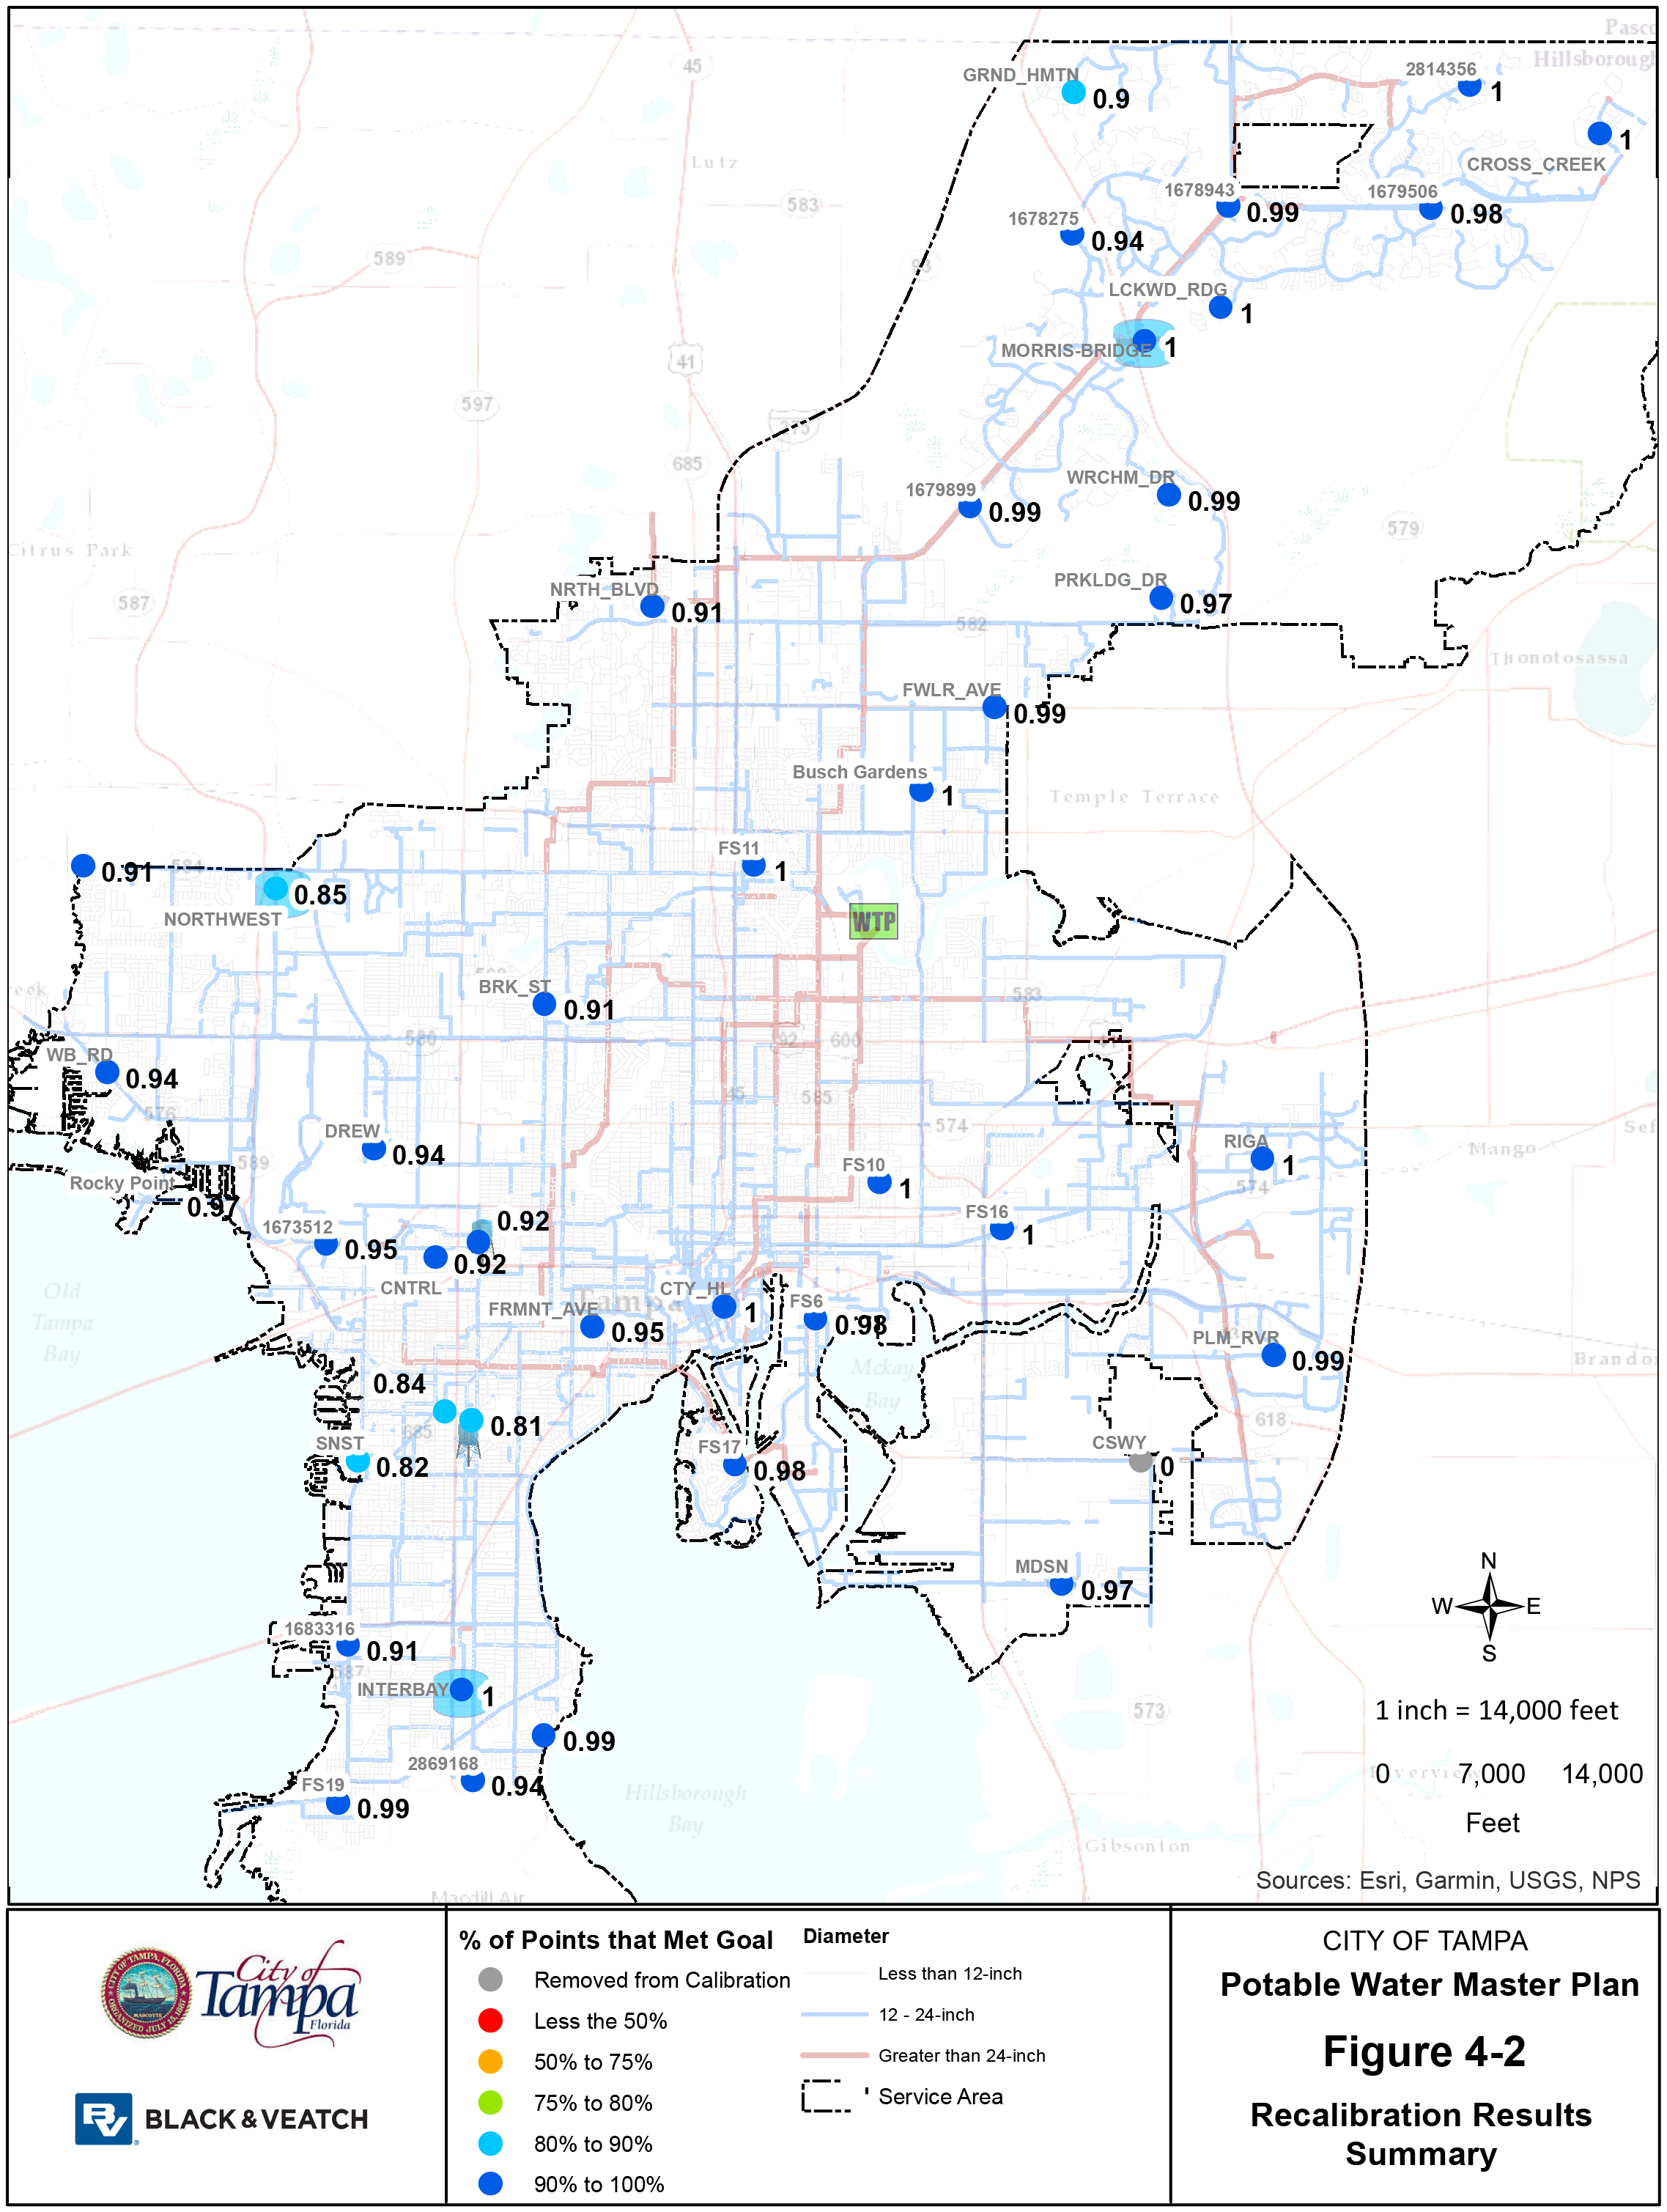
1 1 1 1 1 1 1 1 0 1 1 1 0.9 0.99 0.92 0.97 0.82 0.94 0.99 0.92 0.91 0.91 0.85 0.99 0.97 0.99 0.97 0.98 0.98 0.91 0.94 0.95 0.81 0.84 0.94 0.99 0.94 0.98 0.99 0.99 0.95 0.91 2869168 1678275 1679506 2814356 1678943 1679899 1673512 1683316 FS6 SNST FS11 FS10 FS16 RIGA CSWY MDSN FS17 DREW FS19 CNTRL WB_RD BRK_ST CTY_HL PLM_RVR FWLR_AVE WRCHM_DR INTERBAY NRTH_BLVD NORTHWEST GRND_HMTN LCKWD_RDG PRKLDG_DR FRMNT_AVE Rocky Point CROSS_CREEK Busch Gardens MORRIS-BRIDGE Sources: Esri, Garmin, USGS, NPS / 1 inch = 14,000 feet 0 7,000 14,000 Feet % of Points that Met Goal Diameter Removed from Calibration Less than 12-inch Less the 50% 12 -24-inch 50% to 75% Greater than 24-inch Service Area 80% to 90% 90% to 100% 75% to 80% CITY OF TAMPA Potable Water Master Plan Figure 4-2 Recalibration Results Summary
5.0 Distribution System Assessment
Using the calibrated hydraulic model, Black & Veatch performed a comprehensive distribution system analysis. The analysis includes assessments of the system’s performance under a variety of scenarios including: MDD, PHD, Fire Flow (FF) and Asset Failures. These scenarios were run primarily for the base year (2015) and final future planning year (2035), with consideration of phasing of improvements for the two interims planning years (2020 and 2025). Scenarios were developed and analyzed based on the existing system configuration as well as a variety of proposed configurations. However, only the performances of the existing system scenarios are presented here.
The system analysis evaluates the adequacy of the existing distribution system and highlights areas requiring improvements (presented in Section 6) to meet the system performance criteria established by the TWD. The results of the distribution system assessment are summarized in the remainder of this section of the report. Additional details regarding the assessment of the distribution system are also provided in Appendix D, Distribution System Assessment Technical Memorandum.
5.1 PERFORMANCE CRITERIA
Black & Veatch worked with the TWD to establish the desired system performance criteria, which were used as the basis for determining if improvements are needed to meet the projected increases in system demands over the planning horizon. The criteria are based on various water system design guidelines and consider references such as existing and proposed regulations (e.g. FDEP regulations). Table 5‐1 summarizes the performance criteria on which the system was evaluated.
5.2 DISTRIBUTION SYSTEM ASSESSMENT RESULTS
Black & Veatch analyzed the existing distribution system for the purpose of identifying system capacity, operational, resiliency, and reliability needs across various planning years. More than twenty‐five scenarios were selected to analyze the existing and planned distribution systems. Discussions of the analysis approach, observations and conclusions of the system analysis are presented in the following sub‐sections.
5.2.1 Pumping Facilities
The capacities of the pumping facilities were analyzed using an Excel‐based desktop model for each planning year to evaluate the adequacy of the existing facilities and to identify any deficiencies in capacity based on regulations and the performance criteria. The results of the desktop pumping facilities capacity analyses are presented in Table 5‐2.
Table 5‐1: Distribution System Performance Criteria
| Parameter | Criteria / Description | Performance Goal | Comments |
|---|---|---|---|
| 1. Demand Peaking Factor | MDD: ADD | 95th confidence interval (only exceeded 1 year out of 20 years) [B&V] | ‐ Ratio to be calculated based on actual system data from 2004 ‐ 2015. th ‐ PHD: MDD data is not available for the period and will be based on 95 Percentile of 5 years (2011‐2015) |
| # Years of Historic Data | 12 | ‐ 12 years were selected to include the last drought conditions in 2007. | |
| 2. Pump Station Capacity | Supply + Remote Pump Stations (w/out elevated storage) | Firm Capacity > PHD + Fire Flow (per service area) [F.A.C 62‐555.320(15)(a)] | ‐ Firm Capacity > PHD + Fire Demand, unless elevated finished drinking water storage is provided [F.A.C. 62‐555.320 (15)(a)] ‐ Firm Capacity + useful elevated storage capacity > greater of PHD for 4 hours or MDD+FF [F.A.C 62‐555.320(15)(b)] ‐ Firm capacity per pressure zone is the capacity with the largest pump out of service per pressure zone. • North Tampa Zone, South Tampa (Interbay) and DLT Zone |
| Supply + Remote Pump Stations (w/elevated storage) | Firm Capacity > MDD + Fire Flow (per service area) [F.A.C 62‐555.320(16)(b)] | ‐ Existing Elevated tanks cannot be counted for F.A.C 62‐555.320(15)(a) as they do not float on the system. ‐ If elevated tank improvements were made to allow the tanks to float on the system, the criterion may be reduced to meet F.A.C. 62‐555.320(15)(b). This can be evaluated as a potential improvement option. | |
| 3. Storage Volume | Total Storage (per pressure zone) | > 25% of the System’s MDD + Fire Flow (Reserve) [F.A.C. 62‐555.320 (19)(a)] | ‐ Unless a demonstration showing that the useful finished water storage capacity (minus fire protection) is sufficient for operational equalization [F.A.C. 62‐555.320(19)(b)1] ‐ Unless a demonstration showing that the water system’s total useful finished water storage capacity (minus fire protection) is sufficient to meet the water systems PHD for 4 consecutive hours [F.A.C. 62‐555.320(19)(b)2] ‐ Equalization storage should be 15‐20% of max daily use. [Lindeburg] ‐ Per discussion with the City, total storage does not include additional emergency storage due to existing WQ concerns. |
| Fire Reserve | 3,500 gpm for 3 hours (per service area) | ‐ Minimum fire flow = 1,000 gpm for 1 hour [Florida Fire Code, Table 18.4.5.1.2] ‐ Fire Flow between 1,500 gpm & 2,750 gpm = a duration of 2 hours; 3,000 & 3,750 gpm = a duration of 3 hours [Florida Fire Code] | |
| 4. Pressure | Minimum Pressure – Peak hour demand conditions. (Non‐Fire, Non‐Emergency) | > 50 psi Transmission > 40 psi Distribution > 25 psi Metered Discharge [TWD Tech Manual, 3.2.A.2] | ‐ > 20 psi [F.A.C. 62‐555.320 (15)(b)] ‐ Minimum pressure at the tap should be 25 psi. Minimum pressures at fire hydrants should be 60 psi, possibly higher in commercial and industrial districts [Lindeburg] ‐ Metered discharge pressure is on the private side of the customer meter and is not represented in the model |
| Maximum Pressure | < 75 psi | ‐ Florida 2010 Plumbing Code requires a service line PRV if the pressures within the building exceeds 80 psi. | |
| 5. Fire Flow | System Demand/Supply | MDD | ‐ If fire protection is being provided the design capacity should be fire flow plus maximum day demand. MDD+FF [F.A.C. 62‐555.320(15)(a)] ‐ PHD+FF was not selected due to existing WQ concerns which would increase with oversized water mains. |
| Minimum Flow | 1,000 gpm (residential) 3,500 gpm for 3 hours (commercial & Industrial) [exceeds TWD Tech Manual, 3.2.A.3.c] | ‐ Residential fire flow can be reduced to 500 gpm if building has automatic sprinkler systems and greater than 30ft separation between buildings [18.4.5.1.23, Florida Fire Code] ‐ 1,000 gpm for 1 hour (residential) & 3,000 gpm for 3 hours (commercial & industrial) [TWD Tech Manual, 3.2.A.3.c] | |
| Maximum Flow | 3,500gpm for 3 hours [ISO & AWWA M31] | The maximum flow is the maximum fire flow required from the TWD system. For system customers with fire flow requirements greater than what can be provided by the TWD system, it is assumed that those customers will construct private fire protection systems as needed to meet their own fire service needs. | |
| Minimum Residual Pressure | > 25 psi [TWD Tech Manual, 3.2] | Minimum residual pressures = 20 psi. [F.A.C. 62‐555.320 (15)(a)] | |
| 6. Pipe Capacity | Maximum Velocity | < 5 ft./sec at peak hour demands (normal, non‐fire conditions) < 10 ft./sec at MDD+FF demands [TWD Tech Manual, 3.2] | ‐ This parameter is used to identify pipes that may be contributing to pressure and/or flow deficiencies. ‐ Considered a secondary criterion to trigger consideration for improvement, but not automatically triggering an improvement |
| 7. Headloss Gradient | Maximum Head loss (HL) per 1,000 Feet | < 3ft (Mains >=16‐inch diameter) < 5ft (Mains <16‐inch diameter) | ‐ This parameter is used to identify pipes that may be contributing to pressure and/or flow deficiencies. ‐ Considered a secondary criterion to trigger consideration for improvement, but not automatically triggering an improvement |
Table 5‐2: Pump Station Regulatory Capacity Assessment
| PRESSURE ZONE | PUMPING FACILITY | CAPACITY | PERFORMANCE CRITERIA (MGD) PHD + Fire Flow(4)(5) | MEETS CRITERIA (Y/N) | DEFICIENT CAPACITY (MGD) | YEAR IMPROVEMENT REQUIRED | |||||||
|---|---|---|---|---|---|---|---|---|---|---|---|---|---|
| MAX (MGD) | M. FIRM CAPACITY (MGD) | 2015 | 2020 | 2025 | 2035 | 2015 | 2020 | 2025 | 2035 | ||||
| New Tampa(1) | Morris Bridge RPS Pumps #1‐4 | 102 | 66.0 | 15.6 | 18.6 | 20.4 | 23.5 | Y | Y | Y | Y | N/A | N/A |
| South Tampa | Interbay RPS(2) | 28 | 15.0 | 16.8 | 17.9 | 18.2 | 18.7 | N | N | N | N | 3.7 | 2015 |
| DLTWTF(3) | DLTWTF Total | 198.5 | 160.2 | 137.8 | 163.8 | 170.9 | 185.2 | Y | N | N | N | 25.0 | 2020 |
| High Service | 164 | 134 | 137.8 | 163.8 | 170.9 | 185.2 | Y | N | N | N | 25.0 | 2020 | |
| Northwest | 15 | 12 | 137.8 | 163.8 | 170.9 | 185.2 | Y | N | N | N | 25.0 | 2020 | |
| West Tampa | 10 | 7 | 137.8 | 163.8 | 170.9 | 185.2 | Y | N | N | N | 25.0 | 2020 | |
| Palma Ceia | 9 | 7 | 137.8 | 163.8 | 170.9 | 185.2 | Y | N | N | N | 25.0 | 2020 | |
- 1. Total Firm Capacity 62 MGD; Pumps #1 4 and Pumps #5&6 cannot operate at the same time and the firm capacity of Pumps #1 4 48 MGD. Pumps #1 4 are required to meet regulations
- 2. Interbay firm capacity exclude the two small jockey pumps due to pump station configuration
- 3. DLTWTF firm capacity is based upon the largest pump at the DLTWTF being out of service. The remainder of the pumps within this pressure zone ar operational.
- 4. The demand on the DLTWTF inlcudes the MDD of North Tampa and South Tampa due to the constant filling of the tanks
- 5. PHD + Fire Flow for each Plan Year is the PHD in MGD plus the Fire Flow of 3,500 gpm converted to MGD or 5.0 MGD
The Morris Bridge RPS, which supplies the North Tampa pressure zone, currently has 66 MGD of firm capacity. This capacity is well in excess of the PHD plus FF of the North Tampa pressure zone.
The Interbay RPS, which supplies the South Tampa pressure zone, currently has 15 MGD of firm capacity. This capacity is deficient under the 2015 planning year scenario by nearly 2 MGD and the deficiency increases to nearly 4 MGD in the 2035 planning year. Additional pump capacity or other augmentations to the South Tampa pressure zone are required to meet the pumping capacity criteria.
The DLTWTF pressure zone is served by four pump stations. The primary source of pumping capacity is the DLTWTF HSPS (HSPS). The HSPS is supplemented by the Northwest, West Tampa and Palma Ceia RPSs located throughout the distribution system. The combined firm pumping capacity of these facilities is 160.2 MGD. This capacity meets criteria under the 2015 planning year but is deficient from 2020 through the remainder of the planning horizon. The pumping capacity deficiency for the DLTWTF pressure zone reaches as high as 25 MGD by 2035 under the static capacity analysis. However, the EPS hydraulic model analysis showed that in order to supply the system under PHD conditions, flow from the DLTWTF HSPS could reached as high as 175 MGD without changes to the operating scheme for the RPSs. The existing firm capacity of the HSPS is 134 MGD, resulting in a capacity deficiency of 41 MGD by 2035 if no other improvements are made. The TWD currently has plans to expand the DLTWTF to a firm capacity of 153 MGD. However, the hydraulic modeling analysis of future system conditions indicates that an expansion of the HSPS to a firm capacity of 153 MGD alone will not be sufficient to address the pumping capacity requirements projected through year 2035. Additional HSPS pumping capacity and other potential improvements to the DLTWTF pressure zone were evaluated and are described in Section 6 of this report.
5.2.2 Potable Water Storage
The capacities of the storage facilities were analyzed using an Excel‐based desktop model for each planning year to evaluate the adequacy of the existing facilities and to identify any deficiencies in capacity based on the performance criteria. The results of the initial storage facilities capacity analyses are presented in Table 5‐3.
Table 5‐3: Potable Water Storage Regulatory Capacity Assessment
| PRESSURE ZONE | STORAGE FACILITY | TOTAL VOLUME (MG) | EFFECTIVE VOLUME (MG) | 2015 Minimum Storage Volume (MG) 25% of MDD + Fire Reserve(1) | 2020 Minimum Storage Volume (MG) 25% of MDD + Fire Reserve(1) | 2025 Minimum Storage Volume (MG) 25% of MDD + Fire Reserve(1) | 2035 Minimum Storage Volume (MG) 25% of MDD + Fire Reserve(1) | 2015 MEETS CRITERIA (Y/N) | 2020 MEETS CRITERIA (Y/N) | 2025 MEETS CRITERIA (Y/N) | 2035 MEETS CRITERIA (Y/N) | DEFICIENT VOLUME (MG) | YEAR IMPROVEMENT REQUIRED |
|---|---|---|---|---|---|---|---|---|---|---|---|---|---|
| New Tampa | Morris Bridge RPS | 10.0 | 7.5 | 2.5 | 3.0 | 3.3 | 3.9 | Y | Y | Y | Y | N/A | N/A |
| South Tampa | Interbay RPS | 5.0 | 5.0 | 2.4 | 2.6 | 2.7 | 2.7 | Y | Y | Y | Y | N/A | N/A |
| DLTWTF | DLTWTF Total | 26.0 | 18.5 | 23.9 | 26.4 | 27.4 | 29.6 | No per FAC 62‐555.320(19)(a). See detailed storage analysis for further explantion of minimum criteria. | 11.1 | 2016 | |||
| DLTWTF | Clearwell | 20.0 | 12.5 | ||||||||||
| DLTWTF | Northwest | 3.0 | 3.0 | ||||||||||
| DLTWTF | West Tampa | 1.5 | 1.5 | ||||||||||
| DLTWTF | Palma Ceia | 1.5 | 1.5 | ||||||||||
| DLTWTF | Deficient Storage without considering the Morris Bridge excess volume (MG) | 5.4 | 7.9 | 8.9 | 11.1 | ||||||||
| DLTWTF | Deficient Storage considering the Morris Bridge excess volume (MG) | 0.4 | 3.4 | 4.8 | 7.5 | ||||||||
| Note | 1. Fire Reserve storage required is 3500 gpm for 3 hours or 0.63 MG |
- The Morris Bridge RPS, which provides storage for the North Tampa pressure zone, currently has 7.5 million gallons (MG) of effective storage volume between two GSTs. This capacity is well in excess of the storage requirement for the North Tampa pressure zone, with approximately 3.6 MG of surplus capacity in 2035.
- The Interbay RPS, which provides storage for the South Tampa pressure zone, currently has 5 MG of effective storage volume provided by a single GST. This capacity is well in excess of the storage requirement for the South Tampa pressure zone, with approximately 2.3 MG of surplus capacity in 2035.
- The DLTWTF pressure zone effective storage volume is deficient under the 2015 planning year scenario by 5.4 MG and increases to 11.1 MG by 2035 based on FAC 62‐555.320(19)(a). However, a detailed storage analysis was completed in accordance with FAC 62‐555.320(19)(b)2 and it was determined that existing system storage can meet the minimum criteria under the 2035 PHD conditions for four consecutive hours with the DLTWTF HSPS peak flow at 140 MGD. A more detailed description of the analysis is provided in Appendix D; Distribution System Improvements Technical Memorandum.
5.2.3 Distribution System Capacity and Operation
The hydraulic capacity of the distribution system piping network was analyzed for each planning year based on the performance criteria. This analysis identifies undersized pipelines that may be impacting the system’s ability to deliver required flow or pressure under MDD conditions. The analysis showed that most of the distribution system maintains adequate minimum pressures during a MDD EPS simulation and does not significantly exceed maximum pressure criteria. The largest collection of low pressures in the system existed within the southern portion of the DLTWTF zone in the 2015 planning year. However, the modeling analysis predicts that the addition of the planned CIAC improvements will effectively address the low pressure issues in the southern portion of the DLTWTF zone. Additional locations of low pressures include the eastern boundary of
the service area near the University of South Florida (USF) and the western boundary of the service area north of the Northwest RPS. An assessment of these areas indicates that the ground elevations in these two areas are higher than other portions of the service area, and that distribution system pipe improvements are unlikely to sufficiently address the low pressure in these two areas. Table 5‐4 presents the results for compliance with the minimum and maximum pressure criteria at all model junctions for each planning year during a MDD scenario.
Table 5‐4: Percent of the System Meeting Pressure Criteria
| # | SCENARIO NAME | MINIMUM PRESSURES > 30 psi | MINIMUM PRESSURES > 40 psi | MINIMUM PRESSURES > 50 psi | MAX. PRESSURES > 75 psi | MAX. PRESSURES > 85 psi |
|---|---|---|---|---|---|---|
| 1 | Base MDD Analysis | 98.6% | 91.5% | 67.7% | 15.6% | 0.0% |
| 2 | 2020 MDD Analysis | 99.6% | 94.3% | 69.8% | 17.6% | 0.0% |
| 3 | 2025 MDD Analysis | 99.5% | 93.2% | 65.0% | 16.4% | 0.0% |
| 4 | 2035 MDD Analysis | 98.5% | 88.9% | 52.3% | 9.8% | 0.0% |
The system capacity analysis also reviewed pipe velocity and headloss results for each planning year. High velocities in pipelines can lead to high headlosses and lower system pressures. The performance criteria for velocity and headloss were established to help identify existing and potential causes of pressure problems throughout the system. The results of this assessment show that the large majority of the distribution system operates well within the performance criteria and that outside of the planned improvements, the system does not require significant distribution or transmission capacity improvements. Table 5‐5 presents the results for compliance with the maximum velocity and headloss criteria for all modeled pipes 4‐inches and larger for each planning year during a MDD scenario.
Table 5‐5: Percent of the System Meeting Velocity and Headloss Criteria
| # | Scenario Name | Max. Velocity < 5 fps | Max. Headloss1 < 3 ft / 1000ft | Max. Headloss1 < 5 ft / 1000ft |
|---|---|---|---|---|
| 1 | Base MDD Analysis | 99.8% | 97.2% | 95.2% |
| 2 | 2020 MDD Analysis | 99.7% | 97.7% | 96.0% |
| 3 | 2025 MDD Analysis | 99.8% | 97.2% | 95.7% |
| 4 | 2035 MDD Analysis | 99.7% | 95.7% | 94.7% |
| 1 <3 ft/1000 ft criteria applies to pipes >= 16 inch. <5 ft/1000 ft criteria applies to pipes <16 inch |
5.2.4 Fire Flow
In addition to meeting the MDD demands and pressures, the water distribution system must also be able to provide large volumes of water in a concentrated area during a fire event, while still maintaining minimum pressure requirements throughout the distribution system. This is known as fire flow (FF) demand. The amount of fire flow required varies based on the Florida Fire Code guidelines, which consider the structure’s size, use, and building materials. The fire flow analysis used MDD plus FF of 1,000 gpm for residential areas and 3,500 gpm for commercial areas while maintaining a minimum residual pressure of 25 psi in the system. Table 5‐6 summarizes the extent
of the distribution system that met the fire flow goals for water mains 6‐inches and larger. The City has a program to replace 2‐inch diameter pipes, which should continue to be administered to provide improved fire flow supply coverage.
Table 5‐6: Percent of the System Meeting Fire Flow Goals
| # | SCENARIO NAME | RESIDENTIAL (1,000 GPM) | COMMERCIAL / INDUSTRAL (3,500 GPM) |
|---|---|---|---|
| 1 | Base MDD+FF Analysis | 95% | 61% |
| 2 | 2020 MDD+FF Analysis | 97% | 62% |
| 3 | 2025 MDD+FF Analysis | 91% | 51% |
| 4 | 2035 MDD+FF Analysis | 87% | 50% |
| NOTE: increased coverage is due to the addition of the planned CIAC & KBar pipelines. | |||
There are some residential fire flow deficiencies which exist sporadically throughout the system, and a variety of improvements discussed in Section 6 were identified to provide complete residential fire flow coverage. However, to be sensitive not to oversize the distribution system piping and avoid increasing water age within the system, Black & Veatch recommends that a separate analysis of the required commercial fire flow be conducted and commercial fire flow corridors be identified before significant fire flow improvements are planned.
5.2.5 Water Age
A water age analysis for the base year (2015) was performed as part of the distribution system analyses to set a baseline for comparing water ages in future year analyses. Generally, the model results show that the water age of the system is less than 5 days with small pockets around the tanks that have ages up to 10 days. Additionally, the water age in each of the small pressure zones is in the 5 to 10‐day range. This is attributed to all of the supply to these small zones going through the ground storage tanks. Additional information related to water age is available in Appendix B, Distribution System Improvements Technical Memorandum.
5.2.6 Resilience and Redundancy
Several scenarios exploring the system’s redundancy and resilience to key asset was to failures were also analyzed. The assets reviewed included the DLTWTF HSPS, all of the RPSs, and critical transmission pipelines. The results showed that, in general, the system has a good level of resiliency, with most key facilities covered by some or complete redundancy. A summary of the results of the resilience analyses are presented below.
- The DLTWTF and HSPS are the most critical facilities to the operation of the entire potable water system. If the DLTWTF or HSPS are out of service, the system currently has a maximum of 70 MGD of alternate supply capacity available via regular and emergency interconnects with Tampa Bay Water, and 31 MG of effective storage. In simulations of scenarios where the DLTWTF is out of service, reservoirs quickly empty and portions of the system do not have access to supply. To provide the system with sufficient redundancy to accommodate an outage at the DLTWTF and/or
HSPS, additional storage and/or pumping capacity, as well as emergency water supply sources, would need to be established.
- The Morris Bridge RPS is the primary source of supply for the North Tampa pressure zone and with the modifications currently under construction, the facility will have complete redundancy during normal operations (and when the TWD is not purchasing water from TBW). The current improvements being implemented at the Morris Bridge RPS include a bypass around the GSTs that will allow the TBW interconnect to discharge to the North Tampa pressure zone. The improvements will also allow for the two sets of pumps at the Morris Bridge RPS to discharge into the North Tampa pressure zone and the DLTWTF zone concurrently.
- The Northwest, West Tampa and Palma Ceia RPSs are currently redundant to each other. However, as the water demands continue to increase in the future, each station becomes more critical and the level of redundancy decreases.
- The Interbay RPS is the primary source of supply for the South Tampa pressure zone and is currently considered to have complete redundancy, although the redundancy provided requires some system changes and would not occur instantaneously. In the event of a failure of the Interbay RPS, the zone boundary can be opened as the DLTWTF pressure zone has adequate pressures and supply capacity to feed the zone. Some improvements in the distribution system at the pressure zone boundary could be made to make the backup supply provided by the DLTWTF pressure zone occur instantaneously upon a loss of the Interbay RPS.
- The 48/54‐inch transmission main located primarily along Bruce B Downs Blvd., which supplies water from the DLTWTF pressure zone to the Morris Bridge RPS, is the only major transmission main supplying water to the Morris Bridge RPS and North Tampa. Redundancy for a failure of this pipeline is provided via the TBW Morris Bridge WTP point of connection. Without the Morris Bridge WTP point of connection or this 48/54‐inch transmission main along Bruce B Downs Blvd., the water supply to the North Tampa pressure zone would be limited by a long network of 8‐inch and 16‐inch diameter pipelines between the DLTWTF and North Tampa pressure zones.
6.0 Distribution System Improvements
The assessment of the distribution system revealed that the system contains some deficiencies due to projected growth over the planning horizon. The distribution capacity improvements are divided into three categories: Operational Improvements, Capacity Improvements (which includes fire flow improvements), and Resilience / Redundancy Improvements.
6.1 OPERATIONAL IMPROVMENTS
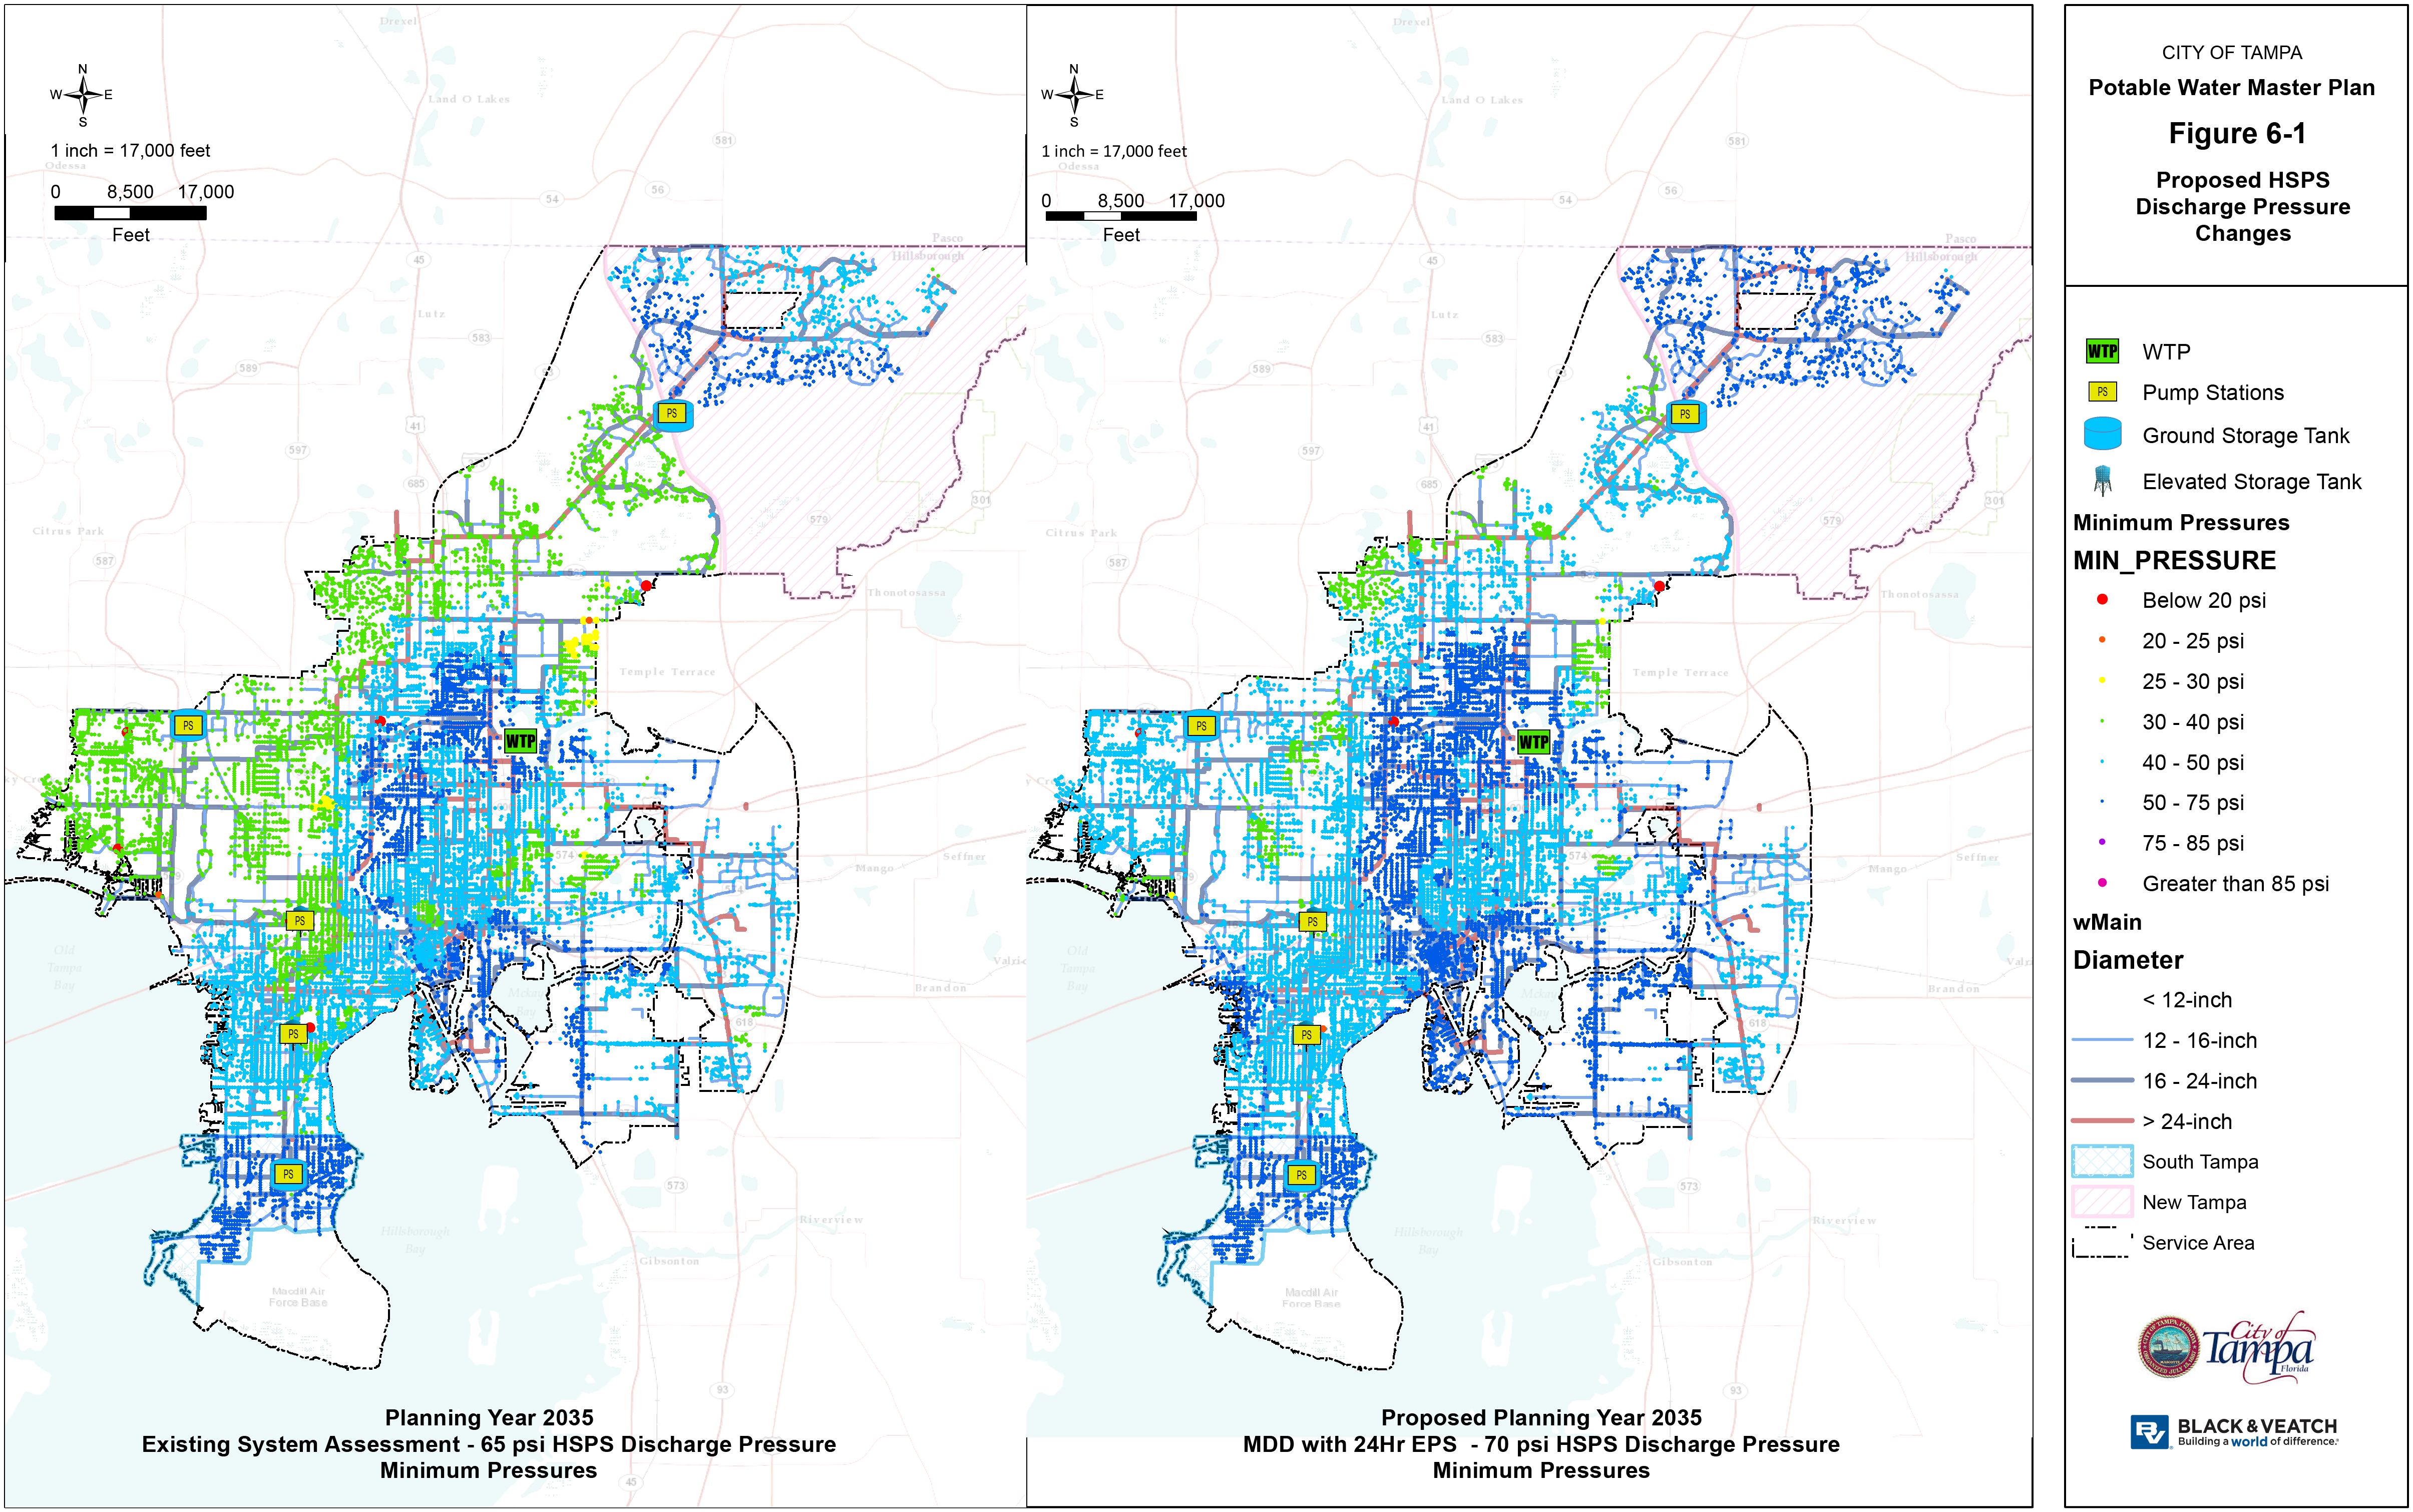
6.1.1 DLTWTF HSPS Discharge Pressure
The DLTWTF HSPS currently operates with a discharge pressure of 65 psi, which results in multiple areas within the DLTWTF pressure zone having a residual pressure below or just above the minimum pressure criteria of 40 psi. Increasing the HSPS discharge pressure would increase pressures throughout the zone and result in a much larger percentage of the zone meeting the TWD’s defined pressure criteria under all demand scenarios.
Increasing the HSPS discharge pressure by 5 psi brings the vast majority of the system pressures into compliance with the system pressure criteria under all demand scenarios. However, increasing the system pressures is not without risks. A 5‐psi increase in the distribution system pressures should be well within the original design pressure ratings of the piping throughout the system, however, the City’s system is aging, and increasing the system pressures by 5 psi could result in an increased frequency of pipe breaks. To minimize the potential risk for an increased amount of pipe breaks in the system, Black & Veatch recommends that any potential increases in system pressures are undertaken incrementally to allow the TWD to observe how the distribution system reacts to small increases in pressure. Minimum system pressures and conformance with minimum pressure criteria based on this change in operations is illustrated in Figure 6‐1 and described in more detail in Appendix B, Distribution System Improvements Technical Memorandum.
6.1.2 DLTWTF Pressure Zone Repump Station Controls
The system assessment identified that the DLTWTF HSPS capacity will be deficient within the short‐term planning horizon, and that previously planned capacity expansions from the current firm capacity of 134 MGD to 153 MGD will not be sufficient over the long‐term planning horizon (through 2035) without other pumping and storage improvements in the pressure zone. As part of the improvements development process, the entire DLTWTF zone was reviewed for its impact on demands on the HSPS. The current operating strategy for the system involves the HSPS maintaining a pressure set point and the discharge flowrate increasing or decreasing automatically to maintain the pressure set point as the demands in the pressure zone increase or decrease. The other RPSs in the DLTWTF pressure zone operate at full speed on their pump curves and do not automatically ramp up and down in speed in order to maintain a target pressure set‐point. This results in the HSPS experiencing a wide range of discharge flowrate conditions to meet the diurnal fluctuations in system demands. Additional review of the DLTWTF pressure zone indicates that the operating strategy for the Northwest, West Tampa, and Palma Ceia pump stations can be modified in the future to handle some of the diurnal demand fluctuations in the system to limit the amount of variance in the discharge flowrates from the HSPS, and reduce the maximum firm capacity needs for the DLTWTF HSPS.
CITY OF TAMPA Potable Water Master Plan - Figure 6-1
The TWD can use the Northwest, Palma Ceia, and West Tampa RPS’s to decrease the reliance on the DTWLTF HSPS to handle system peak hour demands by updating the operating and control strategies for these facilities. Black & Veatch recommends that the TWD implement a monitoring and controls system that will activate the RPS’s based on the output flow of the DLTWTF HSPS and/or local pressure settings. The recommended system would be automated and would activate the RPS’s to minimize the peak flow at the HSPS, as well as rotate which RPSs are being used to ensure even run time on pumps and cycling of the storage tanks.
Should the City not wish to install an automated system, a system that monitors the HSPS flow and provides operators with pre‐set indicators and a defined control strategy for operators to follow could be similarly effective. The modeling analysis indicates that modifying the RPS pump controls can reduce the required additional capacity of the DLTWTF HSPS for planning year 2035 by 13 MGD.
6.1.3 Distribution System Monitoring
For TWD operators and engineers to better understand system operations and to document and memorialize operational data, Black & Veatch recommends that the TWD install flow meters at the Palma Ceia and West Tamps RPSs. in addition, the TWD could perform field pump tests to generate accurate pump curves, document pump efficiencies and improve the understanding of pump flows at different tank levels and system pressure conditions.
Black & Veatch also recommends that power monitors be installed at all RPSs to begin the collection and monitoring of data on the power consumption and pump efficiencies at each facility.
6.2 CAPACITY IMPROVEMENTS
6.2.1 Pumping Capacity Improvements
As discussed in previous sections and presented in Appendix B, Distribution System Improvements Technical Memorandum, the DLTWTF and South Tampa pressure zones both require augmentations to the system to correct deficiencies in available pumping capacity.
Interbay Repump Station
The results indicate that the South Tampa pressure zone pumping capacity is currently deficient and additional pumping capacity, approximately 4 MGD, is required to provide 3,500 gpm for fire flow. There are two options available to remedy the deficient pumping capacity; 1) install an additional pump at the Interbay RPS with a capacity of 4 MGD; 2) Install check valves along the pressure zone boundary (Gandy Blvd.) to allow flow from the neighboring DLTWTF zone to supply the South Tampa pressure zone during low pressures and supplement the pump capacity in the event of reduced pressures from fire demands during a peak demand period. Black & Veatch recommends the second option of installing check valves along the pressure zone boundary to address fire flow and resilience concerns. The resilience impacts are discussed further in subsequent sections.
High Service Pump Station
Black & Veatch recommends that the planned DLTWTF HSPS expansion to a firm capacity of 140 MGD identified in the DL Tippin WTF Master plan be increased to 153 MGD. In addition, it is also recommended that the HSPS expansion design consider provisions to easily expand the firm capacity to the recommended 2035 firm capacity requirement of 167 MGD. This recommendation is one of several recommendations that alter and augment the operation of the DLTWTF pressure zone. An additional recommendation includes increasing the available storage in the DLTWTF pressure zone with elevated storage tanks, which will reduce the demand on the HSPS during peak demand periods. These recommendations are detailed later in this section. Should the recommended elevated storage tank improvements within the DLTWTF pressure zone not be implemented, the required capacity at the DLTWTF HSPS would increase. Details of the potential for additional required capacity are included in Appendix B, Distribution System Improvements Technical Memorandum.
6.2.2 Storage Capacity Improvements
Clearwell Storage
The DLTWTF was initially constructed in the 1920s and has been expanded over the years to accommodate the City’s growth. As such, there are currently five separate clearwell structures connected with piping, which supply eight pumps at three various locations that discharge into the distribution system. According to the 2017 David L. Tippin Water Treatment Facility Master Plan, the changes in design, system demands, and configuration have resulted in a clearwell and pump combination that only allow for 12.5 MG of the 20.0 MG storage capacity to be available without causing cavitation in a few of the pumps and potential buoyancy problems with the below grade clearwell tanks. In addition, the blending chamber which feeds the clearwell was designed for lower flows, and at high flows the chamber pressurizes and starts to leak into the filter gallery.
These issues, combined with the projected increase in HSPS flows described above (140 – 167 MGD), have led to a recommendation in the 2017 David L. Tippin Water Treatment Facility Master Plan to abandon the two oldest clearwell structures (2.0 and 0.5 MG tanks), the existing blending chamber, and pumps 1‐6; repurpose the existing 7.5 MG clearwell to be a blending chamber; construct a new 5.0 MG clearwell; and add pumping capacity to reach 140 MGD firm capacity to be completed before 2025. Based on the system analysis, additional storage capacity beyond the proposed new 5.0 MG clearwell should be considered as part of this proposed project.
Accounting for the proposed modifications to the existing clearwell structures, a new 13 MG tank would increase the total storage capacity of the DLTWTF pressure zone to 31.5 MG, exceeding the FAC requirements in 62‐555.320(19)(a) and allowing for 4.5 to 5 hours of supply capacity should the treatment system be out of service. Therefore, Black & Veatch recommends increasing the proposed additional storage at the DLTWTF site from 5.0 MG to 13.0 MG. NOTE: this accounts for the reduction in volume from the proposed demolition of the 2.0 and 0.5 MG clearwells.
Figure 6‐2 illustrates the potential location for the additional clearwell storage. Additional assessments should be completed to confirm appropriate locations, dimensions and features of the recommended clearwell capacity expansions.
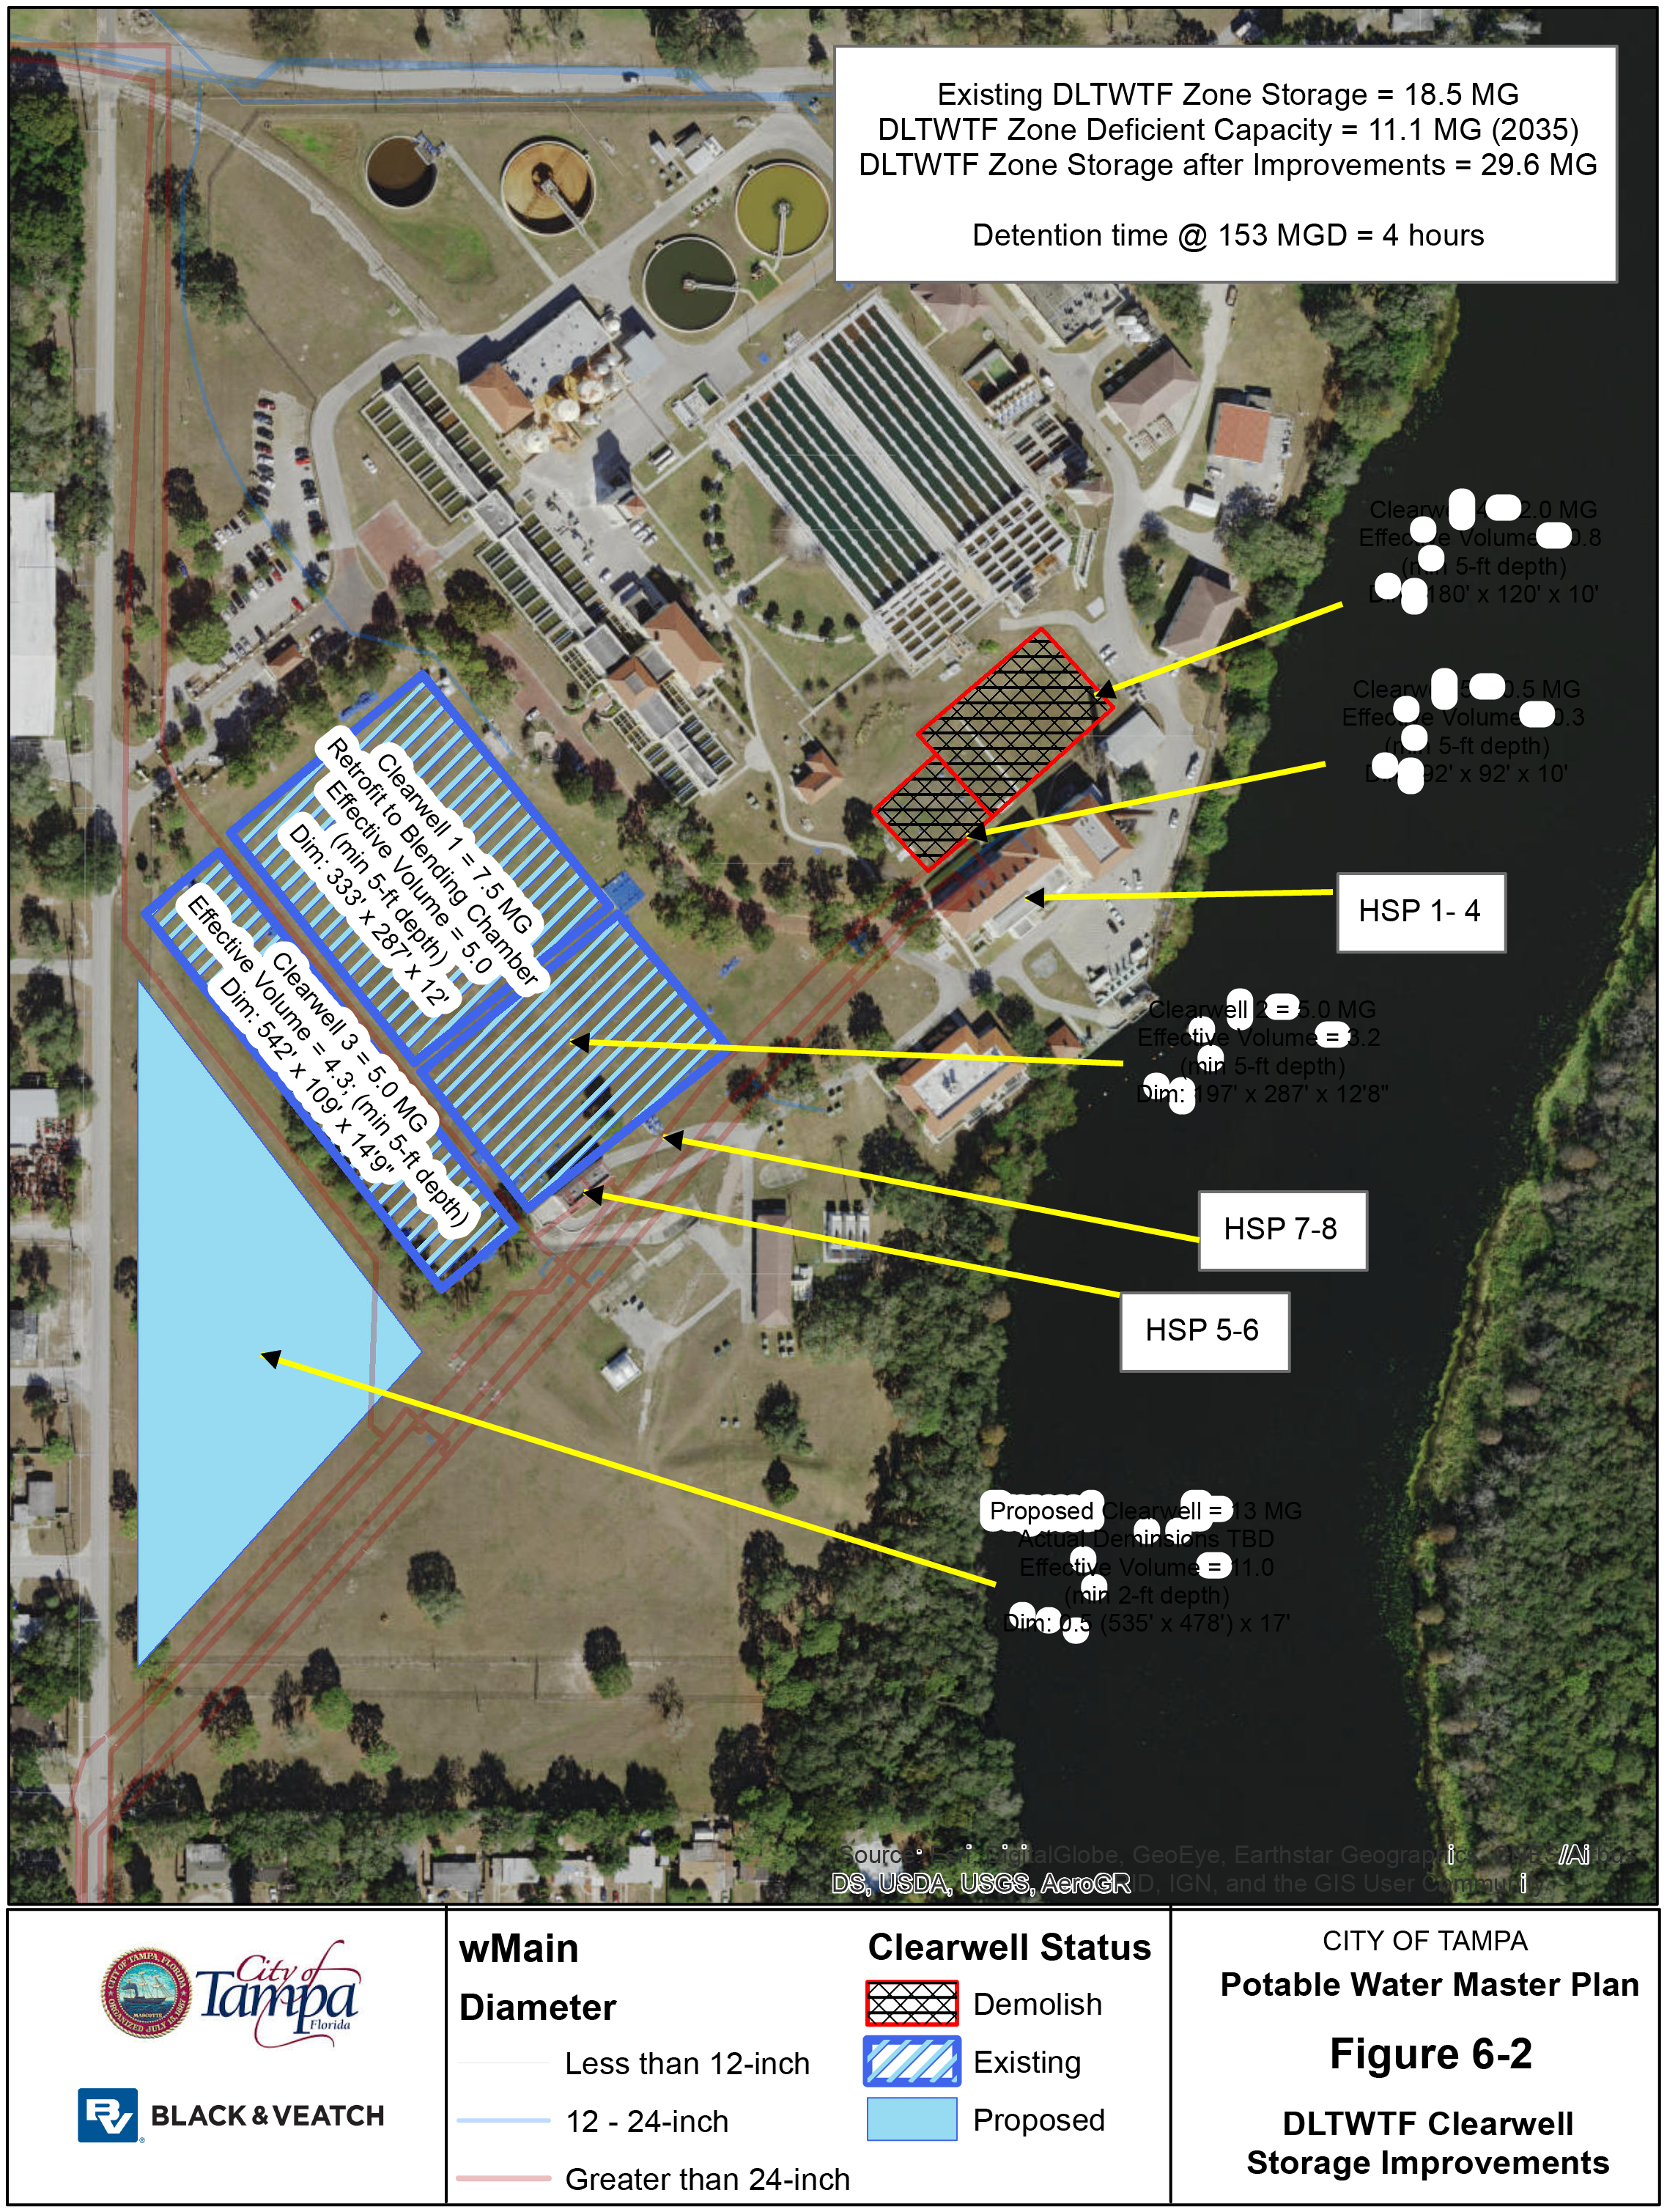
Black & Veatch also recommends beginning the collection of data related to the groundwater level on the site in anticipation of the design of a new clearwell structure and the current buoyancy issues that limit the drawdown levels and useable storage capacity of the existing clearwells.
Distribution System Storage
Black & Veatch also recommends that two new elevated storages tanks be added (Broadway; 2.0‐MG and Nebraska; 3.5‐MG) to improve system resiliency, which is discussed further in the section and in Appendix B, Distribution System Improvements Technical Memorandum. These tanks are not required based on State regulations, but they provide additional benefits of protecting the system from transient pressures, reducing the capacity requirements for the DLTWTF HSPS, and allowing the Northwest, West Tampa and Palma Ceia RPSs to be taken out of service for maintenance as demands increase in the future.
6.2.3 Water Main Capacity Improvements
The assessment of the distribution system revealed that the hydraulic capacity of the existing distribution system piping is predominantly satisfactory based on the demands projected through the planning year 2035. Transmission and distribution mains appear to be properly sized and well distributed throughout the system.
TPA and TIA Master Meters
Black & Veatch completed an investigation of the potential to install master meters at the Tampa Port Authority (TPA) and the Tampa International Airport (TIA) to isolate the onsite water mains and transfer ownership of those mains to the respective customers as described in Appendix E, TPA and TIA Master Meter Technical Memorandum. This is an effort to simplify maintenance of the water mains, which is complicated due to access restrictions at these locations. The investigation showed that the water mains in the TPA and TIA sites could be isolated from the system without significant impacts to the surrounding distribution system. Therefore, installation of the master meters is assumed to be installed as part of the system analysis and identification of improvements.
Water Main Capacity Improvements
Due to the overall strong performance of the distribution system based on the velocity and headloss criteria, the system assessment resulted in the identification of a limited number of improvements to address areas within the system exhibiting high headloss, some of which contribute to areas of low pressure. Table 6‐1 summarizes the improvements. These improvements are not impacted by the installation of additional storage within the DLTWTF zone and are independent of pipeline projects recommended later in this chapter to improve available fire flow within the distribution system. Refer to Appendix B for more detailed descriptions of each project.
Table 6‐1: Water Main Capacity Improvement Summary
| PROJECT ID | REPLACE / NEW | PROPSOED DIAMETER | LENGTH | PLAN YEAR PROPOSED | COMMENTS |
|---|---|---|---|---|---|
| CP003 | Replacement | 12‐inch 16‐inch |
1 mile 200 feet |
2020 | Reduces 2020 peak hour headloss gradient (headloss/1,000 ft.) in the pipelines from 5.4 to 1.3 |
| CP004 | New | 12‐inch | 1 mile | 2025 | >2.5 psi pressure increase |
| CP005 | New | 8‐inch 12‐inch |
800 feet 2 miles |
2035 | Reduces 2035 peak hour headloss gradient from 15.1 to 4.9 in 2035 |
6.2.4 Fire Flow Capacity Improvements
Thirty‐three fire flow improvements were identified to ensure that residential area fire flow requirements were met through the planning year 2035. An additional six fire flow improvements were identified to improve available fire flow conditions in commercial zones through the planning year 2035. Fire flow improvements are described in further detail in Appendix B, Distribution System Improvements Technical Memorandum.
As mentioned above, only pipelines 6‐inches and larger, which were not dead ends, were reviewed for available fire flow since hydrants are not installed on lines smaller than 6‐inches. The TWD distribution system contains a significant number of 2‐inch pipelines, which are incapable of delivering adequate fire flows. The TWD has a program in place to replace smaller diameter pipe, and it is recommended that the TWD continue to execute this program to provide residential fire flow to their entire service area.
Table 6‐2: Fire Flow Improvement Summary
| PROJECT ID | REPLACE / NEW | PROPSOED DIAMETER | LENGTH | FF INCREASE (GPM) | COMMENTS |
|---|---|---|---|---|---|
| FF0‐01 | Replacement | 12‐inch | 2,100 ft. | 2,500 | Increases FF from 1,100 to 3,500 gpm |
| FF0‐02 | Replacement | 12‐inch | 4,600 ft. | 1,100 | Increases FF from 1,200 to 2,300 gpm |
| FF0‐03 | Replacement | 8‐inch | 1,250 ft. | 640 | Increases FF from 600 to 1,240 gpm |
| FF0‐04 | Replacement | 12‐inch | 4,600 ft. | 330 | Increases FF from 670 to 1,000 gpm |
| FF0‐05 | New | 12‐inch | 1,200 ft. | 1,140 | Increases FF from 1,400 to 2,540 gpm |
| FF0‐06 | Replacement | 16‐inch | 1 mile | 1,250 | Increases FF from 1,900 to 2,750 gpm |
| FF0‐07 | Replacement | 12‐inch | 3,300 ft. | 450 | Increases FF from 800 to 1,250 gpm |
| FF0‐08 | Replacement | 8‐inch | 800 ft. | 400 | Increases FF from 810 to 1,210 gpm |
| FF0‐09 | Replacement | 12‐inch | 1,400 ft. | 330 | Increases FF from 800 to 1,130 gpm |
| FF0‐10 | New | 12‐inch | 1,100 ft. | 830 | Increases FF from 860 to 1,690 gpm |
| FF0‐11 | Replacement | 8‐inch | 800 ft. | 480 | Increases FF from 870 to 1,350 gpm |
| FF0‐12 | Replacement | 8‐inch | 800 ft. | 580 | Increases FF from 910 to 1,490 gpm |
| FF0‐13 | Replacement | 12‐inch | 900 ft. | 220 | Increases FF from 780 to 1,000 gpm |
| FF0‐14 | Replacement | 8‐inch | 1,900 ft. | 890 | Increases FF from 920 to 1,810 gpm |
| FF0‐15 | Replacement | 12‐inch | 2,800 ft. | 630 | Increases FF from 920 to 1,550 gpm |
| FF0‐16 | Replacement | 12‐inch | 600 ft. | 270 | Increases FF from 980 to 1,150 gpm |
| FF1‐00 | New | 8‐inch | 50 ft. | 2,070 | Increases FF from 380 to 2,450 gpm |
| FF1‐01 | New | 16‐inch | 120 ft. | 510 | Increases FF from 690 to 1,200 gpm |
| FF1‐02 | New | 12‐inch | 10 ft. | 4,170 | Increases FF from 1,030 to 5,200 gpm |
| FF1‐03 | New | 16‐inch | 10 ft. | 1,430 | Increases FF from 1,100 to 2,530 gpm |
| FF1‐04 | New | 6‐inch | 10 ft. | 2,900 | Connect 6‐inch dead ends for improvement of neighborhood FF |
| FF1‐05 | New | 8‐inch | 20 ft. | 590 | Increases FF from 930 to 1,510 gpm |
| FF1‐06 | New | 20‐inch | 60 ft. | 250 | Connect 20‐inch and 16‐inch dead ends for improvement of neighborhood FF |
| FF1‐07 | New | 6‐inch | 10 ft. | 1,600 | Connect 6‐inch dead ends for improvement of neighborhood FF |
| FF2‐00 | Replacement | 12‐inch | 600 ft. | 3,780 | Increases FF from 90 to 3,870 gpm |
| FF2‐01 | Replacement | 8‐inch | 2,500 ft. | 2,360 | Increases FF from 120 to 2,480 gpm |
| FF2‐02 | Replacement | 8‐inch | 1,000 ft. | 1,510 | Increases FF from 380 to 1,890 gpm |
| FF2‐03 | Replacement | 8‐inch | 300 ft. | 4,190 | Increases FF from 430 to 4,620 gpm |
| FF2‐04 | Replacement | 8‐inch | 50 ft. | 2,280 | Increases FF from 420 to 2,700 gpm |
| FF2‐05 | Replacement | 6‐inch | 2,200 ft. | 1,750 | Increases FF from 410 to 2,160 gpm |
| FF2‐06 | Replacement | 12‐inch | 20 ft. | 3,110 | Increases FF from 500 to 3,610 gpm |
| FF2‐07 | Replacement | 8‐inch | 20 ft. | 1,450 | Increases FF from 480 to 1,930 gpm |
| FF2‐08 | Replacement | 8‐inch | 2,300 ft. | 3,940 | Increases FF from 640 to 4,580 gpm |
| FF2‐09 | Replacement | 8‐inch | 1,100 ft. | 4,350 | Increases FF from 550 to 4,900 gpm |
| FF2‐91 | Replacement | 6‐inch | 700 ft. | 770 | Increases FF from 980 to 1,750 gpm |
| ‐ General (FF0 ##) projects to increase available fire flow resulting from long dead ends, under sized or limited transmission capacity, or a long distance from existing transmission capacity | |||||
| ‐ Disconnects / New Connections (FF1 ##) projects to increase available fire flow, primarily on dead end pipelines, by connecting to nearby pipes, and/or increasing looping in the direct vicinity of the project. | |||||
| ‐ Pipe Size Flow Restrictions (FF2 ##) projects to increase available fire flow caused by connections to or being in the immediate proximity of 2 inch and 3 inch diameter pipe within the distribution network | |||||
6.3 RESILIENCE AND REDUNDANCY IMPROVEMENTS
Resilience is the capacity to recover quickly from a negative event. In the case of water utilities, a negative event can come in many forms due to both acute shocks and chronic stresses from anything from security threats to storm surges from hurricanes to power outages.
Resilience needs were assessed from the acute shock perspective of losing one of the TWD major facilities. Several scenarios were analyzed to determine if the distribution system has sufficient
redundancy to be resilient to single asset failures within the distribution system and the results of those analyses are presented in assessment section of this report. The proposed improvements are presented below and discussed in more detail in Appendix B, Distribution System Improvements Technical Memorandum. Improvements were identified with the goal of creating complete redundancy for each facility as well as ensuring the system was resilient to each failure by being able to maintain the ability to meet system performance criteria.
6.3.1 Interbay RPS
The Interbay RPS is the sole source of water for the South Tampa pressure zone, however, that is a recent development due to the closing of several valves along the Gandy Blvd. to create a pressure zone boundary. Should the Interbay RPS experience an unexpected outage, those same valves could be opened and the zone could be absorbed into the DLTWTF zone and supplied by the DLTWTF and other RPSs. To make that transition process much quicker and less manually intensive, Black & Veatch recommends installing check valves at select locations along the pressure zone boundary, which would automatically open if the pressures within the South Tampa pressure zone were less than the pressures within the DLTWTF zone along the boundary area. These valves could be equipped with sensors to alert the operations staff when they open. The TWD may also wish to include features that would provide the ability to bypass and isolate the check valves to provide increased operational flexibility.
6.3.2 Morris Bridge RPS and 54‐inch Transmission Main
With the addition of the planned improvements at the Morris Bridge RPS and the TBW interconnect, the Morris Bridge RPS is now completely redundant, and no new improvements are recommended. If the RPS fails, the bypass for the TBW interconnect can then supply the North Tampa pressure zone with up to 40 MGD directly or the valves isolating the North Tampa zone can be opened and supplied by the DLTWTF zone.
Similarly, if the 48‐inch/54‐inch transmission main, which normally supplies flow to the Morris Bridge RPS, fails, the TBW interconnect can be activated and used to supply the pressure zone. Depending on where the break occurs, Pumps 1‐4 can also discharge south to absorb the portion of the DLTWTF zone isolated from supply.
If TWD did not want to rely upon the TBW interconnect to provide redundancy for the North Tampa pressure zone in the event of a failure of the 48‐inch/54‐inch transmission main or Morris Bridge RPS, Black & Veatch would recommend installing a new water main parallel to the 48‐inch/54‐inch water main that supplies the Morris Bridge RPS. This project has been included in the CIP and could be implemented to further improve the reliability of supply to the North Tampa pressure zone.
6.3.3 Northwest, West Tampa and Palma Ceia RPSs
The Northwest, West Tampa, and Palma Ceia RPSs have complete redundancy under the existing system demands. However, with the increased demands in 2035, the RPSs become more critical. Losing any of the three RPS’s during a MDD can result in the distribution system not meeting the City’s minimum system pressure criteria; however, the system remains in compliance with minimum regulatory pressures. Additional elevated storage or a new RPS would allow for complete
redundancy for 24‐hours for the West Tampa and Palma Ceia RPS’s and would increase the resiliency of the distribution system.
In addition to the new storage, one additional water main improvement project is needed to increase east‐west transmission capacity for complete redundancy of the Northwest RPS. The water main improvement project consists of a combined 7,900‐ft of 16‐inch and 20‐inch pipe along Hillsborough Ave.
6.3.4 DLTWTF High Service Pump Station
An event that results in the inability to operate the DLTWTF and associated HSPS would have the greatest negative impacts to the operation of the system. It is assumed that TWD would communicate with customers to request reduced water consumption during this type of scenario to keep demands to ADD conditions or less, rather than MDD. Based on this assumption and a 24‐hour DLTWTF failure scenario, the TWD could make the following system configuration changes:
- The TWD would activate all of the interconnections with neighboring utilities allowing for a supply of 70 MGD from Tampa Bay Water (40 MGD at Morris Bridge and 30 MGD at US301).
- Pumps 1‐4 at Morris Bridge would be activated to pump south into the DLTWTF pressure zone. This would provide around 40 MGD to the DLTWTF zone while the North Tampa zone relies on the storage volume of the two tanks.
- The supply to Interbay and Morris Bridge RPSs from the DLTWTF pressure zone would stop or be reduced to about 0.5 MGD based on 2035 ADD.
Under these conditions and without additional supply and/or storage in the DLTWTF zone, the system could meet the existing ADD for 24 hours, but would still need an additional 5.5 MGD by 2035. The additional supply can come in the form of additional storage or additional interconnections with neighboring utilities. Black & Veatch recommends a combination of additional storage, which will also increase redundancy of the RPSs, and an additional 6 MGD interconnect with Hillsborough County or Tampa Bay Water.
One such location could be with Hillsborough County just north of the Northwest RPS. The interconnection flow could discharge directly into the distribution system, if feasible based on the County’s operational pressures, or into the Northwest tank. Note that this option requires negotiations and cooperation with each utility.
6.4 IMPACTS TO WATER AGE
6.4.1 Impacts of Proposed Improvements on Water Age
Most of the proposed improvements have negligible impacts on water age, with the exception of the proposed Broadway EST. This improvement increases the water age in the southeast portion of the system to approximately 10 days, which is an increase of 5 days. The tank should be designed with a motorized isolation valve and pump to force turnover during low demand periods. The phasing of the tank should also coincide with increased demands throughout the DLTWTF zone and not be
constructed before the system conditions warrant it to avoid potential water age/water quality impacts.
6.5 SUMMARY OF RECOMMENDED IMPROVEMENTS
Table 6‐3 below summarizes the recommended and prioritized improvements for the distribution system and Figure 6‐3 illustrates their locations. Figure 6‐4 through Figure 6‐6 illustrate the pressures and velocities throughout the distribution system before and after improvements. The figures show an obvious increase in pressures across the system, a minor and almost unnoticeable increase in system velocities and a decrease in water age, except for the North Tampa Pressure zone where the two tanks at the MBRPS are now being used.
Table 6‐3: Recommended Improvements
| CIP # | PROJECT NAME | PROJECT DESCRIPTION | PROJECT TRIGGER | PROJECT TYPE | ANTICIPATED DESIGN YEAR |
|---|---|---|---|---|---|
| 1 | IB, NW and MB Tank Inlet Sleeve Valves | Installation of sleeve valves with flow control functions at the inlet to the Interbay, Northwest and Morris Bridge Tanks | Three Pressure Zone Configuration | Capital: Operational flexibility | 2019 |
| 2 | DLTWTF Discharge Pressure | Increase DLTWTF HSPS discharge pressure to 70 psi; slowly / incrementally | Min pressures | Operational / Controls | 2018 |
| 3 | RPS controls modifications | Modify the NWRPS, WTRPS and PCRPS to operate during peak demand periods rather than time of day | Increased reliance on DLTWTF HSPS | Operational / Controls | 2018 |
| 4 | DLTWTF Blending Chamber, Clearwell and HSPS Upgrades | Demo 2.0 MG and 0.5 MG clearwells, convert 7.5 MG clearwell to blending chamber, install new 13.0 MG clearwell, demo pumps 1‐6 and install new 153 MGD HSPS firm capacity | Sum of the MDDs for each pressure zone greater than 140 MGD | R&R and Expansion | 2020 |
| 5 | HSPS Expansion | Install additional pumping capacity at the new HSPS building total new capacity = 167 MGD firm capacity | DLTWTF Pressure Zone Demands greater than 153 MGD | Performance Criteria: Pump Capacity Expansion | 2030 |
| 6 | Northeast (Nebraska) EST | Installation of a new EST in the north portion of the DLTWTF | DLTWTF Pressure Zone PHD greater than 153 MGD | Resilience | 2025 |
| 7 | Southeast (Broadway) EST | Installation of a new EST in the north portion of the DLTWTF | DLTWTF Pressure Zone PHD greater than 160 MGD | Resilience | 2030 |
| 8 | Commercial Fire Flow Study | Perform an analysis of the required commercial fire flow needs be conducted and commercial fire flow corridors be identified | Fire Flow Demands | Study | 2018 |
| 9 | South Tampa Check Valves | Install check valves along South Tampa Pressure Zone (along Gandy Blvd) | Fire Flow Demands | Resilience | TBD |
| 10 | Hillsborough County Interconnect | Interconnect with Hillsborough County in the northwest portion of the system | DLTWTF Pressure Zone OHD greater than 167 MGD | Resilience | 2030 |
| ID | Project | Description | Related Program or Driver | Purpose | Target Year |
|---|---|---|---|---|---|
| 11 | West Tampa and Palma Ceia Flow Meters | Install flow monitors on the effluent side of the West Tampa and Palma Ceia RPS’s and connect to the data historian | Data Collection | Operational / Controls | 2018 |
| 12 | RPS Power Monitors | Install power monitors on all RPS equipment and connect to the data historian | Data Collection | Operational / Controls | 2018 |
| 13 | DLTWTF Clearwell Groundwater Level Study | Collection of data related to the groundwater level on the site in anticipation of the design of a new clearwell structure | DLTWTF Blending Chamber, Clearwell and HSPS Upgrade Project | Capacity | 2018 |
| 14 | Water Quality Model Calibration Study | Collect water quality data throughout the system in order to conduct a calibration of the existing water quality model | Water Quality | Study | 2018 |
| 15 | R‐01 Hillsborough Ave WM | 6,000‐ft of 12‐inch pipe along Hillsborough Ave. | DLTWTF Pressure Zone Demands greater than 125 MGD | Resilience | 2025 |
| 16 | CP003 | 12‐inch; 1 Mile 16‐inch; 200 feet |
System Pressures | Capacity | 2020 |
| 17 | CP004 | 12‐inch; 1 mile | System Pressures | Capacity | 2025 |
| 18 | CP005 | 8‐inch; 800 feet 12‐inch; 2 miles |
System Pressures | Capacity | 2035 |
| 19 | FF0‐01 | 12‐inch; 4,600 feet | Opportunistic | Fire Flow | 2018 |
| 20 | FF0‐02 | 8‐inch; 1,250 feet | Opportunistic | Fire Flow | 2018 |
| 21 | FF0‐03 | 12‐inch; 4,600 feet | Opportunistic | Fire Flow | 2018 |
| 22 | FF0‐04 | 12‐inch; 1,200 feet | Opportunistic | Fire Flow | 2018 |
| 23 | FF0‐05 | 16‐inch; 1 mile | Opportunistic | Fire Flow | 2018 |
| 24 | FF0‐06 | 12‐inch; 3,300 feet | Opportunistic | Fire Flow | 2018 |
| 25 | FF0‐07 | 8‐inch; 800 feet | Opportunistic | Fire Flow | 2018 |
| 26 | FF0‐08 | 12‐inch; 1,400 feet | Opportunistic | Fire Flow | 2018 |
| 27 | FF0‐09 | 12‐inch; 1,100 feet | Opportunistic | Fire Flow | 2018 |
| 28 | FF0‐10 | 8‐inch; 800 feet | Opportunistic | Fire Flow | 2018 |
| 29 | FF0‐11 | 8‐inch; 800 feet | Opportunistic | Fire Flow | 2018 |
| 30 | FF0‐12 | 12‐inch; 900 feet | Opportunistic | Fire Flow | 2018 |
| 31 | FF0‐13 | 8‐inch; 1,900 feet | Opportunistic | Fire Flow | 2018 |
| 32 | FF0‐14 | 12‐inch; 2,800 feet | Opportunistic | Fire Flow | 2018 |
| 33 | FF0‐15 | 12‐inch; 600 feet | Opportunistic | Fire Flow | 2018 |
| 34 | FF0‐16 | 8‐inch; 50 feet | Opportunistic | Fire Flow | 2018 |
| ID | Project | Pipe Size and Length | Implementation Type | Program | Year |
|---|---|---|---|---|---|
| 35 | FF1‐00 | 16‐inch; 120 feet | Opportunistic | Fire Flow | 2018 |
| 36 | FF1‐01 | 12‐inch; 10 feet | Opportunistic | Fire Flow | 2018 |
| 37 | FF1‐02 | 16‐inch; 10 feet | Opportunistic | Fire Flow | 2018 |
| 38 | FF1‐03 | 6‐inch; 10 feet | Opportunistic | Fire Flow | 2018 |
| 39 | FF1‐04 | 8‐inch; 20 feet | Opportunistic | Fire Flow | 2018 |
| 40 | FF1‐05 | 20‐inch; 60 feet | Opportunistic | Fire Flow | 2018 |
| 41 | FF1‐06 | 6‐inch; 10 feet | Opportunistic | Fire Flow | 2025 |
| 42 | FF1‐07 | 12‐inch; 600 feet | Opportunistic | Fire Flow | 2025 |
| 43 | FF2‐00 | 8‐inch; 2,500 feet | Opportunistic | Fire Flow | 2018 |
| 44 | FF2‐01 | 8‐inch; 1,000 feet | Opportunistic | Fire Flow | 2018 |
| 45 | FF2‐02 | 8‐inch; 300 feet | Opportunistic | Fire Flow | 2018 |
| 46 | FF2‐03 | 8‐inch; 50 feet | Opportunistic | Fire Flow | 2018 |
| 47 | FF2‐04 | 6‐inch; 2,200 feet | Opportunistic | Fire Flow | 2018 |
| 48 | FF2‐05 | 12‐inch; 20 feet | Opportunistic | Fire Flow | 2018 |
| 49 | FF2‐06 | 8‐inch; 20 feet | Opportunistic | Fire Flow | 2018 |
| 50 | FF2‐07 | 8‐inch; 2,300 feet | Opportunistic | Fire Flow | 2018 |
| 51 | FF2‐08 | 8‐inch; 1,100 feet | Opportunistic | Fire Flow | 2018 |
| 52 | FF2‐09 | 6‐inch; 700 feet | Opportunistic | Fire Flow | 2018 |
| 53 | FF2‐91 | 12‐inch; 4,600 feet | Opportunistic | Fire Flow | 2018 |
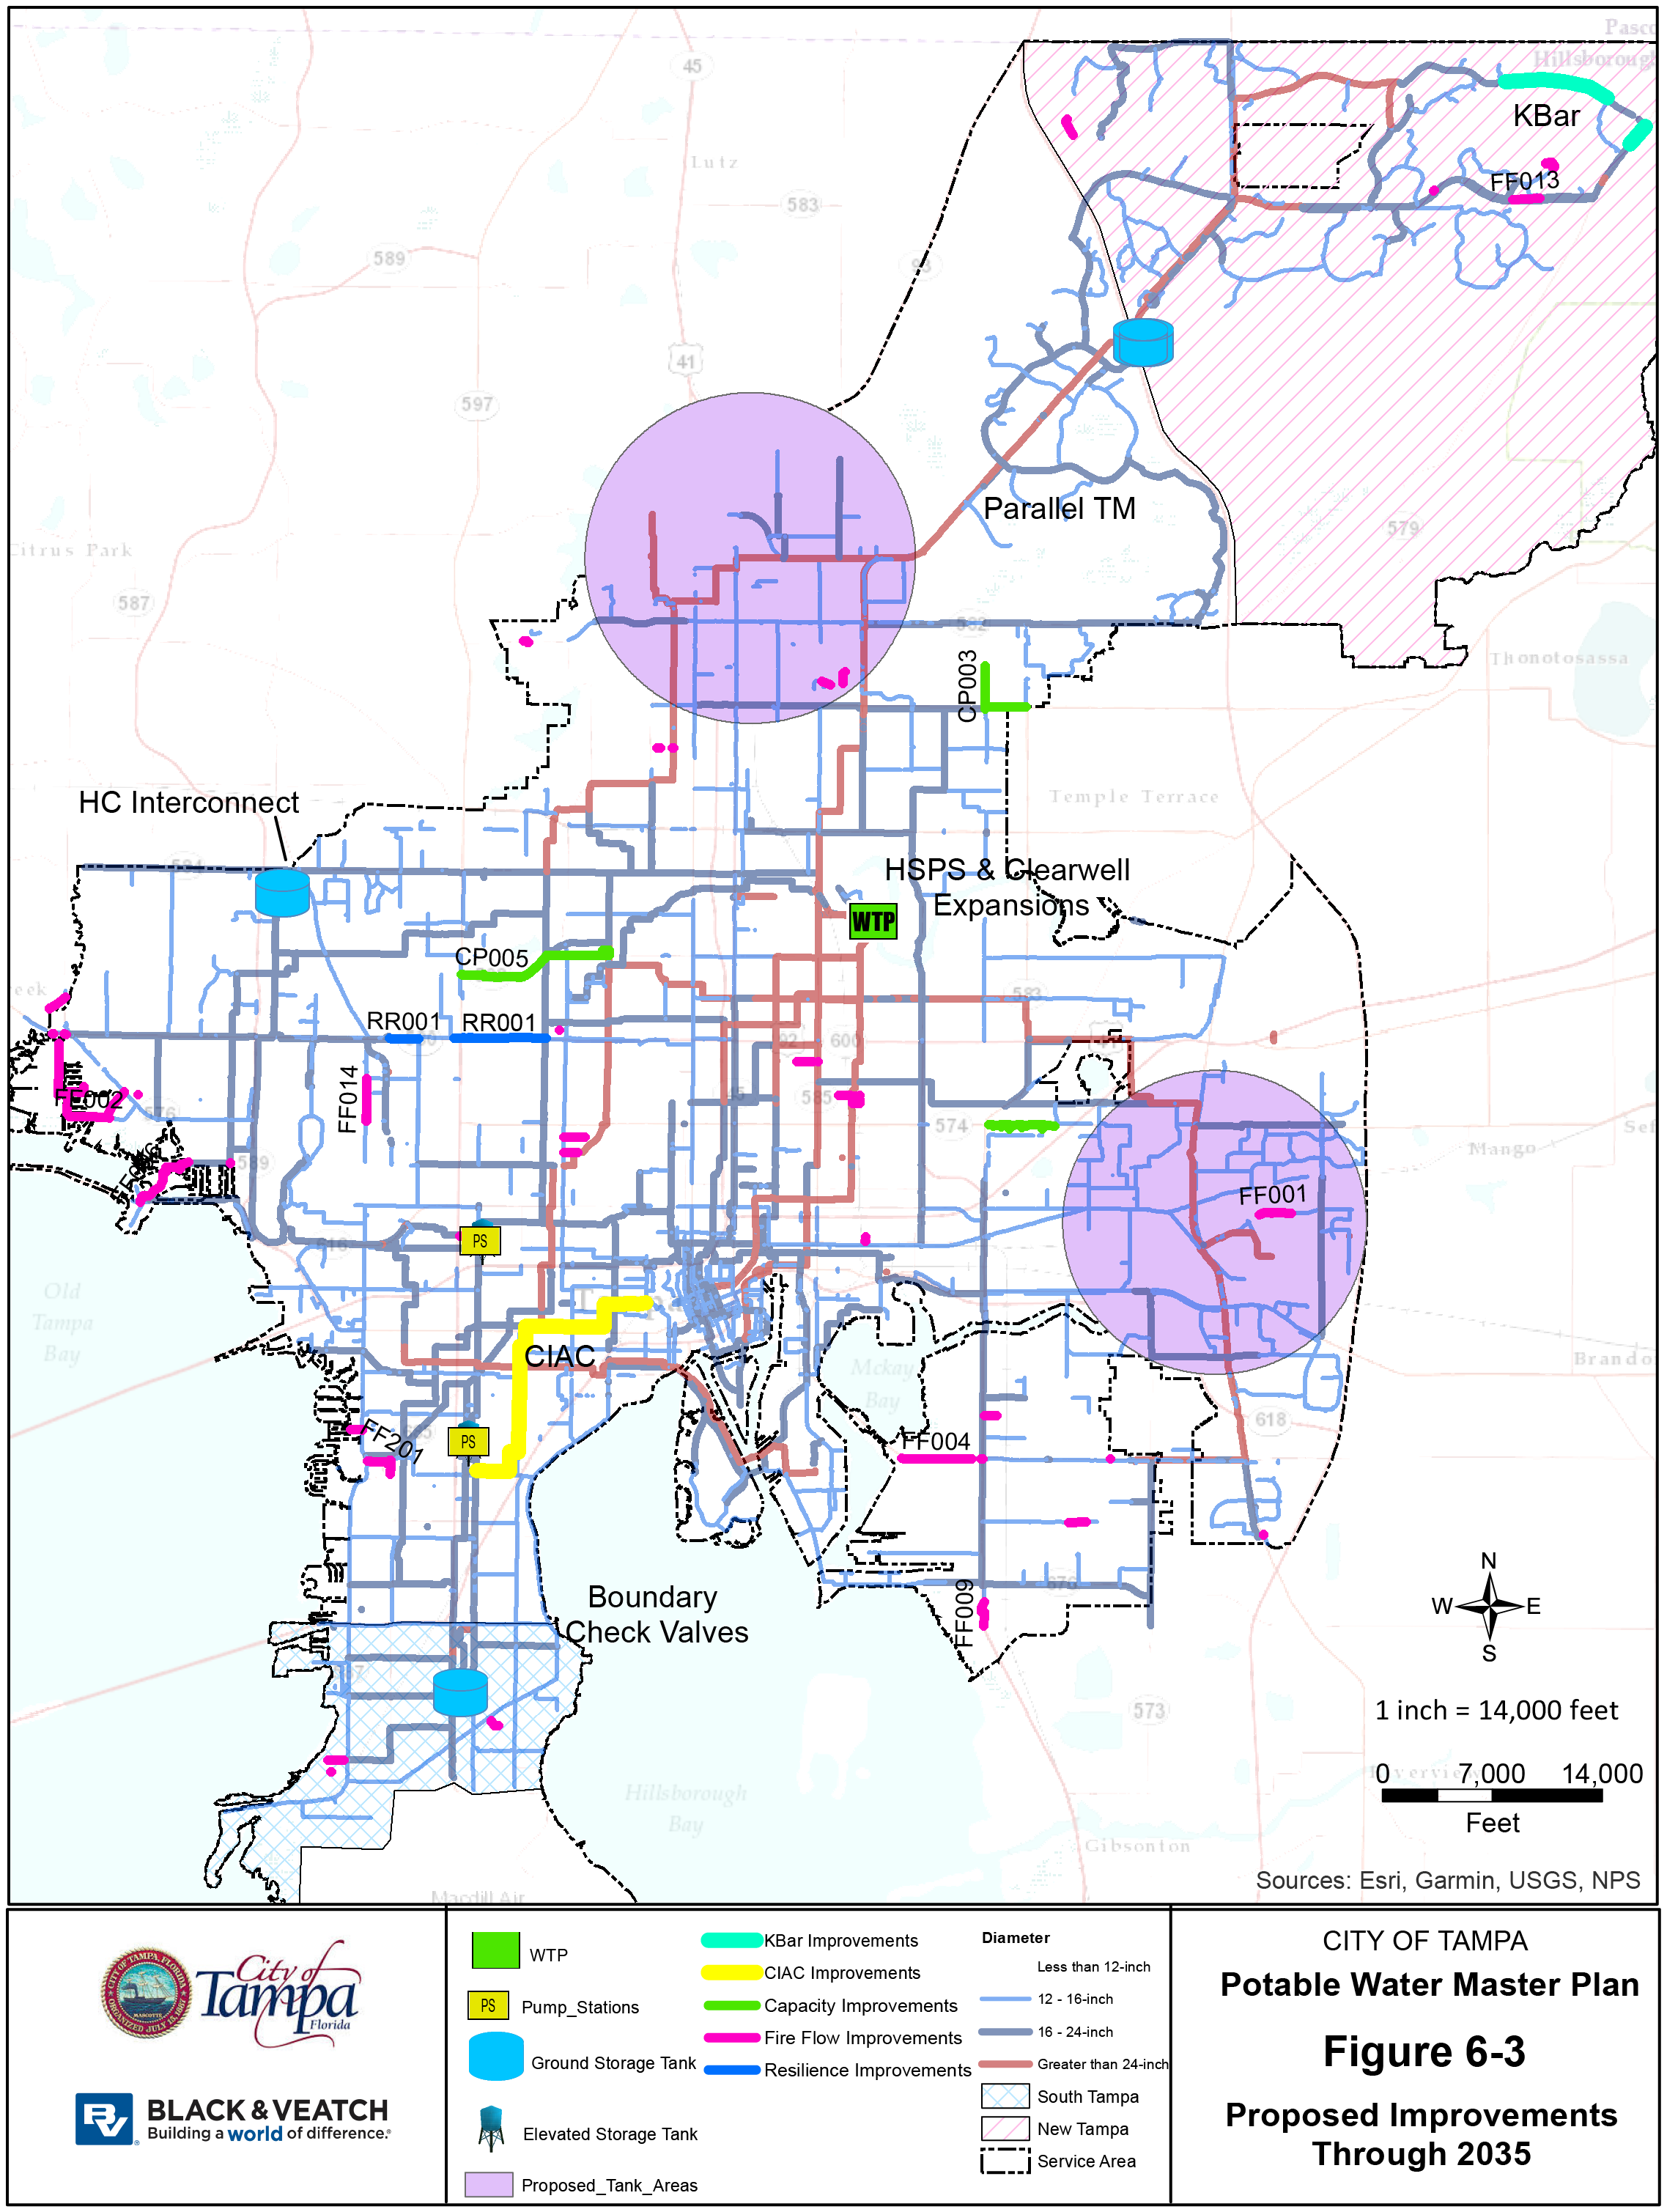
CITY OF TAMPA
Potable Water Master Plan
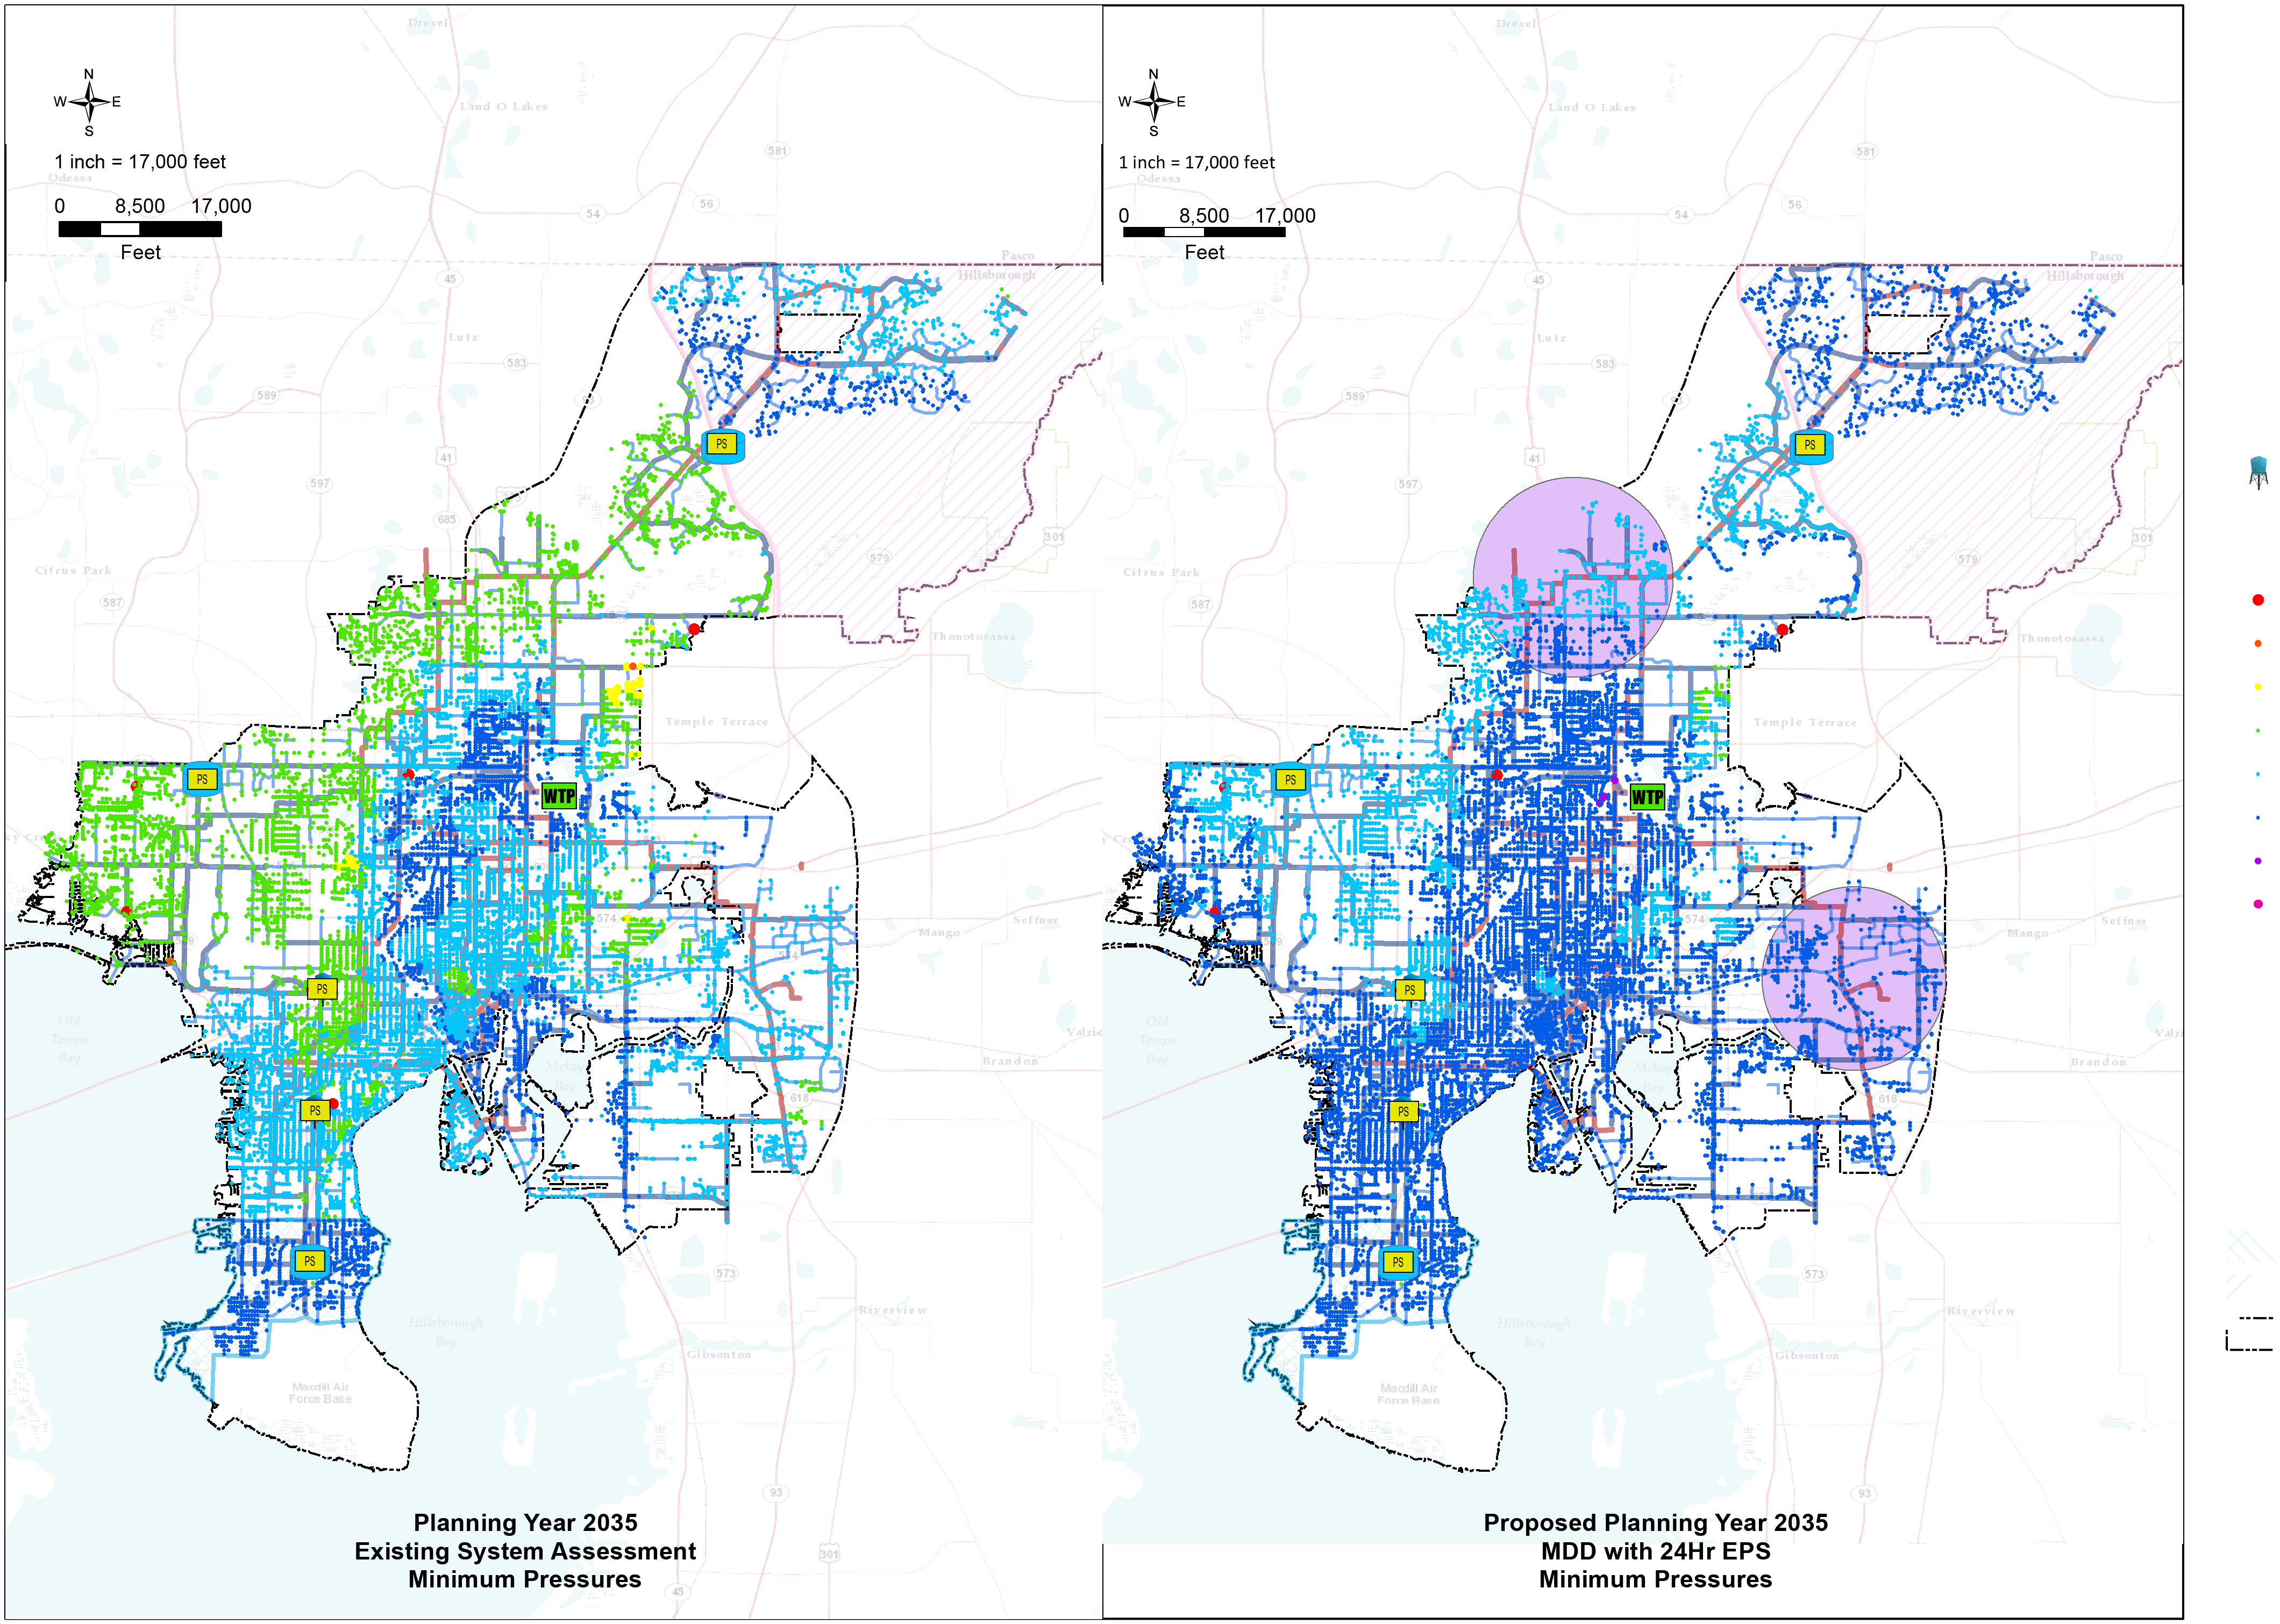


Figure 6-4
Proposed Planning Year 2035 MDD with 24Hr EPS Minimum Pressures
Pump Stations and Storage Tanks
3 Q WTP
Ú[
Pump Stations
UT
Ground Storage Tank
Elevated Storage Tank
Minimum Pressures MIN_PRESSURE
- Below 20 psi
- 20 -25 psi
- 25 -30 psi
- 30 -40 psi
- 40 -50 psi
- 50 -75 psi
- 75 -85 psi
- Greater than 85 psi
wMain
Diameter
- < 12-inch
- 12 -16-inch
- 16 -24-inch
- > 24-inch
Proposed_Tank_Areas
- South Tampa
- New Tampa
- Service Area
/ 1 inch = 17,000 feet 0 8,500 17,000 Feet UT UTUT [Ú [Ú [Ú [Ú 3Q / 1 inch = 17,000 feet 0 8,500 17,000 Feet UT [Ú Planning Year 2035 Existing System Assessment Minimum Pressures UT UT UTUT [Ú [Ú [Ú [Ú [Ú 3Q Proposed Planning Year 2035 MDD with 24Hr EPS Minimum Pressures
Potable Water Master Plan
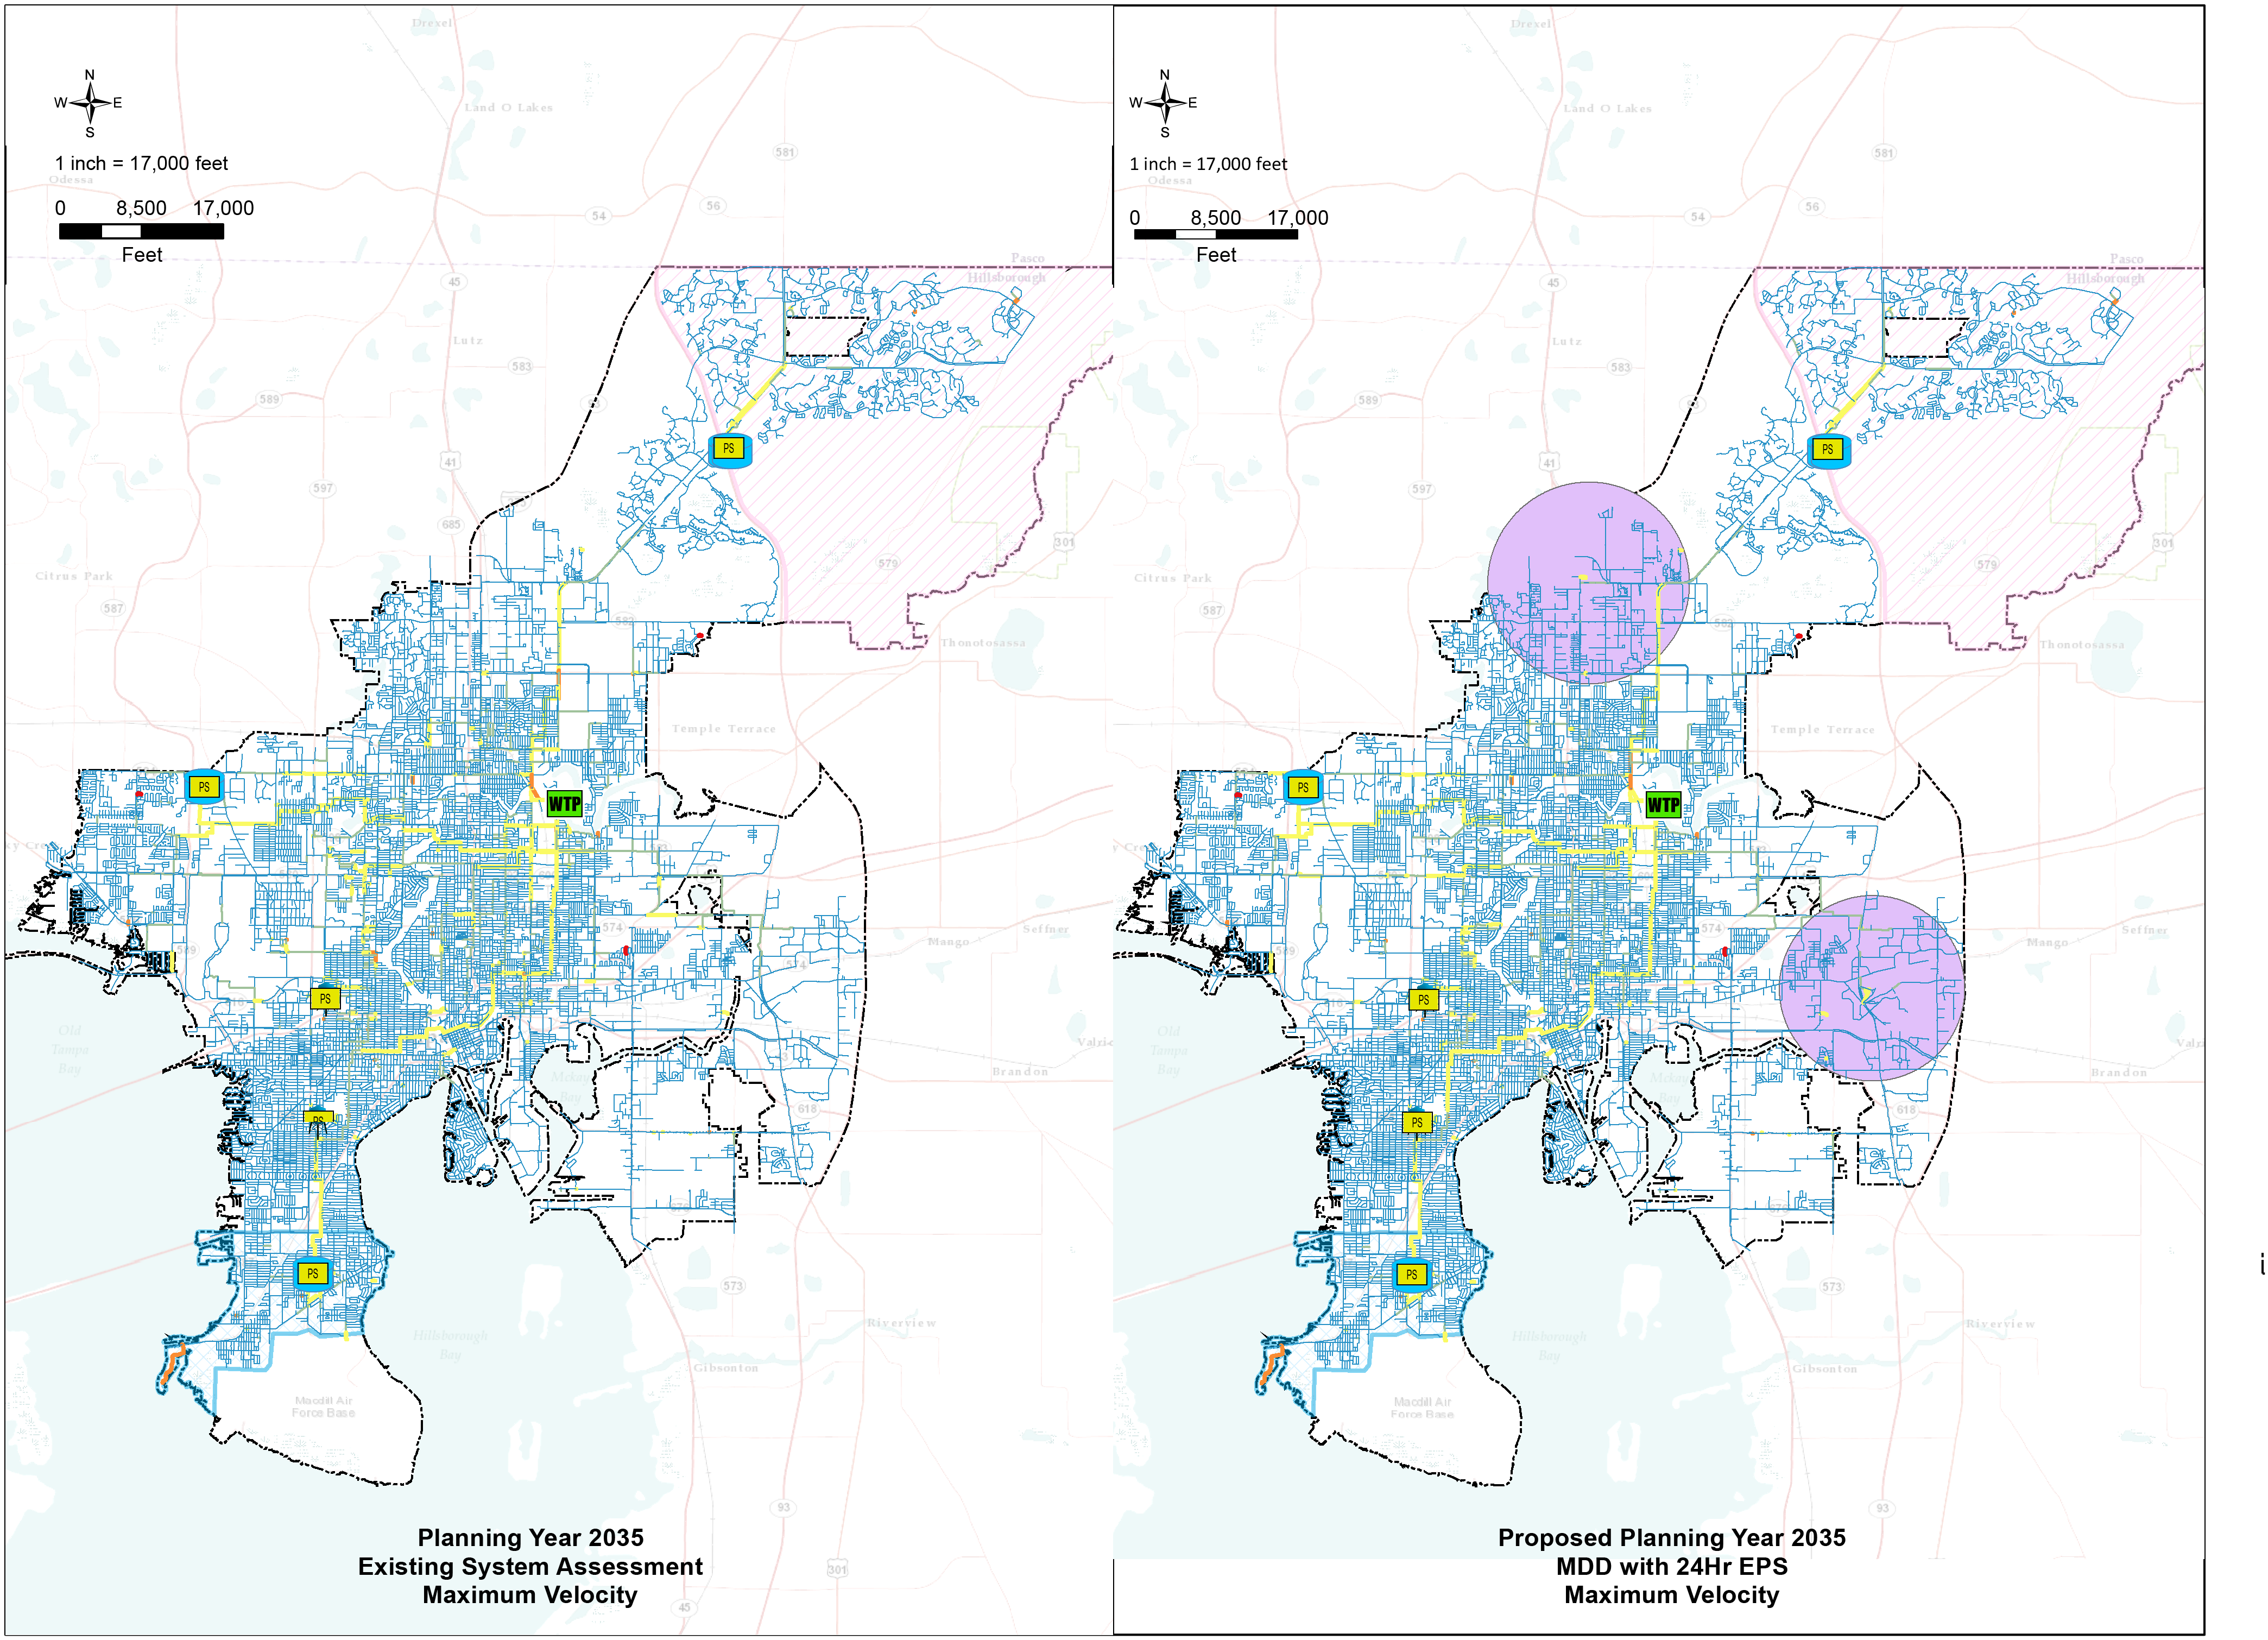
Figure 6-5
Proposed Planning Year 2035 MDD with 24Hr EPS Maximum Velocity
Q 3 WTP
Ú [
Pump Stations
UT Ground Storage Tank
Elevated Storage Tank
Max Velocity
Max. Velocity
- Less than 2 fps
- 2 -3 fps
- 3 -5 fps
- 5 -10 fps
- Greater than 10 fps
Proposed_Tank_Areas
South Tampa
New Tampa
Service Area
/ 1 inch = 17,000 feet 0 8,500 17,000 Feet UT UTUT [Ú [Ú [Ú [Ú 3Q / 1 inch = 17,000 feet 0 8,500 17,000 Feet UT [Ú Planning Year 2035 Existing System Assessment Maximum Velocity UT UT UTUT [Ú [Ú [Ú [Ú [Ú 3Q Proposed Planning Year 2035 MDD with 24Hr EPS Maximum Velocity

CITY OF TAMPA Potable Water Master Plan - Figure 6-6
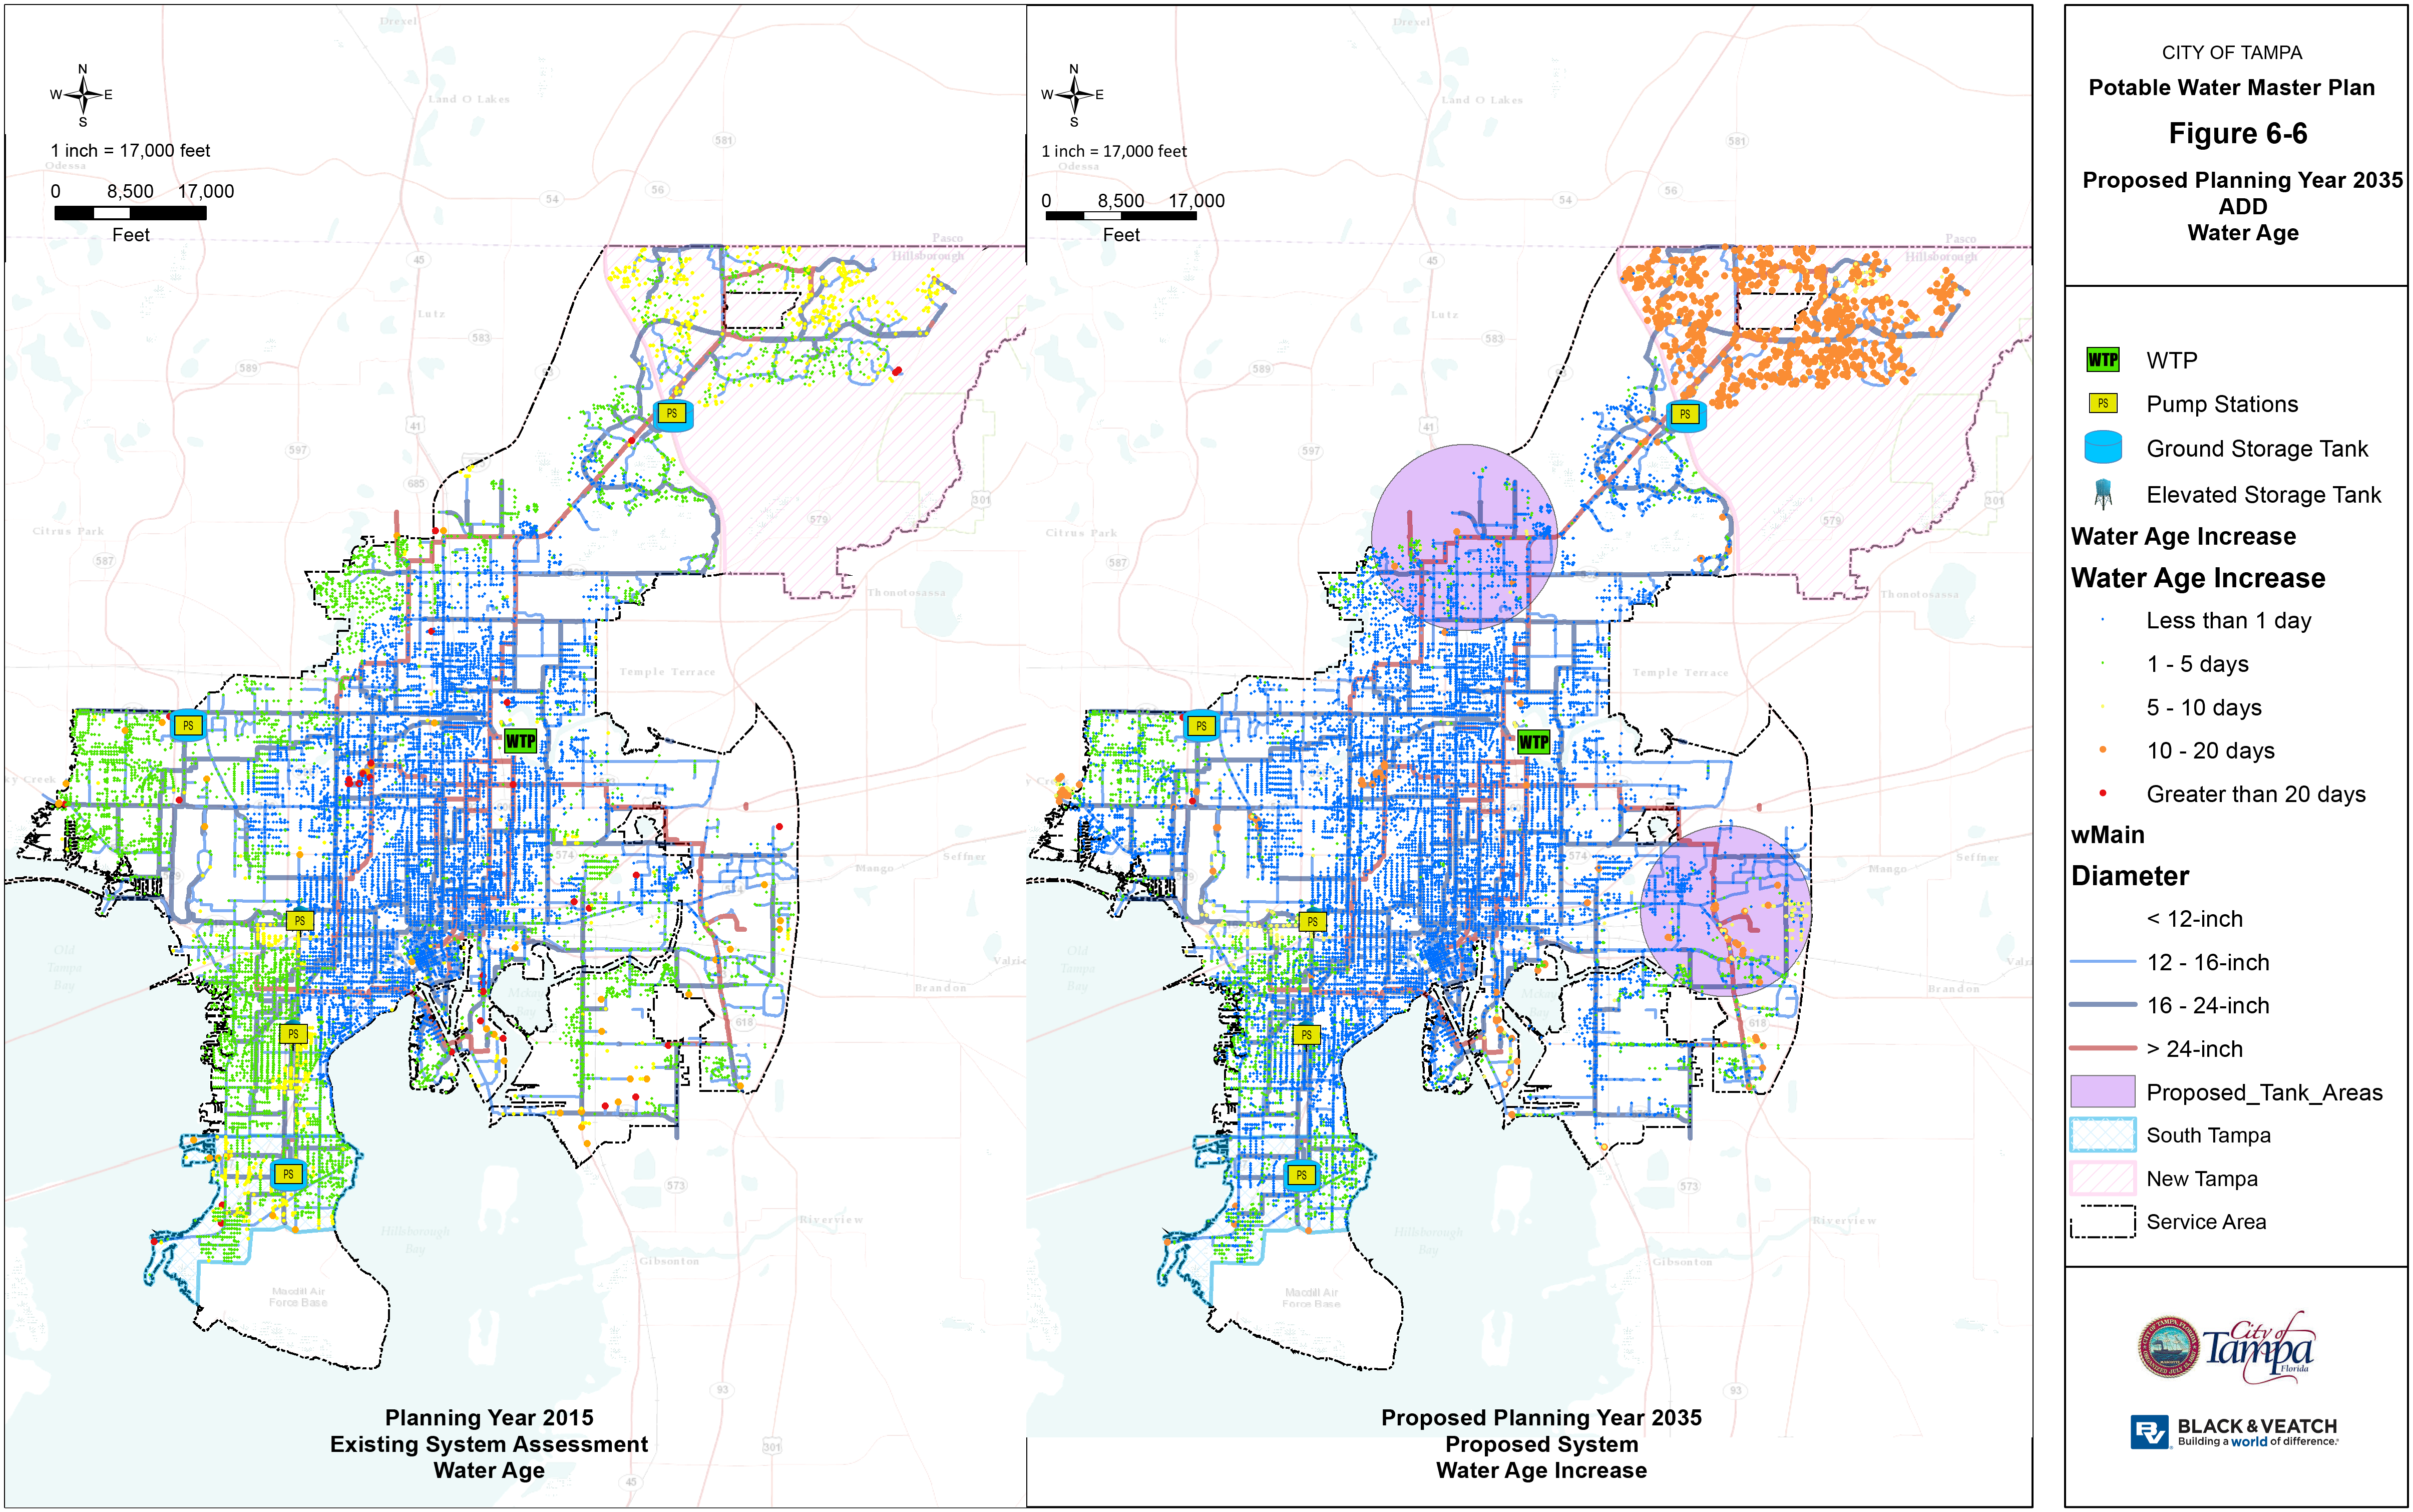
7.0 Asset Management Program Development
7.1 INTRODUCTION
Black & Veatch has performed an asset management maturity assessment of the City of Tampa’s Water Department (the Department) as part of the potable water distribution master plan project. The assessment is based on the requirements of the international asset management standard ISO (International Organization for Standardization) 55001:2014 Asset Management – Management System Requirements and focuses on the Department’s water operations. To undertake this assessment, the Black & Veatch team reviewed documents and information provided by City staff, and facilitated six group interviews with City staff.
The assessment included the following activities:
- Review of documentation and processes provided by staff
- Group interviews
- Identification of key gaps and improvement opportunities
7.2 ISO 5500X STANDARDS
The ISO 5500X standards were published in January 2014 following several key global meetings, working groups and sub‐project team meetings involving more than 30 participating and 10 observing members in its development and based on the globally recognized standard for best practice asset management, PAS 55.
The ISO 5500X series consists of three standards:
- ISO 55000 Asset management—Overview, principles, and terminology
- ISO 55001 Asset management—Management systems—Requirements
- ISO 55002 Asset management—Management systems—Guidelines for the application of ISO 55001
The objective of ISO 55001 is to guide and influence the design of an organization’s asset management activities by embedding a number of key concepts and fundamental principles within a framework (referred to by ISO 55001 as a management system) for asset management. According to ISO 55001 the fundamental principles of asset management are:
Value. Assets exist to provide value to the organization and to stakeholders.
Alignment. Asset management translates the organization’s strategic objectives into asset management decisions, plans and activities.
Leadership. Leadership and commitment from all levels of management is essential for establishing and improving asset management within the organization.
Assurance. Asset management gives assurance that assets will fulfil their required purpose through effective governance.
The asset management system described by ISO 55001 consists of an organization’s asset management policy, asset management strategy, asset management objectives, asset management plan(s) and the activities, processes and organizational structures necessary for their development, implementation and continual improvement. The asset management system includes organizational structure, roles and responsibilities, standards, information management systems, processes, and resources. Figure 7‐1 below provides an outline of an asset management system.
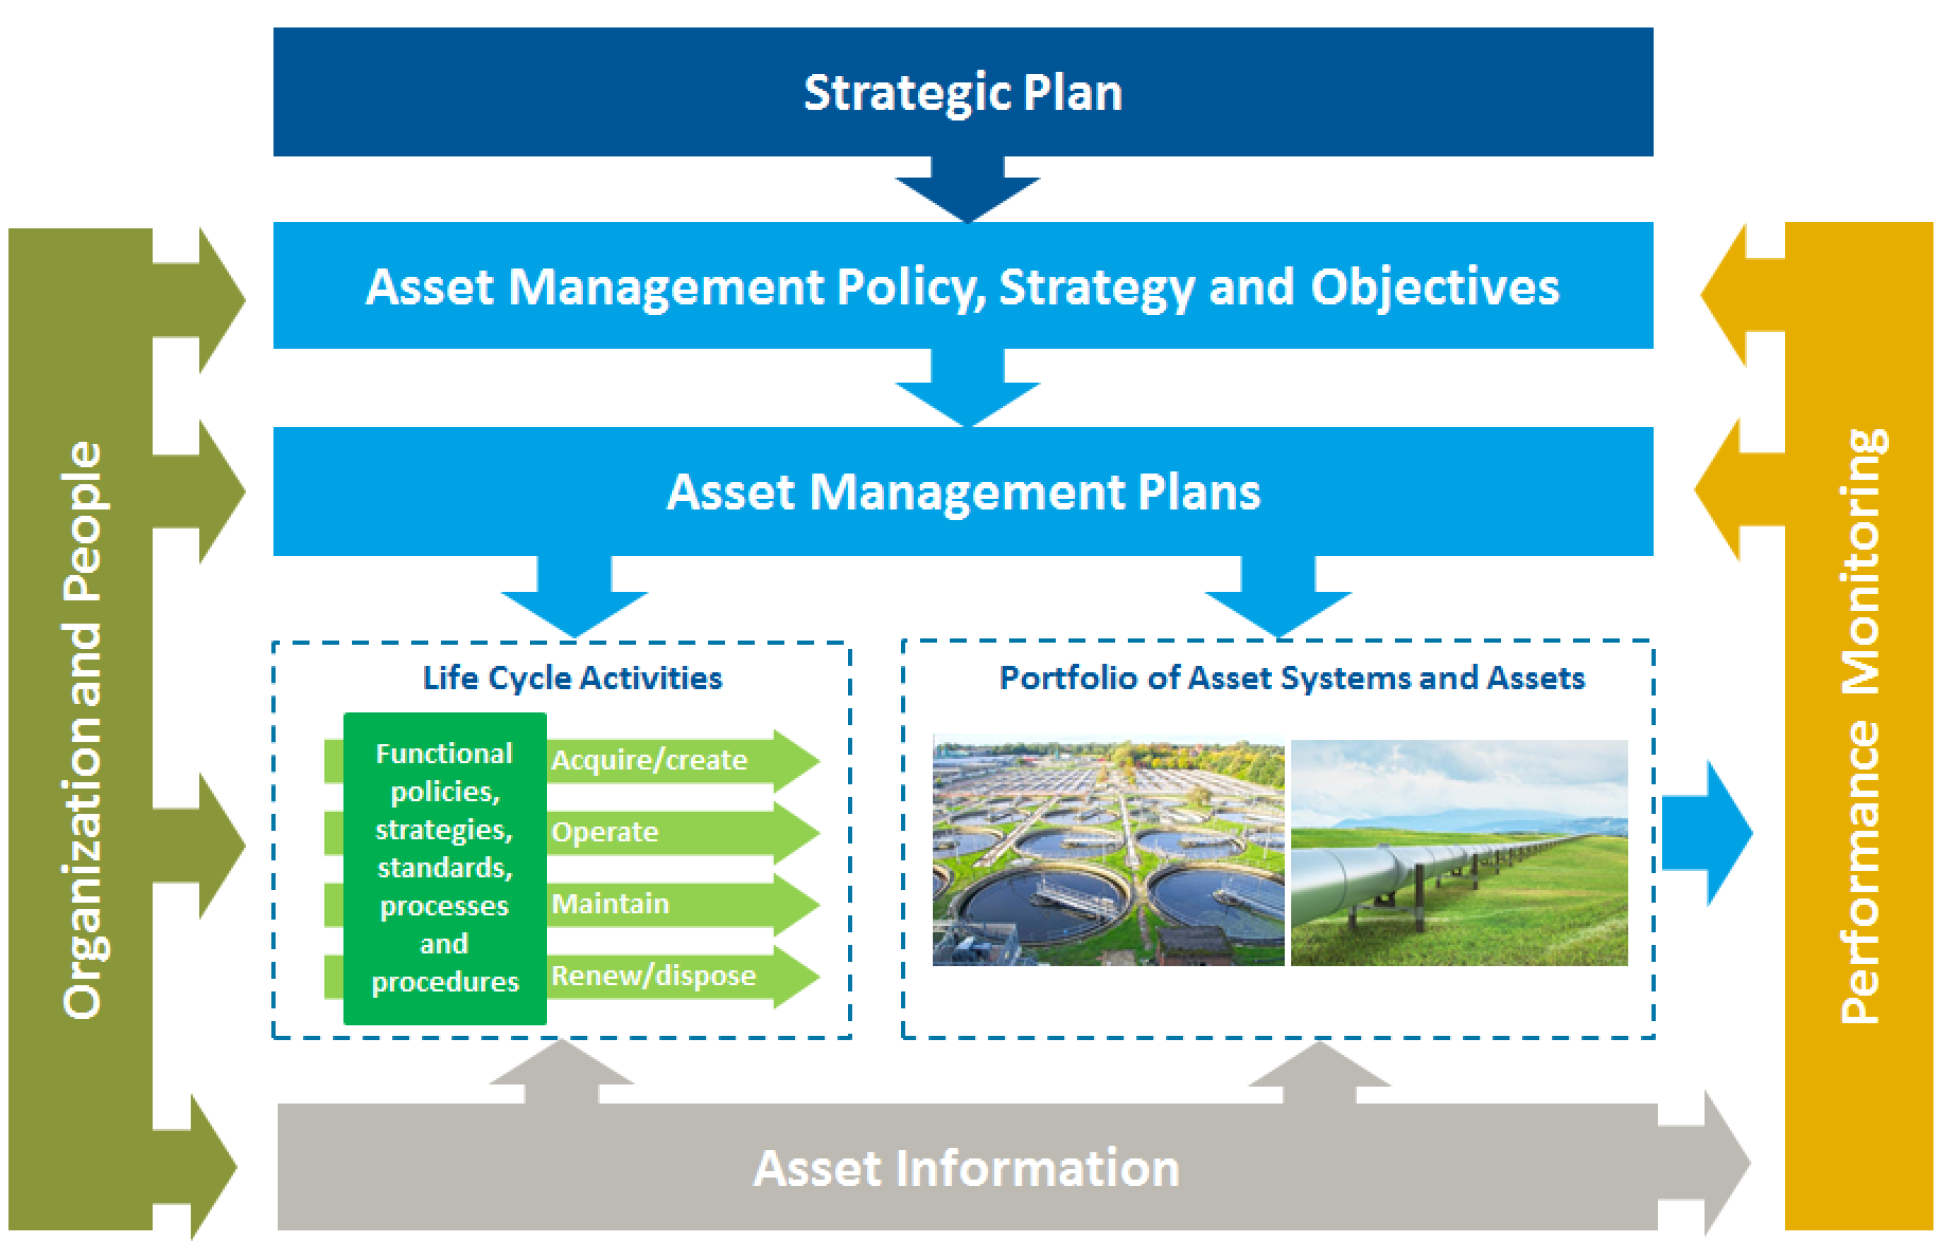
7.3 ASSESSMENT APPROACH
Black & Veatch’s overall assessment approach is shown in Figure 7‐2. To undertake this assessment, the Black & Veatch team reviewed documents and information provided by City staff, which included the 2012 strategic plan (status report 2015), organization chart, and samples of reports, communications, policies, and procedures. A list of the documents provided is included in Appendix E, ISO 55001 Assessment Report. A total of seven group interviews were held with City of Tampa’s Water Department staff:
- Group 1 – Production Division Operations and Maintenance
- Group 2 – Management Team with focus on Strategy and Framework
- Group 3 – Design and Construction Management
- Group 4 – Planning
- Group 5 – Information Management
- Group 6 – Distribution System Operations and Maintenance
Group 7 – Finance and Accounting
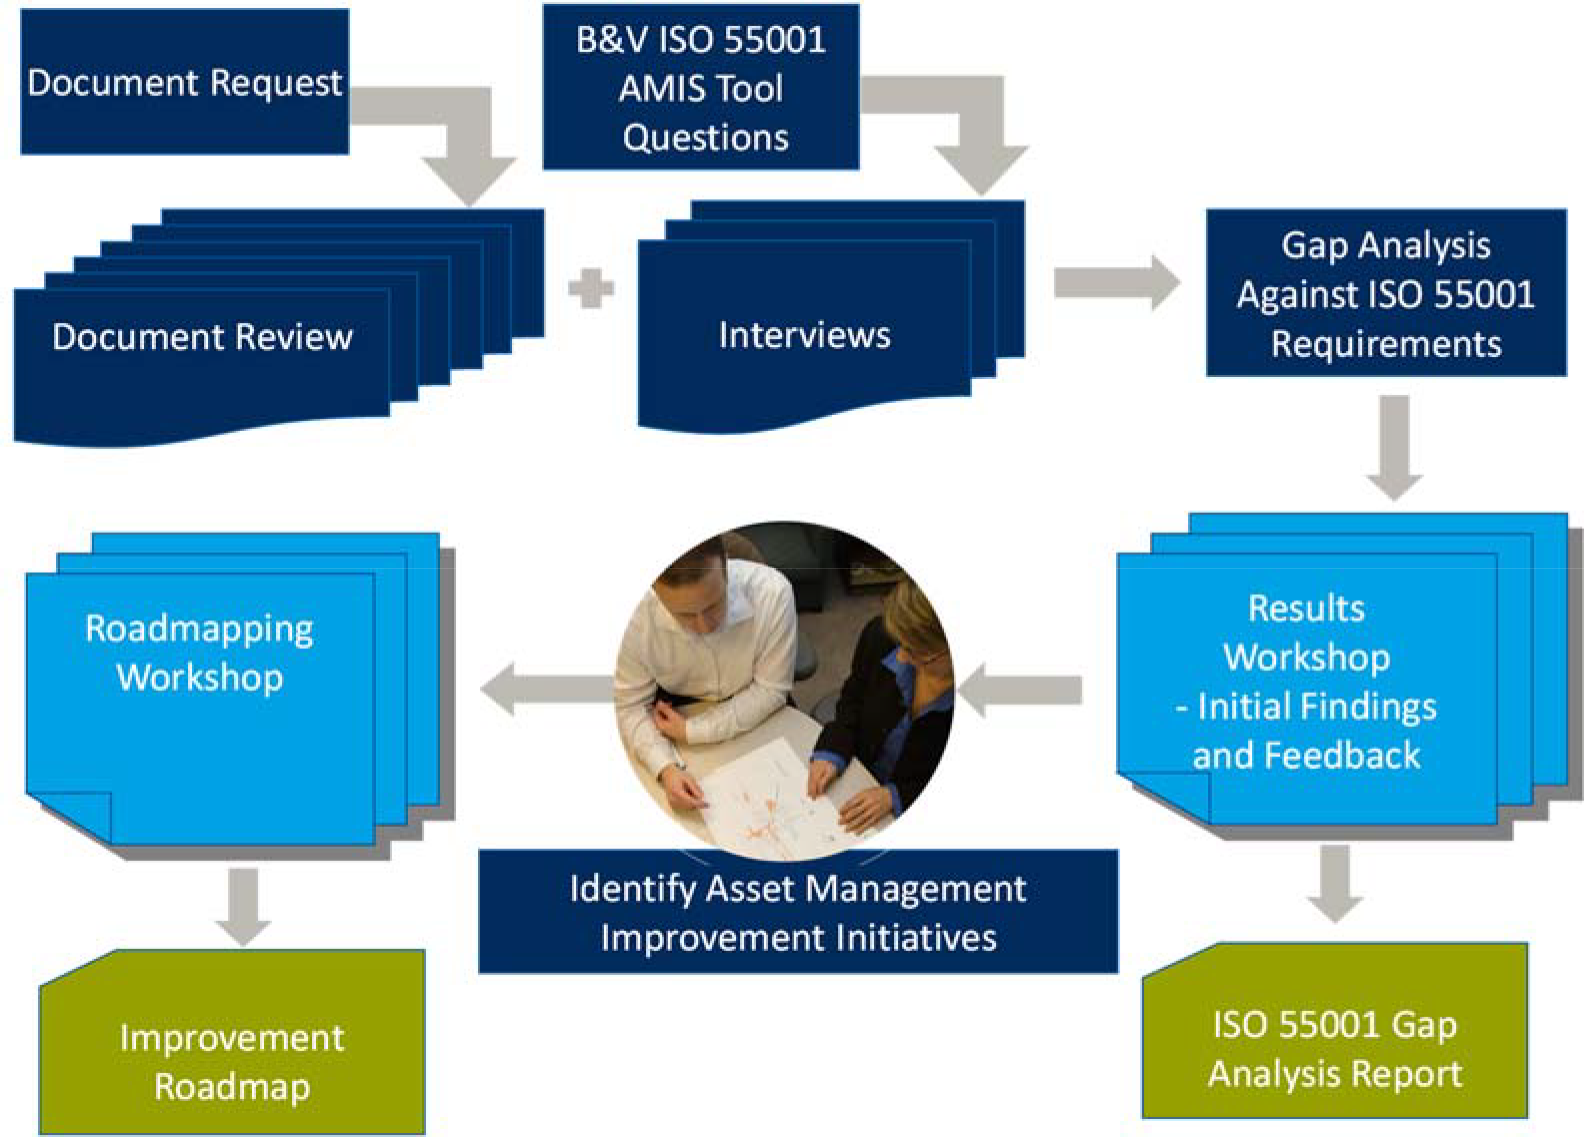
Each of the elements of ISO 55001 was assessed based on the evidence provided by the document review and the interviews, with each element scored on a scale of 0 to 4. The scoring system is shown in Figure 7‐3 below, with a score of 3 being in compliance with the ISO 55001 requirements (following “good practice”). A score of 4 indicates that the organization’s asset management maturity is “beyond ISO 55001” requirements, where asset management practices are optimized and/or the organization is employing leading practice. To achieve full compliance with ISO 55001, an organization must score a 3 in each of the elements.
| Maturity level 0 | Maturity level 1 | Maturity Level 2 | Maturity Level 3 | Beyond ISO 55001 | |
|---|---|---|---|---|---|
| The organization has not recognized the need for this requirement and/or there is no evidence of commitment to put it in place. | The organization has identified the need for this requirement, and there is evidence of intent to progress it. | The organization has identified the means of systematically and consistently achieving the requirements, and can demonstrate that these are being progresses with credible and resourced plans in place. | The organization can demonstrate that it systematically and consistently achieves relevant requirements set out in ISO 55001. | The organization can demonstrate that it is systematically and consistently optimizing its asset management practice, in line with the organization’s objectives and operating context. | The organization can demonstrate that it employs the leading practices and achieves maximum value from the management of its assets, in line with the organization’s objectives and operating context. |
7.4 ASSESSMENT RESULTS
Overall, the City of Tampa’s Water Department achieved an average asset management maturity score of 1.6, which is in the “Aware” zone of the maturity scale. This score is typical of a utility that has some elements of good practice asset management in place but has identified the need to improve its asset management approach. Information on individual element scores is shown in Appendix F, ISO 55001 Assessment Report. Figure 7‐4 illustrates the results of the maturity assessment.
The Department leadership has recognized the need to implement a formal asset management program, and has commenced the process with the Water Master Plan and this gap assessment. The 2012 Strategic Plan includes some goals and objectives specific to asset management, some of which have been implemented such as the Geographic Information System (GIS) conversion to ArcGIS and the recent implementation of the InfoMaster software to support the risk assessment and rehabilitation planning and budgeting for the distribution system.
The Department has a number of good foundational elements on which to build: a planning process is in place with the CIP and master plan, key performance indicators are reported to the public, training is well managed with a skills matrix to determine training needs, the Water Treatment Facility has well defined Standard Operating Procedures (SOPs) in place, and there are processes to respond to incidents. However, the Department lacks an overarching asset management framework, strategy and objectives, and asset management plans, that combined result in lower scores in a number of areas.
Having sufficient staffing levels and resources are critical for successfully implementing and maintaining a successful asset management program. The gap assessment identified that it takes significant effort to obtain additional resources and there is no formal process to determine resource needs for the Department. Support groups from other City departments need to be developed as well, and top management support is required from the Public Works and Utility Services Administrator and Mayor.
Improvement recommendations were made to close the identified gaps, and these are further developed into initiatives in the Asset Management Implementation Plan.
7.5 ASSET MANAGEMENT IMPLEMENTATION PLAN
To aid in the implementation of an asset management framework that is aligned with the ISO 55001 requirements, Black & Veatch has developed an asset management implementation plan. The Asset Management Implementation Plan consists of an action plan and schedule for implementing improvements to the City of Tampa Water Department’s approach to asset management.
The asset management initiatives consist of:
- Update Water Department Strategic Plan
- Form AM Steering Committee
- Develop AM Framework (including Policy, Strategy and Objectives)
- Develop Water Department Resourcing Plan
- Develop Water Department Communications Plan
- Develop Key Performance Indicators
- Data Needs Assessment
- Implement Data Management Processes
- Update Water Department Policies and SOPs
- Develop SOP for Incident Response, Investigation and Corrective Action
- Update technical specifications
- Implement Facilities Risk Management
- Emergency Response Improvements
- Develop Asset Management Plans
- Implement Utility Management System
- Contract Management Improvements
- Production CMMS Improvements
- Implement Cost Accounting
The action plan lists out each of the initiatives, with specific actions and recommendations, the timeframe for completion, and the priority of the action. A high‐level consideration of resources needed to implement the initiative is included, and a Department lead has been assigned to each action.
The action plan and schedule are included in the Asset Management Implementation Plan Technical Memorandum, which is included as Appendix G.
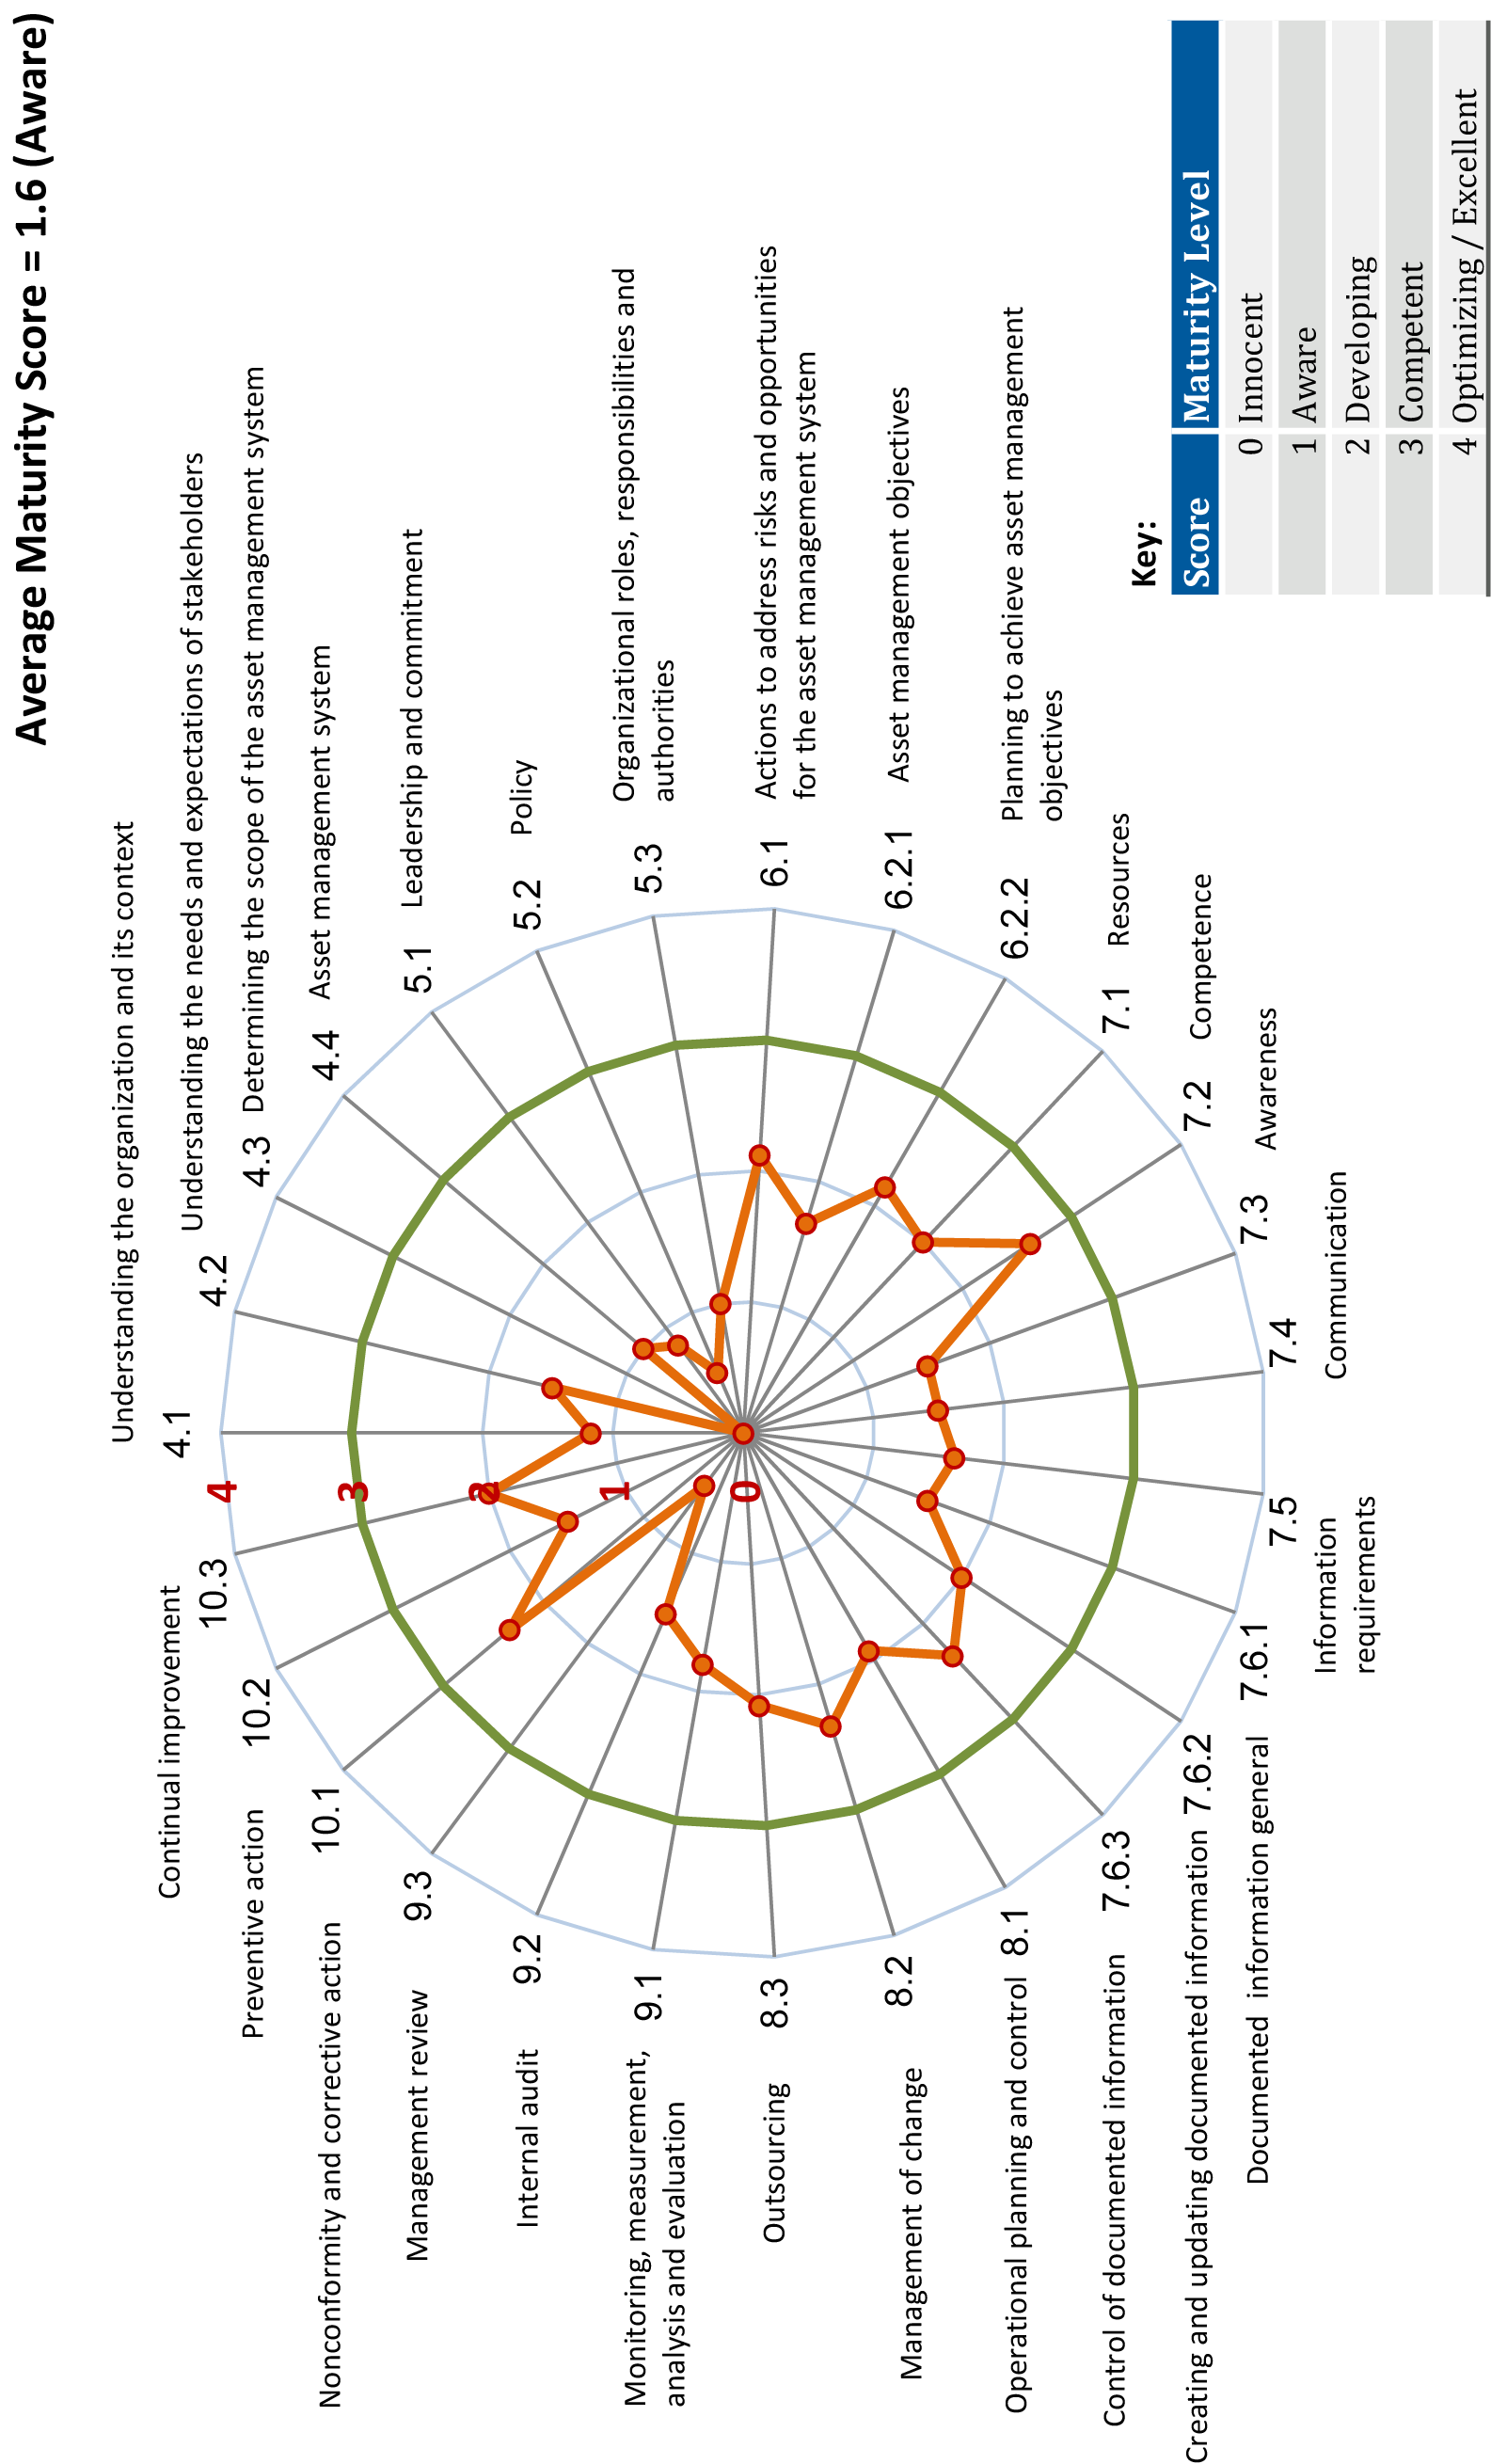
8.0 Risk Based Pipeline Prioritization
8.1 INTRODUCTION
Black & Veatch incorporated a risk‐based prioritization approach to assign a risk score and classification to each water main within the TWD’s potable water service area. The resulting risk scores and classifications will be used to prioritize the City’s potable water main rehabilitation and replacement projects. As part of this effort, Black & Veatch also performed a data quality review and survival curve analysis, which are further described in this section.
8.2 RISK BASED PRIORITIZATION APPROACH
The City is leveraging Innovyze’s InfoMaster software to improve its risk‐based prioritization for potable water main rehabilitation and replacement projects. The risk‐based prioritization model incorporates the City’s available GIS information and selected risk factors. The risk factors include a variety of likelihood of failure (LOF) and consequence of failure (COF) criteria as listed in Table 8‐1. Black & Veatch participated in workshops with the TWD to develop and agree upon the relative importance and scoring scheme for each criterion considering level of service to customers, economics, public health, and public safety.
A scoring range of 1 to 5, where 5 is most likely to fail or has the greatest consequence of failure, was used for the LOF and COF factors to align with InfoMaster’s standard 5x5 risk matrix. A weighting factor was applied to each scoring criteria to determine the overall risk score of each individual pipe. A preliminary scoring scheme was used to accommodate the City’s CIP budget schedule. The final scoring scheme will be implemented by the City in future updates using results from the potable water system hydraulic model. Appendix H, Risked Based Prioritization Technical Memorandum, includes further details on the selected criteria.
Table 8‐1: Likelihood of Failure and Consequence of Failure Criteria
| Category | Selected Criteria | Selected Criteria |
|---|---|---|
| Likelihood of Failure (LOF) | Breaks on Individual Pipe Segments | |
| Remaining Life | ||
| Aggressive Soil Area | ||
| Consequence of Failure (COF) | Social / Health / Safety | Economics |
| Critical Customer Impact | Right-of-Way Ownership and Crossings | |
| Population Density | Water Demand | |
| Repeatable Breaks on Individual Pipe Segments | Diameter | |
| Contaminated Soil | Interconnect Location | |
| Additional Fire Hydrants | 2015 Planned Paving Projects | |
| * Modeled Velocity/High Head Loss | ||
| * Available Fire Flow | ||
| * Service Main Replacements | ||
* Future criteria based on availability of model data.
8.3 SURVIVAL CURVE DEVELOPMENT
Survival curves were developed for each pipe material to estimate the life expectancy for the TWD water mains. The estimated life expectancy was used to estimate the remaining life for each water main to support the risk‐based prioritization for the TWD water mains. To ensure the results from the survival curve analysis were as accurate as possible, a data quality review was performed on the material and installation dates. The 2012 AWWA Buried No Longer publication (2012 AWWA Report), which documents “historic production and use of water pipe by material”, was used as a guide to identify pipes where the material and installation data did not align with the general timeframe for use. Pipes identified outside the general timeframe for use and associated main breaks were excluded from the survival curve analysis. Appendix I, Water Main Data Quality Review and Survival Curve Development Technical Memorandum, provides further details on the data quality review and survival curve analysis.
8.3.1 Data Quality Review
Based on review of the installation date and material, Table 8‐2,
Table 8‐3, and
Table 8‐4 provide a summary of the total number of pipe segments that were identified for further review by TWD. Appendix I, Water Main Data Quality Review and Survival Curve Development Technical Memorandum, includes figures identifying the pipe segments for review.
Table 8‐2: Pipe Segments with TWD Assigned Installation Date Discrepancy
| Material | Pipes identified for review - pipe count | Pipes identified for review - length (mi) | Total pipe count | Total length (mi) | Percentage of pipes to be reviewed - % total count | Percentage of pipes to be reviewed - % total length |
|---|---|---|---|---|---|---|
| Asbestos Cement | 27 | 0.2 | 295 | 11.2 | 9% | 2% |
| Cast Iron (1) (2) | 1,210 | 20.2 | 33,034 | 930.0 | 4% | 2% |
| Copper | 22 | 0.3 | 116 | 1.2 | 19% | 23% |
| Ductile Iron Pipe | 669 | 13.9 | 39,562 | 904.8 | 2% | 2% |
| Fiberglass Reinforced | 1 | 0.2 | 1 | 0.2 | 100% | 100% |
| Galvanized Pipe | 6 | 0.1 | 108 | 1.6 | 6% | 5% |
| High Density Polyethylene | 35 | 0.8 | 1,868 | 33.8 | 2% | 2% |
| Polyvinyl Chloride (1) | 31 | 0.7 | 6,157 | 155.0 | 1% | 0.5% |
| Unlined Cast Iron (1) | 126 | 2.1 | 6,056 | 124.6 | 2% | 2% |
| Total | 2,127 | 38.5 | 87,197 | 2162.5 | 2% | 2% |
| (1) Includes pipes not owned by the City of Tampa (6 pipe segments total, 1 CAS, 4 PVC, 1 UCI) | (2) Includes 1 inactive pipe | |||||
Table 8‐3: Pipe Segments with Assumed Installation Date
| MATERIAL | PIPES IDENTIFIED FOR REVIEW | TOTAL PIPE COUNT | TOTAL LENGTH (MI) | PERCENTAGE OF PIPES TO BE REVIEWED | ||
|---|---|---|---|---|---|---|
| PIPE COUNT (1) | LENGTH (MI) | % TOTAL COUNT | % TOTAL LENGTH | |||
| Asbestos Cement | 22 | 1.1 | 295 | 11.2 | 7% | 10% |
| Cast Iron (1) (2) | 6,523 | 165.7 | 33,034 | 930.0 | 20% | 18% |
| Concrete Segments (Bolted) | 1 | 0.001 | 2 | 0.001 | 50% | 72% |
| Copper | 20 | 0.1 | 116 | 1.2 | 17% | 8% |
| Ductile Iron Pipe (1) (2) | 6,186 | 126.2 | 39,562 | 904.8 | 16% | 14% |
| Galvanized Pipe (1) | 61 | 1.3 | 108 | 1.6 | 56% | 77% |
| High Density Polyethylene (2) | 441 | 7.5 | 1,868 | 33.8 | 24% | 22% |
| Polyvinyl Chloride (1) (2) | 259 | 8.4 | 6,157 | 155.0 | 4% | 5% |
| Steel | 1 | 0.1 | 3 | 0.2 | 33% | 45% |
| Transite | 3 | 0.1 | 3 | 0.1 | 100% | 100% |
| Unlined Cast Iron (1) (2) | 5,150 | 103.3 | 6,056 | 124.6 | 85% | 83% |
| Total | 18,667 | 413.9 | 87,204 | 2162.6 | 21% | 19% |
(1) Includes pipes not owned by the City of Tampa (283 pipe segments total, 8 CAS, 21 DIP, 2 GP, 28 PVC, 224 UCI)
(2) Includes inactive pipes (115 pipe segments total, 7 CAS, 79 DIP, 5 HDPE, 2 PVC, 22 UCI)
Table 8‐4: Minimal Remaining Active Pipe Segments
| MATERIAL | PIPES IDENTIFIED FOR REVIEW | |
|---|---|---|
| TOTAL COUNT (1) | LENGTH (MI) | |
| Clay Tile | 2 | 0.0003 |
| Concrete Segments (Bolted) | 2 | 0.001 |
| Fiberglass Reinforced | 1 | 0.25 |
| Polyethylene | 5 | 0.13 |
| Steel | 3 | 0.17 |
| Transite | 3 | 0.13 |
| Total | 16 | 0.55 |
8.3.2 Data Improvement Recommendations
Black & Veatch recommends that TWD perform a detailed review to confirm and/or update the material type and/or installation date for the 23% of pipe segments that either (1) did not align with the 2012 AWWA Report timeframes, (2) are missing an installation date and an assumption was made, or (3) have a material type of clay tile, concrete segments (bolted), polyethylene, steel, and transite. Main breaks associated with any pipe identified for further review should also be reviewed for confirmation of the correct pipe and/or update of the identified break pipe material on the break record.
As part of continually improving the GIS data source used for reporting, modeling, and asset management, additional data quality reviews can be performed by TWD as described below to confirm and/or update the master data:
-
Pipes with duplicate facility IDs: Renumber pipes with duplicate facility IDs to ensure each facility ID is unique.
-
Pipe assigned to Main Breaks
- Each main break record within FY2000‑FY2015 was assigned to a pipe as part of the main break analysis effort performed by Black & Veatch using multiple confidence level criteria. The assigned pipe should be confirmed for all main breaks.
-
Water mains that may be included in the wLateral feature class
- Water mains that are included in the wLateral feature class should be removed and added to the wMains feature class.
-
Service lines that may be included in the wMains feature class
- Service lines that are included in the wMains feature class should be removed and added to the wLaterals feature class.
-
Splits in pipes where a node (valve, hydrant, or fitting) is not located
- Determine if a valve, hydrant, or fitting is missing at two adjoining pipes or if the pipe segments should be merged as a single pipe.
-
Pipes not split at a node (valve, hydrant, or fitting)
- Determine if a pipe should be split at an existing node or if the pipe is a duplicate and should be removed.
-
Multiple pipes in the same location
- Review if overlapping pipe(s) should be inactive
- Review for pipe duplication (individual pipe segments between nodes may have been added and the original pipe segment may have not been deleted)
8.3.3 Survival Curve Analysis
The survival curve analysis follows the Kaplan‑Meier methodology and incorporates the total observed population of water mains for each pipe material, the age of each water main as of year 2015, and the main break occurrences between years 2000 and 2015 to develop a hazard curve and survival curve. The average life expectancies are based on the 50th percentile of the Weibull estimated survival probability. The average life expectancies for pipe materials that did not have sufficient data to support the survival curve analysis are based on the 2012 AWWA Report or
assumed, as applicable. Table 8‐5 provides the estimated life expectancy results for each pipe material.
Table 8‐5: Average Life Expectancy
| MATERIAL | WEIBULL SURVIVAL PROBABILITY (1) | AWWA 2012 REPORT (2) | SELECTED |
|---|---|---|---|
| Asbestos Cement | 46 | 90 | 46 |
| Cast Iron | 86 | 110 | 86 |
| Copper | 40 | Not Available | 40 |
| Concrete Segments (Bolted) | Not Available | 105 (2) | 105 |
| Clay Tile (4) | Not Available | Not Available | 100 |
| Ductile Iron | 88 | 80 | 88 |
| Fiberglass Reinforced | Not Available | 55 (2) | 77 (3) |
| Galvanized Pipe | 101 | Not Available | 101 |
| High Density Polyethylene | 78 | Not Available | 78 |
| Polyethylene | Not Available | 55 (2) | 77 (3) |
| Polyvinyl Chloride | 77 | 55 | 77 |
| Steel | Not Available | 70 | 70 |
| Transite | Not Available | 90 (2) | 46 (3) |
| Unlined Cast Iron | 80 | Not Available | 80 |
(1) Average life expectancies are based on the “Modified” pipe population for each pipe material and are estimated at the 50th percentile of the Weibull survival probability curve.
(2) The 2012 AWWA Report average life expectancy is assumed to be 50th percentile. The AWWA report does not include life expectancy for all pipe materials. The following assumptions were made to estimate the remaining life for each pipe material. Concrete Segments (Bolted) – Assumed similar to Conc & PCCP Fiberglass Reinforced – Assumed similar to PVC Polyethylene – Assumed similar to PVC Transite – Assumed similar to Asbestos
(3) Pipe materials that did not have break history were not included in the survival curve analysis. The following assumptions were made in order to estimate the remaining life for each pipe material based on the Weibull survival probability curve estimates. Fiberglass Reinforced – Assumed similar to PVC Polyethylene – Assumed similar to PVC Transite – Assumed similar to Asbestos
(4) Clay Tile was assumed to have an average life expectancy of 100 years.
8.4 RISK ANALYSIS
Each individual water main segment was analyzed and ranked based on both a calculated risk score and risk classification. The overall risk score was calculated by multiplying the total LOF score and the total COF score. The total LOF and COF scores are determined by multiplying each individual factor score by the assigned weighting and then summing, respectfully. The weightings for each LOF and COF criteria are shown in Table 8‐6.
Table 8‐6: Criteria Weightings
| CRITERIA | PRELIMINARY SCORING WEIGHT |
|---|---|
| Likelihood of Failure | |
| Breaks on Individual Pipe Segments | 45% |
| Remaining Life | 45% |
| Aggressive Soil Area | 10% |
| Consequence of Failure | |
| Critical Customer Impact | 15% |
| Population Density | 10% |
| Repeatable Breaks on Individual Pipe Segments | 5% |
| Contaminated Soil | 10% |
| Additional Fire Hydrants | 5% |
| Right‐of‐Way Ownership and Crossings | 10% |
| Water Demand | 15% |
| Diameter | 15% |
| Interconnect Location | 10% |
| 2015 Planned Paving Projects | 5% |
To determine the risk classification for each water main segment, the bi‐directional distribution risk assessment method using a 5x5 risk matrix is utilized. The risk classifications range from negligible to extreme as shown in Figure 8‐1. The risk classification for each water main segment is based on where the LOF and COF scores intersect within the matrix.
Figure 8‐1: Overall Risk Score Classification Matrix
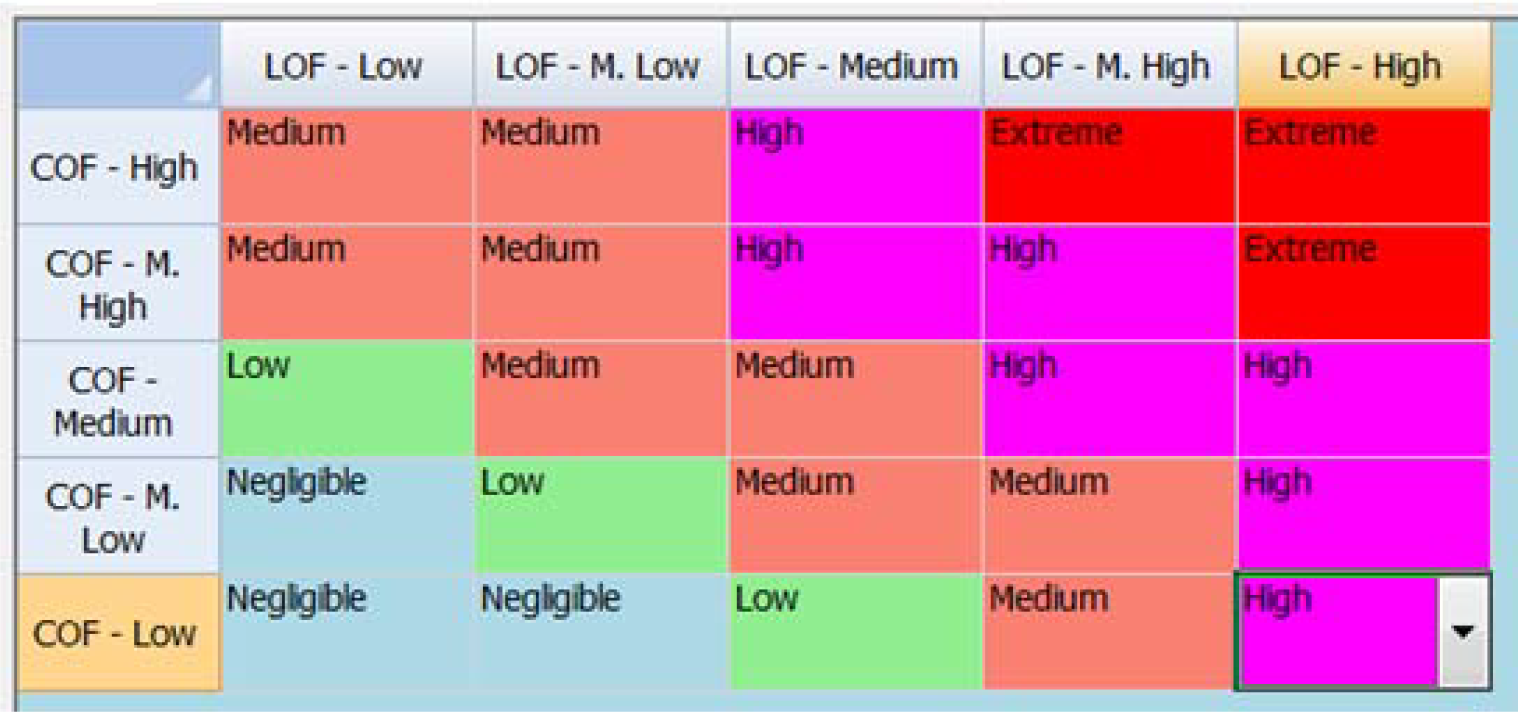
8.5 ANALYSIS RESULTS
8.5.1 Overall Risk Scoring Results
The results of the COF and LOF analysis are shown in Figure 8‐2. Water main segments not active or owned by the TWD were not included in the results. Further detail regarding the overall risk scoring results is included in Appendix H, Risked Based Prioritization Technical Memorandum.

8.5.2 Linear Asset R&R Gap Analysis Results
To support the TWD in future decision making towards water distribution rehabilitation and replacement (R&R) system planning, a gap analysis was performed based on current funding versus total and annual replacement cost needs. Valve, fire line service, hydrant, and distribution main replacement needs were included in the analysis. Table 8‐7 and Figure 8‐3 through Figure 8‐5 provide a summary of the gap analysis results. Assumptions used to support the gap analysis are provided in Appendix H, Risked Based Prioritization Technical Memorandum.
Table 8‐7: Total and Annual Replacement Costs
| CATEGORY TYPE | TOTAL COUNT/ LENGTH (MI) | TOTAL REPLACEMENT COST | REPLACEMENT / REHABILITATION SCHEDULE | ANNUAL COST |
|---|---|---|---|---|
| Valve | 49,704 | $904,772,541 | 20‐year (Replace) | $45,239,000 |
| Fire Line Services | 2,571 | $40,880,323 | 86‐year (Replace) | $475,000 |
| Hydrant | 14,094 | $581,096 | 20‐year (Rehab) | $29,000 |
| Distribution Mains | 2,146 mi | $3,448,968,221 | Varies (Replace) | ‐‐ |
Assumptions:
- Base/Fee/Rate charges assumed to increase at a rate matching inflation. All dollar values shown in 2018 dollars.
- Developer funded pipeline R&R rate is reduced by 50% to account for pipes being taken out of service prior to the pipe being in service for its entire projected lifespan.
- Domestic & irrigation service replacements are included in the pipeline R&R $/ft. estimates
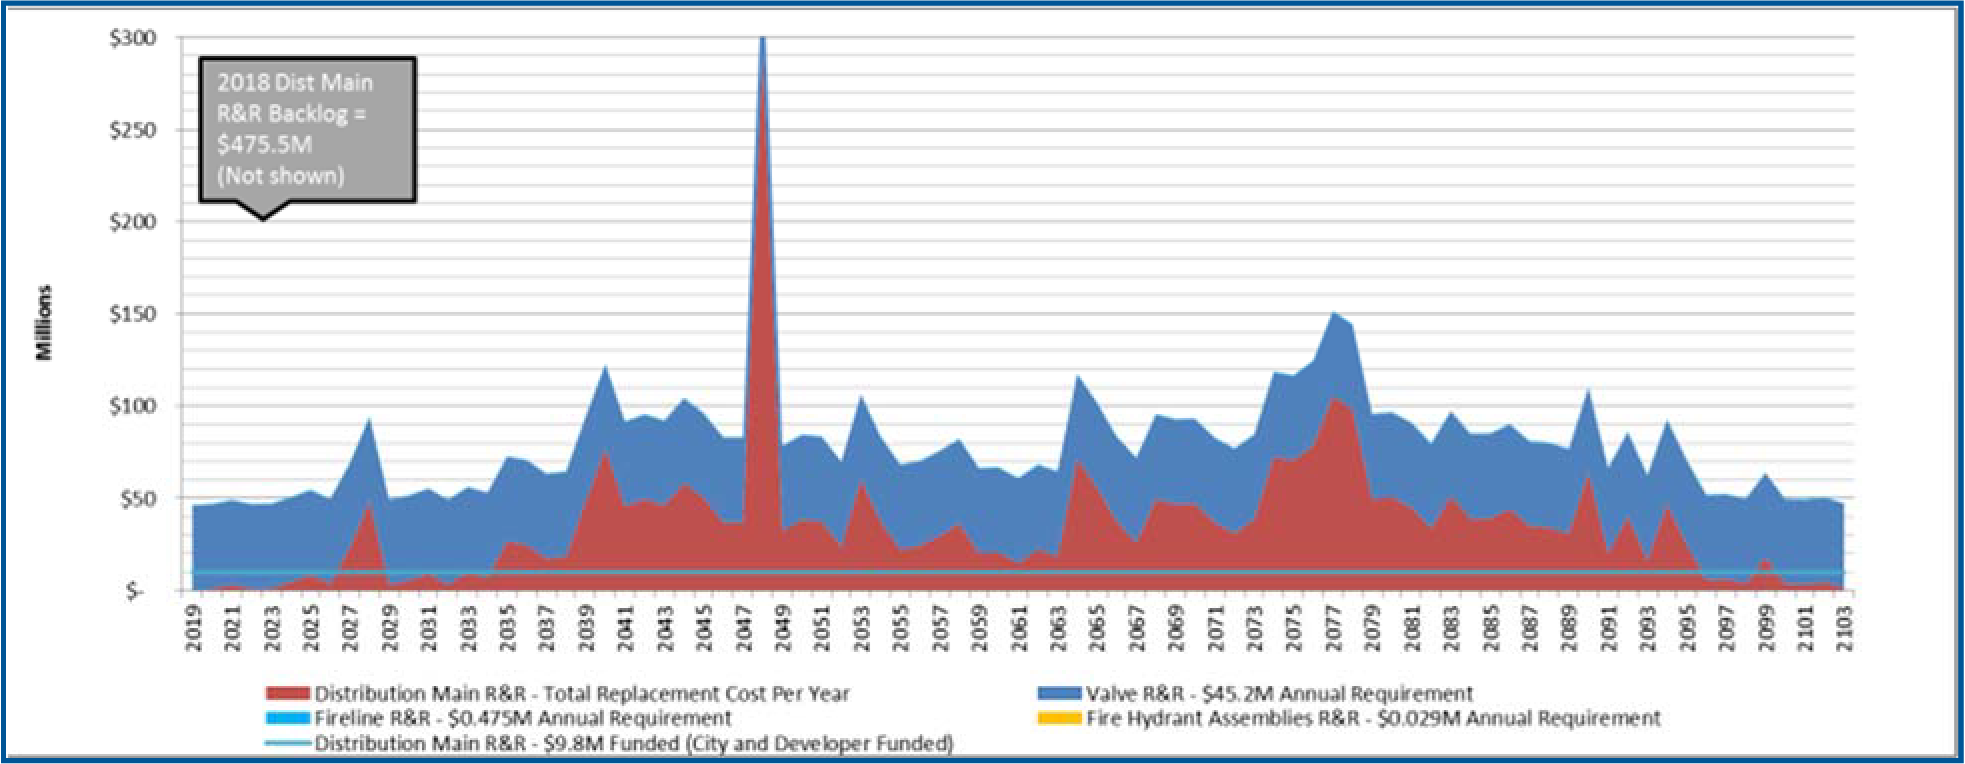
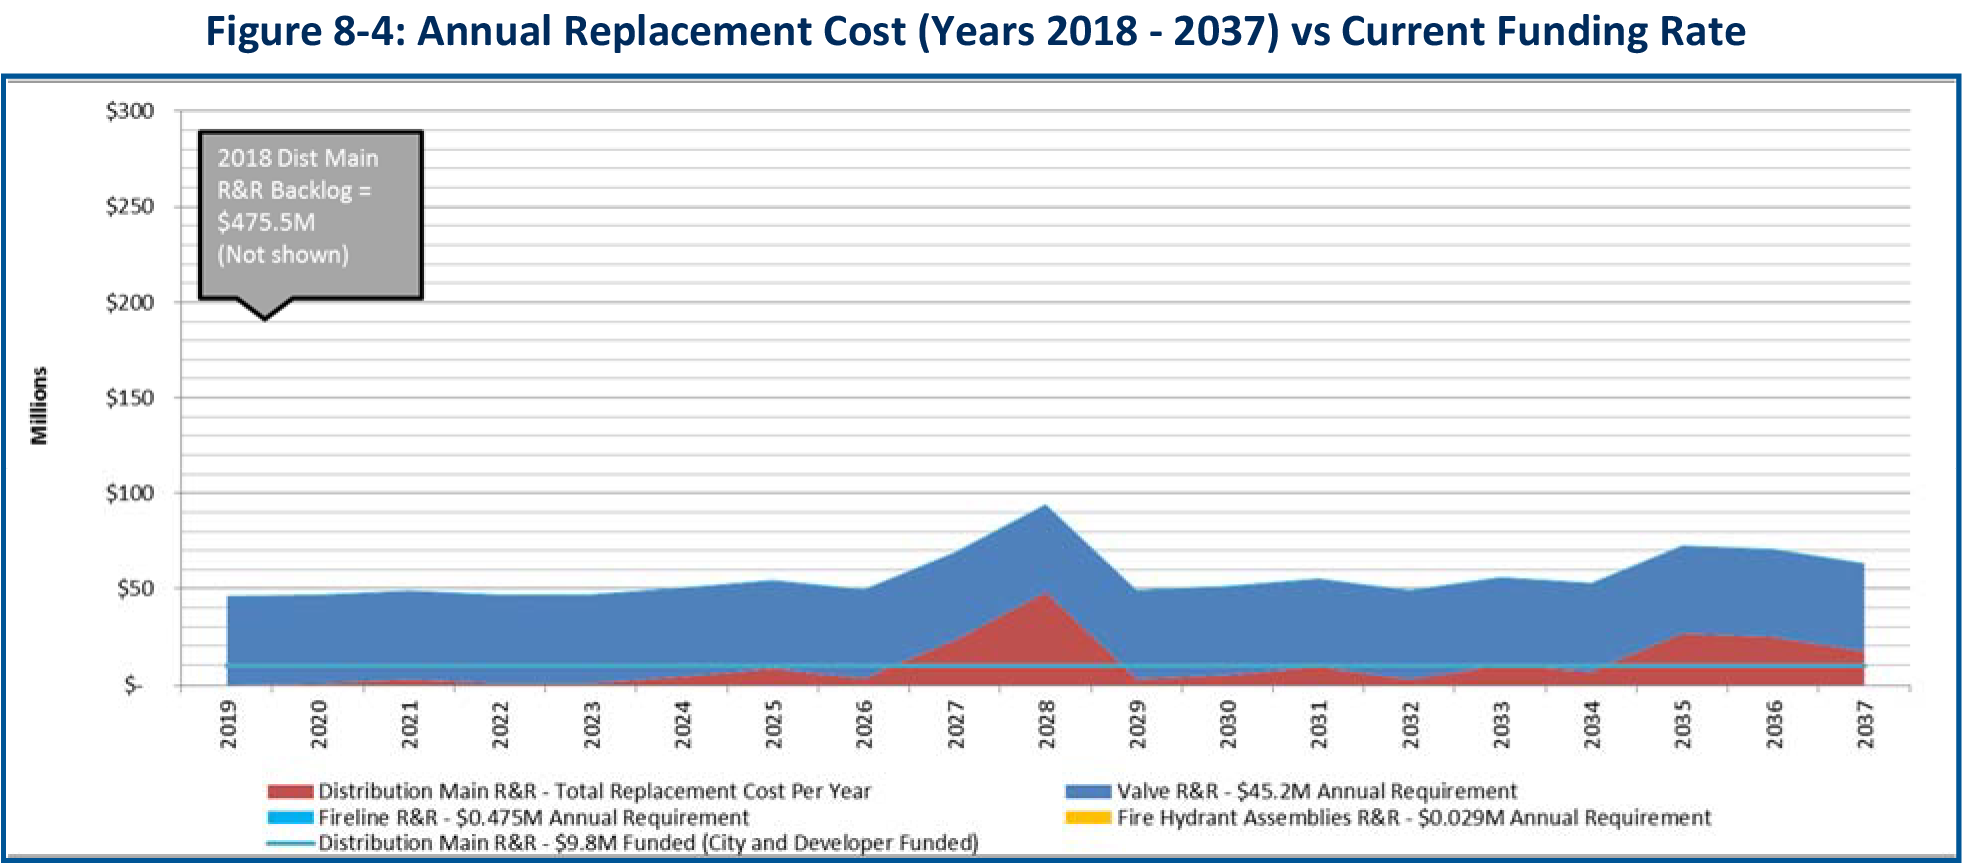
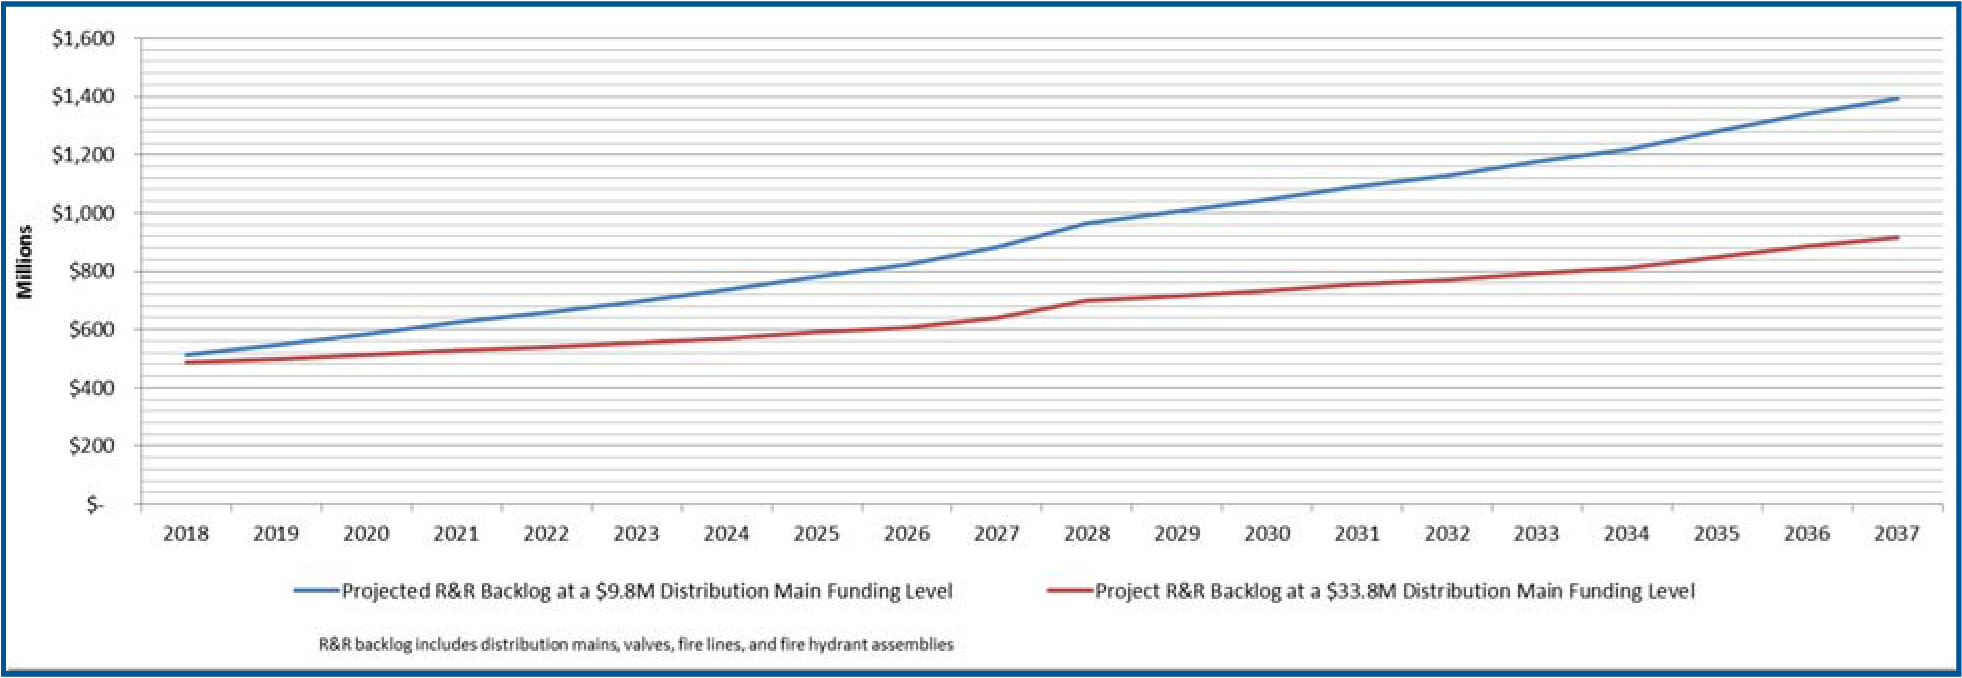
Note: Funding levels are based on distribution main replacement costs needed up to year 2037
8.5.3 Valve Replacement Decision Tool
Black & Veatch developed a spreadsheet tool to support the TWD in standardizing the decision‐making process for valve replacement. Two options were considered for evaluation:
- Option A represents immediate valve replacement, with later pipe and valve replacement. The immediate valve replacement cost (present value) and cost of pipe and valve replacement at end of the life (present value) are summed together for a total present value cost and comparison to Option B.
- Option B represents immediate pipe and valve replacement. The cost for immediate pipe and valve replacement (present value) is calculated for comparison to Option A. This option would be economical when the remaining life of the pipe is limited.
Appendix H, Risked Based Prioritization Technical Memorandum provides further details on the set‐up and calculations used in the spreadsheet template. The spreadsheet tool was provided to the TWD separately in Microsoft Excel format. The cost for valve replacement has not been included in the list of CIP projects are part of this Master Plan. The TWD is investigating the true service life of the valves and methods to extend the service life.
9.0 Capital Improvement Planning
Once the recommended improvement projects were identified and preliminary implementation planning years established, Black & Veatch estimated the cost for each improvement project. Black & Veatch then adjusted the implementation date, in conjunction with the TWD through a series of workshops. The following section describes the unit costs established, the proposed capital improvement plan and the cash flow required to implement the improvements.
9.1 WATER MAIN UNIT COSTS
Black & Veatch worked with the TWD to prepare unit cost information and assumptions for the variety of types of water main improvements to be used to develop planning‐level opinions of probable project costs. The unit costs were based on the 2015 bid tab provided by the TWD on‐call contractor. Table 9‐1 summarizes the unit costs per diameter and items included in the unit cost are comprised of the following:
- ‐ Restoration: Type I and II, in and out of the street
- ‐ Pipe Material: PVC, Ductile Iron
- ‐ Pipework Additions over 2,450‐ft span: restraints, tees, sleeves, fire hydrant assemblies, valves, protection posts, meter services
- ‐ Markups: 30% Contingency and 15% Engineering Fee
Table 9‐1: Water Main Unit Costs
| Diameter (in) | Unit Cost with Contingency ($/LF) |
|---|---|
| 4 | $201.00 |
| 6 | $224.00 |
| 8 | $238.00 |
| 12 | $286.00 |
| 16 | $465.00 |
| 20 | $554.00 |
| 24 | $794.00 |
| 30 | $969.00 |
| 36 | $1,169.00 |
| 42 | $1,436.00 |
| 48 | $1,970.00 |
9.2 CAPITAL IMPROVEMENT PLAN
The non‐rehabilitation and replacement (R&R) portion of the distribution system capital improvement plan through 2035 includes 55 separate improvement projects at a total project cost of $129M, including a 2.5% inflation rate beginning in 2024 outside of the short‐term CIP. Black & Veatch provided detailed cost estimate assumptions for each project to TWD in a CIP spreadsheet file. Table 9‐2 summarizes the CIP per planning year.
Table 9‐2: Capital Improvement Plan Summary
| CIP # | PROJECT NAME | PROJECT DESCRIPTION | PROJECT TRIGGER | PROJECT TYPE | ANTICIPATED DESIGN YEAR | COSTS WITH INFLATION |
|---|---|---|---|---|---|---|
| Short Term Capital Improvement Projects through 2024 | $65,980,530 | |||||
| 2 | DLTWTF Discharge Pressure | Increase DLTWTF HSPS discharge pressure to 70 psi; slowly / incrementally | Min pressures | Operational / Controls | 2018 | $0 |
| 3 | RPS controls modifications | Modify the NWRPS, WTRPS and PCRPS to operate during peak demand periods rather than time of day | Increased reliance on DLTWTF HSPS | Operational / Controls | 2018 | $65,000 |
| 8 | Commercial Fire Flow Study | Perform an analysis of the required commercial fire flow needs be conducted and commercial fire flow corridors be identified | Fire Flow Demands | Study | 2018 | $50,000 |
| 11 | West Tampa and Palma Ceia Flow Meters | Install flow monitors on the effluent side of the West Tampa and Palma Ceia RPS’s and connect to the data historian | Data Collection | Operational / Controls | 2018 | $1,046,000 |
| 12 | RPS Power Monitors | Install power monitors on all RPS equipment and connect to the data historian | Data Collection | Operational / Controls | 2018 | $18,500 |
| 13 | DLTWTF Clearwell Groundwater Level Study | Collection of data related to the groundwater level on the site in anticipation of the design of a new clearwell structure | DLTWTF Blending Chamber, Clearwell and HSPS Upgrade Project | Capacity | 2018 | $50,000 |
| 14 | Water Quality Model Calibration Study | Collect water quality data throughout the system in order to conduct a calibration of the existing water quality model | Water Quality | Study | 2018 | $200,000 |
| 1 | IB, NW and MB Tank Inlet Sleeve Valves | Installation of sleeve valves with flow control functions at the inlet to the Interbay, Northwest and Morris Bridge Tanks | Three Pressure Zone Configuration | Capital: Operational flexibility | 2019 | $2,230,000 |
| 9 | South Tampa Check Valves | Install check valves along South Tampa Pressure Zone (along Gandy Blvd) | Fire Flow Demands | Resilience | 2019 | $957,000 |
| 4 | DLTWTF Blending Chamber, Clearwell and HSPS Upgrades | Demo 2.0 MG and 0.5 MG clearwells, convert 7.5 MG clearwell to blending chamber, install new 13.0 MG clearwell, demo pumps 1‐6 and install new 153 MGD HSPS | Sum of the MDDs for each pressure zone greater than 140 MGD | R&R and Expansion | 2020 | $59,500,000 |
| 16 | CP003 | 12‐inch; 5,392 feet 16‐inch; 200 feet | System Pressures | Capacity | 2020 | $1,872,000 |
Mid Term Capital Improvement Projects 2025 2030
| ID | Project | Description | Driver | Benefit | Year | Cost |
|---|---|---|---|---|---|---|
| 6 | Northeast (Nebraska) EST | Installation of a new EST in the north portion of the DLTWTF | DLTWTF Pressure Zone Demands greater than 130 MGD | Resilience | 2025 | $12,273,267 |
| 15 | R‐01 Hillsborough Ave WM | 6,000‐ft of 12‐inch pipe along Hillsborough Ave. | DLTWTF Pressure Zone Demands greater than 125 MGD | Resilience | 2025 | $9,401,986 |
| 17 | CP004 | 8‐inch; 3,546 feet 12‐inch; 4,219 feet | System Pressures | Capacity | 2025 | $2,651,842 |
| 19 | FF0‐01 | 12‐inch; 2,900 feet | Opportunistic | Fire Flow | 2025 | $1,059,583 |
| 20 | FF0‐02 | 12‐inch; 4,600 feet | Opportunistic | Fire Flow | 2025 | $1,720,452 |
| 22 | FF0‐04 | 12‐inch; 4,650 feet | Opportunistic | Fire Flow | 2025 | $1,753,214 |
| 25 | FF0‐07 | 12‐inch; 4,260 feet | Opportunistic | Fire Flow | 2025 | $1,588,942 |
| 26 | FF0‐08 | 8‐inch; 800 feet | Opportunistic | Fire Flow | 2025 | $253,130 |
| 41 | FF1‐06 | 6‐inch; 10 feet | Opportunistic | Fire Flow | 2025 | $2,194 |
| 42 | FF1‐07 | 12‐inch; 600 feet | Opportunistic | Fire Flow | 2025 | $229,023 |
| 21 | FF0‐03 | 12‐inch; 1,610 feet | Opportunistic | Fire Flow | 2026 | $617,162 |
| 23 | FF0‐05 | 12‐inch; 1,200 | Opportunistic | Fire Flow | 2027 | $467,727 |
| 24 | FF0‐06 | 16‐inch; 1 mile | Opportunistic | Fire Flow | 2028 | $3,495,922 |
| 27 | FF0‐09 | 12‐inch; 1,850 feet | Opportunistic | Fire Flow | 2029 | $769,257 |
| 28 | FF0‐10 | 12‐inch; 1,150 feet | Opportunistic | Fire Flow | 2029 | $477,470 |
| 29 | FF0‐11 | 8‐inch; 800 feet | Opportunistic | Fire Flow | 2029 | $278,524 |
| 30 | FF0‐12 | 8‐inch; 800 feet | Opportunistic | Fire Flow | 2029 | $278,524 |
| Mid Term Capital Improvement Projects 2025 2030 subtotal | $35,664,974 | |||||
| No. | Project ID | Description | Driver / Condition | Category | Year | Cost |
|---|---|---|---|---|---|---|
| 31 | FF0‐13 | 12‐inch; 900 feet | Opportunistic | Fire Flow | 2029 | $371,365 |
| Long Term Capital Improvement Projects 2030 2035 | $62,886,623 | |||||
| 5 | HSPS Expansion | Install additional pumping capacity at the new HSPS building total new capacity = 167 MGD | DLTWTF Pressure Zone Demands greater than 153 MGD | Performance Criteria: Pump Capacity | 2030 | $4,891,280 |
| 10 | Hillsborough County Interconnect | Interconnect with Hillsborough County in the northwest portion of the system either directly into the distribution system or the Northwest Tank | DLTWTF Pressure Zone Demands greater than 140 MGD | Resilience | 2030 | $1,753,928 |
| 32 | FF0‐14 | 12‐inch; 100 feet | Opportunistic | Fire Flow | 2030 | $54,365 |
| 33 | FF0‐15 | 12‐inch; 2,800 feet | Opportunistic | Fire Flow | 2030 | $1,182,059 |
| 34 | FF0‐16 | 12‐inch; 450 feet | Opportunistic | Fire Flow | 2030 | $190,216 |
| 35 | FF1‐00 | 8‐inch; 310 feet | Opportunistic | Fire Flow | 2030 | $108,695 |
| 36 | FF1‐01 | 16‐inch; 140 feet | Opportunistic | Fire Flow | 2030 | $96,345 |
| 37 | FF1‐02 | 16‐inch; 10 feet | Opportunistic | Fire Flow | 2030 | $11,113 |
| 43 | FF2‐00 |
8‐inch; 500 feet
12‐inch; 650 feet
|
Opportunistic | Fire Flow | 2031 | $459,343 |
| 44 | FF2‐01 | 8‐inch; 2,500 feet | Opportunistic | Fire Flow | 2031 | $904,767 |
| 45 | FF2‐02 | 8‐inch; 1,300 feet | Opportunistic | Fire Flow | 2031 | $473,263 |
| 46 | FF2‐03 | 8‐inch; 300 feet | Opportunistic | Fire Flow | 2031 | $108,822 |
| 47 | FF2‐04 | 8‐inch; 50 feet | Opportunistic | Fire Flow | 2031 | $22,789 |
| 48 | FF2‐05 | 6‐inch; 2,200 feet | Opportunistic | Fire Flow | 2032 | $770,092 |
| 49 | FF2‐06 | 12‐inch; 20 feet | Opportunistic | Fire Flow | 2032 | $14,261 |
| 50 | FF2‐07 | 8‐inch; 20 feet | Opportunistic | Fire Flow | 2032 | $12,963 |
| 51 | FF2‐08 | 8‐inch; 2,300 feet | Opportunistic | Fire Flow | 2032 | $855,658 |
| 52 | FF2‐09 | 8‐inch; 1,350 feet | Opportunistic | Fire Flow | 2032 | $499,134 |
| 53 | FF2‐10 | 6‐inch; 700 feet | Opportunistic | Fire Flow | 2033 | $248,395 |
| Project No. | Project ID | Project Description | Project Driver | Planning Year | Estimated Cost |
|---|---|---|---|---|---|
| 7 | Southeast (Broadway) EST | Installation of a new EST in the south portion of the DLTWTF | DLTWTF Pressure Zone Demands greater than 135 MGD | 2035 | $9,918,429 |
| 18 | CP005 | 12‐inch; 2 miles | System Pressures | 2035 | $5,369,060 |
| 54 | BBD Parallel Water Main |
12‐inch; 1,650 feet 30‐inch; 14,106 feet 36‐inch; 8,949 feet |
When the MB TBW Interconnect is used for normal daily water supply | 2035 | $33,598,658 |
9.3 CASH FLOW
The CIP for distribution system improvements involves a number of significant capital cost projects through the 2035 planning horizon. In addition, there are a number of distribution system pipeline R&R projects that have been prioritized for implementation throughout the planning horizon and beyond. Figure 9‐1 illustrates the required cash flow over the planning horizon assuming all design costs are encumbered at the beginning of the design period and all construction costs are encumbered at the beginning of the construction period. This method of encumbering costs increases the variable appearance of the graphs. Figure 9‐2 provides the same information but at a different scale, and without the R&R costs, to more clearly show the breakdown of the costs for each year.