


CITY OF TAMPA GREENHOUSE GAS INVENTORY GOVERNMENT OPERATIONS AND CITY-WIDE
INVENTORY YEAR 2019
PRINCIPAL AUTHORS
Sandra Garren, Ph.D.
Greenhouse Gas Inventory and Reduction Strategy Lead Investigator
Visiting Assistant Research Professor
School of Architecture and Community Design
The Florida Center for Community Design Research
ASSISTING AUTHORS
William Cook, M. Arch, MUCD
Graduate Research Assistant
School of Architecture and Community Design
The Florida Center for Community Design Research
REVIEWING EDITORS
Taryn Sabia, Ed.M., M. Arch, MUCD
Director and Research Associate Professor
School of Architecture and Community Design
The Florida Center for Community Design Research
Maggie Winter, AIA, LEED GA
Research Associate
School of Architecture and Community Design
The Florida Center for Community Design Research
Whit Remer
Sustainability & Resilience Officer
City of Tampa
CITY OF TAMPA GREENHOUSE GAS INVENTORY GOVERNMENT OPERATIONS AND CITY-WIDE
Table of Contents
- TECHNICAL SUMMARY ............................................. 9
- ES.1 ABOUT THE GREENHOUSE GAS INVENTORY .......... 9
- ES.2 GOVERNMENT GREENHOUSE GAS INVENTORY .......... 10
- Key Findings .................................................. 11
- ES.3 CITY-WIDE GREENHOUSE GAS INVENTORY .......... 13
- Key Findings .................................................. 15
- ES.4 CONCLUSIONS AND RECOMMENDATIONS .......... 18
- ES.4.1 Opportunities ........................................... 18
- ES.4.1.1 Shift to Renewable Energy .......... 18
- ES.4.1.2 Conservation and Improved Efficiencies .......... 19
- ES.4.1.3 Offset Emissions for Renewables and in the Urban Forest .......... 19
- ES.4.1.4 Lead by Example Initiatives .......... 19
- ES.4.2 Recommandations .......... 19
- ES.4.1 Opportunities ........................................... 18
- 1.0 INTRODUCTION .......... 21
- 1.1 BACKGROUND .......... 21
- 1.2 GREENHOUSE GAS ACCOUNTING AND REPORTING PRINCIPLES .......... 22
- 1.2.1 About Greenhouse Gases .......... 22
- 1.2.2 Greenhouse Gas Accounting Principles .......... 23
- 1.2.3 Greenhouse Gas Framework (From Global to Local) .......... 25
- 1.2.4 City of Tampa Greenhouse Gas Methodological Approach .......... 30
- 1.3 GREENHOUSE GAS INVENTORY STRUCTURE .......... 31
- 2.0 ABOUT THE CITY OF TAMPA .......... 32
- 2.1 CITY OF TAMPA LAND USE .......... 32
- 2.2 POPULATION TRENDS .......... 35
- 2.3 CITY OF TAMPA GOVERNMENT STRUCTURE .......... 37
- 3.0 GOVERNMENT OPERATIONS GREENHOUSE GAS INVENTORY .......... 39
- 3.1 GOVERNMENT OPERATIONS GREENHOUSE GAS EMISSIONS OVERVIEW .......... 39
- 3.1.1 Government Operations Total and Categorical Greenhouse Gas Emissions .......... 39
- 3.1.2 Government Operations Greenhouse Gas Emissions by Department .......... 41
- 3.1.3 Government Operations Greenhouse Gas Forecast .......... 43
- 3.1.4 Key Findings: Government Operations GHG Emissions .......... 43
- 3.2 GOVERNMENT GREENHOUSE GAS EMISSIONS BY CATEGORY .......... 44
- 3.1 GOVERNMENT OPERATIONS GREENHOUSE GAS EMISSIONS OVERVIEW .......... 39
3.2.1 Government Electricity
- 3.2.1.1 Government Purchased Electricity
- 3.2.1.2 Government Electricity Production from McKay Bay Refuse-to-Energy Facility
- 3.2.1.3 Government Electricity Production from Solar Installations
- 3.2.1.3 Key Findings: Government Electricity
3.2.2 Government Purchased Natural Gas
- 3.2.2.1 Key Findings: Government Natural Gas
3.2.3 Government Fleet
- 3.2.3.1 Key Findings: Government Fleet
3.2.4 Government Solid Waste
- 3.2.4.1 Government Solid Waste Combustion
- 3.2.4.2 Government Solid Waste Landfill
- 3.2.4.3 Avoided Greenhouse Gas Emissions from Recycling
- 3.2.4.3 Key Findings: Government Solid Waste
3.2.5 Government Water and Wastewater
- 3.2.5.1 Government Water
- 3.2.5.2 Government Wastewater
- 3.2.5.3 Key Findings: Government Water and Wastewater
3.3 GOVERNMENT GHG EMISSIONS FROM ENERGY SOURCES
- 3.3.1 Key Messages: Government Operations Energy Mix
4.0 CITY-WIDE GREENHOUSE GAS INVENTORY
- 4.1 CITY-WIDE GREENHOUSE GAS EMISSIONS OVERVIEW
- 4.1.1 City-wide Total and Categorical GHG Emissions
- 4.1.2 City-Wide Per Capita GHG Emissions
- 4.1.3 City-Wide Greenhouse Gas Emissions by Sector
- 4.1.4 City-Wide Greenhouse Gas Emissions by Gas
- 4.1.5 City-Wide Greenhouse Gas Forecast
- 4.1.6 Key Findings: Overall City-Wide Greenhouse Gas Emissions
4.2 CITY-WIDE GHG EMISSIONS BY CATEGORY
- 4.2.1 City-Wide Electricity
- 4.2.1.1 City-Wide Electricity Consumption
- 4.2.1.2 City-Wide Electricity from McKay Bay Refuse-to-Energy Facility
- 4.2.1.3 City-Wide Electricity from Solar
- 4.2.1.4 Key Findings: City-Wide Electricity
- 4.2.2 City-Wide Natural Gas
- 4.2.2.1 City-Wide Natural Gas Consumption
- 4.2.2.3 Key Findings: City-Wide Natural Gas
- 4.2.3 City-Wide Transportation
- 4.2.3.1 City-Wide On-Road Transportation
4.2.3.2 City-Wide Off-Road Transportation
794.2.3.3 City-Wide Marine Transportation
804.2.3.4 City-Wide Air Transportation
814.2.3.5 City-Wide Rail Transportation
824.2.3.6 Key Findings: City-Wide Transportation
844.2.4 City-Wide Municipal Solid Waste
844.2.5 City-Wide Water and Wastewater
854.2.6 City-Wide Industrial Processes and Product Use
854.2.6.1 Industrial Processes
854.2.6.2 Industrial Product Use
854.2.7 City-Wide Land Use
854.2.7.1 City-Wide Fertilizer Applications
884.2.7.2 City-Wide Forested Land
894.2.7.3 Key Findings: City-Wide Land Use
904.3 CITY-WIDE GREENHOUSE GAS EMISSIONS BY SECTOR
914.3.1 City-Wide Commercial Energy Sector
954.3.2 City-Wide Residential Energy Sector
974.3.3 City-Wide Industrial Energy Sector
974.3.4 City-Wide Governmental Energy Sector
984.3.5 Key Findings: Energy Sector Analysis
985.0 CONCLUSIONS AND RECOMMENDATIONS
995.1 Opportunities
995.1.1 Shift to Renewable Energy
995.1.2 Conservation and Improved Efficiencies
995.1.3 Offset Emissions for Renewables and in the Urban Forest
1005.1.4 Lead by Example Initiatives
1005.2 Recommendations
100LIST OF APPENDICES
- A City of Tampa Materiality Assessment
- B TECO Energy Analysis
LIST OF FIGURES
| Figure | Title |
|---|---|
| Figure ES-1 | City of Tampa Location and Land Use Maps |
| Figure ES-2 | Government Operations Greenhouse Gas Emissions by Category (2019) |
| Figure ES-3 | City-Wide Greenhouse Gas Emissions (2009 to 2019) |
| Figure ES-4 | City-Wide Net and Per Capita Greenhouse Gas Emissions (2009 to 2019) |
| Figure ES-5 | City-Wide Greenhouse Gas Emissions Business as Usual Forecast (2020 to 2050) |
| Figure 1-1 | Greenhouse Gas Sources and Scopes |
| Figure 1-2 | Guiding Greenhouse Gas Accounting Documents |
| Figure 1-3 | Global Carbon Cycle |
| Figure 1-4 | Global Methane Cycle |
| Figure 1-5 | Global Nitrogen/Nitrous Oxide Cycle |
| Figure 1-6 | United States and Florida Greenhouse Gas Emissions and Sinks (2000 to 2019) |
| Figure 2-1 | Simplified Land Uses in the City of Tampa (2017) |
| Figure 2-2 | City of Tampa Land Use Change (2009 to 2017) |
| Figure 2-3 | Government Parcels in the City of Tampa |
| Figure 2-4 | City of Tampa Population Historic and Projection (1990 to 2050) |
| Figure 2-5 | Geospatial Distribution of Population Growth in the City of Tampa and Surrounding Hillsborough County (2020 to 2040) |
| Figure 3-1 | Government Operations Greenhouse Gas Emissions by Category (2019) |
| Figure 3-2 | Government Operations Greenhouse Gas Emissions by Department (2019) |
| Figure 3-3 | Forecasted Greenhouse Gas Emissions from Government Operations (2020 to 2050) |
| Figure 3-4 | Electricity Consumption and Greenhouse Gas Emissions from Government Operations (2019) |
| Figure 3-5 | Electricity Consumption from Government Operations by Facility (2019) |
| Figure 3-6 | Top 10 Electricity Consuming Buildings in Government Operations (2019) |
| Figure 3-7 | Natural Gas Consumption from Government Operations (2009 and 2019) |
| Figure 3-8 | Natural Gas Consumption from Government Operations by Department (2009 and 2019) |
| Figure 3-9 | Greenhouse Gas Emissions from On-Road Transportation (2019) |
| Figure 3-10 | Vehicle Miles Traveled by Department (2019) |
| Figure 3-11 | Solid Waste Facilities and Generation by Disposal Method (2014 to 2020) |
| Figure 3-12 | Greenhouse Gas Emissions from Solid Waste by Facility (2009 and 2019) |
| Figure 3-13 | McKay Bay Refuse-to-Energy Greenhouse Gas Emissions (2010 to 2019) |
| Figure 3-14 | Tons of Landfilled Municipal Solid Waste (2009 to 2019) |
| Figure 3-15 | Water Deliveries to the City of Tampa from Tampa Bay Water (TBW) (2000 through 2020) |
| Figure 3-16 | Fugitive Greenhouse Gas Emissions from Wastewater in the City of Tampa (2010 to 2019) |
| Figure 3-17 | Energy Mix from Government Operations (2019) |
| Figure 4-1 | City-Wide Net Greenhouse Gas Emissions Compared to Population (2009 to 2019) |
| Figure 4-2 | City-Wide Categorical Greenhouse Gas Emissions (2009 and 2019) |
| Figure 4-3 | City-Wide Per Capita Greenhouse Gas Emissions (2009 and 2019) |
| Figure 4-4 | City-Wide Greenhouse Gas Emissions by Sector (2009 and 2019) |
| Figure 4-5 | Greenhouse Gas Emissions by Gas (2019) |
| Figure 4-6 | Greenhouse Gas Emissions Forecast (2040) under Business as Usual (BAU) in the City of Tampa |
| Figure 4-7 | City-Wide Electricity Consumption by Sector (2009 to 2019) |
LIST OF TABLES
- Table 1-1 Greenhouse Gases, Sources, and Global Warming Potentials
- Table 1-2 Greenhouse Gas Accounting Specifications for the City of Tampa Inventory
- Table 2-1 Population in the City of Tampa and Florida (2009 to 2050)
- Table 2-2 City of Tampa Departments, Operations, and Relationship to GHG Inventory
- Table 3-1 Greenhouse Gas Emissions from Government Operations by Category (2009 and 2019)
- Table 3-2 Electricity Consumption and Greenhouse Gas Emissions from Government Operations, by Department (2019)
- Table 3-3 On-Road Vehicle Inventory from Government Operations (2019)
- Table 3-4 On-Road and Off-Road Vehicle Greenhouse Gas Emissions, in mtCO2e (2019)
- Table 3-5 Off-Road Hours of Use and Greenhouse Gas Emissions from Government Operations (2019)
- Table 4-1 City-Wide Greenhouse Gas Emissions and Sinks (2009 to 2019)
- Table 4-2 Per Capita Greenhouse Gas Emission City Comparisons
- Table 4-3 City-Wide Greenhouse Gas Emissions from Industrial Product Use (2005 to 2019)
- Table 4-4 Urban Land Use Change in the City of Tampa (2009 and 2017)
LIST OF FIGURES
- Figure 4-8 City-Wide Electricity Consumption by Zip Code (2019)
- Figure 4-9 City-Wide Electricity Consumption and Greenhouse Gas Emissions (2009 to 2019)
- Figure 4-10 Avoided Greenhouse Gas Emissions from Rooftop Solar in the City of Tampa (2019)
- Figure 4-11 Natural Gas Consumption by Zip Code (2019)
- Figure 4-12 City-Wide Natural Gas Consumption and Greenhouse Gas Emissions (2009 to 2019)
- Figure 4-13 City-Wide Greenhouse Gas Emissions from Transportation by Sub-Category (2009 to 2019)
- Figure 4-14 Regional Road System and Lane Miles in the City of Tampa
- Figure 4-15 City-Wide Greenhouse Gas Emissions from On-Road Transportation (2009 and 2019)
- Figure 4-16 City-Wide Greenhouse Gas Emissions from Off-Road Transportation (2009 to 2019)
- Figure 4-17 City-Wide Greenhouse Gas Emissions from Marine Transportation (2009 to 2019)
- Figure 4-18 Tampa International Airport (TIA) Enplaned Passenger Trends for 2010 and 2019
- Figure 4-19 City-Wide Greenhouse Gas Emissions from Air Transportation (2009 to 2019)
- Figure 4-20 Rail Transportation in the City of Tampa, Existing and Planned
- Figure 4-21 City-Wide Greenhouse Gas Emissions from Rail Transportation (2009 to 2019)
- Figure 4-22 Generalized Land Uses in the City of Tampa (2017)
- Figure 4-23 Land Use by Acreage in the City of Tampa (2017)
- Figure 4-24 Canopy Cover of the Urban Forest in the City of Tampa (2016)
- Figure 4-25 Carbon Dioxide Sequestered from Tampa’s Urban Forest (2006 and 2016)
- Figure 4-26 City-Wide Greenhouse Gas Emissions by Sector (2009 and 2019)
- Figure 4-27 City-Wide Greenhouse Gas Emissions from the Energy Sector (2009 and 2019)
- Figure 4-28 Greenhouse Gas Emissions from Energy Sectors by Energy Type (2009 and 2019)
- Figure 4-29 Distribution of Energy Consumption by Sector by Zip Code (2019)
- Figure 4-30 Commercial Electricity and Natural Gas Consumption by Zip Code (2019)
- Figure 4-31 Commercial Breakdown of Building Area and Type (2019)
- Figure 4-32 Residential Electricity and Natural Gas Consumption by Zip Code (2019)
- Figure 4-33 Industrial Electricity and Natural Gas Consumption by Zip Code (2019)
- Figure 4-34 Government Electricity and Natural Gas Consumption by Zip Code (2019)
LIST OF ACRONYMS
| Acronym | Definition |
|---|---|
| CFC | Chlorofluorocarbon |
| CH4 | Methane |
| CO2 | Carbon dioxide |
| EECP | Energy Efficiency and Conservation Plan |
| EPA | Environmental Protection Agency |
| FLIGHT | Facility Level Information on Greenhouse Gases Tool |
| FLUCCS | Florida Land Use and Cover Classification System |
| FRCC | Florida Reliability Coordinating Council |
| GCC | Global climate change |
| GHG | Greenhouse gas |
| GHGRP | Greenhouse Gas Reporting Program |
| GWP | Global warming potential |
| HFC | Hydrofluorocarbon |
| ICLEI | Local Governments for Sustainability |
| IPCC | Intergovernmental Panel on Climate Change |
| KWH | Kilowatt hour |
| MMBTU | Million british thermal units |
| mtCO2e | Metric tons (tonnes) of carbon dioxide equivalent |
| MSW | Municipal Solid Waste |
| MWH | Megawatt hour |
| N2O | Nitrous oxide |
| ODS | Ozone depleting substance |
| PFC | Perfluorocarbon |
| PV | Photovoltaic |
| RFE | Refuse-to-Energy |
| SWFWMD | Southwest Florida Water Management District |
| TBW | Tampa Bay Water |
| TIA | Tampa International Airport |
| WRI | World Resources Institute |
TECHNICAL SUMMARY
CITY OF TAMPA GREENHOUSE GAS INVENTORY AT A GLANCE
ES.1 ABOUT THE GREENHOUSE GAS INVENTORY
This City of Tampa Greenhouse Gas (GHG) Inventory updates and significantly expands upon the prior GHG Inventory (2011 Energy Efficiency and Conservation Plan). The GHG Inventory accounts for both City of Tampa Government Operations (Government) and for the entire City of Tampa (City-Wide) for calendar year 2019 with GHG emissions forecasted to 2050. It is disaggregated by GHG category (i.e., energy, transportation, solid waste, water/wastewater, and land use) and includes both GHG emission sources and sinks. GHG methodology used in this inventory follows the most robust technical standard for GHG accounting, The Global Protocol, which is guided by five key principles: Relevance, Completeness, Consistency, Transparency, and Accuracy.
The City of Tampa is located in Hillsborough County in the Tampa Bay Region (Figure ES-1). The City is surrounded by suburban development and is 72 percent urbanized (i.e., residential, commercial, and related infrastructure). Tampa increased its population by 17 percent, faster than the State (15 percent), but slower than unincorporated Hillsborough County (22 percent) from 2010 to 2020. Tampa is expected to grow by over 100,000 people by the year 2050.
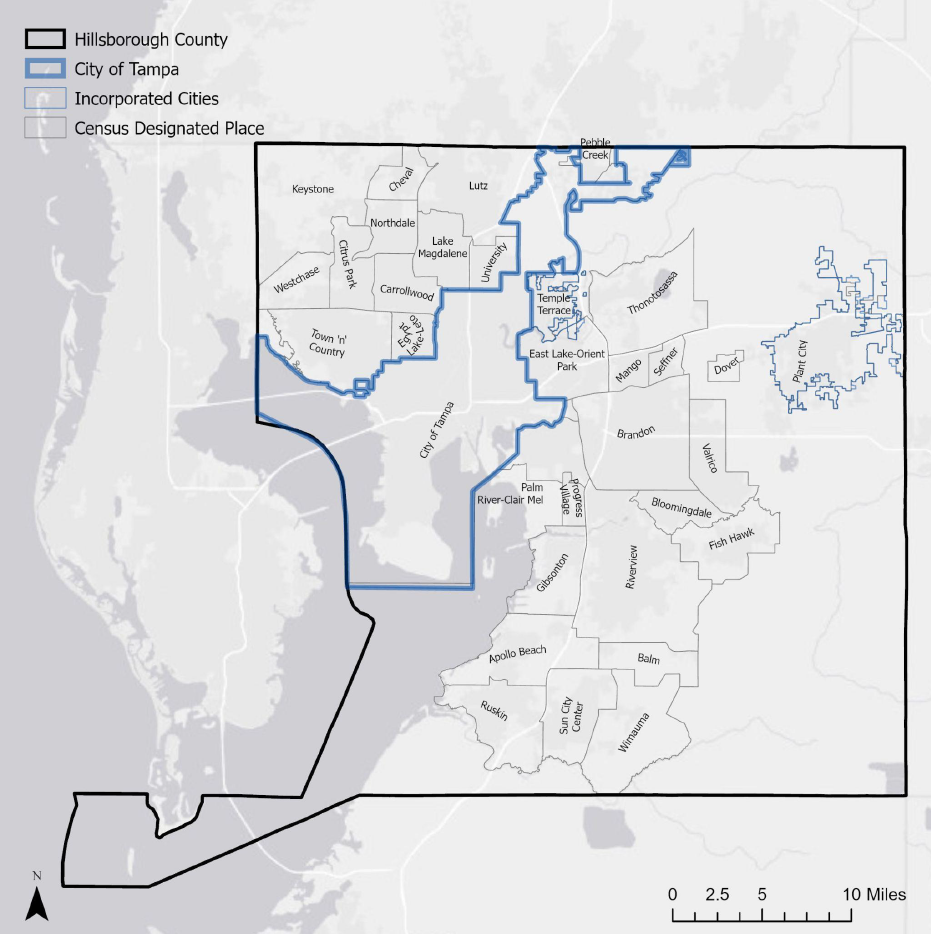
Data Sources: Jurisdictional boundaries obtained from US Census and land uses from the SWFWMD.
ES.2 GOVERNMENT GREENHOUSE GAS INVENTORY
The City of Tampa provides government services to nearly 400,000 residents. GHG emissions from these services resulted in over 234,084 metric tons of carbon dioxide equivalents (mtCO2e) in 2019 (Figure ES-2). The majority of these emissions were from solid waste since the City of Tampa has operational control of all solid waste generated in the City, followed by electricity, wastewater, and fleet.

| GHG Category | 2009 GHG Emissions (mtCO2e) | 2019 GHG Emissions (mtCO2e) |
|---|---|---|
| Electricity Consumption | 31,314 | 75,315 |
| Natural Gas Consumption | 5,106 | 2,987 |
| Vehicle Fleet | 26,629 | 9,974 |
| Municipal Solid Waste | 134,169 | 138,317 |
| Water and Wastewater | 35,681 | 7,491 |
| Employee Commute* | 13,416* | * |
| Emission Total | 232,899** | 234,084 |
Figure ES-2. Government Operations Greenhouse Gas Emissions by Category (2019)
*Employee commuting data was not available for 2019. Employee commute data not included in 2019.
**2009 emissions were obtained from a former GHG inventory and are not directly comparable with 2019 emissions given differences in data availability and methodological approach.
GOVERNMENT OPERATIONS GREENHOUSE GAS INVENTORY
Key Findings
Overall Findings
- Total emissions from government operations are 234,084 mtCO2e.
- By category, over half of government emissions are from management of municipal solid waste (59 percent) followed by electricity (32 percent), wastewater (3.2 percent), and vehicle fleet (4.3 percent).
- GHG emissions are expected to increase as the population continues to grow.
Electricity
- Electricity emissions account for 32 percent of government operation GHG emissions.
- By department, Water and Wastewater have the highest electricity consumption, mostly from treating water supply.
- By building, the Tampa Convention Center was the highest electricity consumer, followed by police.
- 26 facilities represent 80 percent of the total electricity consumption in the City. Opportunities exist to reduce these emissions. The largest opportunity to reduce GHG emissions is in the water and wastewater processing.
- Electricity is produced at the McKay Bay Refuse-to-Energy facility. 20 MW of the 21.1 MW capacity is committed to Seminole Electric Cooperative by contract through 2026.
Natural Gas
- Natural gas purchased from TECO’s Peoples Gas represents a little more than one percent of total City GHG emissions.
- Natural gas is used at the Howard F. Curren Advanced Water Treatment Plant, to power 22 CNG solid waste vehicles, and to heat community pools and in fire stations.
- Natural gas powered Fleet operations account for less than two percent of total GHG government operation emissions.
Fleet
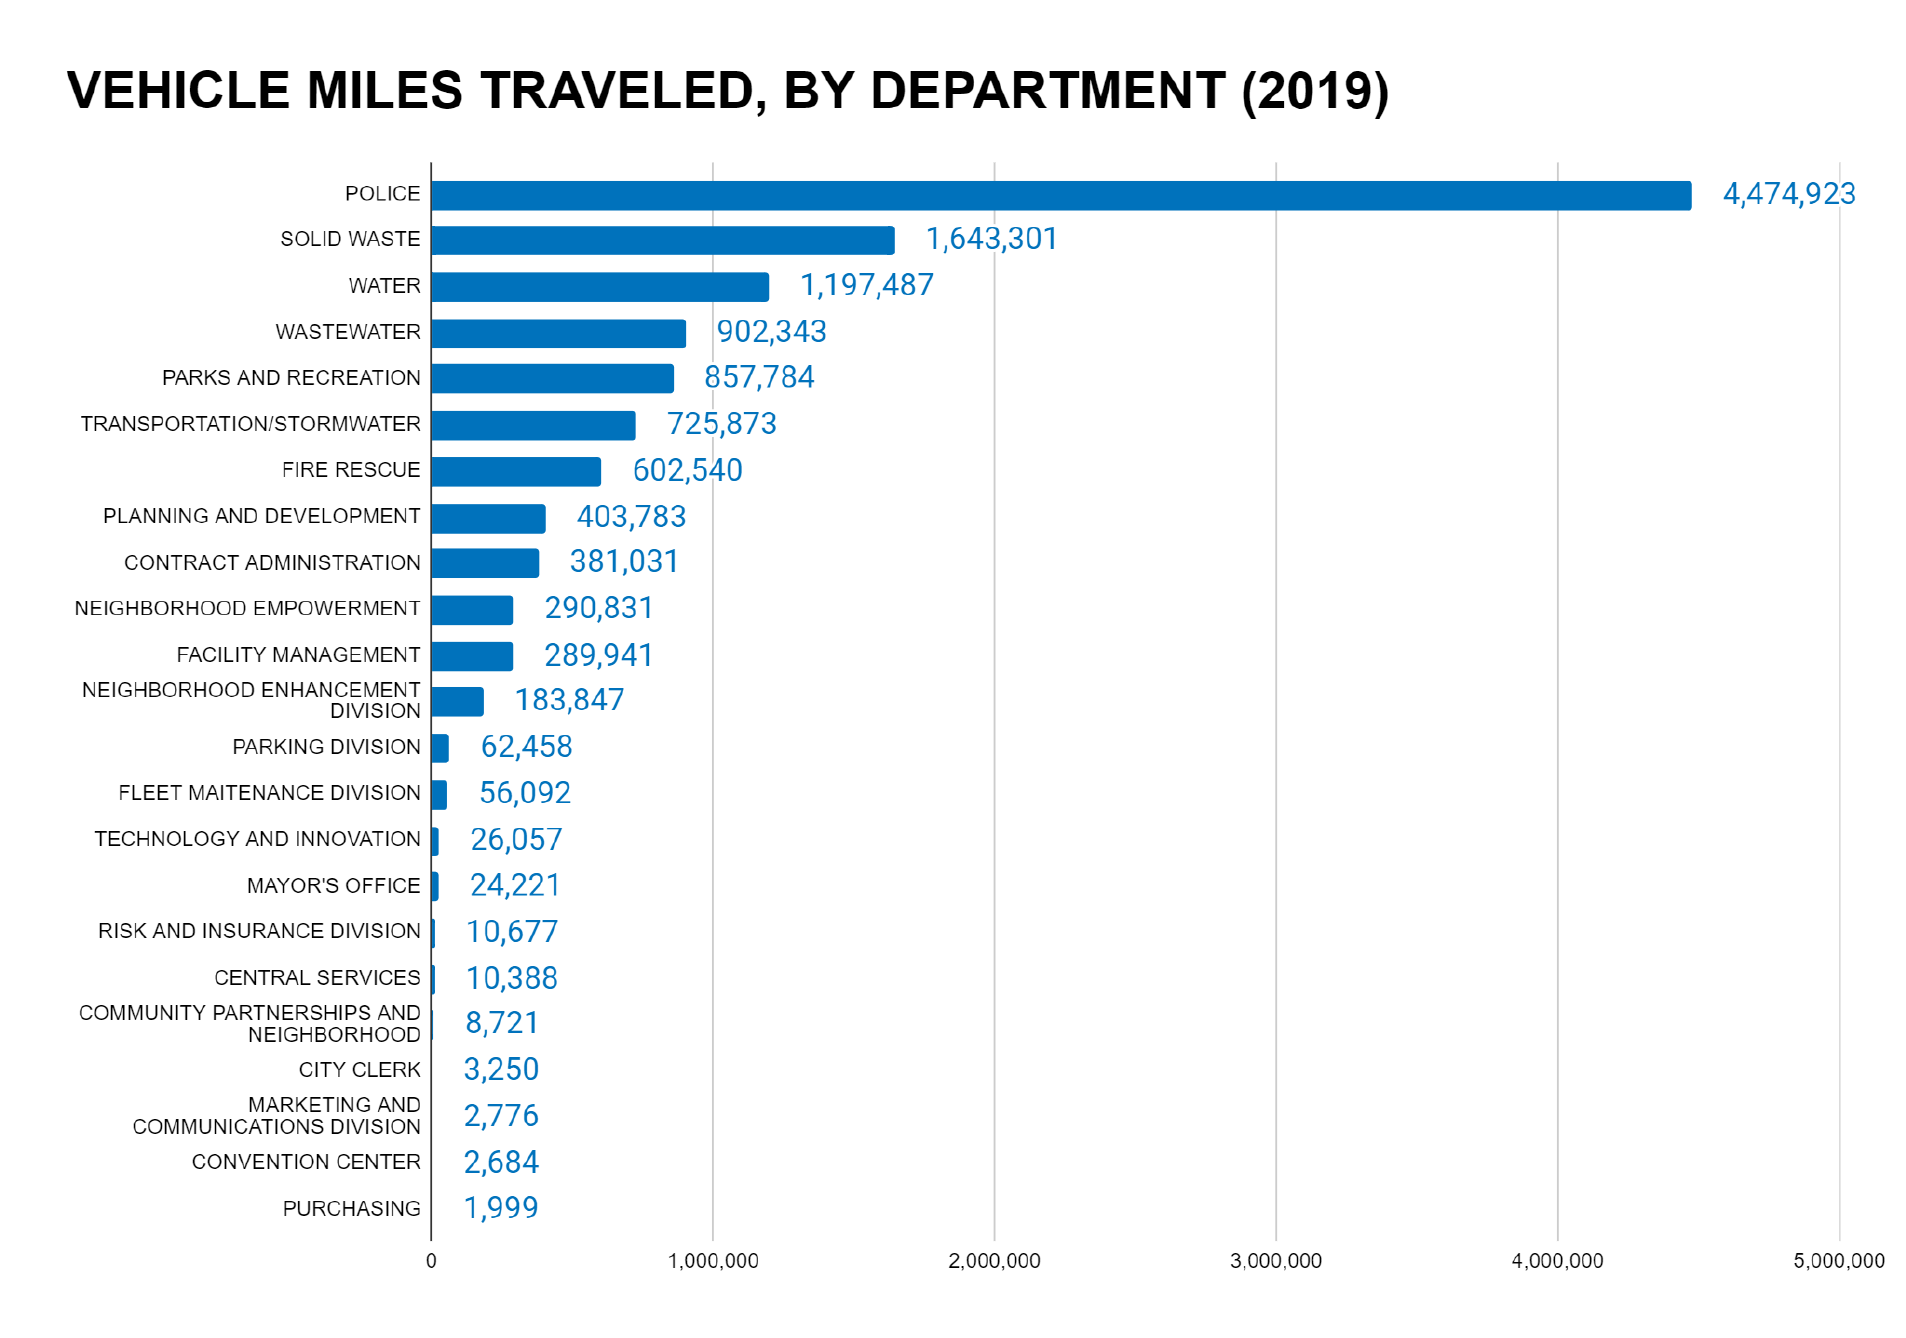
- The City of Tampa’s Police Department recorded the largest vehicle miles traveled of all the departments followed by solid waste, water, and wastewater departments.
- Fuel sources of the City’s Fleet are primarily from gasoline and diesel. The City acquired 22 CNG vehicles in 2013. CNG emits fewer GHG emissions than gasoline or diesel; thus, these replacements and other alternative fuel vehicles will result in fewer GHG emissions.
Solid Waste
- Solid Waste comprises approximately 59 percent of government operation GHG emissions, due to the City having operational control of all city generated waste.
- The majority of the City’s waste is combusted at the McKay Bay Refuse-to-Energy (RTE) Facility, which has been operated by the City since it took over in 2020.
- Electricity generated at McKay Bay is sold to Seminole Electric Cooperative, who claim renewable energy credits for energy production.
- More waste is generated than can be combusted at the RTE plant and the overflow is sent to the Southeast County landfill located over 20 miles outside the City boundary. Total waste sent to the landfill has more than doubled from 2009 to 2019.
- Even with the increase in waste sent to the landfill, a reduction in GHG emissions was observed which is explained by the fact that Hillsborough County began flaring methane gas in late 2009. Flaring emits less GHGs compared to no flaring.
- The recycling rate in the City of Tampa has decreased from approximately 4.5 percent in 2009 to 2.5 percent in 2019. Opportunities exist to increase the recycling rate which would result in fewer GHG emissions from the landfill and by avoiding fuel consumption from trucking the waste.
Water/Wastewater
- The City of Tampa is responsible for supplying clean water and treating wastewater within City limits. These activities are energy intensive, with most GHG emissions coming from electricity and accounted for in the energy category.
- During times of water shortages, additional water is purchased from Tampa Bay Water. However, In recent years, no additional water was needed to supplement existing supplies. High GHG emissions are associated with imports from Tampa Bay Water and its desalination plant.
City of Tampa’s Energy Mix
- Over 80 percent of the City’s operation is powered from natural gas from TECO’s electricity grid.
- TECO continues to use coal in one of its generating units. The company’s total energy mix is approximately five percent coal.
- Gasoline and diesel fuel comprise a total of approximately 13 percent of the total energy mix.
- The City of Tampa has very little to no renewable energy sources in its energy mix.
ES.3 CITY-WIDE GREENHOUSE GAS INVENTORY
City-wide, GHG emissions total nearly 5.5 million mtCO2e in 2019 and have reduced by approximately 18 percent since 2009 (Figure ES-3). These reductions are primarily due to fuel transition (i.e., coal to natural gas) and other efficiency projects in the electricity sector and account for approximately 40 percent of these reductions. When including GHG emission sinks such as renewable energy, recycling, and increase in urban forests, net GHG emissions have reduced by 19 percent. Figure ES-4 shows that net GHG emissions have decreased while population has increased by 16 percent thus reducing per capita GHG emissions from 19 to 13 mtCO2e per person from 2009 to 2019. Key findings from the City-Wide GHG inventory are provided at the end of this section.
| Category | 2009 | 2019 | Percent Change |
|---|---|---|---|
| Energy | 4,342,596 | 2,611,325 | -39.87% |
| Transportation | 2,103,406 | 2,571,269 | 22.24% |
| Solid Waste | 134,169 | 138,317 | 15.99% |
| Water/Wastewater | 35,681* | 7,491* | * |
| Industrial | 151,237 | 222,275 | 46.97% |
| Land Use | 1,092 | 1,074 | -2.1% |
| Total GHG Emissions | 6,768,181 | 5,551,751 | -18% |
| Total GHG Sinks | -161,580 | -211,935 | 31.2% |
| Net GHG Emissions | 6,606,559 | 5,339,797 | -19.2% |
Figure ES-3. City-Wide Greenhouse Gas Emissions (2009 and 2019)
*Difference is likely from a methodological approach. See Section 3.2.5 for a discussion.
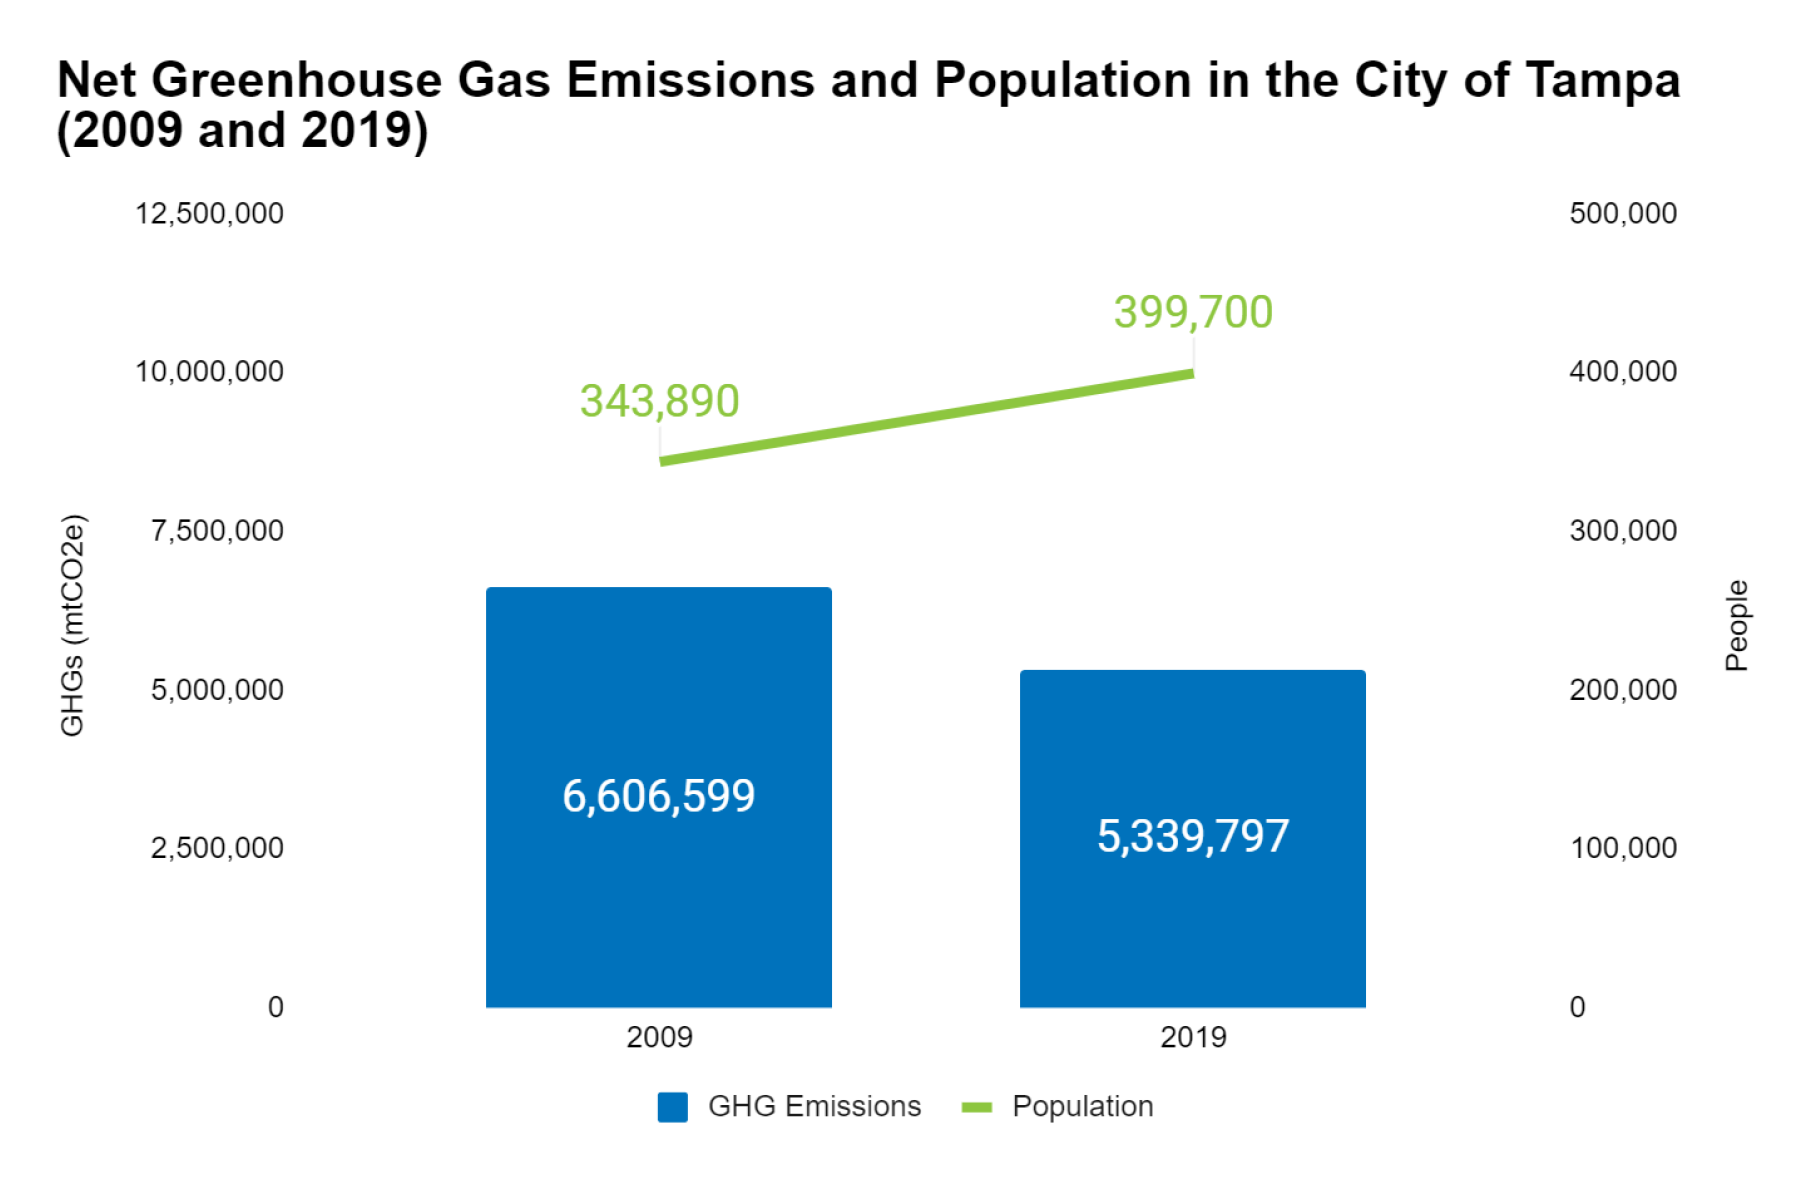
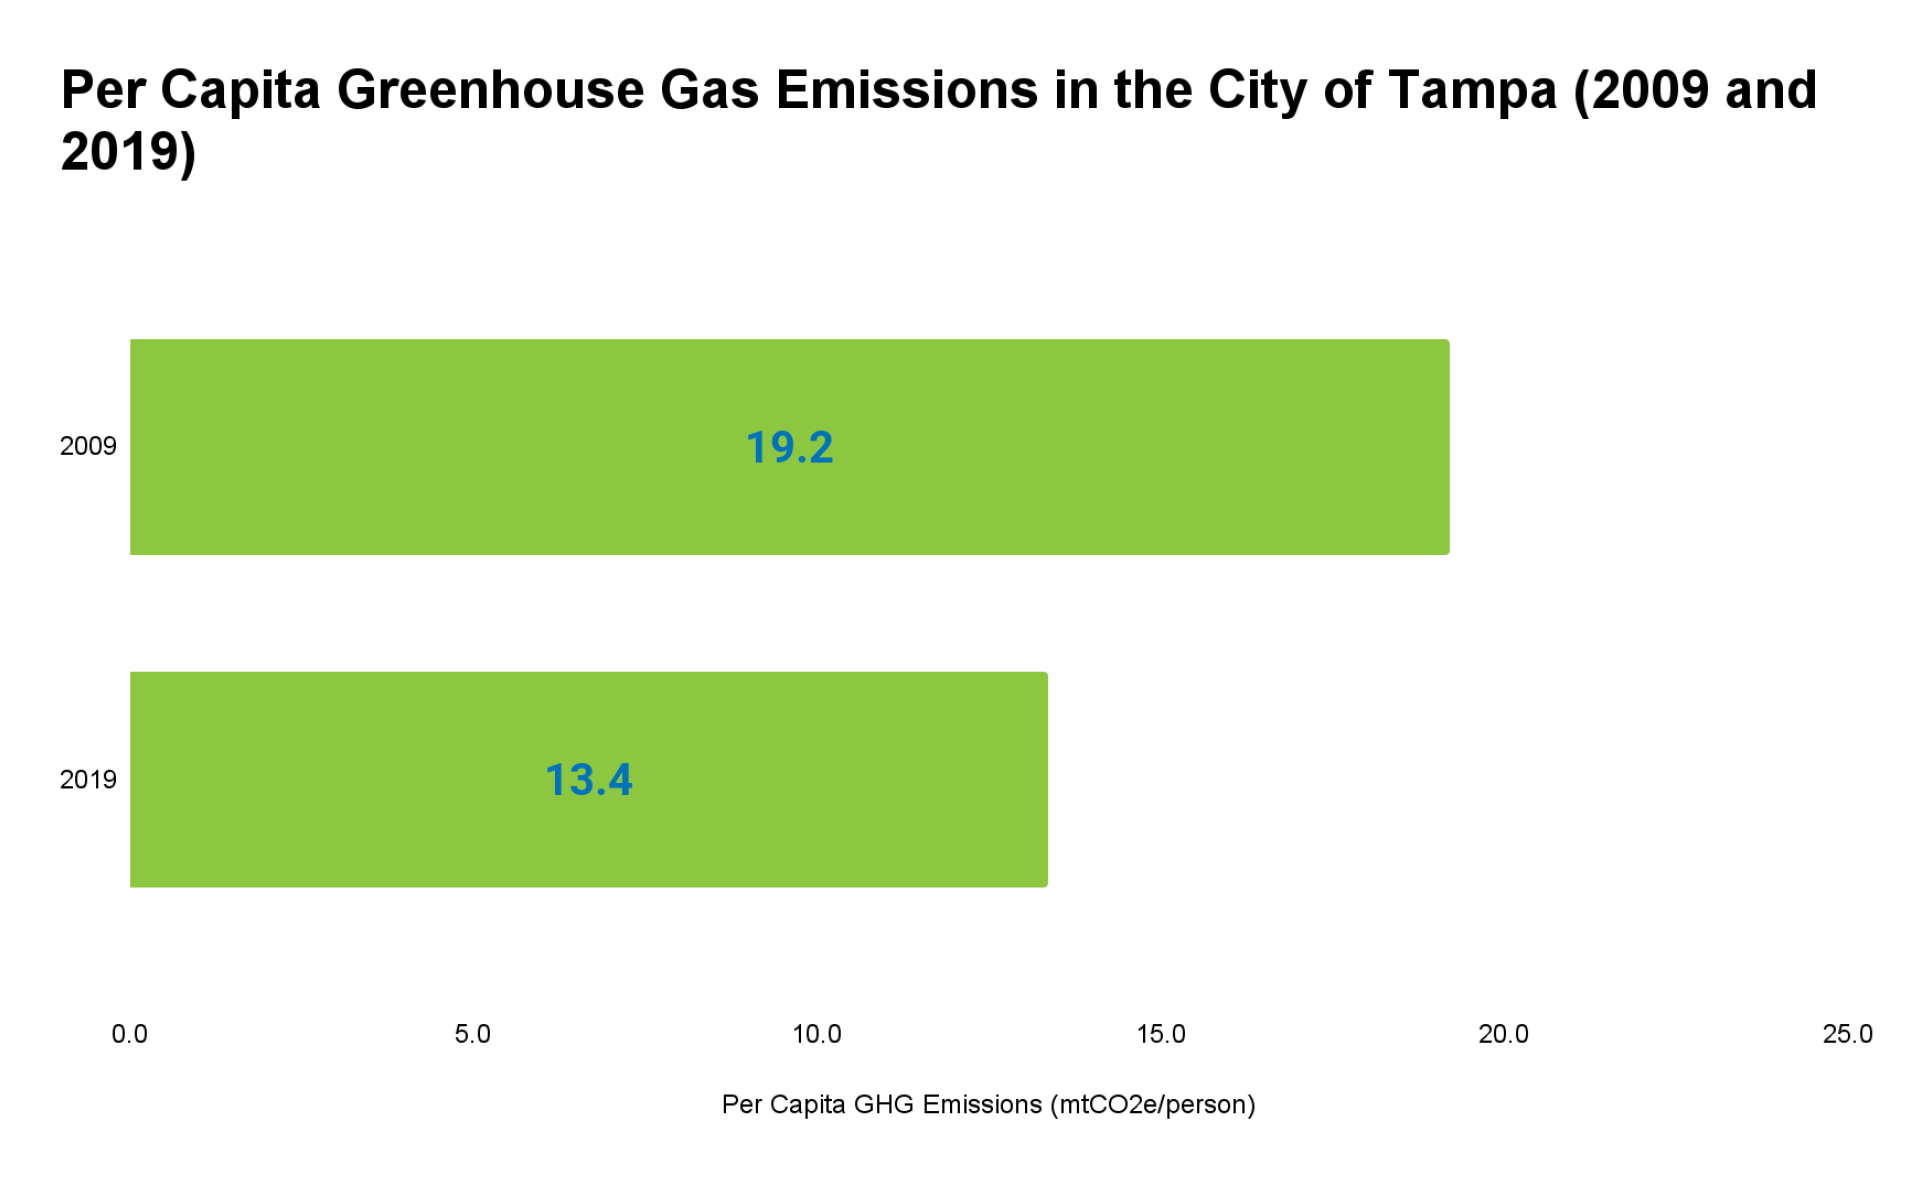
Figure ES-4. City-Wide Net and Per Capita Greenhouse Gas Emissions (2009 and 2019)
CITY-WIDE GREENHOUSE GAS INVENTORY
Key Findings
Overall Findings
- Net City-wide GHG emissions have decreased from approximately 6.6 to 5.3 million overall due mostly from fuel switching and other improvement projects from the electric utility (TECO).
- Per capita emissions have reduced from 19 to 13 mtCO2e per person from 2009 to 2019, which is comparable to other local governments in Florida. The Florida per capita emissions were reported exactly at 12.6 for calendar year 2018.
- Emissions from energy (mainly electrical) and transportation make up 95 percent of total emissions. Solid waste, industrial, and other categories contribute less than 5 percent of total emissions.
- By sector, on-road transportation, and commercial and residential energy are the largest contributors of GHG emissions.
- The majority of emissions are from burning of fossil fuels; therefore, carbon dioxide makes up over 96 percent of GHGs emitted in the City.
- GHG emissions have declined in the last 10 years, but that trend will not continue with a growing population. Reductions will be seen from the electric utility; however, emissions are expected to rise as more people consume more energy, water, and material goods.
Electricity
- Electricity consumption represents 43 percent of City-wide GHG emissions. The commercial sector is the largest consumer of electricity, followed closely by residential, with government and industrial consumption low in comparison.
- Electricity consumption increased approximately three percent City-wide from 2009 to 2019, while GHG emissions decreased by 23 percent. The City’s population increased 28 percent over the 10 year time period, meaning energy efficiency is increasing overall.
- Rooftop solar has increased significantly; however, the avoided emissions account for less than 0.01 percent of the electricity consumed in the City.
Natural Gas
- Natural gas was the primary energy source in power plants in 2019. Electricity generation demonstrated a sizable shift in GHG emissions, as is demonstrated by the transition from coal (2009) to natural gas (2019). These emissions are accounted for above in Section 4.2.1.
- Natural gas supplied to residential, commercial, industrial, and governmental customers is low in comparison to energy provided by electricity production; however, GHG emissions from these natural gas hookups plus fugitive emissions from natural gas leaks represent less than 0.5 percent.
Transportation
- Overall, GHG emissions from transportation account for 46 percent of all emissions, and have increased by 22 percent from 2009 to 2019.
- On-Road Transportation from automobiles, buses, and trucks represent the dominant source of GHG emissions City-wide with 12.4 percent increase in GHG emissions from 2009 to 2019.
- Off-Road Transportation is dominated by construction and landscaping as the main source of GHG emissions. GHG emissions have increased by 45 percent in this category.
- Marine Transportation GHG emissions are small in comparison; however, recreational boating and water taxis are increasing. GHG emissions from boating have increased by almost 500 percent.
- Aviation Transportation GHG emissions have decreased 16 percent from 2009 to 2019 even though the Tampa International Airport (TIA) has experienced a 34 percent increase in passenger travel from 2009 to 2019.
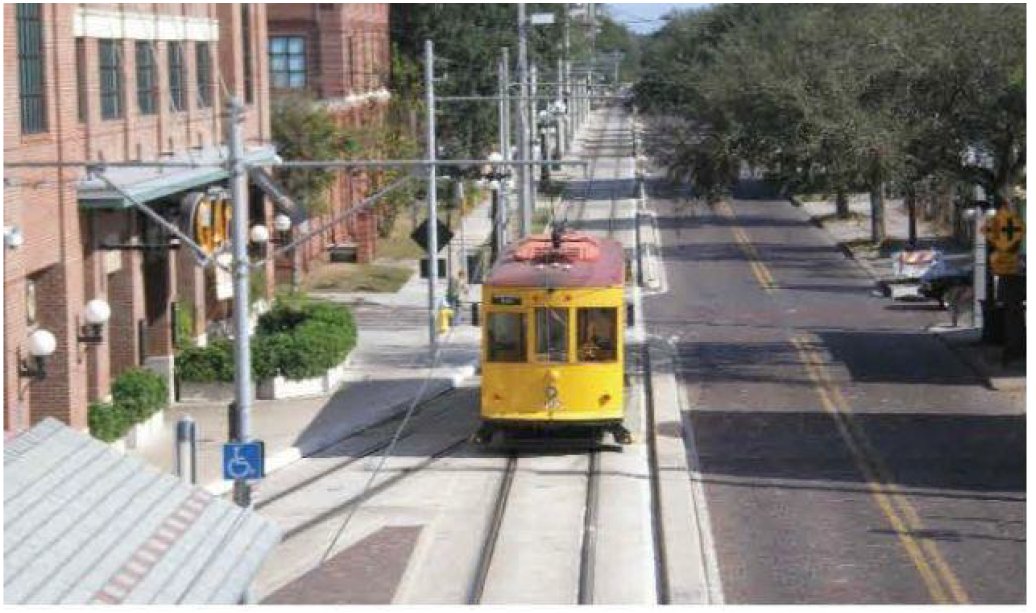
- Rail Transportation represents a small portion of the GHG emissions City-wide but has increased from 2009 to 2019. The majority of GHG emissions are derived from the CSX line that transports mostly industrial products and coal into the region. The City of Tampa has a streetcar that serves the downtown region, with connections planned to connect to the regions to the north (airport and USF) and to other neighborhoods across the City. More rail transportation would reduce GHG emissions from on-road transportation.
Solid Waste
- Solid waste comprises 2.5 percent of city-wide GHG emissions which is small compared to energy and transportation emissions. However, reducing waste generation and increasing recycling will have a large impact on reduced emissions in the transportation sector and increased recycling credits that offset total emissions.
- The majority of waste is combusted at the McKay Bay Refuse-to-Energy Facility and the City took over the facility in 2020.
- More waste is generated than can be combusted at the RTE plant and the overflow is sent to the Southeast County landfill located over 20 miles outside the city boundary. Total waste sent to the landfill has more than doubled from 2009 to 2019.
- Even with the increase in waste sent to the landfill, a reduction in GHG emissions was observed which is explained by the fact that Hillsborough County began flaring methane gas in late 2009. Flaring emits less GHGs compared to no flaring.
- The recycling rate in the City of Tampa has decreased from approximately 4.5 percent in 2009 to 2.5 percent in 2019.
Water/Wastewater
- The City of Tampa is responsible for supplying clean water and treating wastewater within City limits. These activities are energy intensive and most GHG emissions are from electricity which are accounted for in the energy category. Increased water conservation throughout the City and improved efficiencies in the water process will have a large impact on reducing GHG emissions.
- Fugitive GHG emissions from wastewater represent less than one percent of the total GHG
- emissions City-wide.
During times of water shortages, additional water is purchased from Tampa Bay Water. However, In recent years, no additional water was needed to supplement existing supplies. High GHG emissions are associated with imports from Tampa Bay Water and its desalination plant.
Industrial Processes and Industrial Products (IPPU)
- While there is industrial activity and GHG from industrial processes in the City of Tampa, these emissions are small in comparison to the energy and transportation sectors.
Agriculture, Forestry, and Other Land Uses (AFOLA)
- The City of Tampa is over 70 percent built out with the majority of land use in residential and commercial development. Converting natural land to urban uses results in both a reduction of carbon sequestration, particularly if the natural land is a forest, while also adding GHG emissions from electricity construction and increased transportation.
- Agricultural land uses in the City of Tampa have reduced significantly over the last decade. While some agricultural land remains, particularly in the northern region, the majority of agricultural uses are in the unincorporated surrounding county.
- Urban forests increased the amount of carbon stored from 2006 to 2016. Natural forests within the City remained small; however, they represent important carbon sinks.
Sectors
- On-road transportation is the largest GHG emission by sector with 35 percent of total GHG emissions City-wide.
- The vast majority of energy provided to the City is from electricity. In 2009, emissions from electricity were much higher given the use of coal use; however, coal is being replaced by natural gas and GHG emissions have reduced as a result.
- Energy consumption from the commercial sector represents the second largest source of GHG emissions (behind transportation) and represents 19 percent of total City-wide emissions. Commercial offices occupy the largest building areas in the City.
- Residential consumption is the third largest by sector with 17 percent of total GHG emissions in the City.
- Industrial and governmental energy are smaller in comparison (8 and 3 percent respectively).
ES.4 CONCLUSIONS AND RECOMMENDATIONS
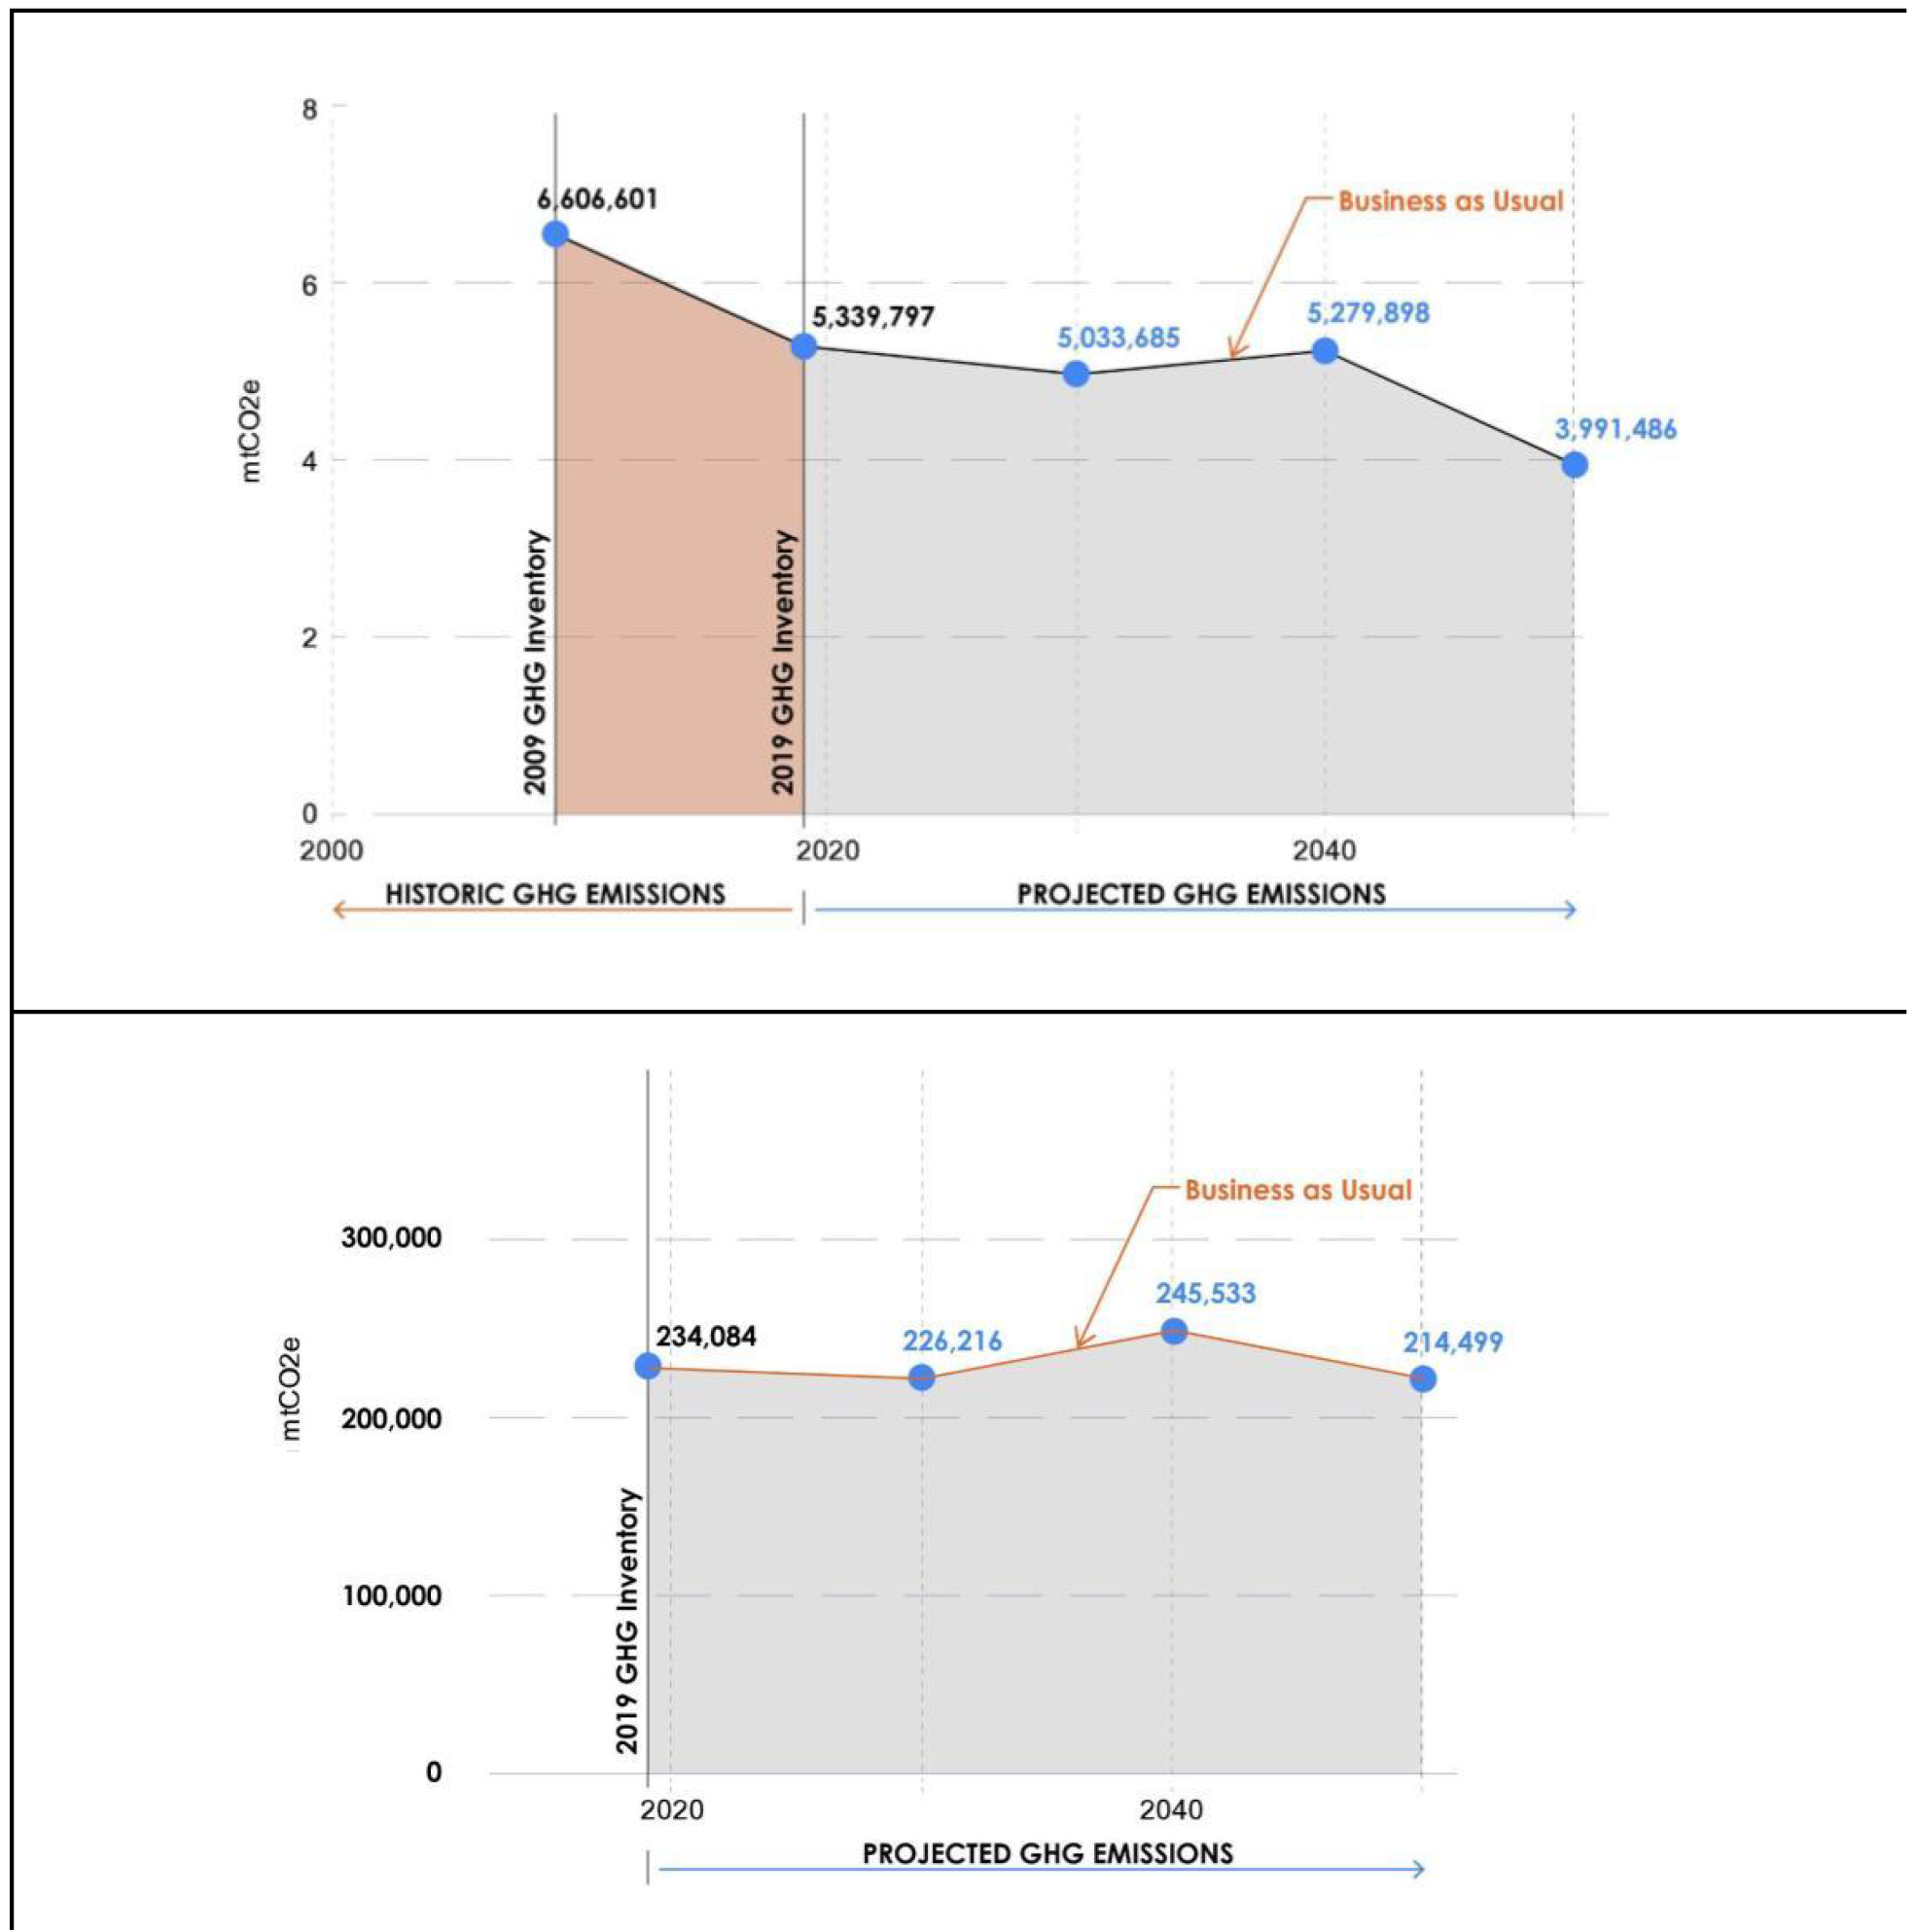
GHG emissions declined over the last decade, but the trend is not expected to continue (Figure ES-5). TECO is nearing completion with the transition of its fuel source from coal to natural gas. Without another large-scale reduction that transitions away from natural gas toward renewable energy sources, net GHG emissions are forecasted to increase in line with a growing population. The electricity provider’s parent company, Emera, has announced that their portfolio would achieve net zero emissions by 2050. This along with community-wide improvements in efficiencies (i.e., energy efficient appliances and more fuel efficient cars) will also help to slow the growth in GHG emissions.
ES.4.1 Opportunities
The largest opportunities to reduce GHG emissions in the City of Tampa exist in the largest GHG emission categories. In Government Operations, this category is Solid Waste. City-wide, transportation and energy categories are the largest contributors and outweigh overall emissions from solid waste. The largest opportunities for reductions are presented below.
ES.4.1.1 Shift to Renewable Energy
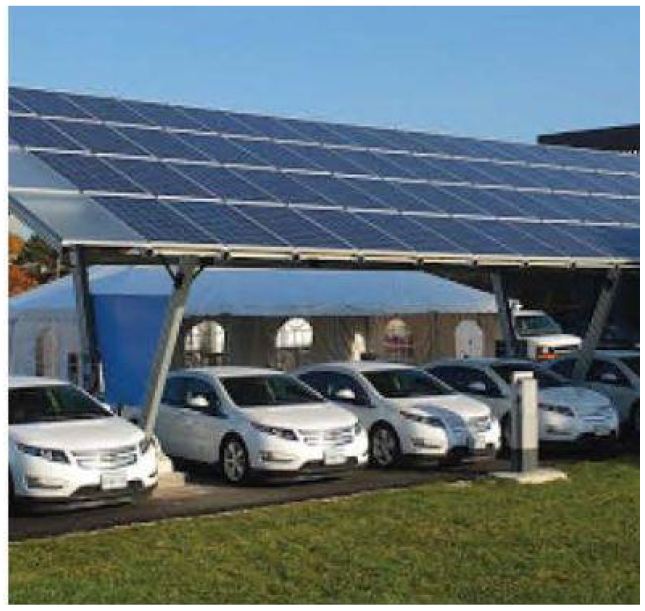
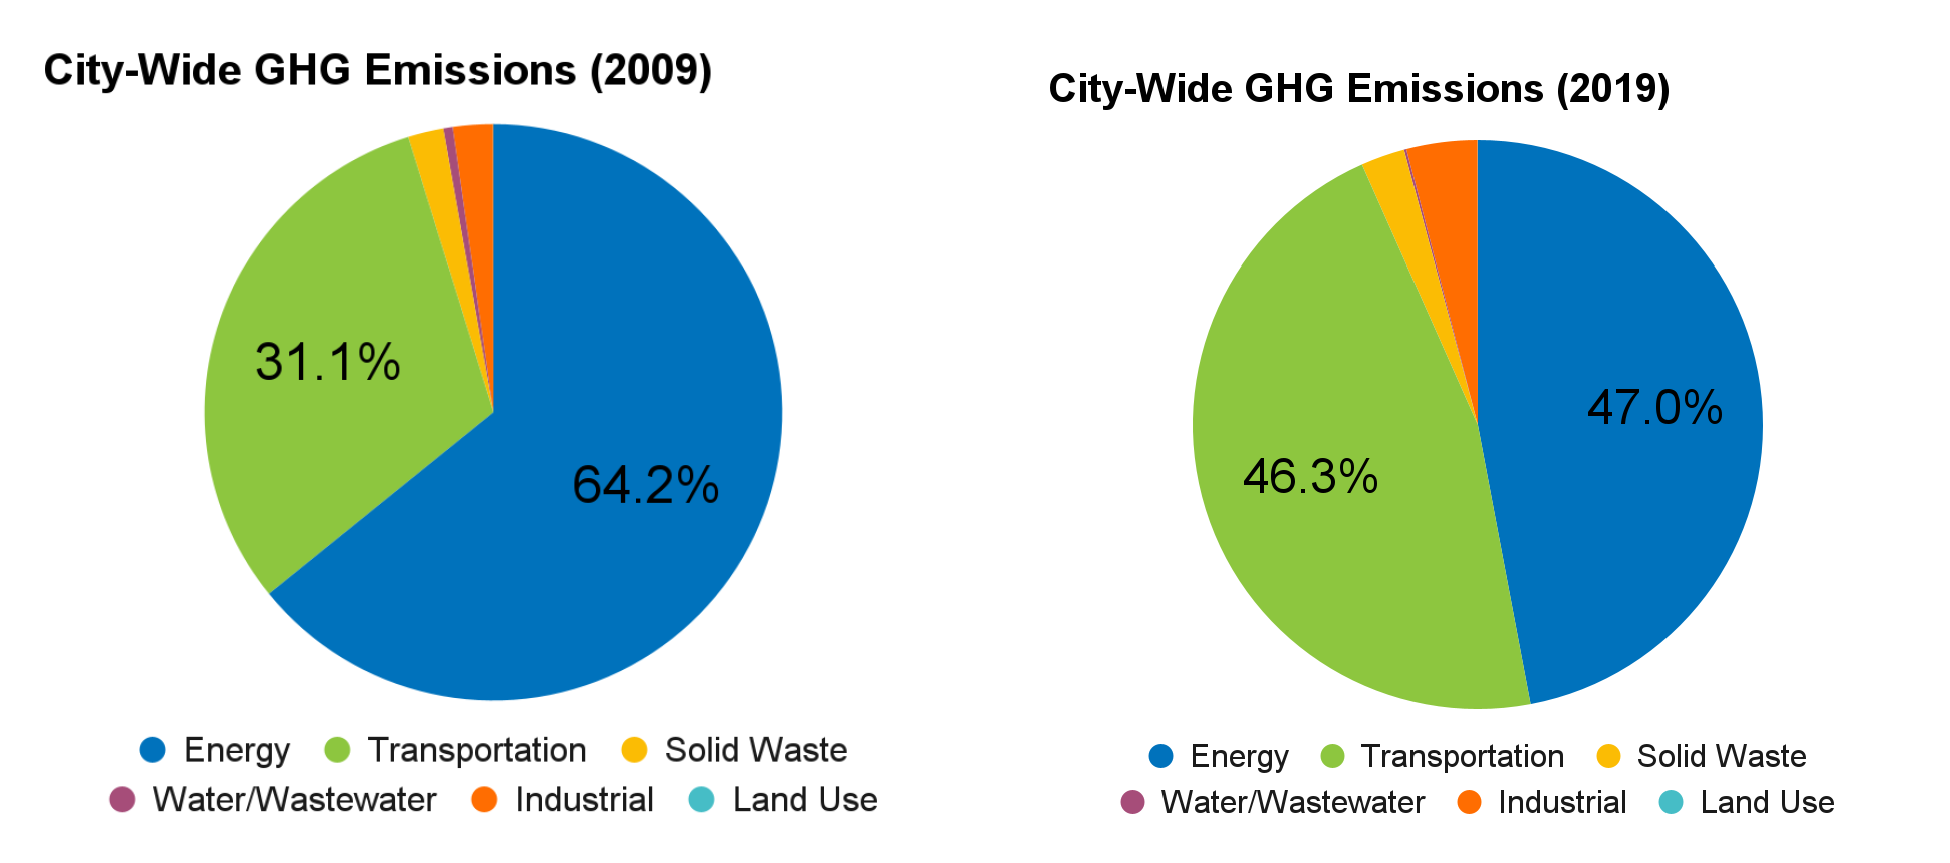
From 2009 to 2019, City-Wide GHG emissions from energy (i.e., electricity and natural gas provided by TECO) shifted from 64 percent to 47 percent of total emissions. This reduction was traced to the energy provider transitioning from coal to natural gas and for expanding a power station with more efficient technologies. While coal is still in the region’s mix, a phase out of coal is planned by TECO and its parent company, Emera. Emera has committed to achieving net-zero carbon dioxide (CO2) emissions by 2050, which will result in reduced GHG emissions in all TECO’s service areas, represented by a declining business as usual (BAU) projection in Figure ES-5. This transition is being operationalized with the rapid expansion of solar arrays located in Hillsborough County and surrounding counties. The City of Tampa has additional opportunities to expand to renewable energy within its government operations by installing solar panels at its facilities and by advancing and supporting community solar projects.
ES.4.1.2 Conservation and Improved Efficiencies
Transitioning from fossil fuels to renewable energy will result in lowered GHG emissions; however, time is needed to make the transition. Actions can be taken immediately to reduce GHG emissions by reducing consumption of transportation fuels, electricity, water, and material goods. Improving efficiencies also have the same effect of reducing GHG emissions. For example, installing energy-efficient appliances and lighting and thicker insulation will result in fewer GHG emissions for the same level of output. In the government sector, improving efficiencies in water treatment and distribution provide opportunities to reduce electricity consumption as well as save taxpayer dollars. Other measures such as retiming traffic signals to avoid idling of cars will result in lowered GHG emissions. Lastly, reducing waste and increasing recycling rates will result in fewer GHG emissions from combustion or landfilling of this waste and by avoiding trips to the landfill which also adds fuel consumption from trucking waste. It will take a combination of efforts to achieve GHG reduction goals set forth by the City.
ES.4.1.3 Offset Emissions for Renewables and in the Urban Forest
Opportunities exist to offset emissions by protecting and enhancing natural and urban forests. Protecting forests allows for continued carbon storage in standing trees and continued annual carbon sequestration. The City of Tampa has had success expanding its urban forest through its tree planting program. There is potential to expand this program to sequester more carbon. Opportunities also exist by offsetting emissions through community solar and rooftop solar projects either on city property or through partnerships. As climate policies are advancing globally and nationally, there will be a demand for carbon offset projects and local governments have an opportunity to participate in the carbon market that provide triple bottom line successes, namely to reduce GHG emissions, save money, and spur the local economy.
ES.4.1.4 Lead by Example Initiatives
The City of Tampa has shown leadership in sustainability efforts. Capitalizing on opportunities through conservation and other sustainability efforts will enable the City to “lead by example.”. The City also has an opportunity to provide education to its residents and City staff. Lastly, the City can drive policy actions through engagement with multi-governmental agencies to promote land use, development and transportation patterns that address the increasing consumption of energy.
ES.4.2 Recommendations
This GHG Inventory used readily-available data and the best protocols available for each category. Some categories are based on high-level estimation methods (i.e., transportation) due to data gaps at the local level. A GHG inventory should continue to be improved and updated regularly. Data collection should be conducted annually with continued improvement to methodologies where available. Public reporting of emissions shows transparency and the City of Tampa is already participating in the Carbon Disclosure Project (CDP) and publicly reporting emissions. Furthermore, the City engages in the Global Covenant of Mayors for Climate and Energy. This inventory should be used to advance climate action planning that uses actual emissions to model GHG reduction potential of projects, actions, and initiatives. Lastly, the key findings of the inventory should be clearly communicated to both internal and external stakeholders in order to increase the knowledge base and overall buy-in for implementing reduction strategies. An interactive story map is one potential strategy for presenting easy-to-understand information to the public and City departments alike.
TECHNICAL REPORT
CITY OF TAMPA GOVERNMENT OPERATIONS AND CITY-WIDE GREENHOUSE GAS INVENTORY
1.0 INTRODUCTION
This technical report presents a decadal view of greenhouse gas (GHG) emissions from both City of Tampa’s Government Operations and City-Wide. The inventory compiles annualized activity data1 and GHG emissions from 2009 through 2019 along with a forecast of GHG emissions to 2040. The inventory is guided by best practices in GHG accounting that include relevance, completeness, consistency, transparency, and accuracy. The inventory includes all activity data and methodologies to replicate and verify GHG emission calculations. The GHG inventory provides quantifiable metrics that can be used to identify and model GHG reduction strategies that meet the City’s climate action goals.
1.1 BACKGROUND
The City of Tampa is the largest city in the Tampa Bay region and the third largest city in the State of Florida. The City of Tampa has a long history of sustainability efforts and is committed to taking action on advancing sustainable measures. For example, Mayor Jane Castor created a senior-level position in May 2020 to lead sustainability, climate action, resilience, renewable energy transition, and environmental justice initiatives across the City.2 Under the mayor’s leadership, the Sustainability and Resilience Officer (SRO) commissioned a GHG Inventory to update the 2011 GHG Inventory, which was part of the Energy Efficiency and Conservation Plan (EECP). The update will serve as a foundation to model GHG reduction strategies for climate action planning.
The previous EECP included a GHG Inventory for both City Operations and City-Wide for calendar year 2009 and forecasted emissions under business as usual (BAU) conditions to the year 2050. It also provided a summary of programs and regulations relevant to GHG reductions in the City of Tampa, like the “Tampa Green Resolution”, approved in 2008 to regulate sustainable practices as designated by the Florida Green Local Government3. The EECP outlined a number of projects funded through the American Recovery and Conservation Block Grant (EECBG), including upgraded traffic lights (480) and street signs with LEDs, energy management systems (EMS) in three buildings, upgraded lighting, and funding for the GHG inventory and EECP plan. The “Tampa Green Fast Track4” review process was established to provide front-of-the-line status for development that followed green building standards. The Fast Track process continues to be widely used. The EECP indicated that water conservation programs had a high potential to lower GHG emissions. Additional initiatives included 10 electric charging stations, goals for energy conservation, solar-powered trash and recycling compactors, objectives for the City’s Greenway and Trails Master Plan, extension of curbside recycling, and avoided emissions from clean energy sourcing at
- “Activity data” is a term used in GHG accounting to refer to data used to estimate GHG emissions. Often, reporting direct greenhouse gas emissions is not possible; however, other metrics are available (e.g., kilowatt-hour consumption (KWH) for electricity and gallons of gasoline for transportation. This data is called “activity data” as it is converted to GHGs using known emission factors. For example, studies that quantify emissions from burning one gallon of gasoline.
- https://www.tampa.gov/news/city-tampa-hires-new-sustainability-resilience-o%EF%AC%83cer-whitford-remer-support-transforming
- Florida Green Building Members, available at (https://floridagreenbuilding.org/fgbc-members).
- Tampa Green Fast Track, available at: (https://www.tampa.gov/green-tampa/infofast-track-permitting).
wastewater treatment. Numerous specific actions were identified and evaluated as to their GHG reduction and cost savings.
The programs and initiatives identified in the 2011 EECP along with more recent initiatives have undoubtedly resulted in reduced GHG emissions, which serve as a key performance indicator for tracking climate targets. This GHG Inventory update includes a summary of available data and GHG emissions from the 2009 GHG Inventory. The EECP also calculated the necessary GHG reductions required to meet the target of reducing the City’s GHG emissions to 1990 levels by the year 2025. Given changes in GHG accounting since 2009, apparent data gaps, and new categories of GHGs included in this inventory, direct comparisons between the 2009 and 2019 is not always possible. However, available historical data was used to fill data gaps where possible. Data sources are presented in each of the GHG Inventories (i.e., Government Operations and City-Wide).
1.2 GREENHOUSE GAS ACCOUNTING AND REPORTING PRINCIPLES
1.2.1 About Greenhouse Gases
Greenhouse gases (GHGs) are gases in the earth’s atmosphere that allow sunlight to enter the atmosphere and prevent infrared radiation from escaping back to space (EIA, 2019).5 GHGs in the earth’s atmosphere trap heat in a process known as the “Greenhouse Effect.” These gases result from natural processes as well as from man-made or anthropogenic sources which lead to higher quantities of GHG in the atmosphere. There are six classes of internationally recognized GHGs (Table 1-1). Carbon dioxide (CO2) is the most prevalent of the GHGs and, since not all GHGs have the same ability to absorb heat in the atmosphere, non-CO2 emissions are converted to a standardized value for each gases’ global warming potential (GWP). CO2 is the standard, with a value set at 1. Methane (GWP of 28), however, is 28 times as effective at heating the atmosphere. GWPs are updated periodically and inventories should be recalculated when GWP updates are published. This inventory uses values presented in the Fifth Assessment Report.6 One benefit of using standardized GHG units, reported as metric tons of carbon dioxide equivalents (mtCO2e), is that all GHG emissions can be summed and used to track the efficacy of various policies in comparison to other municipalities.
| Greenhouse Gas (GHG) Category | Sources of GHG Emissions | Global Warming Potentials (GWPs) |
|---|---|---|
| Carbon Dioxide (CO2) | Fossil Fuels for Electricity & Transportation | 1 |
| Methane (CH4) | Coal, Natural Gas, Agriculture, Wastewater Landfills | 28 |
| Nitrous Oxide (N20) | Energy, Agriculture, Wastewater, Industrial Processes | 265 |
| Hydrofluorocarbons (HFCs) | Refrigeration & Air Conditioning | 1,000s-10,000s |
| Perfluorocarbons (PFCs) | Refrigeration & Air Conditioning | 1,000s-10,000s |
| Sulfur hexafluoride (SF6) | Manufacturing & Electronics | 1,000s-10,000s |
Data Source: The GHG Protocol, Global warming potentials from IPCC Fifth Assessment Report
- U.S. Energy Information Administration -EIA -Independent Statistics and Analysis. (2019). Retrieved November 17, 2020, from (https://www.eia.gov/energyexplained/energy-and-the-environment/greenhouse-gases-and-the-climate.php)
- GWP from the GHG Protocol, available here: (https://ghgprotocol.org/)
In GHG Accounting, a standard convention is to identify GHG sources and sinks that are under the direct control of the organization. Three scopes have been defined to determine where GHG emissions are occurring within the City (Figure 1-1). Scope 1 emissions include all emissions that occur within city boundaries, like the combustion of gasoline from cars along a city road. Scope 2 emissions occur as a consequence of actions with a city boundary. An example of Scope 2 emissions are grid-supplied electricity consumed within the City. Scope 3 emissions include all other emissions that occur outside the City boundary as a result of activity taking place within the City. An example of Scope 3 emissions are transmission and distribution losses from natural gas pipelines that lead into the City. It is standard practice to include all Scope 1 and 2 emissions in an inventory. Scope 3 emissions are sometimes included, particularly solid waste emissions, and are important to quantify, to identify “leakage” from one geographic boundary to another.
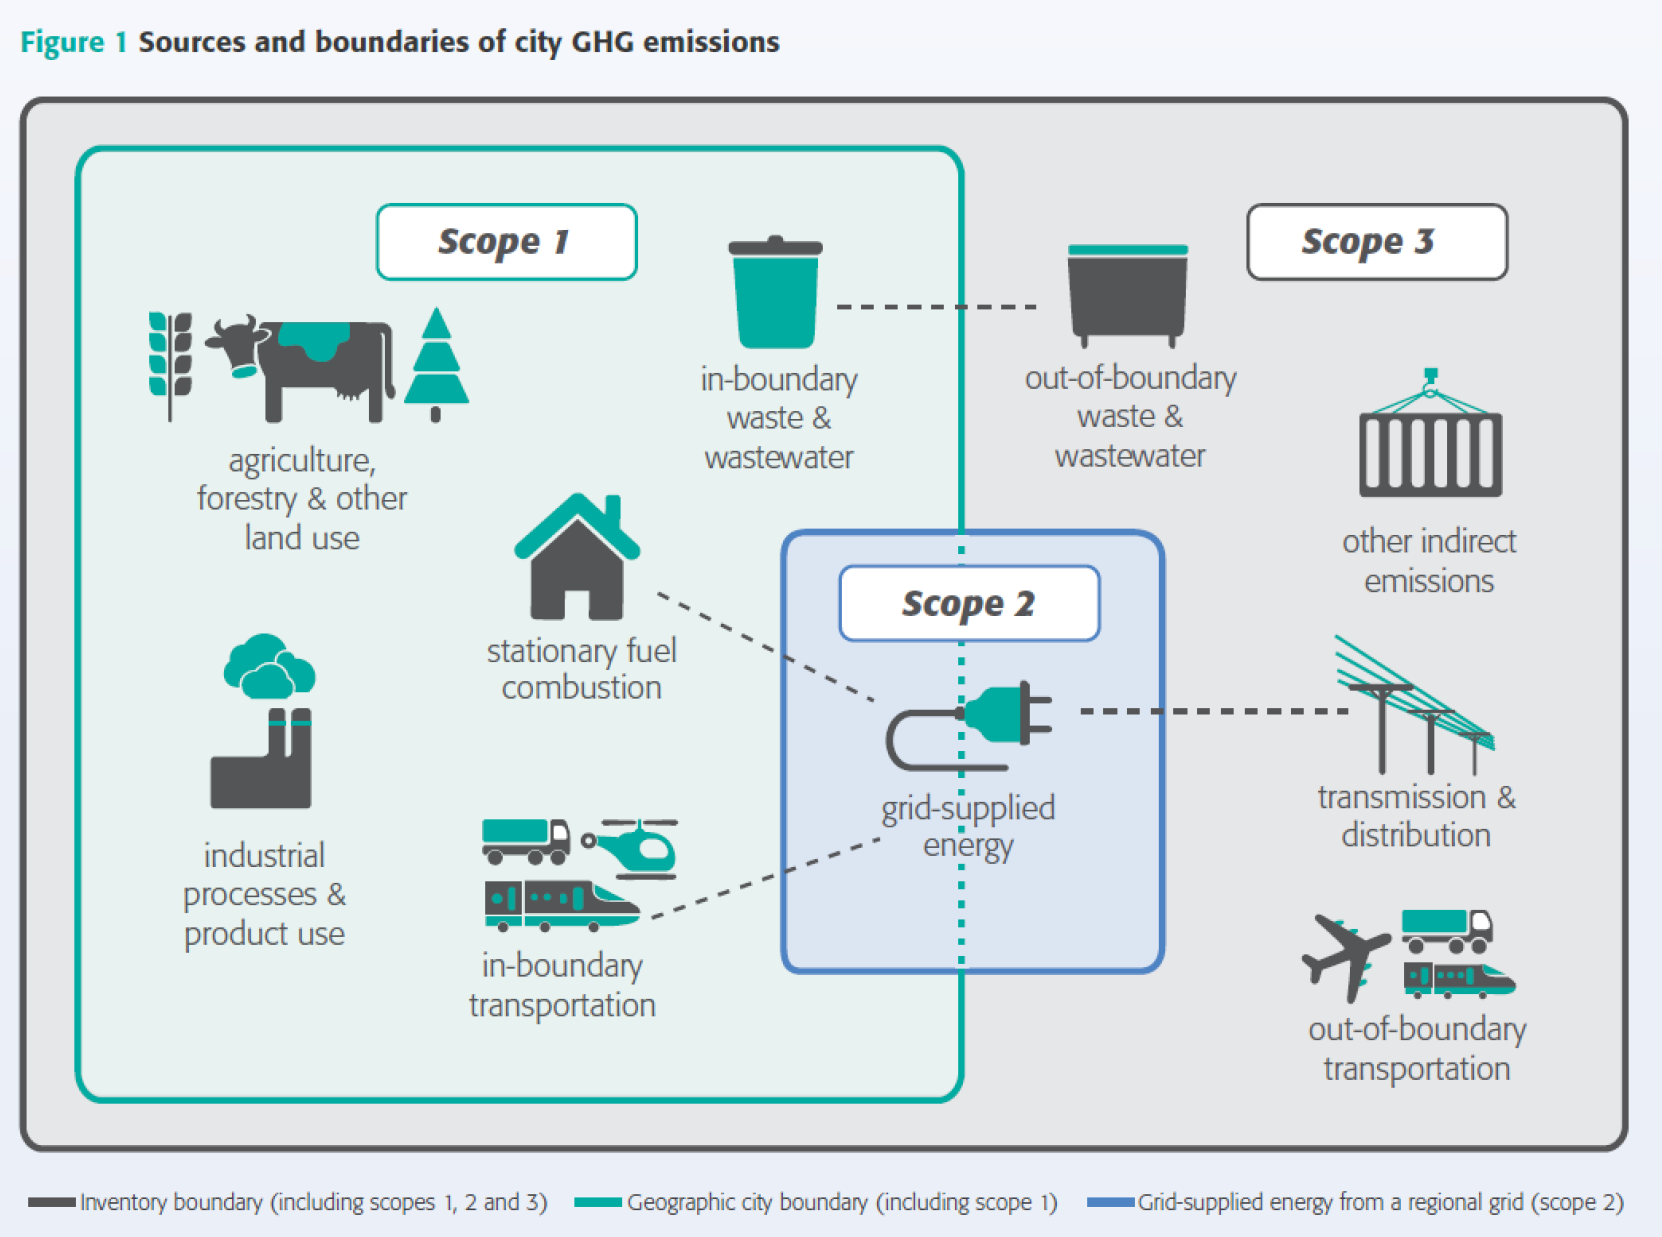
Data source: GHG Protocol for the US Sector
1.2.2 Greenhouse Gas Accounting Principles
As the impacts of climate change intensify, local governments across the globe will play a significant role in the response, mitigation, and reduction of GHG. Cities must first be able to accurately document the existing emissions and harness the data to develop solutions that reduce GHG emissions emanating from both local government operations and from the city as a whole. The first step for local governments is the creation of a GHG inventory to understand how activities in the local government are contributing to emissions. While there are numerous methodologies and frameworks available to local governments, the differences between them cause inconsistencies between inventories. From review of all GHG inventories available, the GHG Protocol was selected because of its international recognition, robust methodologies, and it is an approved methodology in LEED for Cities. The two guiding documents that provide guidance to local governments are shown on Figure 1-2.
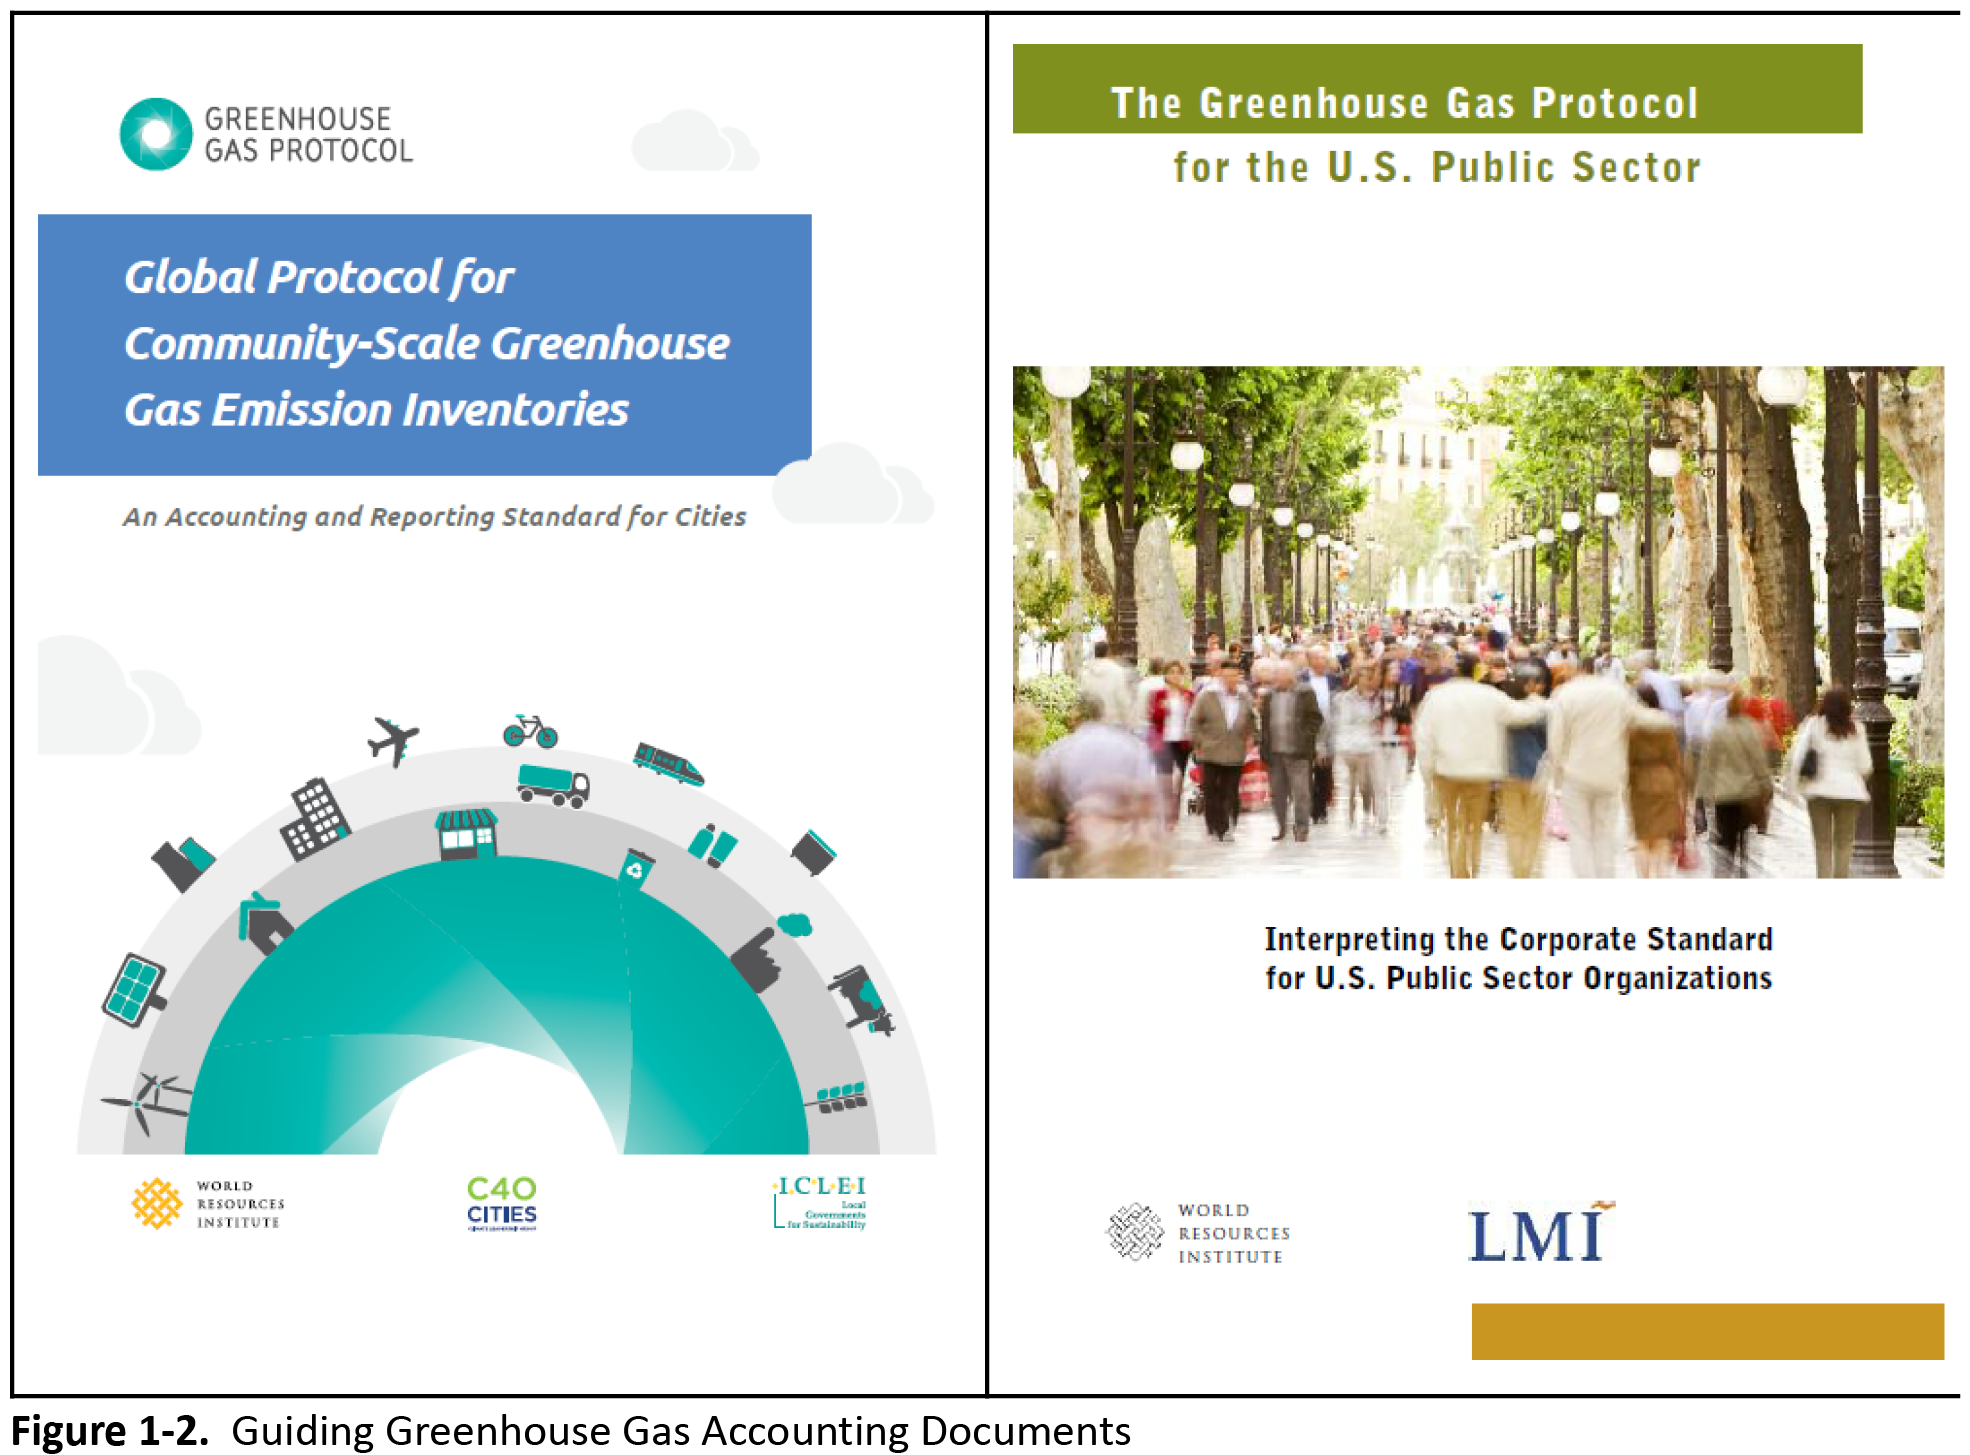
Note: The document on the left, referred to as the Global Protocol for Cities (GPC), is designed for cities to quantify community-wide emissions. The document on the right adapts guidance for businesses to government operations, given that operations are similar to business.
The GHG Protocol identifies the following five key principles that should be embedded in the inventory process:
- Relevance: The data that is collected and reported should be related to the “activities and consumption” of the local government. The goal is to collect data that will inform decisions for future development and programs within the local government and therefore should be as relevant to the existing context and patterns as possible. This principle guides critical aspects of the inventory such as data source selection and prioritizing data that is collected.
- Completeness: All emission sources within the local government inventory boundary must be accounted for. If, for any reason, a source is excluded from the inventory, it must be properly documented and clearly explained.
- Consistency: The approach, boundary, and methodology for each emission calculation must be consistent. This allows for meaningful documentation that allows cities to track changes over time, as well as trends and comparisons between cities and programs. All calculations should follow the methodology established by The GHG Protocol. If there are any deviations, they must be disclosed and justified.
- Transparency: In order to enable verification of the data collected, all the activity data, emission sources, emission factors and accounting methodologies must be adequately documented. Information given must be enough for individuals outside of the inventory process to replicate results. Exclusions must be identified, disclosed and justified.
- Accuracy: The calculated GHG emissions should not systematically overstate or understate the actual GHG emissions. The reported information must be accurate enough to assure decision makers and the public that the reported information is correct. Any uncertainties within the process shall be reduced as much as possible.
Compromises and tradeoffs may be required between the five principles in order to meet the needs of a city. Within those processes, the local government will make decisions regarding the setting of the inventory boundary and choosing calculation methods. These decisions and priorities will influence the amount and quality of the data collected and should be understood in the decision-making process.
1.2.3 Greenhouse Gas Framework (From Global to Local)
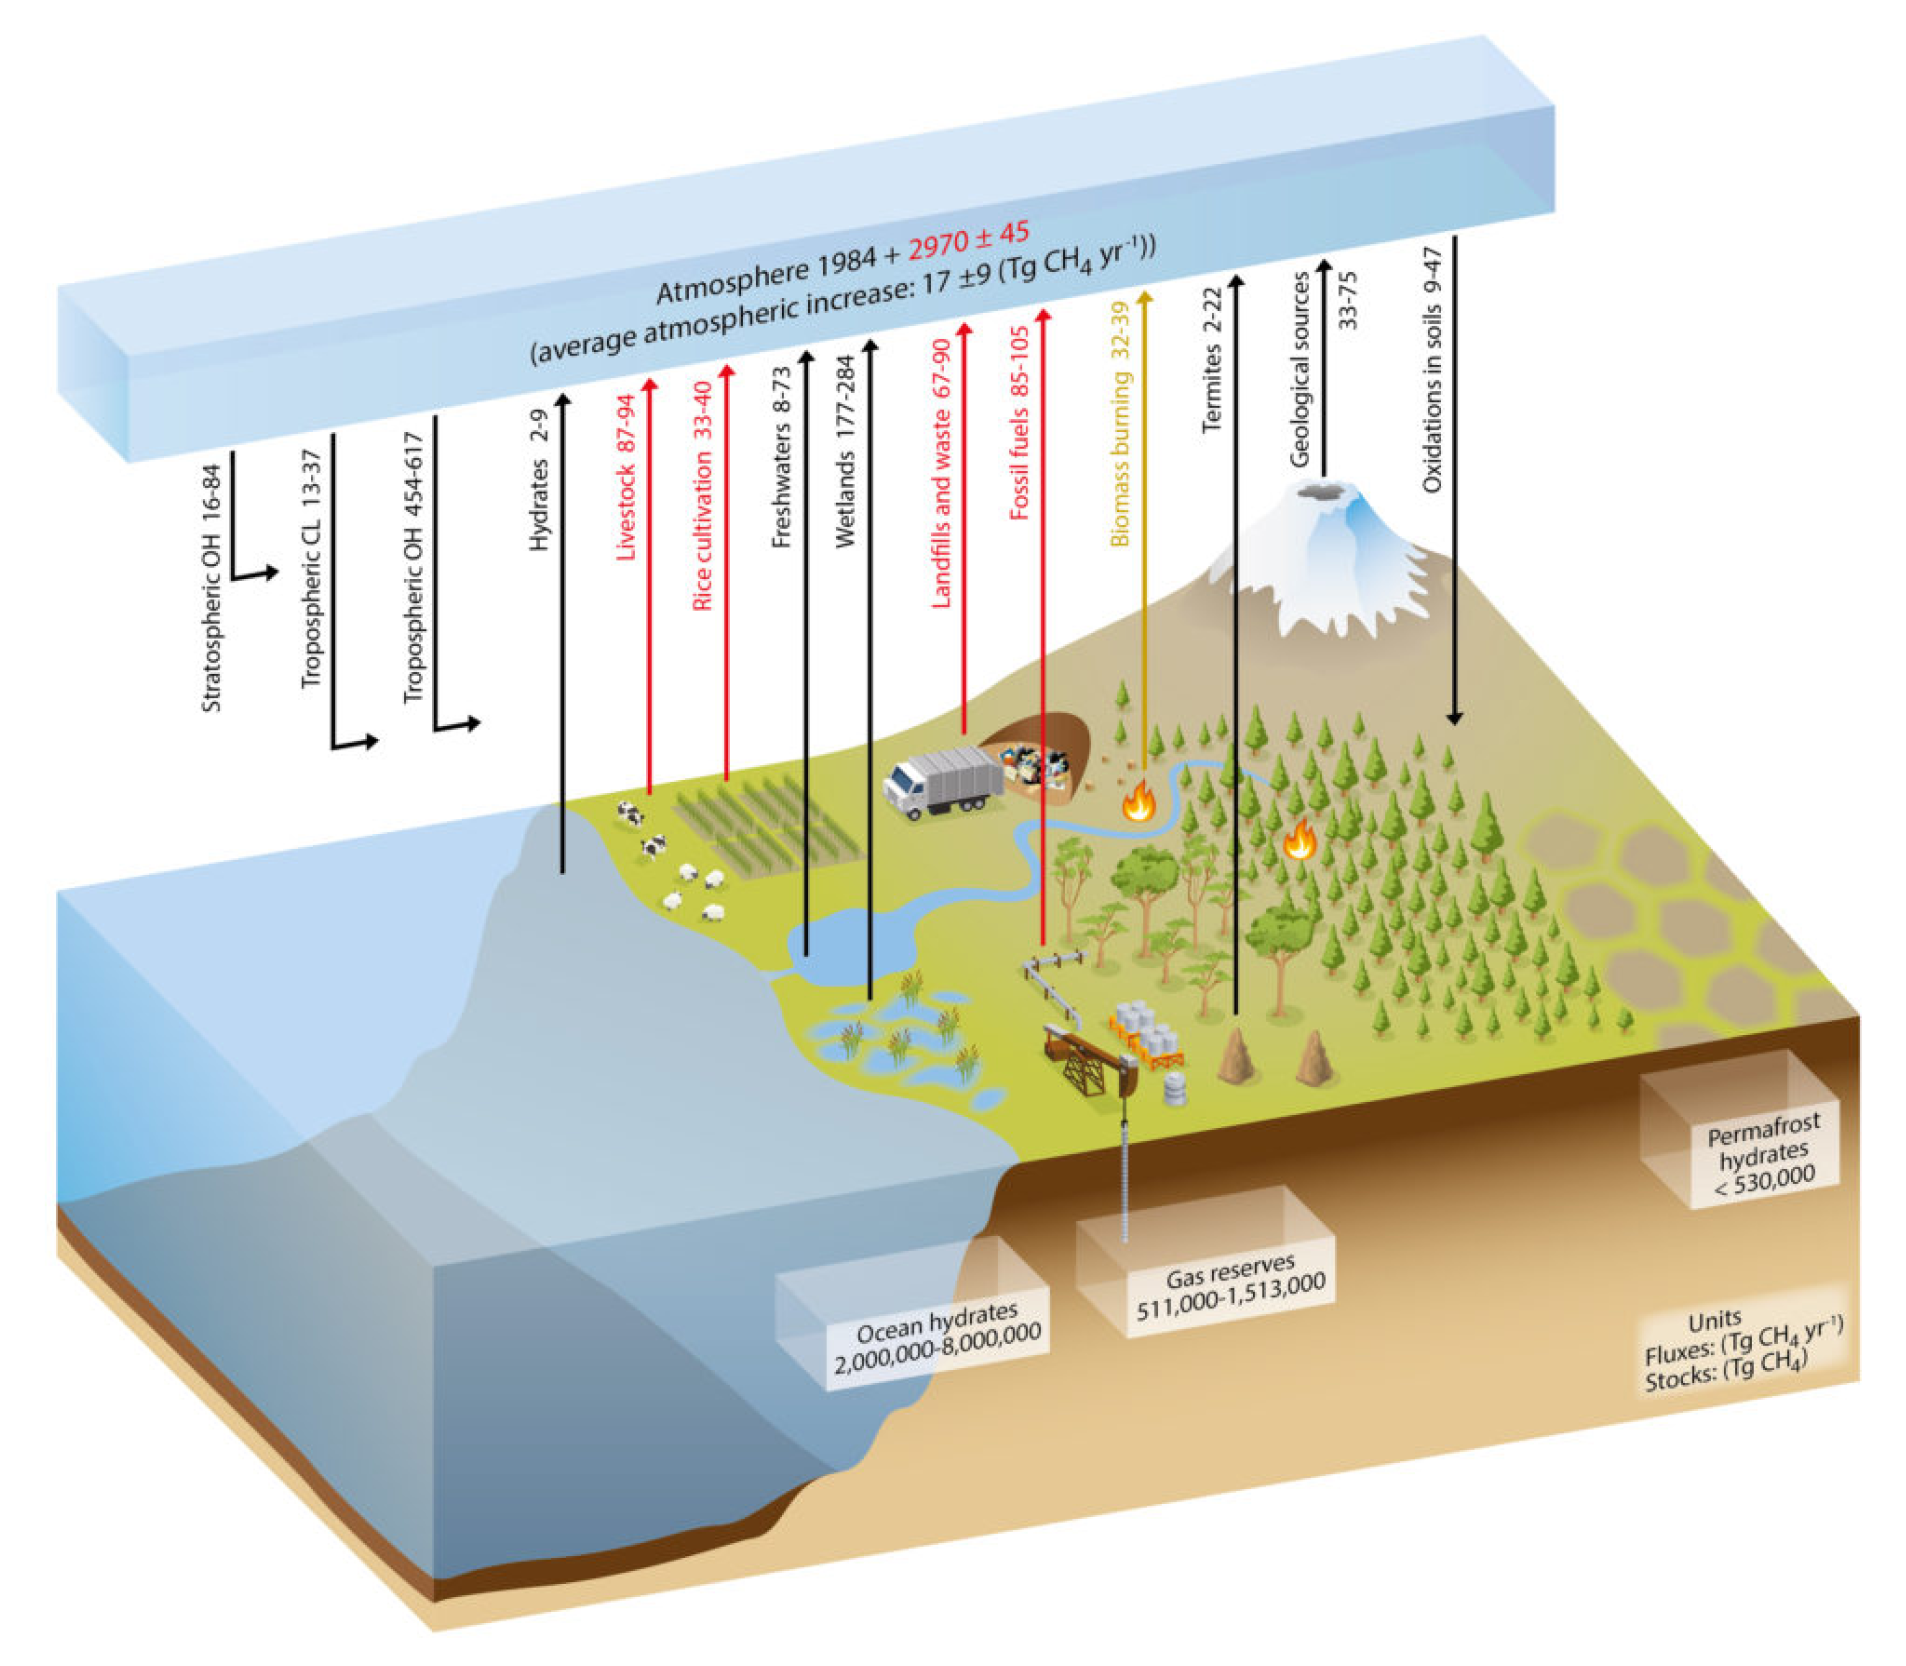
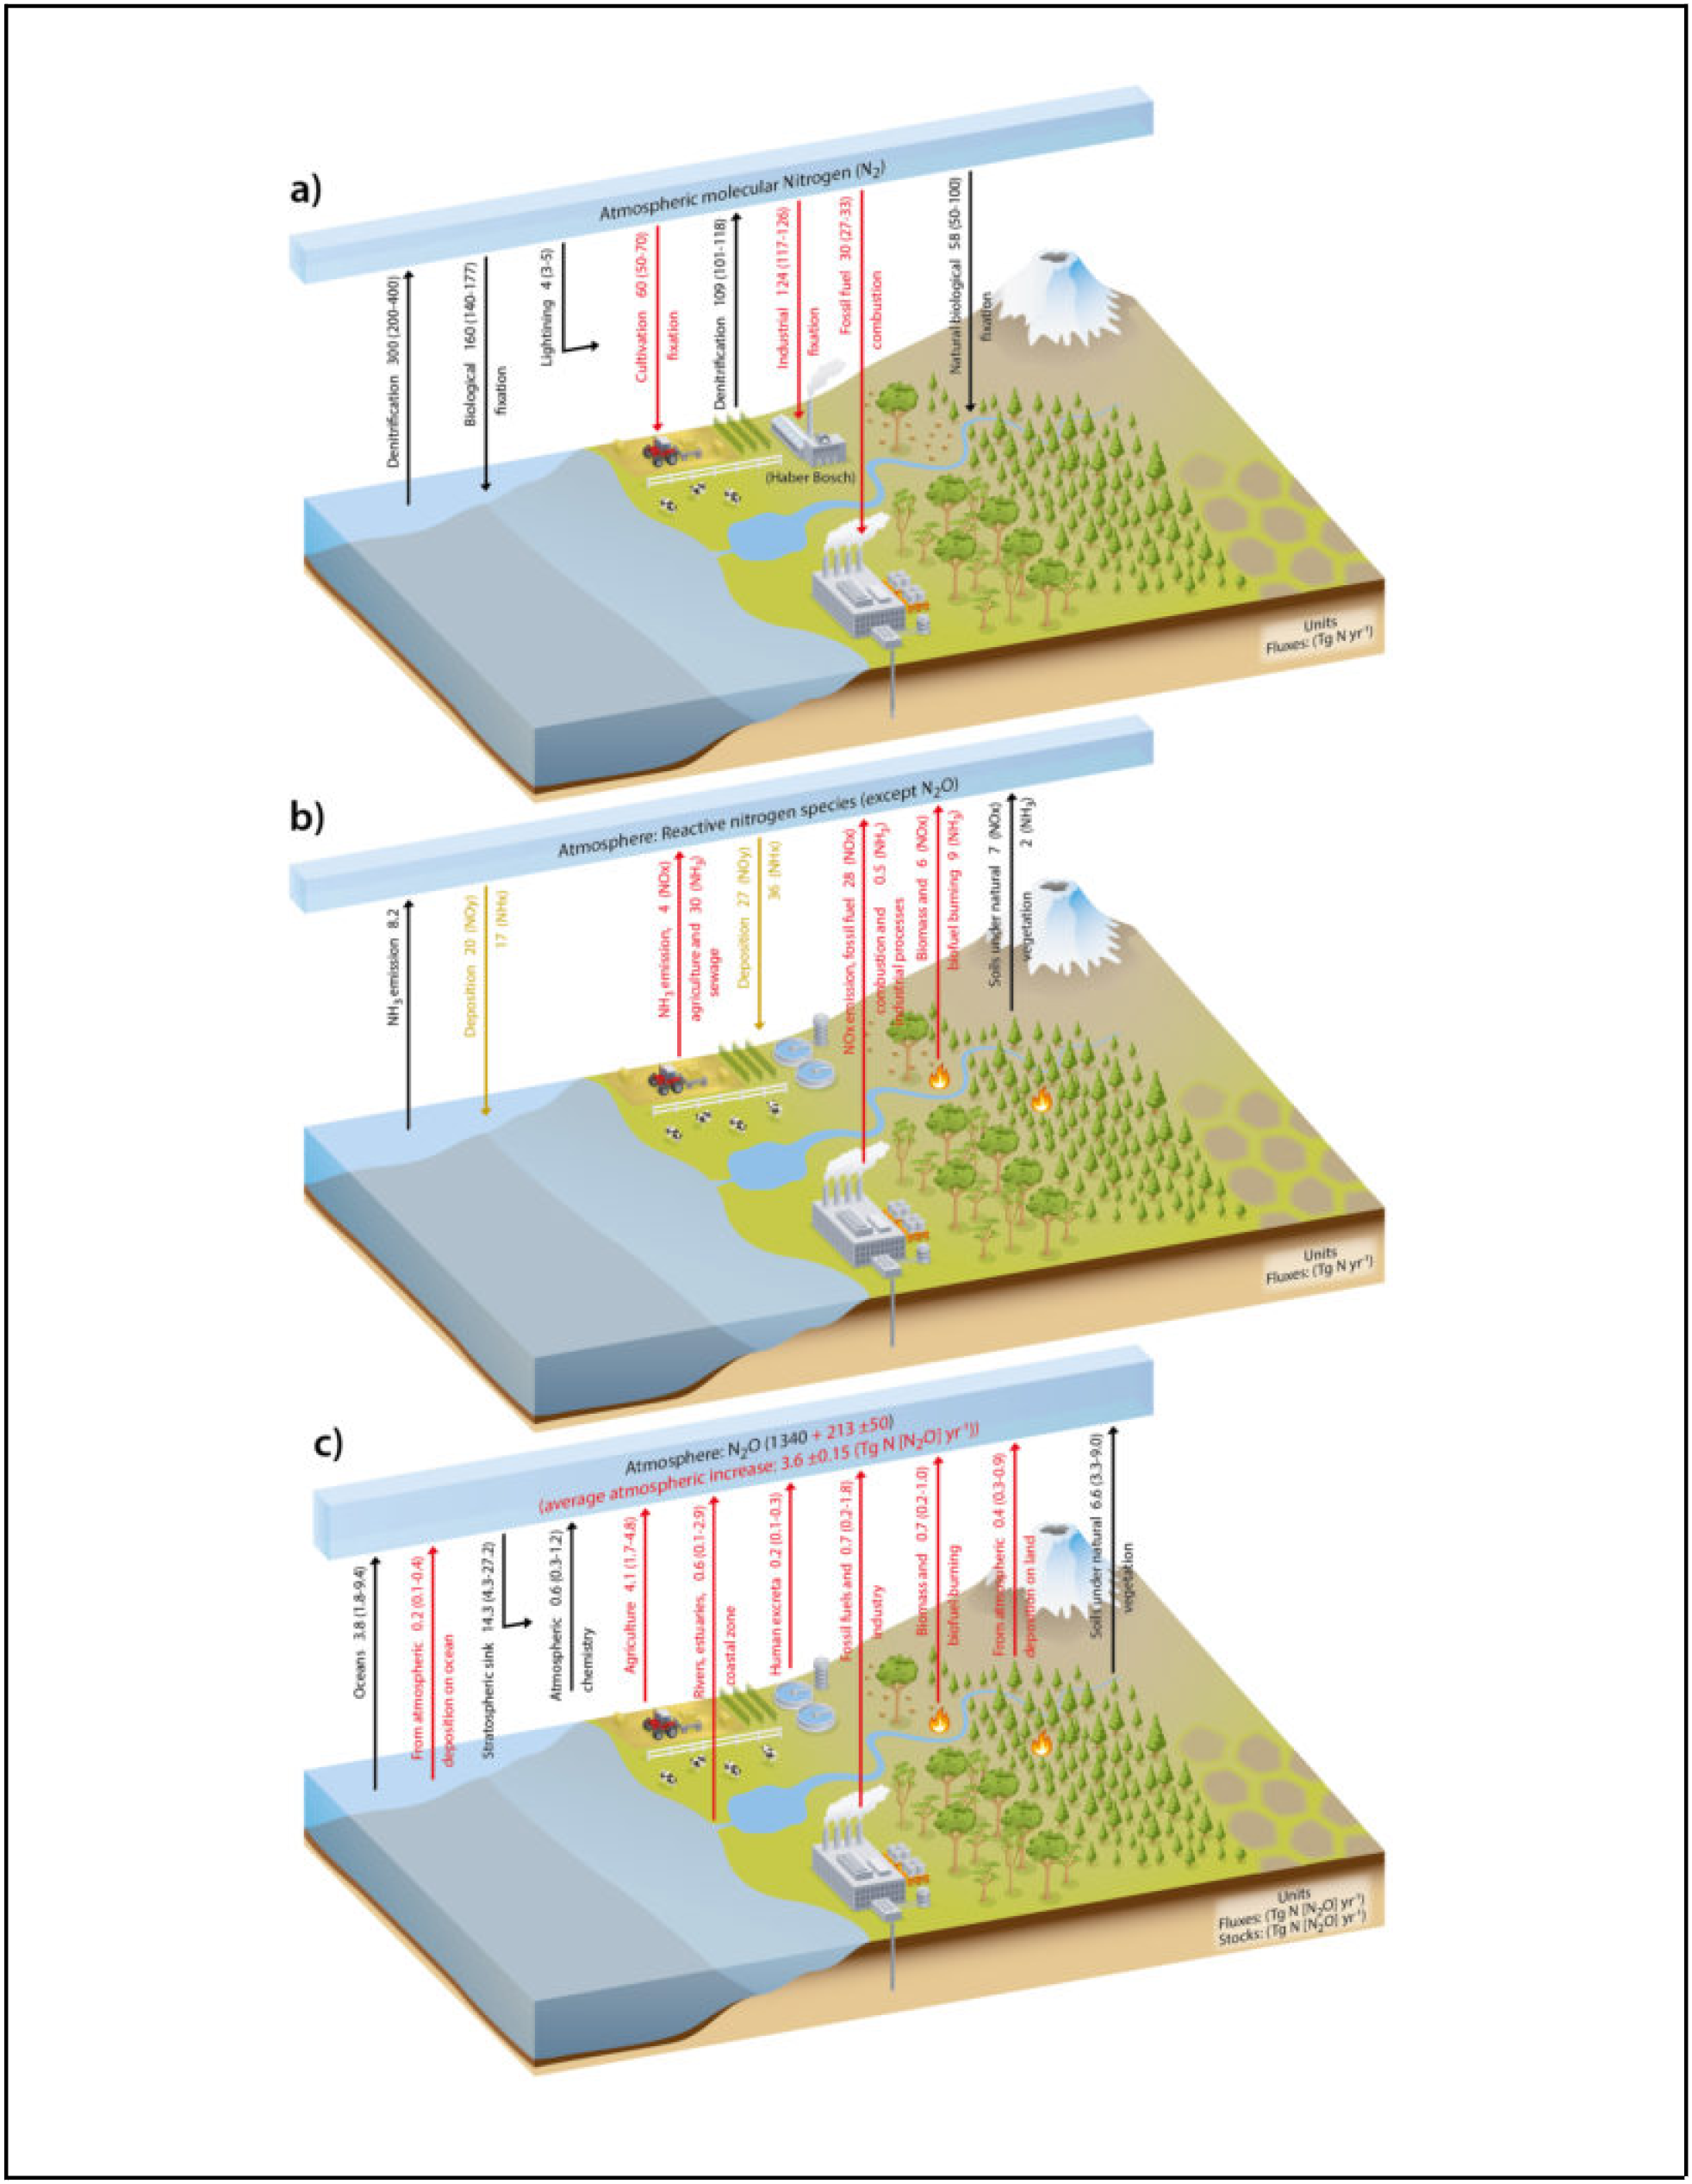
A GHG inventory quantifies the total GHG emissions released into the atmosphere (called a “source” in this inventory) as well as all avoided emissions and the carbon sequestered in woody biomass and soils (called a “sink” in this inventory). While greenhouse gas emissions and sequestration are in constant flux (Figure 1-3); annual estimates can be quantified and the net difference between sources and sinks. When GHG sources equal GHG sinks, then that is what is referred to as Net Zero GHG emissions. Globally, greenhouse gas emissions are measured for each gas and show a net source of GHG emissions for the three most prevalent GHGs (i.e., carbon dioxide (Figure 1-3), methane (Figure 1-4), and nitrous oxide (Figure 1-5)). Globally, GHG emissions are increasing in the atmosphere. Reductions in GHG emissions (e.g., switching fossil fuels with renewable sources) and/or increases in carbon sequestration (e.g., planting more trees) are options that can help a city achieve Net Zero GHG emissions. The GHG inventory is a critical component of the City of Tampa’s plans for climate mitigation and is the key to data-driven policy.
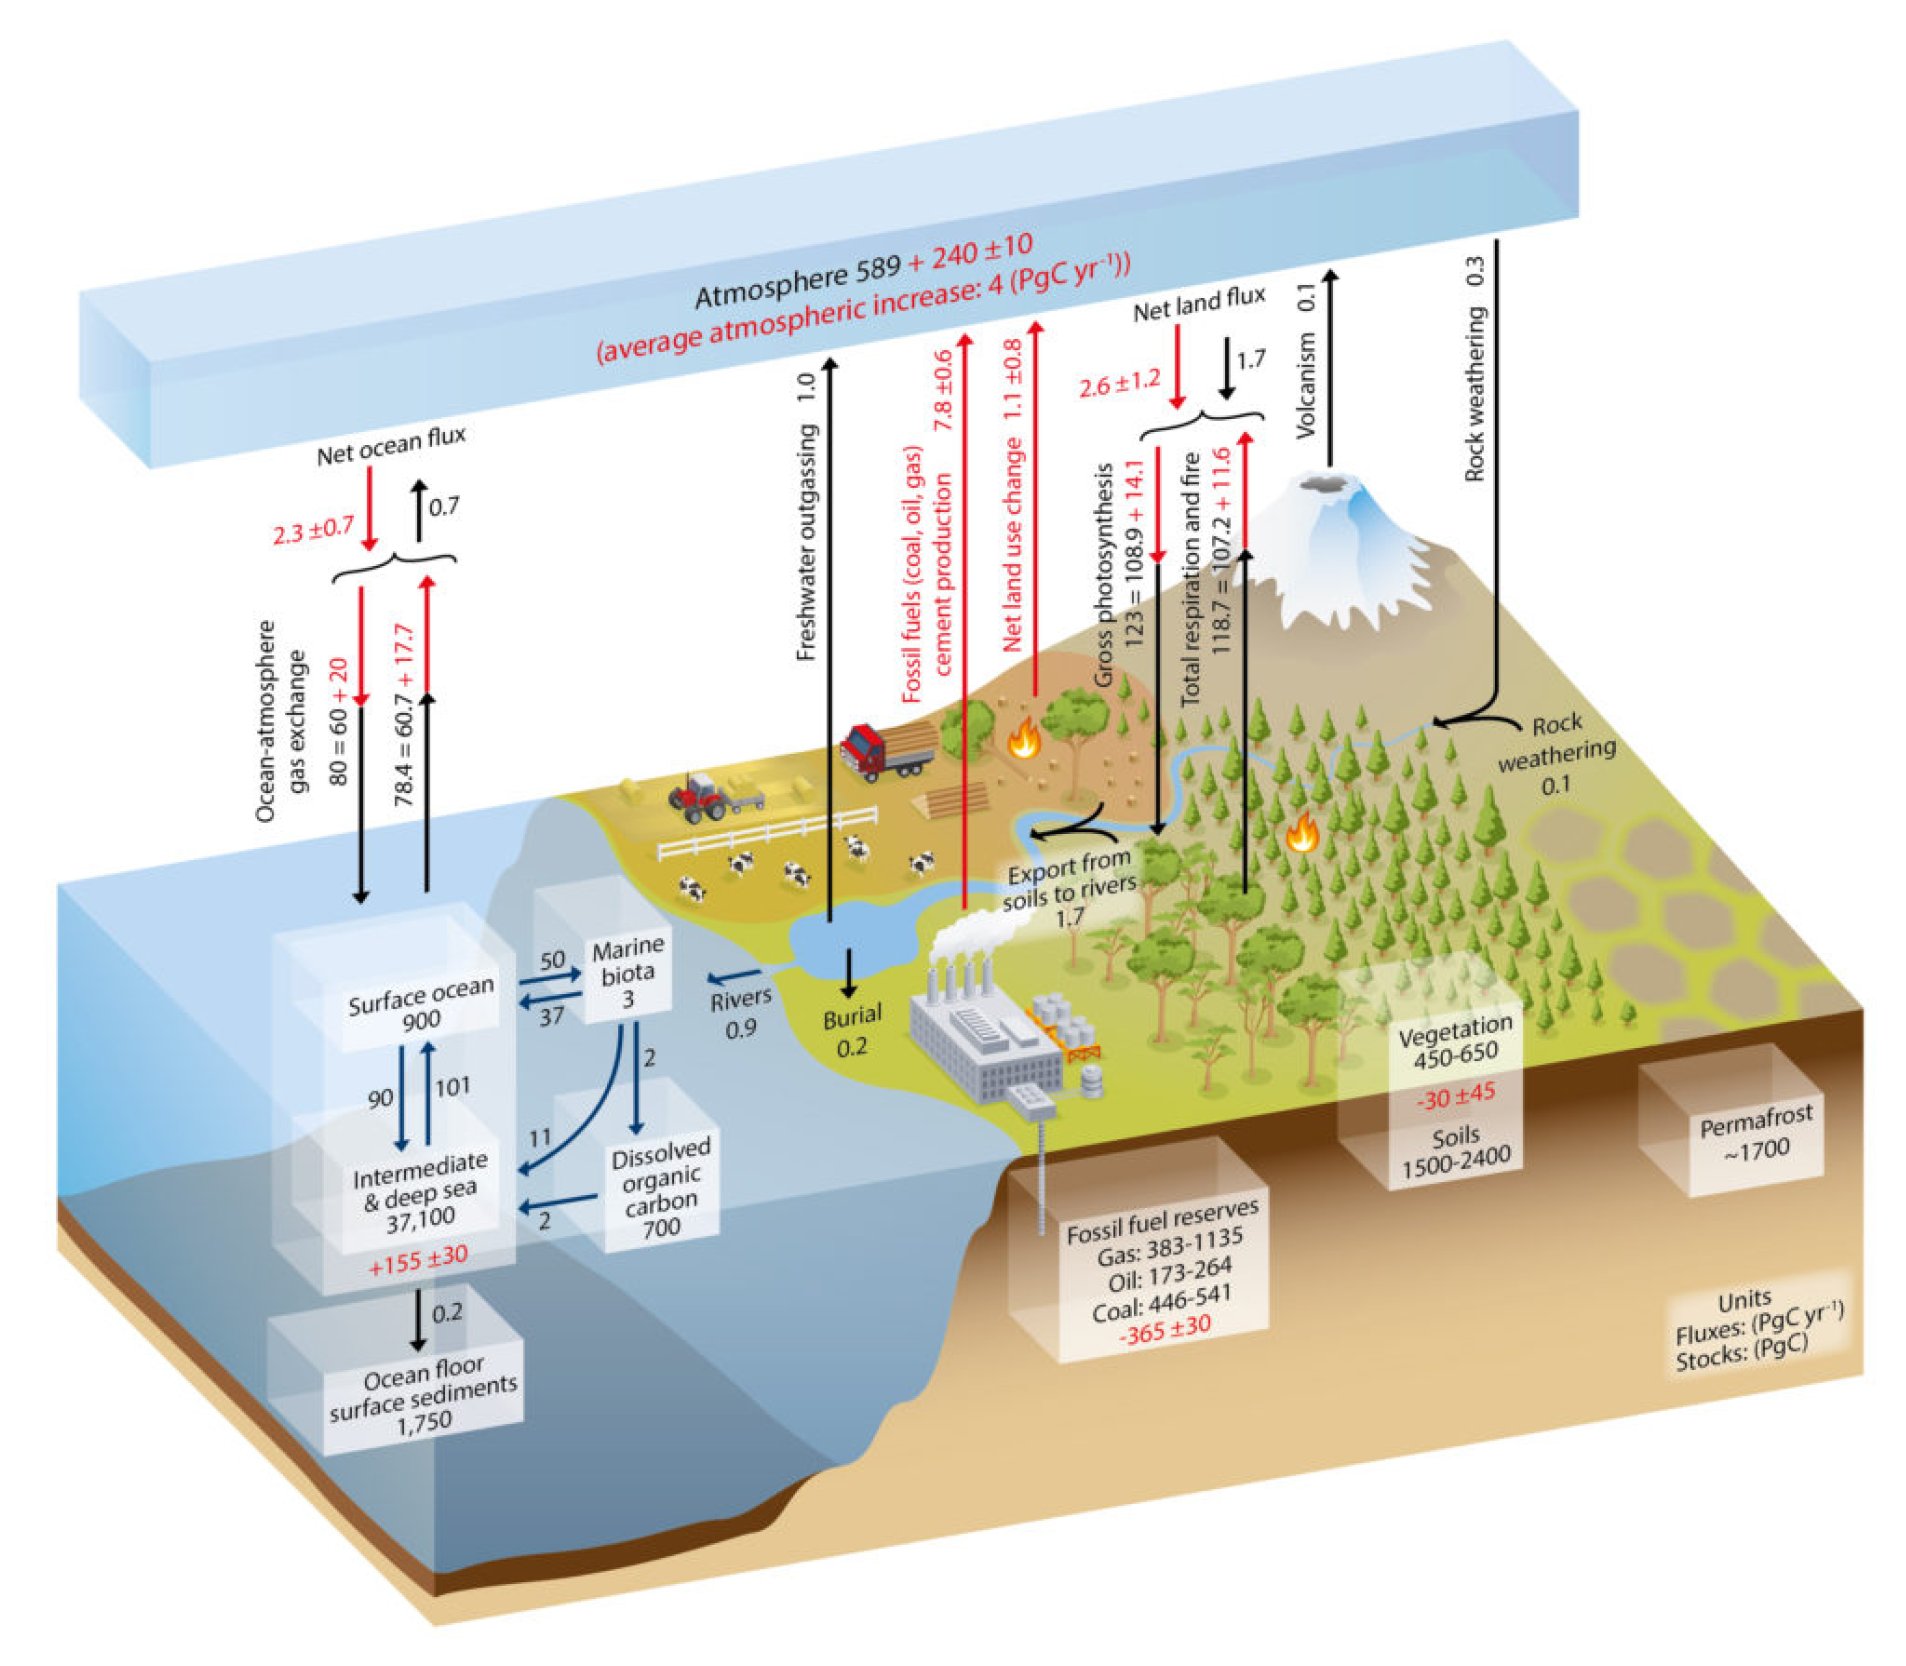
Source: https://www.ipcc.ch/report/ar5/wg1/carbon-and-other-biogeochemical-cycles
The United States Environmental Protection Agency (EPA) has been publishing annual GHG inventories since 1990, but Florida does not publish annual emissions (last published 2015). Figure 1-6 provides an overview of national GHG emissions. GHG emissions nationwide were fairly stable but still steady until 2007 when emissions began to decline. Annual statewide GHG indicators are estimated using EPA’s State Inventory Tool (SIT) for each category. The publishes annual state inventories using SIT for Florida (Figure 1-6). The trend is a general reduction of per capita GHG emissions while net GHG emissions stayed the same.
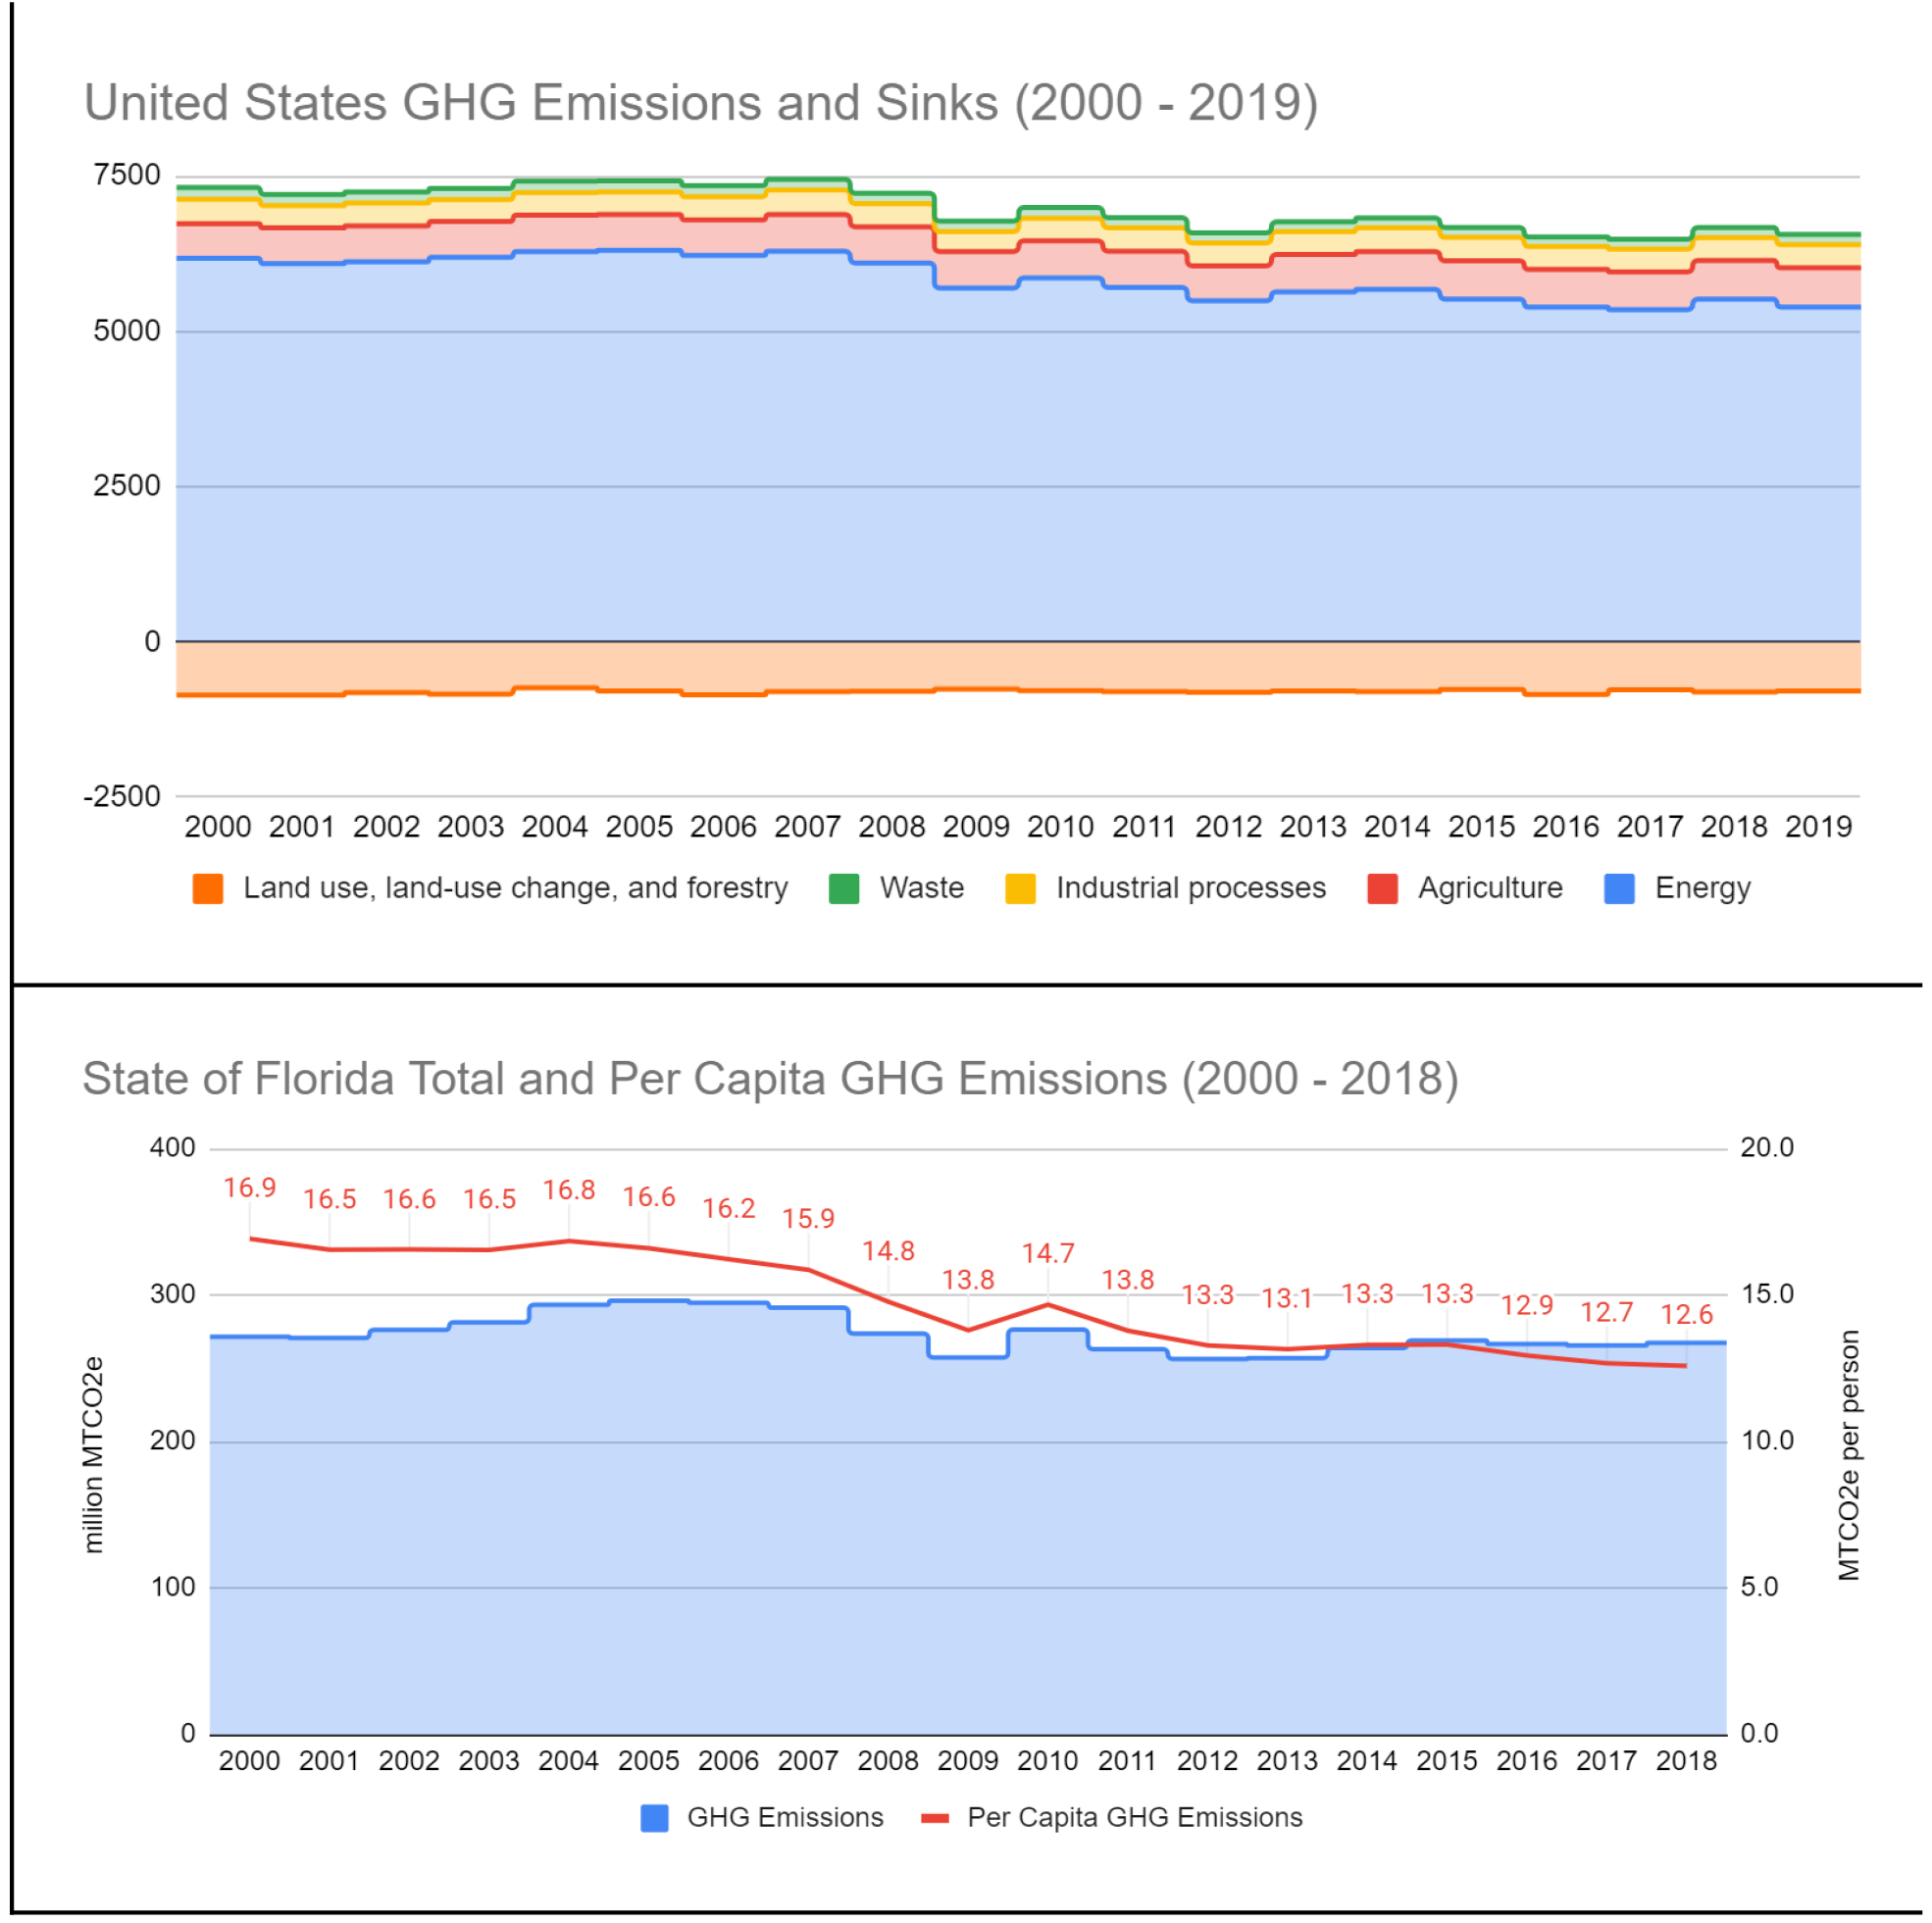
(https://www.wri.org/data/climate-watch-us-states-greenhouse-gas-emissions)World Resources Institute
(https://www.epa.gov/ghgemissions/inventory-us-greenhouse-gas-emissions-and-sinks)Inventory of U.S. Greenhouse Gas Emissions and Sinks | Greenhouse Gas (GHG) Emissions | US EPA
1.2.4 City of Tampa Greenhouse Gas Methodological Approach
Table 1-2 provides a summary of the methodological approach for specifications laid out in the GHG Protocol. Since this inventory provides a forecast for emissions through 2050, data collected for multiple years was sought using the highest quality data available. Measuring emissions directly from its source (e.g., at the smoke stack) is the highest quality of data (Tier 3 as defined by IPCC). Examples of Tier 3 data include GHG emissions from electrical power companies (i.e., TECO Energy and TECO’s Peoples Gas), solid waste facilities (i.e., McKay Bay Refuse-to-Energy Facility), and industrial plants. Tier 1 data represents data that uses high level estimating protocols and Tier 2 may have a combination of different Tiers of data and/or methodology. When direct emissions are not available, “activity data” is used to estimate emissions using an “emission factor” that is obtained from published tables and studies. For example, in electricity consumption, the activity data is the kilowatt-hour (KWH) and the emission factor is multiplied by the KWH to estimate GHG emissions. Detailed methodology including all activity data sources, emission factors, and methods summary are presented in each of Government Operations and City-wide GHG Inventories (Sections 3 and 4, respectively).
| GHG Specification | Description |
|---|---|
| Inventory Year Selection | Calendar Year 2019 was used for this analysis. A previous GHG inventory was conducted using 2009 activity data for both municipal and city-wide emissions. |
| Boundary Definition | Operational Control Method |
| Materiality Assessment | All GHG categories, regardless of scope, were identified and considered for inclusion in this inventory. Data gaps identified for all sources, including small sources are considered in the materiality assessment included as Appendix A. |
| Emission Factor Selection | Standard emission factors:
|
| Global Warming Potential (GWP) | IPCC 5th Assessment Report. The 2009 inventory used the 4th Assessment Report. 2009 emissions were recalculated with updated emission factors and GWPs for consistent comparisons. |
| Data Quality Assessment | This inventory uses a tiered system similar to IPCC guidance documents to identify low, moderate, and high quality GHG estimates.
|
1.3 GREENHOUSE GAS INVENTORY STRUCTURE
The inventory is organized to facilitate ease of use. For this reason, Chapter 2 provides background information to understand citywide trends and forecasted emissions to 2040. Chapter 3 presents the Government Operations Inventory, complete with the methods and results for each category and by facility or use. Chapter 4 presents the Community GHG Inventory, first by category (electricity, natural gas, transportation, solid waste, water/wastewater, and land use) and then by sector (i.e., residential, commercial, industrial, and government).
The GHG Inventory is linked to a series of databases that include all activity data collected during this inventory, emission factor selection, and GHG emission estimates and synthesis. The data that underlies this GHG inventory is contained in databases so that future inventories will have all data needed to recalculate the inventory in future years as data quality and methodological approaches are improved. Lastly, the methodological approach is presented in each category and sub-category and in some cases provided in the Appendices and linked databases.
2.0 ABOUT THE CITY OF TAMPA
2.1 CITY OF TAMPA LAND USE
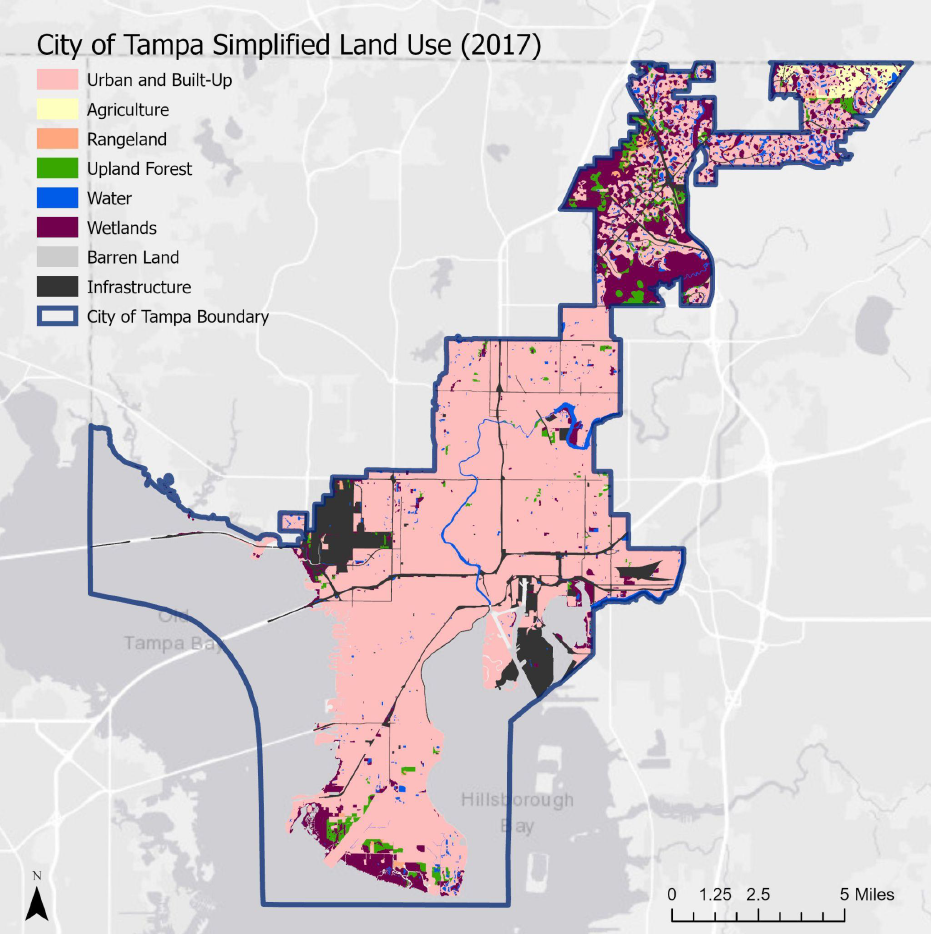
The City of Tampa is primarily urbanized (72 percent) as shown on Figure 2-1 with little change from 2009 to 2017 (Figure 2-2). Wetlands comprise the next largest land use category with 13 percent. Infrastructure, defined as communications, transportation, and utilities, occupies 10 percent of land and has increased by approximately three percent from 2009 to 2017. Agricultural land use has declined by 25 percent, but historically occupied a small percentage of the total land use in the City of Tampa (currently only 1.5 percent). A more detailed list of land uses are provided in the City-wide inventory in Section 4.2.7.

Data Source: Southwest Florida Water Management District, (2009 and 2017)
(https://data-swfwmd.opendata.arcgis.com/search?groupIds=880fc95697ce45c3a8b078bb752faf40)Florida Land Use and Cover Classification System (FLUCCS) data
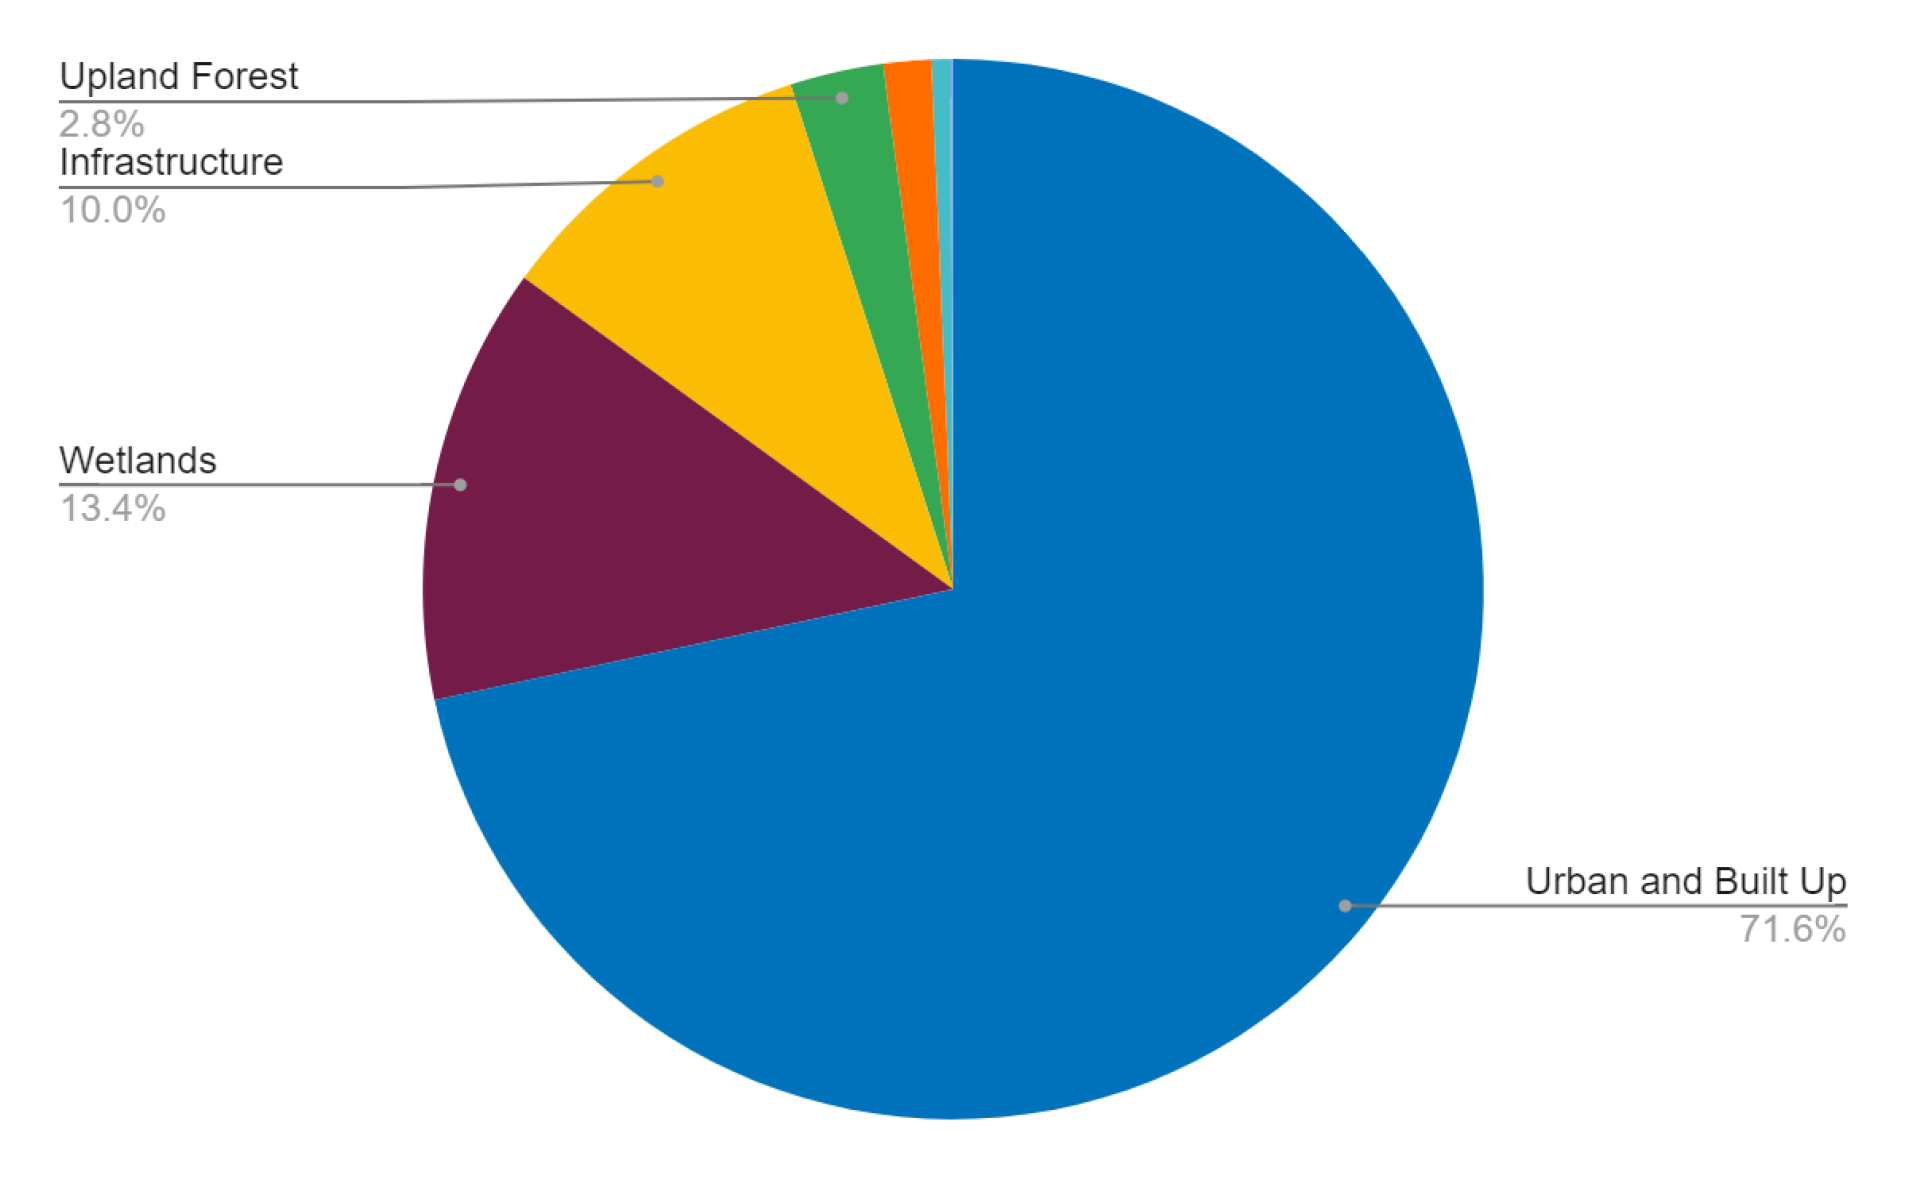
| Land Use | Area in 2009 (Acres) | Area in 2019 (Acres) | Percent Change |
|---|---|---|---|
| Urban and Built Up | 52,093 | 52,189 | 0.2% |
| Water | 23,423 | 23,543 | 0.5% |
| Wetlands | 9,790 | 9,725 | -0.7% |
| Infrastructure | 7,076 | 7,316 | 3.4% |
| Upland Forest | 2,147 | 2,068 | -3.7% |
| Agriculture | 1,426 | 1,063 | -25.4% |
| Rangeland | 431 | 422 | -2.1% |
| Barren Land | 2 | 61 | - |
Data Source: Southwest Florida Water Management District, (2009 and 2017) (https://data-swfwmd.opendata.arcgis.com/search?groupIds=880fc95697ce45c3a8b078bb752faf40) Florida Land Use and Cover Classification System (FLUCCS) data
According to Hillsborough County Property Assessor data, the City of Tampa owns 1,227 parcels (Figure 2-3) and operates 664 buildings located throughout the City. Additionally, federal, state, and local governments (termed “jurisdictions” in this inventory) also occupy land within the City (e.g., MacDill Air Force Base, University of South Florida, Port Authority, and Tampa International Airport). GHG emissions from the City of Tampa are presented in Section 3.0, and Section 4.0 presents GHG emissions from all government entities in Section 4.
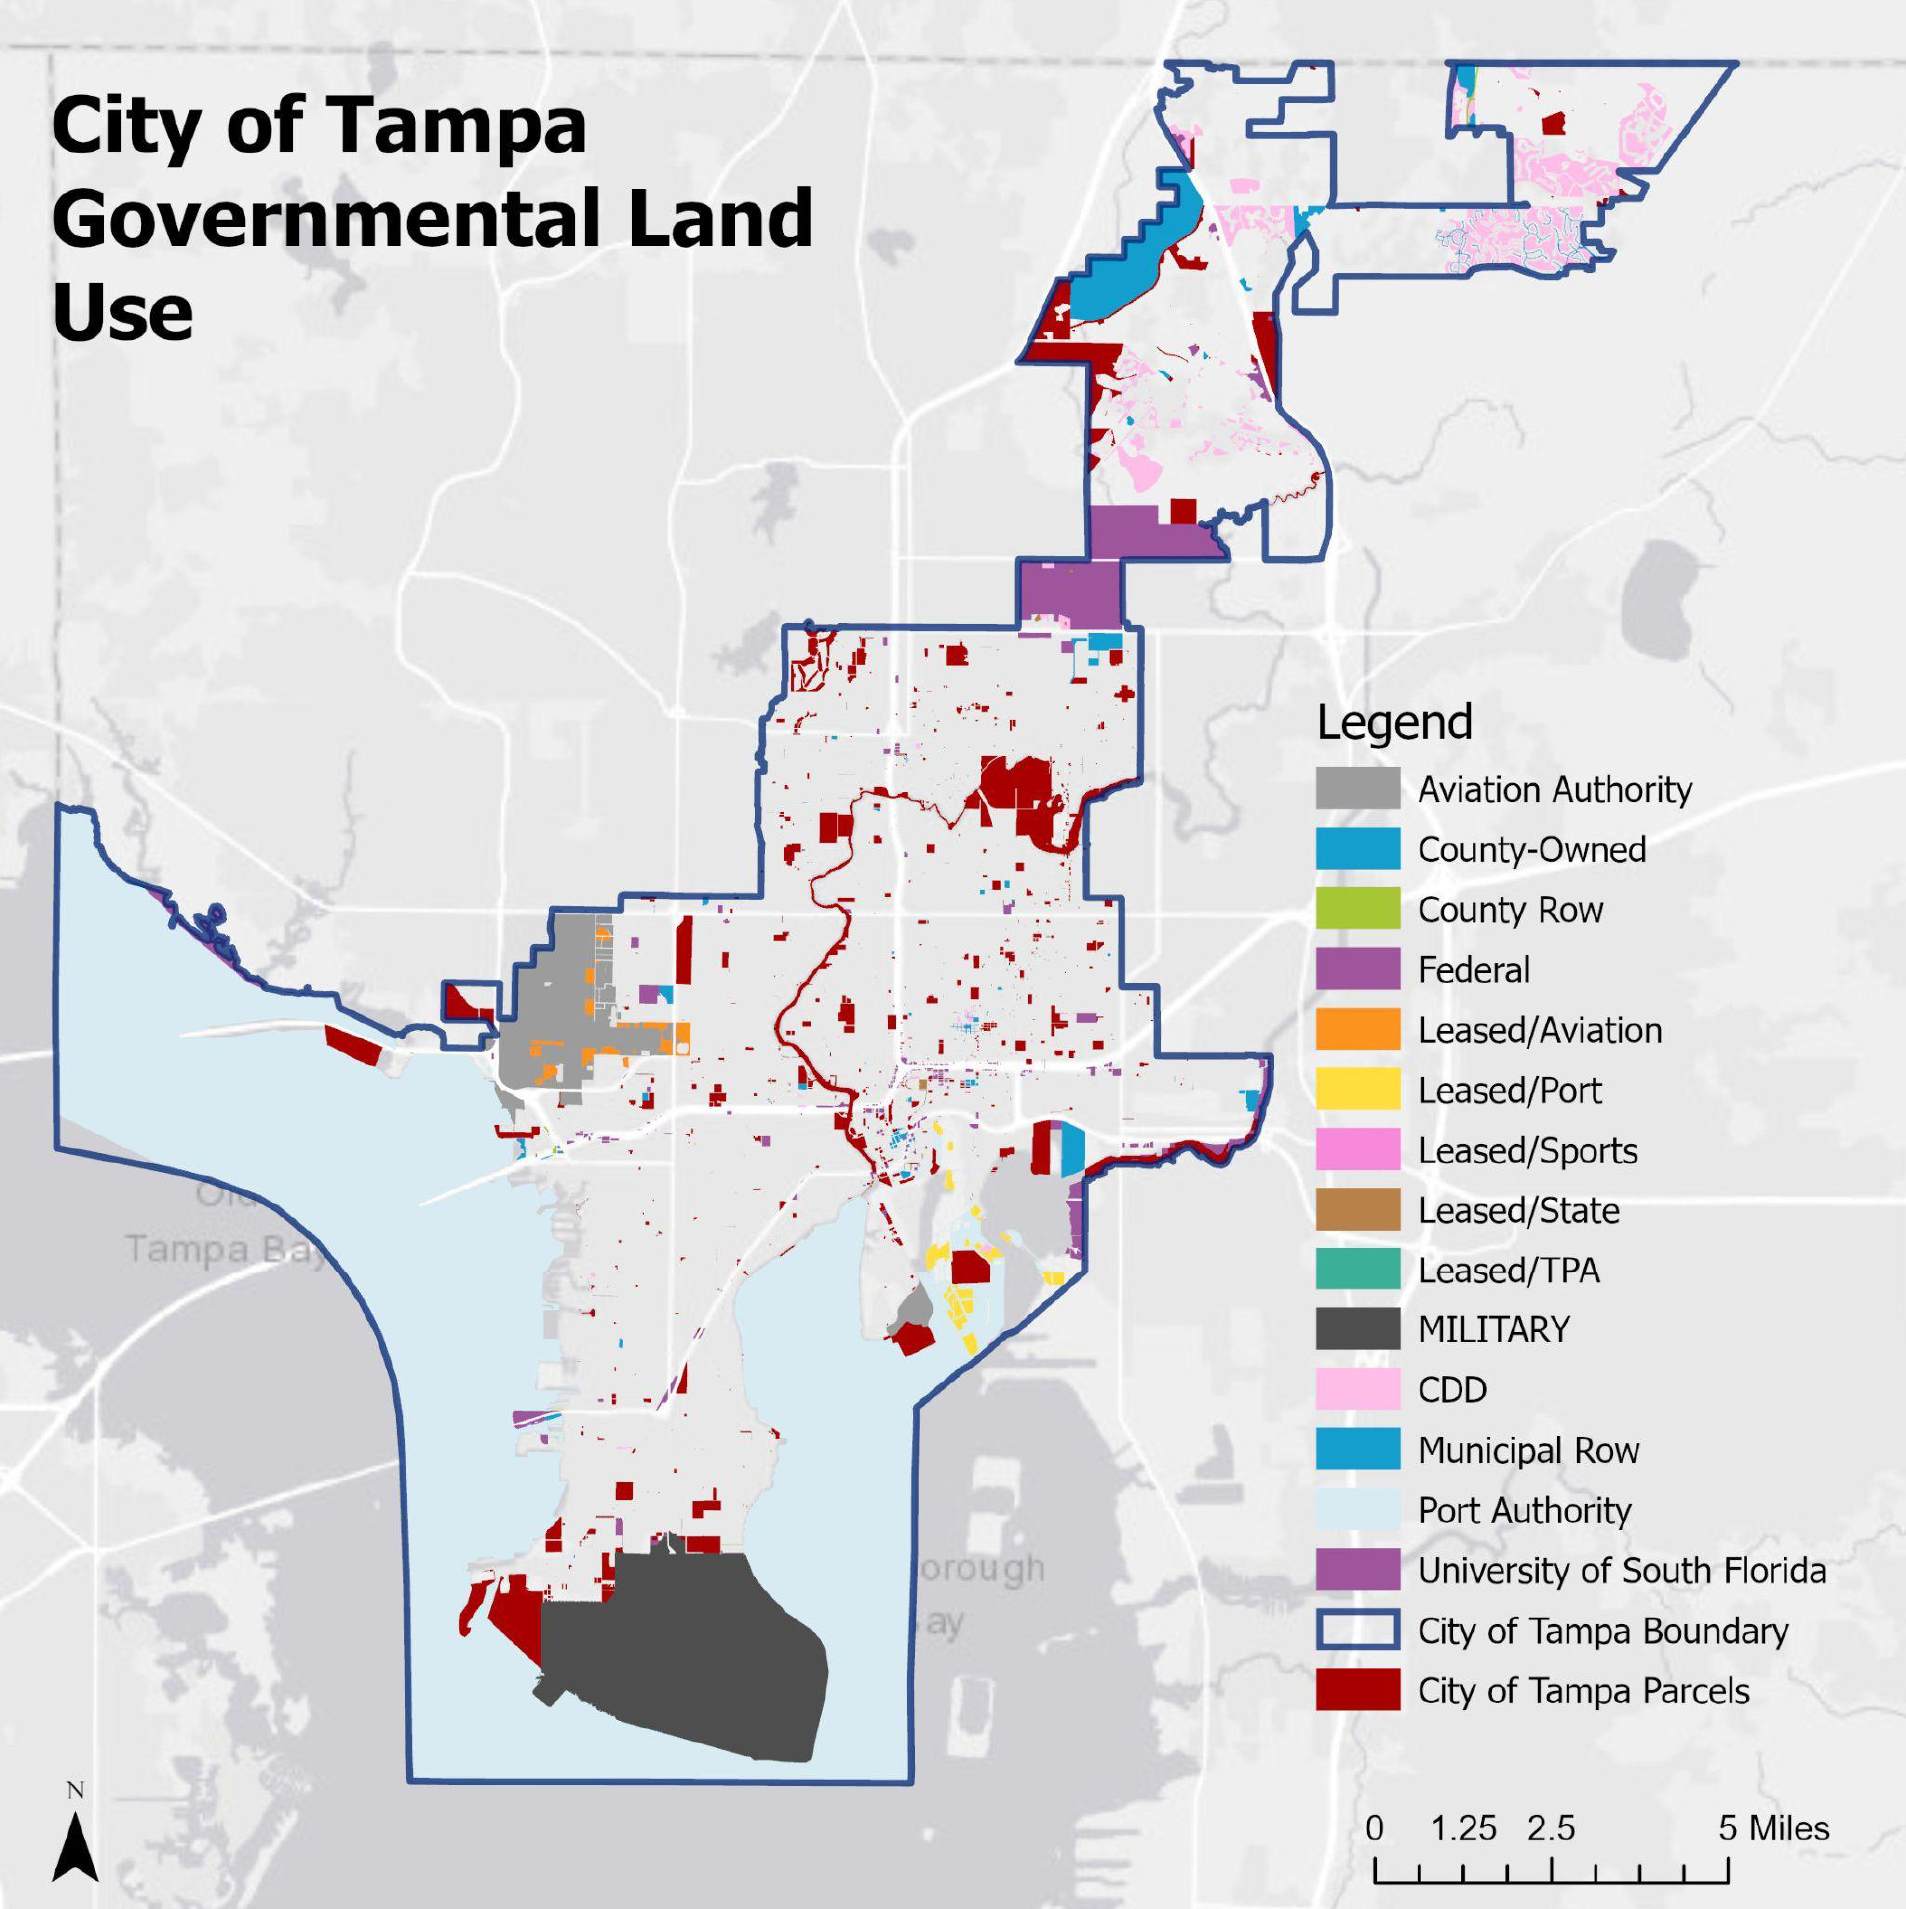
Data Source: Hillsborough County Parcel Data, October 2020. CDD=Commercial Community District Row=Right of Way
2.2 POPULATION TRENDS
The City of Tampa’s population has increased approximately 28 percent from over 340,000 people in 2009 to close to 400,000 people in 2019. Historic population estimates from the US Census 5-year estimates (Table 2-1) and projected population estimates from the City of Tampa’s Comprehensive Plan titled, Imagine 2040 7 were plotted on Figure 2-4, and a best fit line was projected to obtain an estimate for 2050 since many. Imagine 2040 projections matched closest with the census 5-year estimates which represent a more precise and reliable estimate than the ACS 1-year estimate.8 Based on the projections, the City of Tampa will gain another 100,000 people over the next 20 to 30 years (estimates used in this inventory are 481,128 in 2040 (from Imagine 2040) and 540,000 from the projected best fit line (Figure 2-4) and Figure 2-5 shows where growth is projected to grow within the City of Tampa.
| Year | Imagine 2040 Population Estimate and Projection | US Census (ACS 5-year estimates) | Bureau of Economic and Business Research (BEBR) | US Census (ACS 1-year estimates) | Florida Population US Census (ACS 5-year estimates) |
|---|---|---|---|---|---|
| 2009 | - | 343,890 | 343,890 | - | 18,423,878 |
| 2010 | 333,327 | 333,327 | 335,709 | 339,945 | 18,511,620 |
| 2011 | - | 336,171 | 346,474 | 346,064 | 18,688,787 |
| 2012 | - | 339,391 | 347,645 | 347,650 | 18,885,152 |
| 2013 | - | 343,768 | 352,957 | 352,981 | 19,091,156 |
| 2014 | - | 348,934 | 358,699 | 358,684 | 19,361,792 |
| 2015 | 355,850 | 355,603 | 369,075 | 369,028 | 19,645,772 |
| 2016 | - | 361,477 | 377,165 | 377,172 | 19,934,451 |
| 2017 | - | 368,087 | 385,430 | 385,423 | 20,278,447 |
| 2018 | - | 376,345 | 392,890 | 392,905 | 20,598,139 |
| 2019 | - | 387,916 | 399,700 | 399,690 | 20,901,636 |
| 2020 | 384,153* | - | 392,953 | - | |
| 2025 | 384,153* | - | - | - | |
| 2030 | 410,669* | - | - | - | |
| 2035 | 433,103* | - | - | - | |
| 2040 | 481,128* | - | - | - |
*Projection based on 2015 population estimate from Imagine 2040. ** Best fit line projected to 2050 using exponential trendline (see Figure 2-4).
7 Population statistics provided for 2015 and projections for 2020, 2025, 2030, and 2040, available at: (http://www.planhillsborough.org/wp-content/uploads/2015/09/Imagine-2040-Background-Document.pdf)
8 See census guidance for a description on accuracy and precision of 1-year, 3-year, and 5-year census data at: (https://www.census.gov/programs-surveys/acs/guidance/estimates.html)
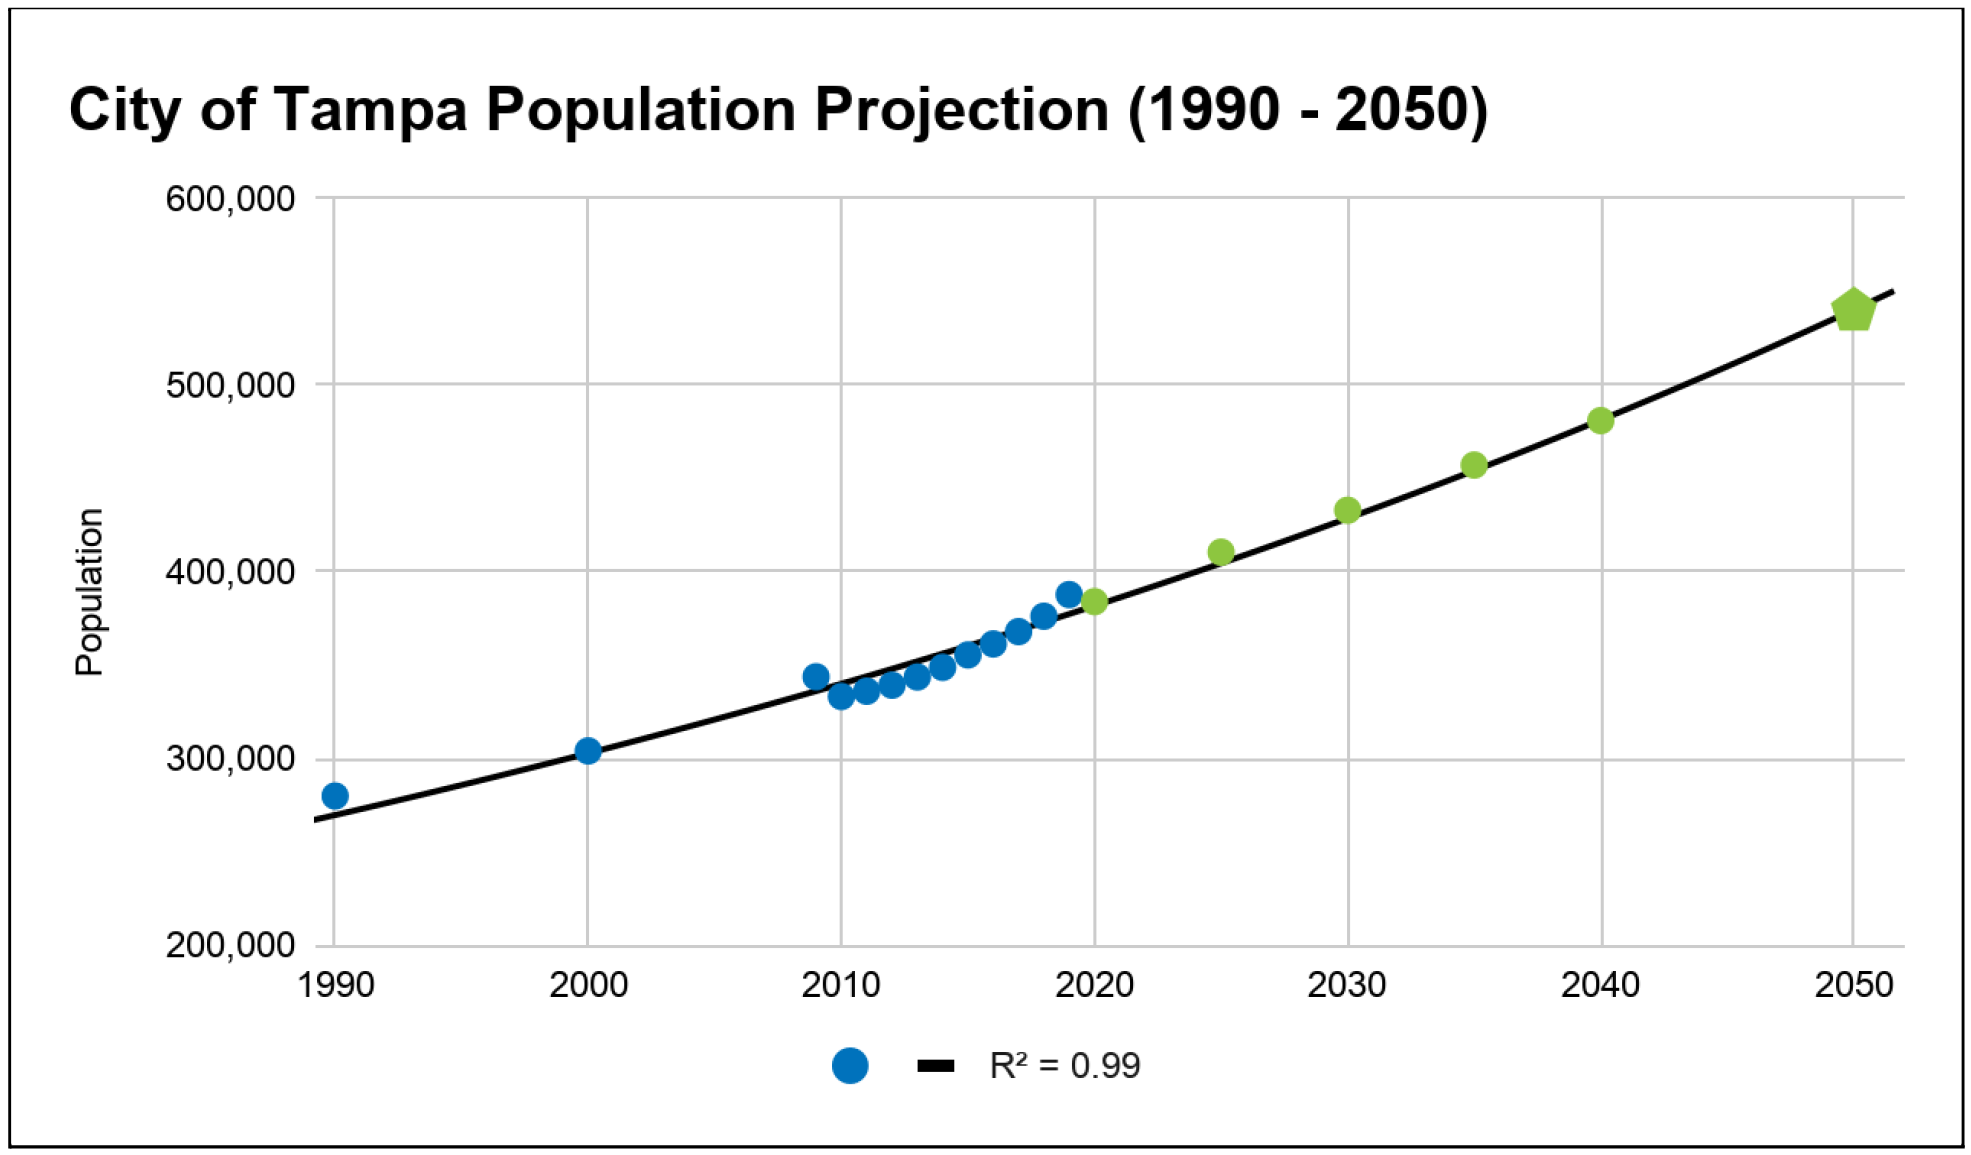
Notes: Blue dots indicate population estimates from 5-year ACS census, green circles (2020 to 2040) were obtained from the City of Tampa’s Imagine 2040 plan. The 2050 projected population value was projected using a best fit line.
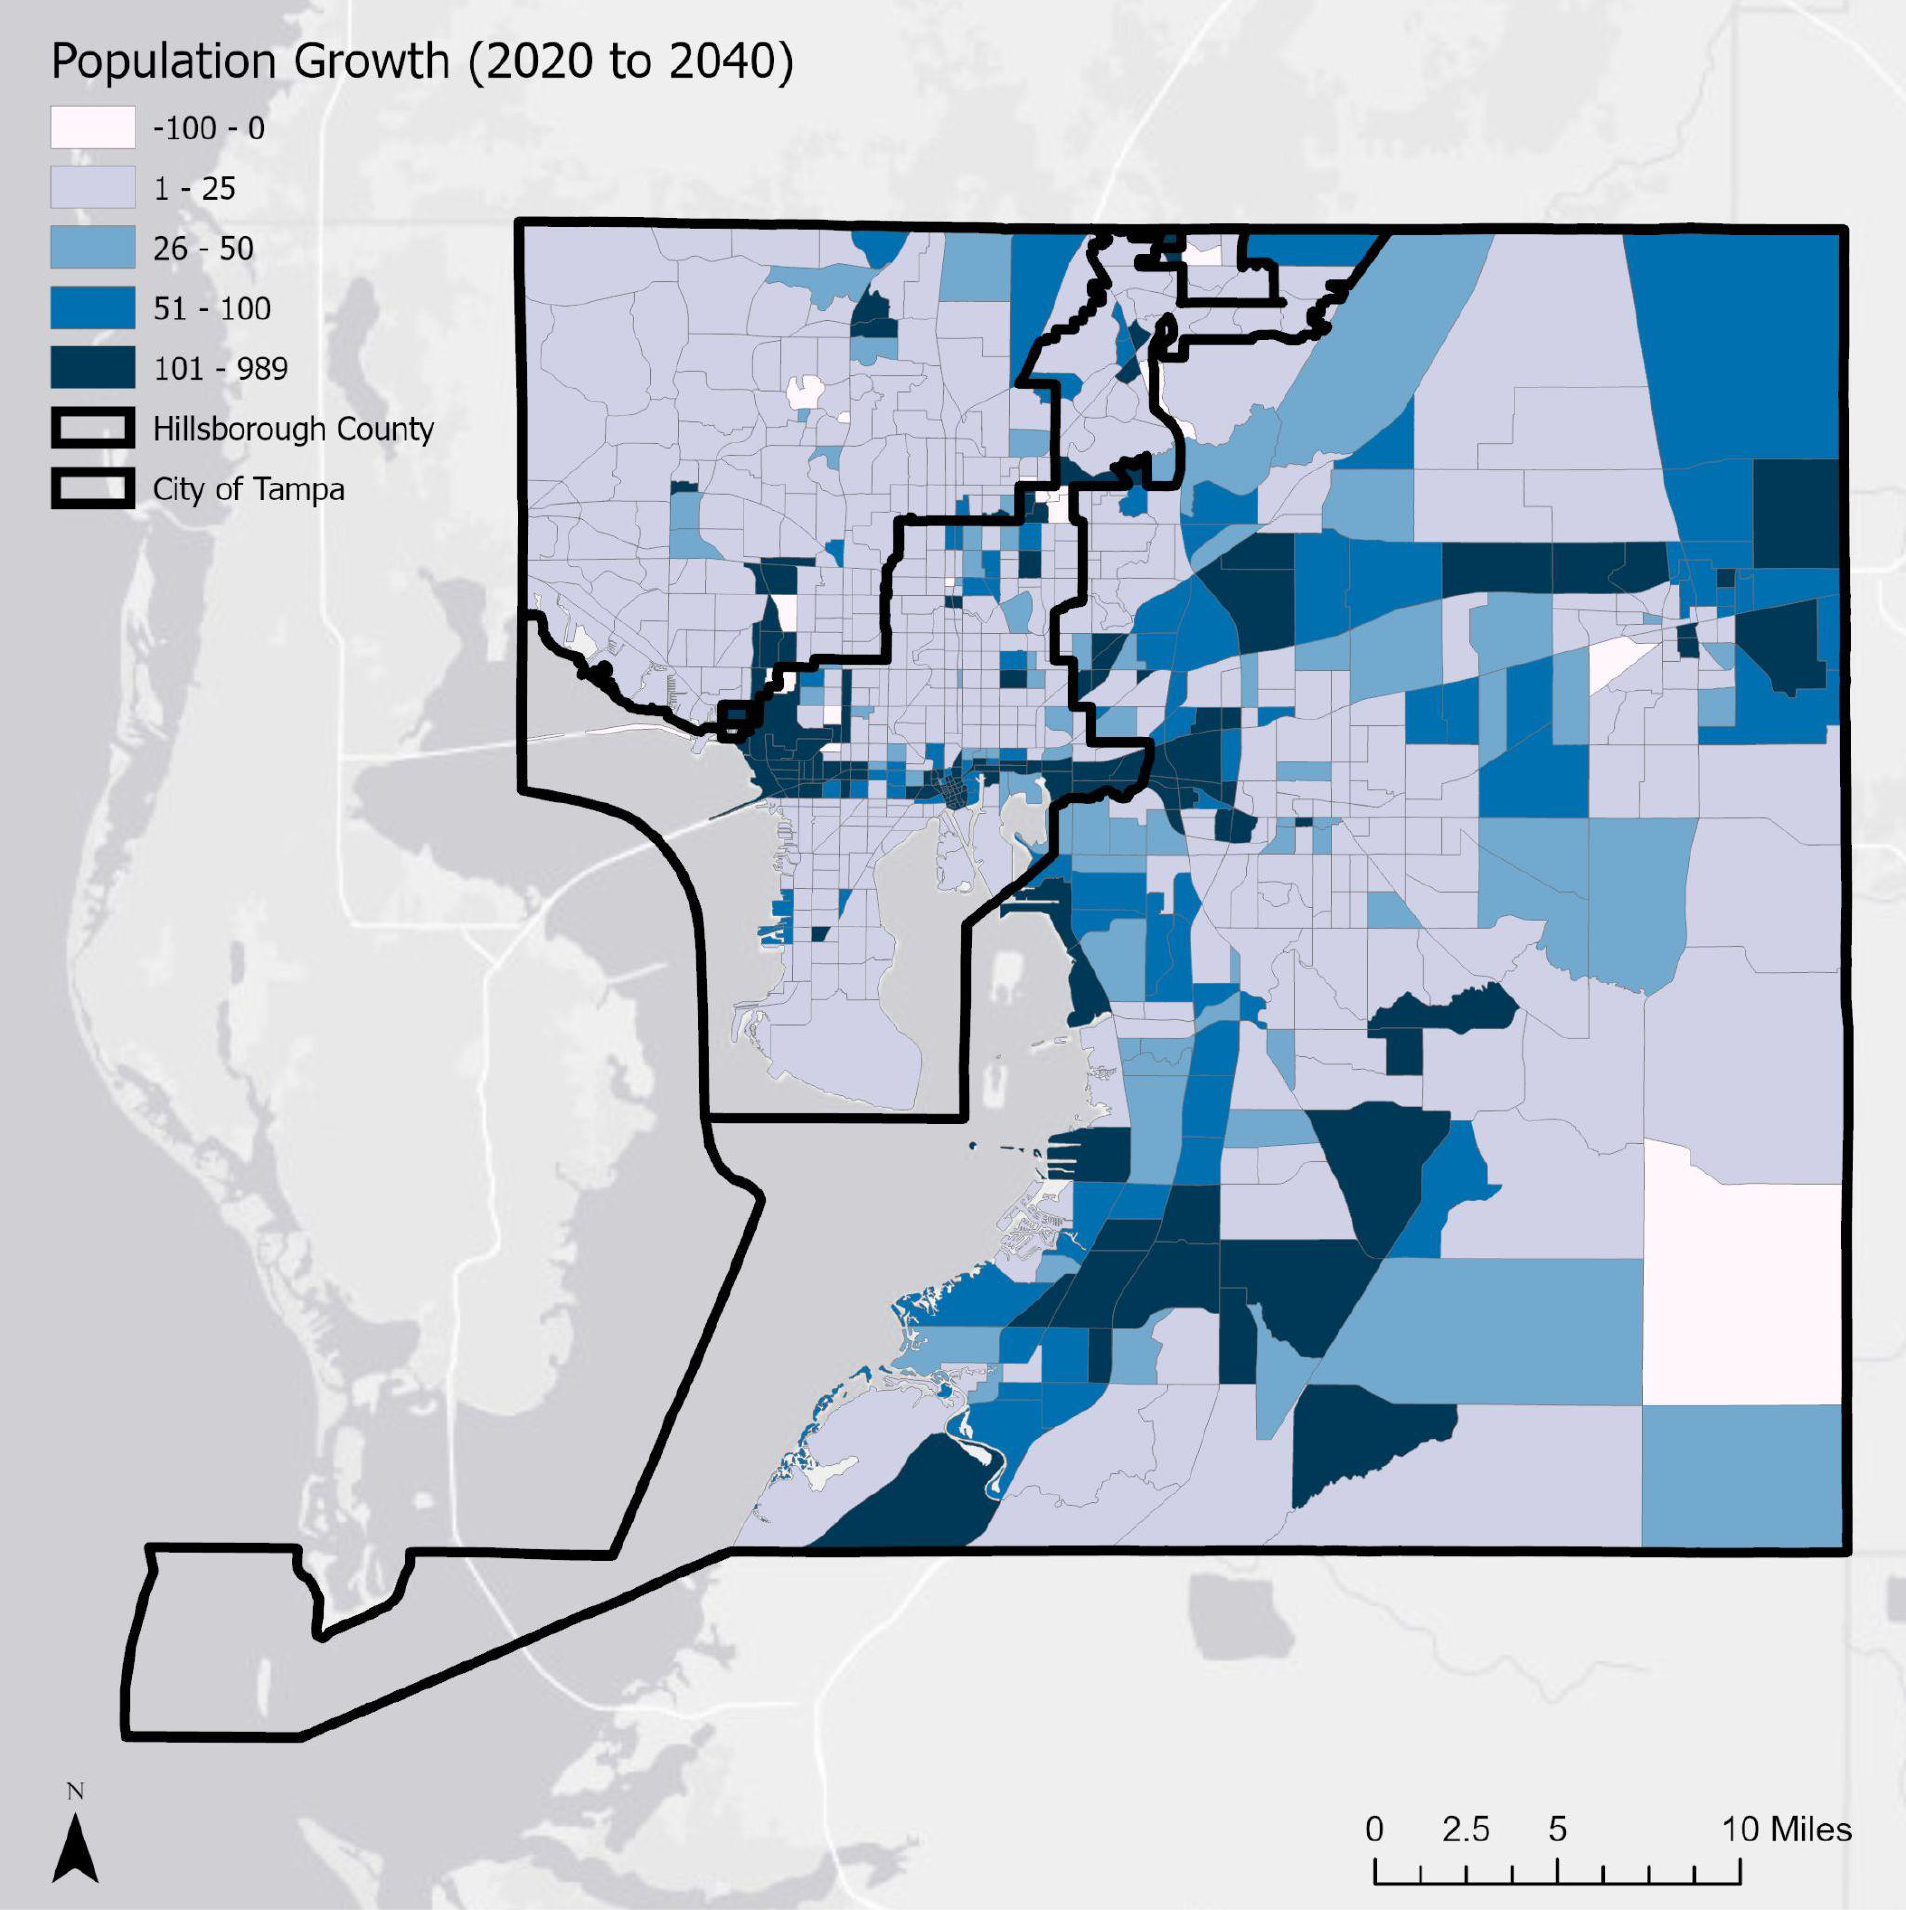
Data Source: Plan Hillsborough, (https://planhillsborough.org/gis-maps-data-files/) Transportation Analysis Zone (TAZ) Growth Projections
2.3 CITY OF TAMPA GOVERNMENT STRUCTURE
The City of Tampa operates under a mayoral system with 13 departments that serves over 400,000 residents in the City of Tampa (Table 2-2). For the purposes of data aggregation, some departments have been grouped if operations are similar (e.g., administrative offices contain several departments).
| Key Departments | Operations Summary | Relationship to GHG Inventory |
|---|---|---|
| Administrative Offices | Administrative departments operate solely out of a building and have a fleet, including but not limited to the Mayor’s Office, City Council, City Planning, Development & Economic Opportunity, Logistics and Asset Management, and Neighborhood & Community Affairs. | GHG emissions from administrative offices are mostly from electricity and its fleet. Administration sets and implements policy, engages with stakeholder outreach and education, and provides “lead by example” to the City that it serves. |
| Convention Center & Tourism | The Convention Center and Tourism Department is responsible for generation of economic impact through the operation of Tampa Convention Center. | The Convention Center is the highest electricity consumer from a single building. However, the Convention Center has undergone major renovations over the last decade and operates under its own Sustainability Plan (<https:>).</https:> |
| Development & Growth Management | The Housing and Community Development Department (HCD) plays a lead role in the development of housing and citizen support programs to serve the city's low and moderate income households, homeless, and disabled populations. | There is a large potential for energy efficiency programs in residential, commercial, and industrial sectors. Multifamily apartments and commercial sectors are the highest opportunities for GHG reductions City-wide. |
| Infrastructure & Mobility | The Infrastructure and Mobility Administration seeks to elevate the City of Tampa as a national leader of Construction Management, Facilities Maintenance, Fleet Management, Mobility, Solid Waste Services, and Utilities in the country and to provide the highest quality municipal infrastructure. | Infrastructure and mobility directly manages the City’s buildings and fleet, which are the largest sources of GHG emissions for government operations. Additionally, the City manages city roads and can implement efficiencies in road transportation (e.g., time of streetlights). Solid waste and water utilities described below. |
| Parks and Recreations | Operates multiple facilities throughout the City of Tampa, including recreation centers, pools, and senior centers.. | Parks and Recreations is the third largest source by department. Sources include energy use in recreation centers and pools. Opportunities exist for carbon sequestration projects on park lands. |
| Fire Rescue | Provides fire protection and emergency medical services throughout the City. | Most GHG emissions derive from electricity and from its fleet. Of note are the seven sustainability initiatives for new station #19. |
| Police Department | Primary law enforcement agency in Tampa. Central facility downtown with parking garage, smaller buildings located throughout the City, fleet of vehicles. | Downtown Police Station is a large energy use given its 24-hours a day operation and its fleet of police vehicles. |
| Department | Description | GHG Emission Sources |
|---|---|---|
| Solid Waste & Environmental Program Management | The Department of Solid Waste & Environmental Program Management provides environmentally safe, time responsive, and cost effective collection, disposal and recycling services. | The Solid Waste Department is responsible for managing solid waste generated in the City and thus is responsible for the GHG emissions from this waste (i.e., combustion at the McKay Bay Refuse-to-Energy (RFE) facility). Overflow waste is sent to the Southeast County Landfill located outside city limits. This department switched out 22 of its diesel fleet with CNG vehicles in 2013. The City took operational control of the McKay Bay RFE facility in June 2020. |
| Wastewater | The Wastewater Department's goal is to provide outstanding Wastewater services to our customers while protecting public health and the environment. | GHG emissions from wastewater include direct fugitive emissions from wastewater processed at its plants and from electricity to pump water to and from its plants. |
| Water | The Tampa Water Department delivers potable and reclaimed water services to more than 124,000 service locations. | GHG emissions from the Water Department are from the purchased electricity used to supply water to its treatment plants and pumped to customers throughout the City. The Water Department also has a fleet of vehicles. |
Notes: Department descriptions obtained from (https://www.tampa.gov/departments).
3.0 GOVERNMENT OPERATIONS GREENHOUSE GAS INVENTORY
3.1 GOVERNMENT OPERATIONS GREENHOUSE GAS EMISSIONS OVERVIEW
3.1.1 Government Operations Total and Categorical Greenhouse Gas Emissions
The City of Tampa Government Operations (Government) emitted approximately 234,084 metric tons of carbon dioxide equivalents (mtCO2e) in 2019 (Table 3-1). Solid waste represents the highest category of GHGs, followed by electricity and wastewater (Figure 3-1). Table 3-1 provides a summary of both 2009 and 2019 emissions; however, a direct comparison of total emissions is not possible given data gaps and methodological differences between inventory years. Detailed descriptions, data sources, and methodologies for each category are presented in Section 3.2.
| GHG Category | 2009 GHG Emissions (mtCO2e) | 2019 GHG Emissions (mtCO2e) |
|---|---|---|
| Electricity Consumption | 31,314 | 75,315 |
| Natural Gas Consumption | 5,106 | 2,987 |
| Vehicle Fleet | 26,629 | 9,974 |
| Municipal Solid Waste | 134,169 | 138,317 |
| McKay Bay Refuse-to-Energy | 114,991 | 118,568 |
| Landfill with Transportation | 19,178 | 19,749 |
| Wastewater | 35,681 | 7,491 |
| Fugitive emissions from Wastewater | 30,000 | 7,491 |
| Purchased Water from Tampa Bay Water (TBW) | 5,681 | 0 |
| Employee Commute | (13,416)* | 0 |
| Emission Total | 232,899 | 234,084 |
Notes: *2009 emissions were obtained from a former GHG inventory and are NOT comparable with 2019 emissions given differences in data gaps and methodological approach.
**Employee commuting data was not available for 2019.
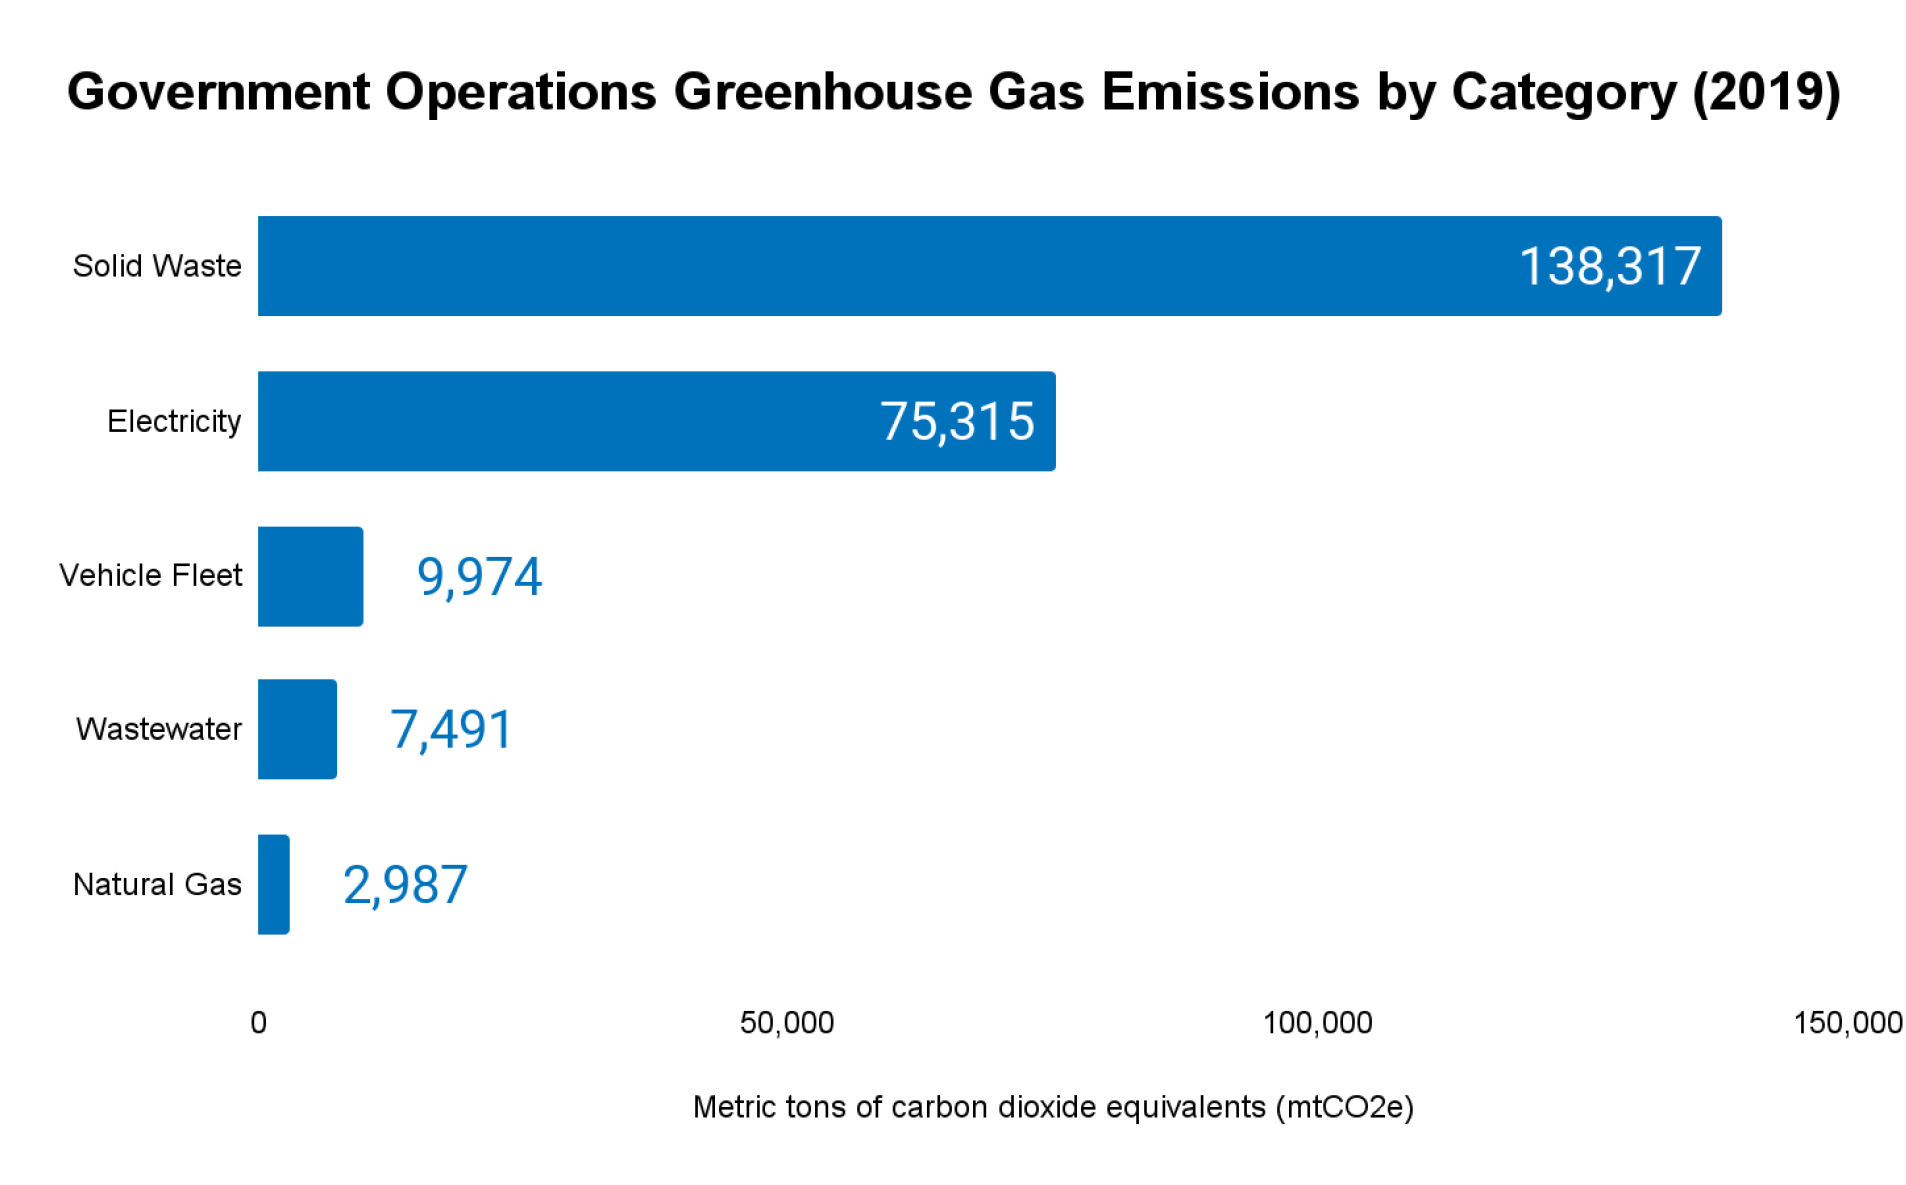
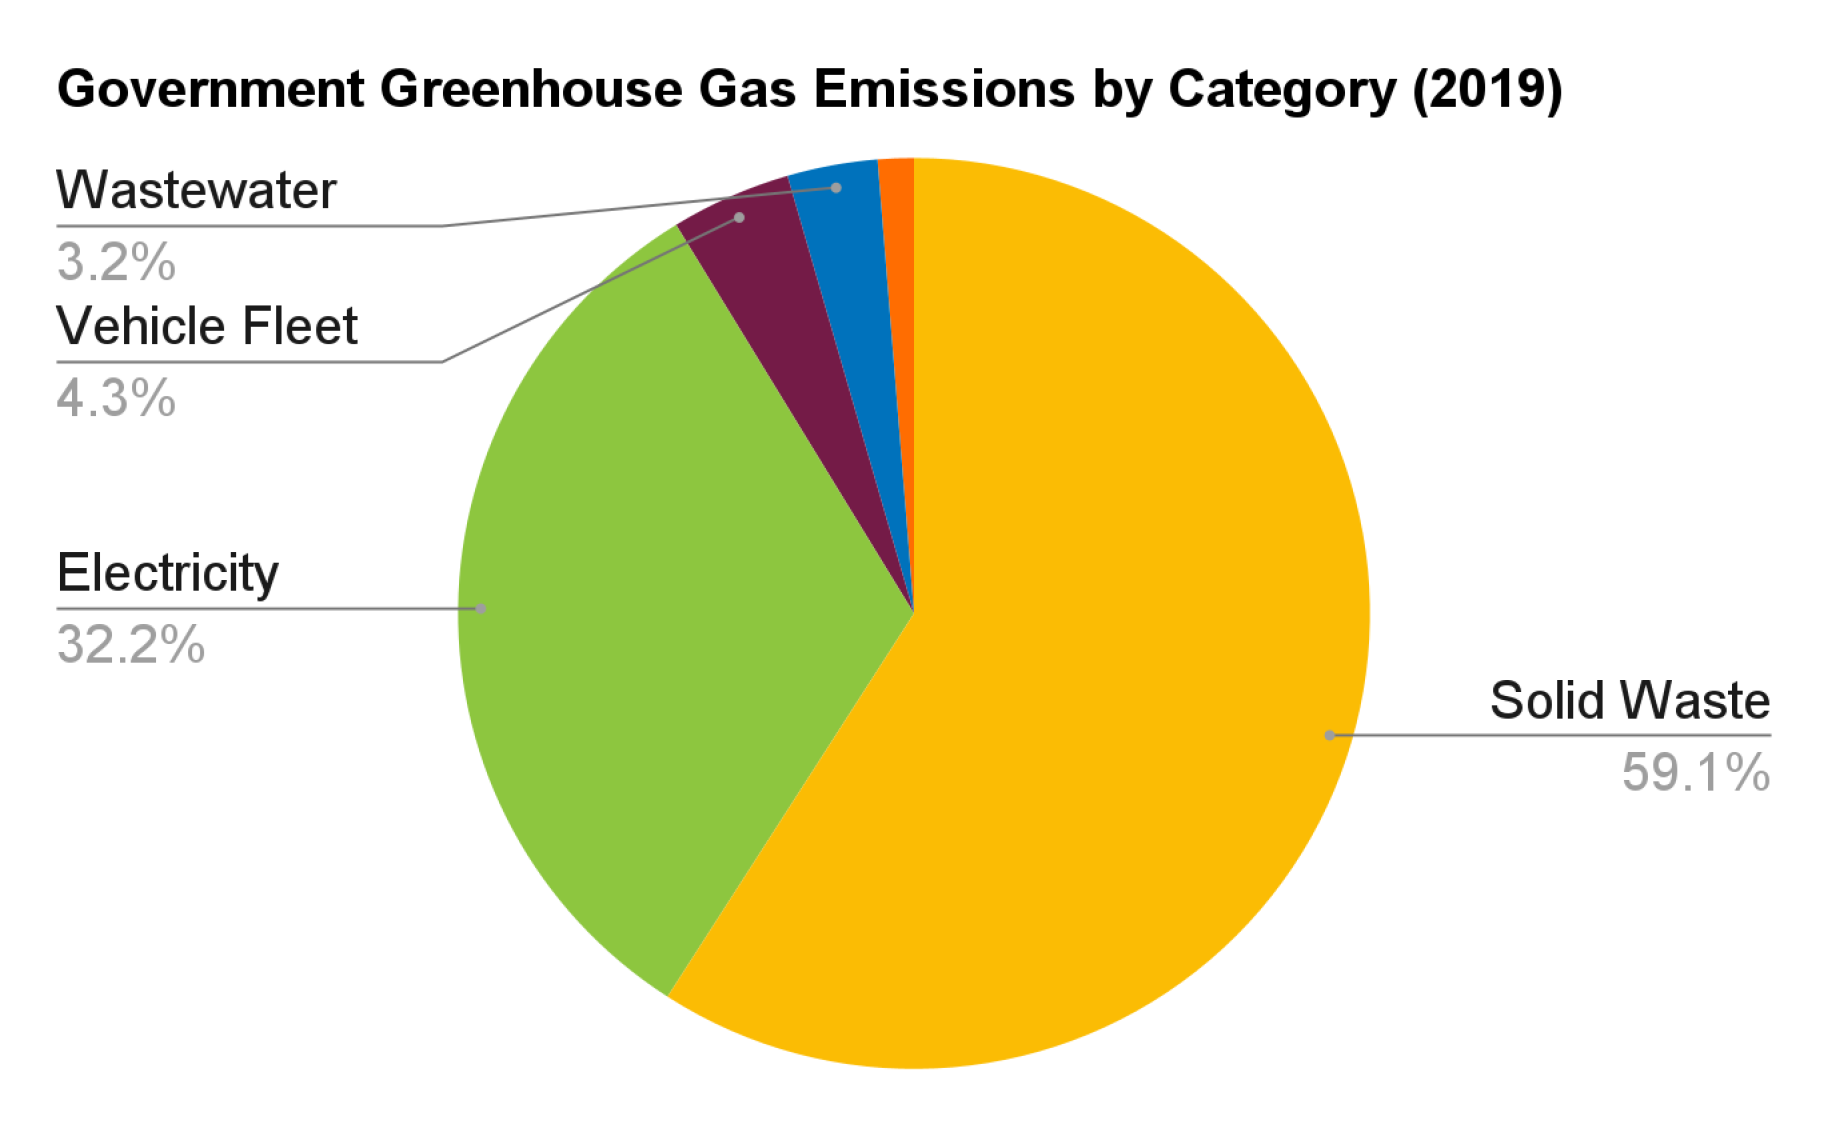
Figure 3-1. Government Operations Greenhouse Gas Emissions by Category (2019)
Note: Electricity from water and wastewater are included in the electricity emissions.
3.1.2 Government Operations Greenhouse Gas Emissions by Department
Figure 3-2 provides a ranking of GHG emissions by department. The Solid Waste department emits the most GHG emissions representing over half of total emissions in the City, followed by the Water and Wastewater Departments and the Parks and Recreations Department.
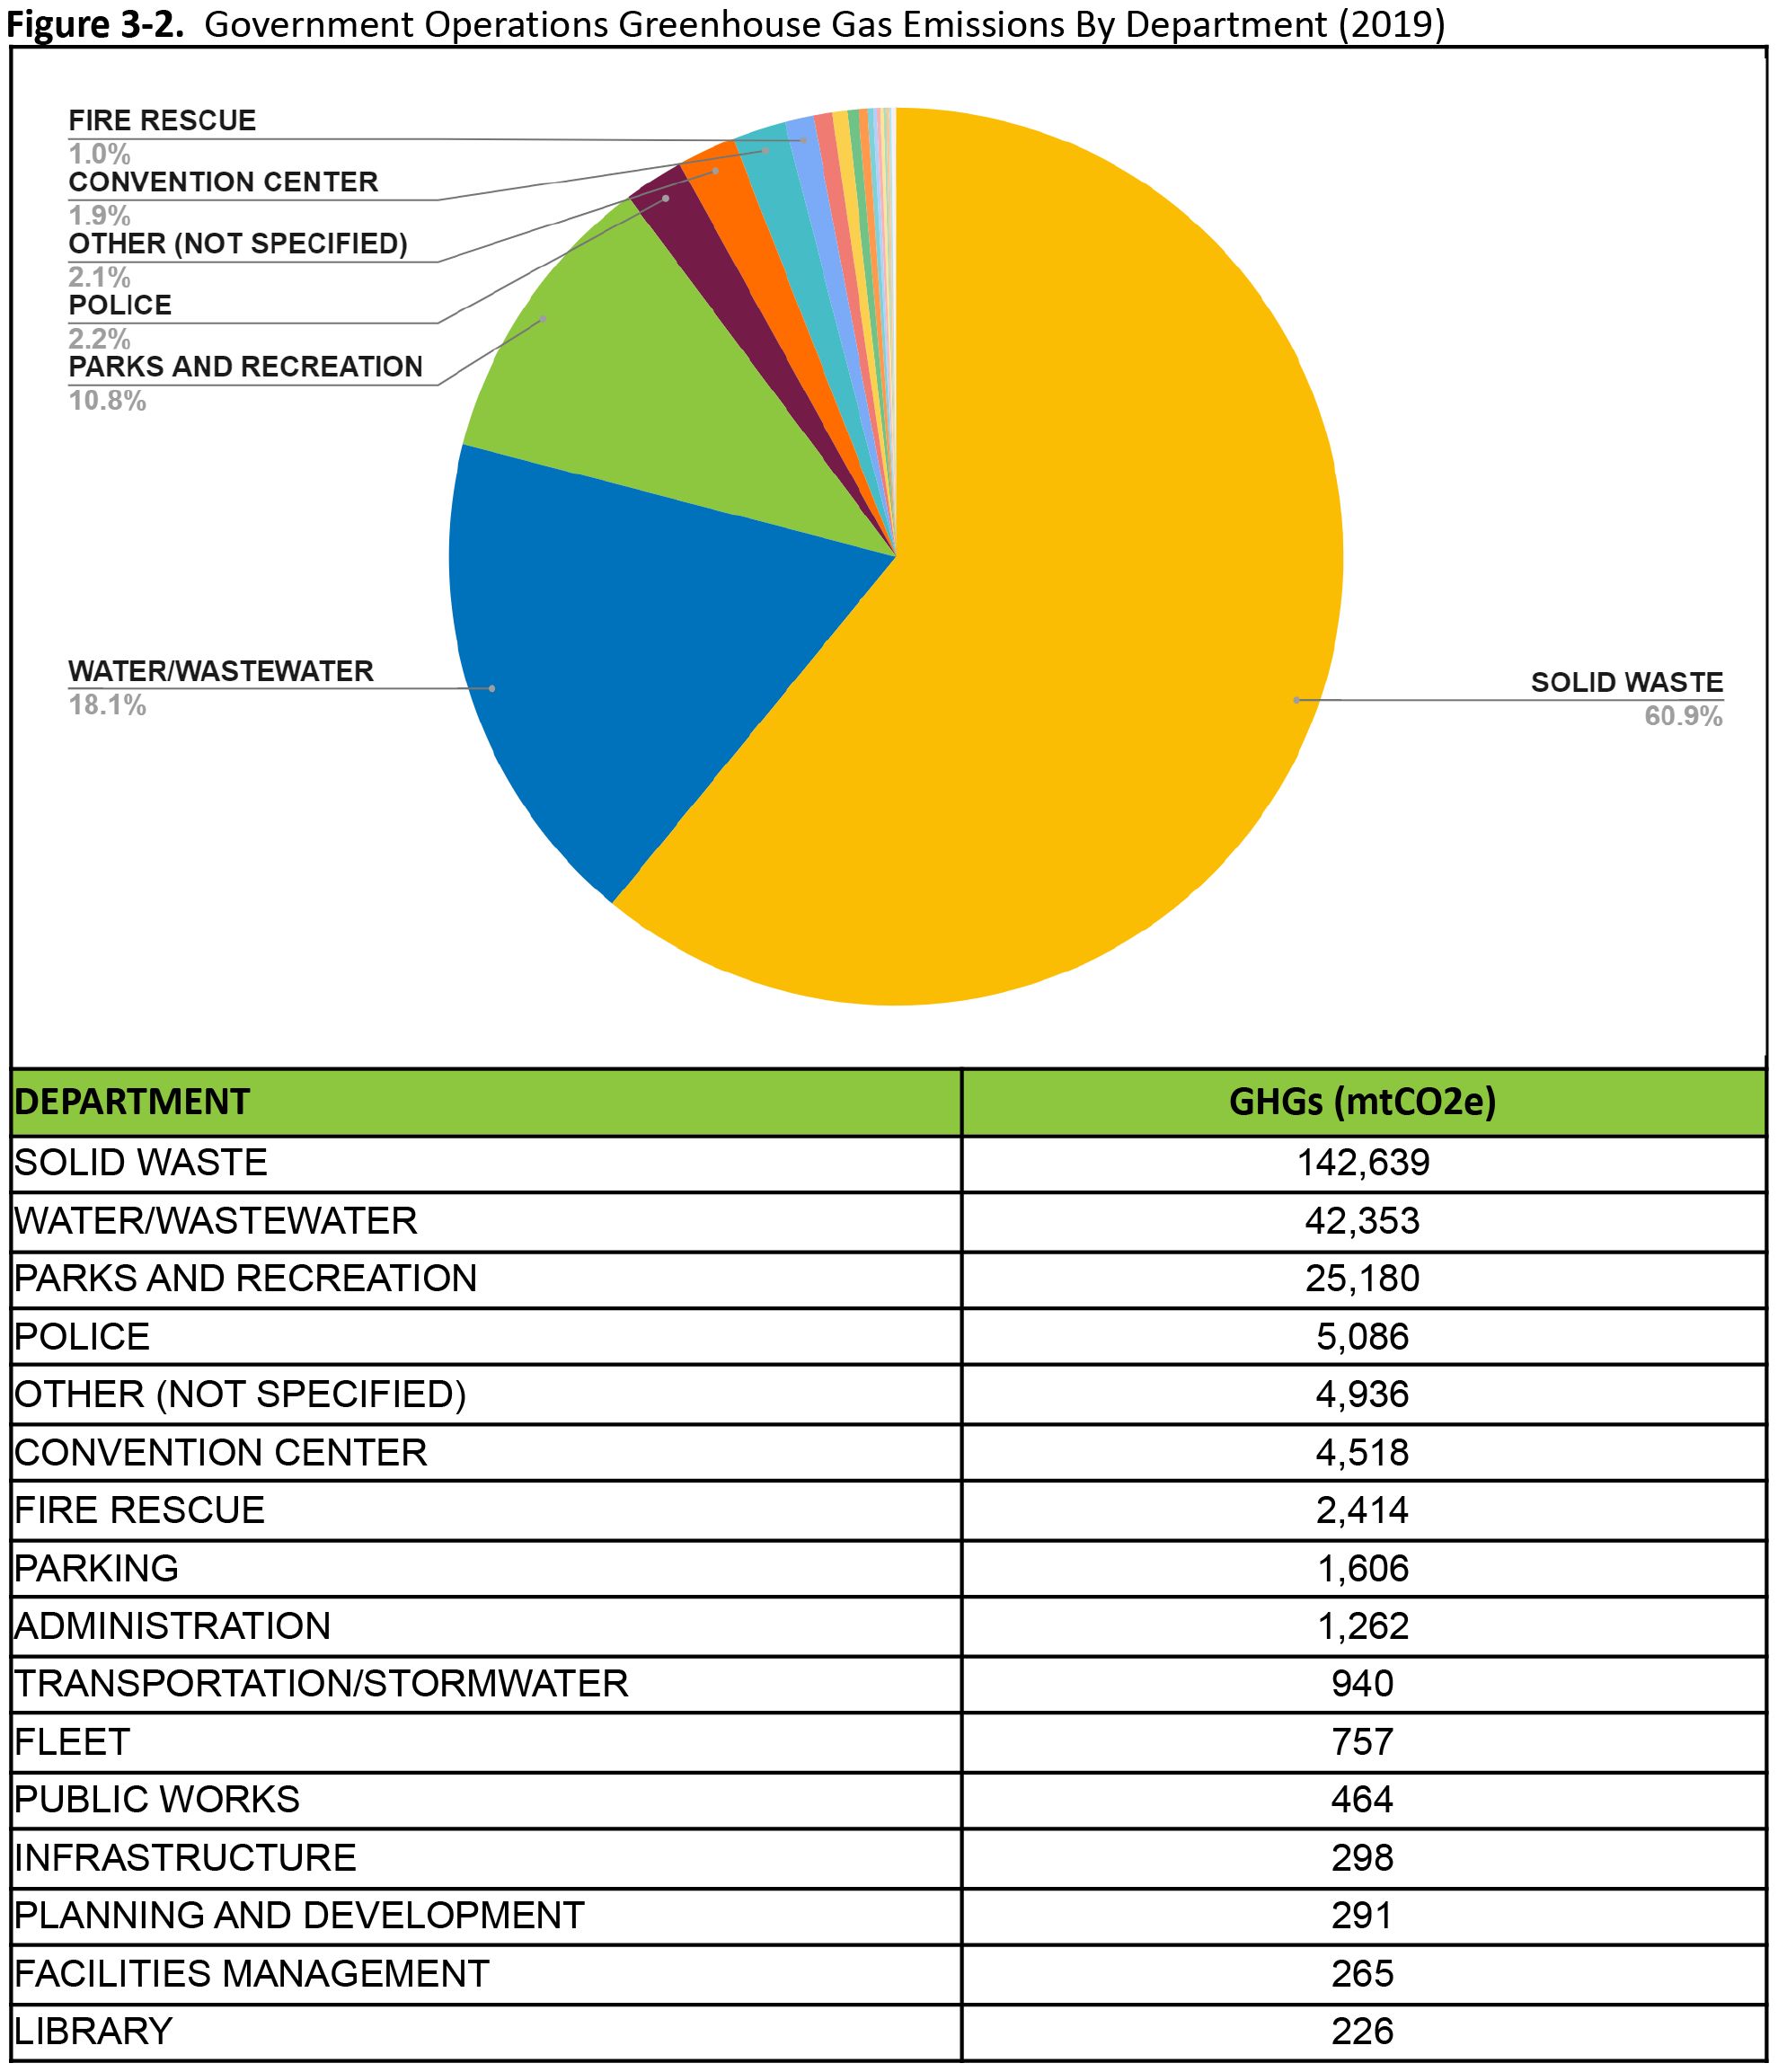
| Department | GHGs (mtCO2e) |
|---|---|
| SOLID WASTE | 142,639 |
| WATER/WASTEWATER | 42,353 |
| PARKS AND RECREATION | 25,180 |
| POLICE | 5,086 |
| OTHER (NOT SPECIFIED) | 4,936 |
| CONVENTION CENTER | 4,518 |
| FIRE RESCUE | 2,414 |
| PARKING | 1,606 |
| ADMINISTRATION | 1,262 |
| TRANSPORTATION/STORMWATER | 940 |
| FLEET | 757 |
| PUBLIC WORKS | 464 |
| INFRASTRUCTURE | 298 |
| PLANNING AND DEVELOPMENT | 291 |
| FACILITIES MANAGEMENT | 265 |
| LIBRARY | 226 |
| Department or Division | Number of Service Requests |
|---|---|
| CONTRACT ADMINISTRATION | 217 |
| NEIGHBORHOOD ENHANCEMENT DIVISION | 192 |
| NEIGHBORHOOD EMPOWERMENT | 139 |
| HEALTH | 138 |
| REAL ESTATE | 82 |
| FLEET MAINTENANCE DIVISION | 23 |
| TECHNOLOGY AND INNOVATION | 16 |
| MAYOR'S OFFICE | 13 |
| CENTRAL SERVICES | 10 |
| RISK AND INSURANCE DIVISION | 6 |
| COMMUNITY PARTNERSHIPS AND NEIGHBORHOOD | 5 |
| FACILITY MANAGEMENT | 2 |
| MARKETING AND COMMUNICATIONS DIVISION | 2 |
| CITY CLERK | 2 |
| PURCHASING | 1 |
| CODE ENFORCEMENT | 0 |
| GMDS | 0 |
| FINANCE | 0 |
| TOTAL | 234,083 |
3.1.3 Government Operations Greenhouse Gas Forecast
To estimate trends in GHG emissions under Business as Usual (BAU), conditions were calculated through 2050 by assuming emissions remain constant and scale with the projected population change (Figure 3-3). These estimates can be used to measure the impact of specific GHG reduction strategies during the climate action planning process.
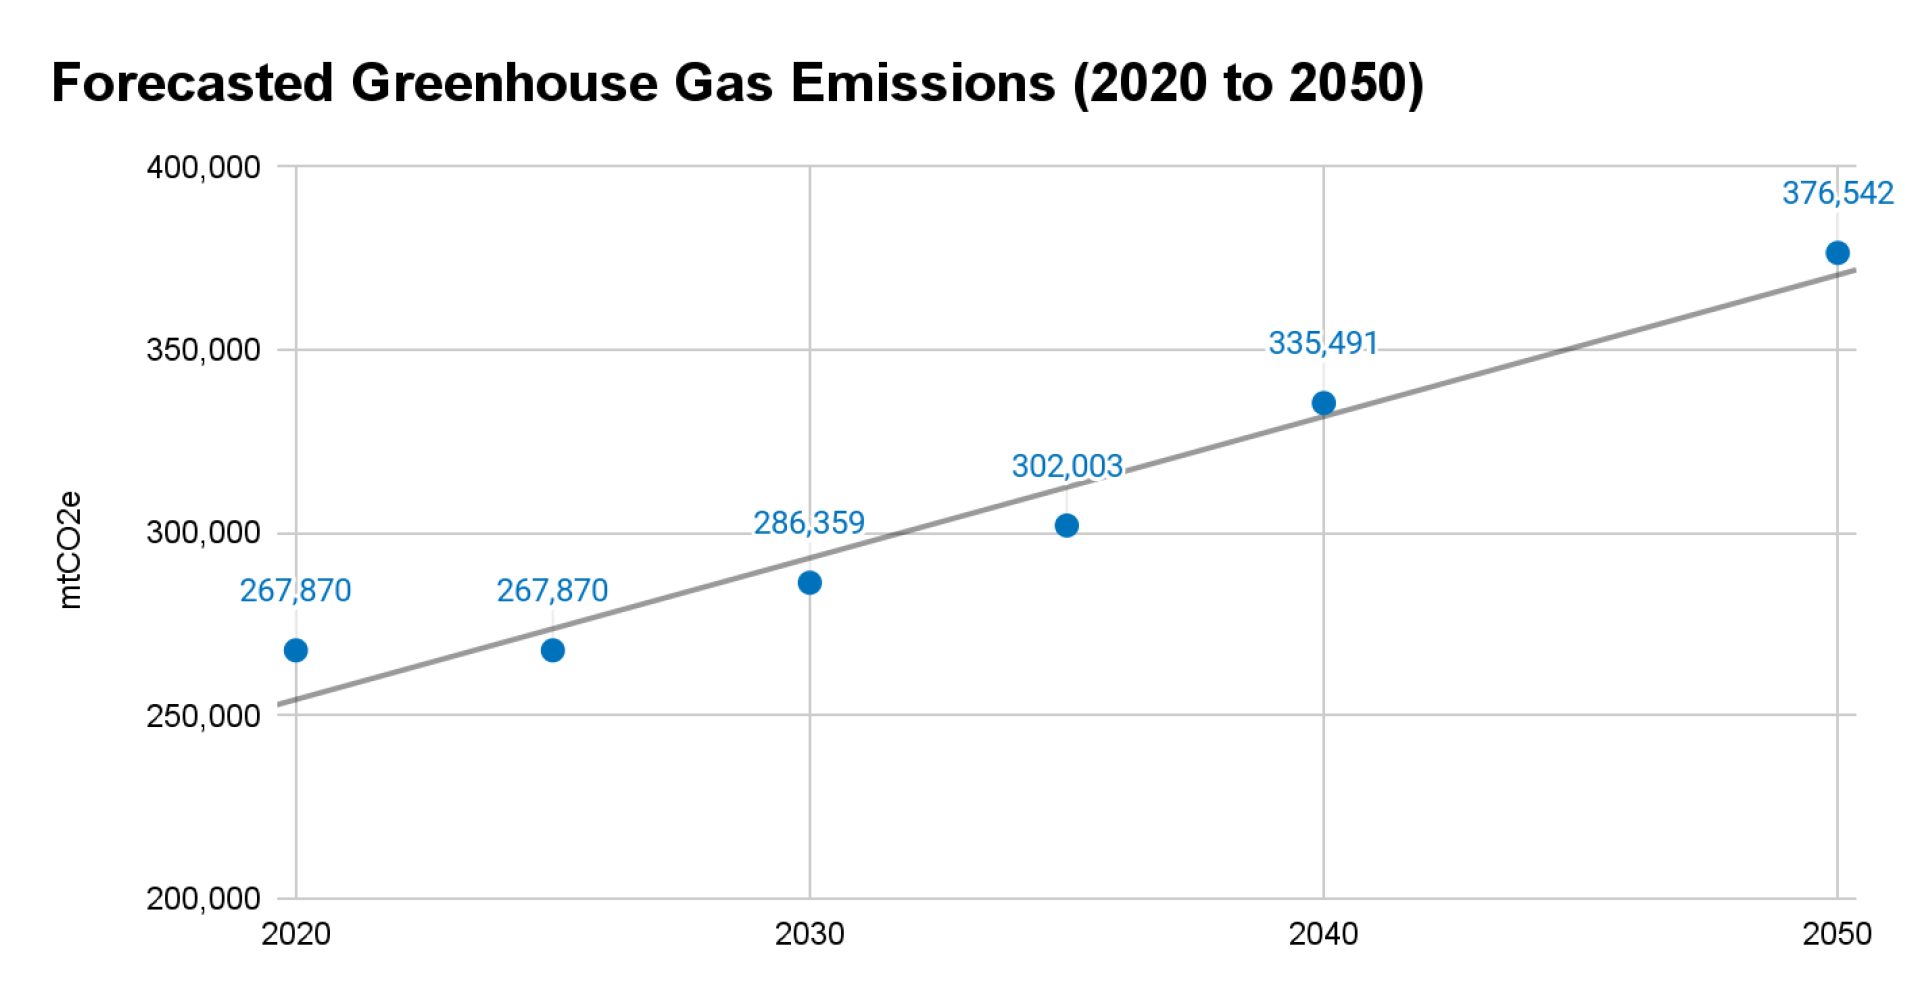
Figure 3-3. Forecasted Greenhouse Gas Emissions from Government Operations (2020 to 2050) Notes: Population estimates were obtained from Vision 2040 and extended to 2050 using a best fit line. Estimates for the 2019 population have already exceeded what Vision 2040 predicted. This visual provides a guide for future discussion and should be updated along with population estimates.
3.1.4 Key Findings: Government Operations GHG Emissions
Total emissions from Government Operations are 234,084 mtCO2e, which is less than one percent of total City-wide emissions. By category, over half of government emissions are from management of municipal solid waste (59 percent) followed by electricity (32 percent), wastewater (3.2 percent), and vehicle fleet (4.3 percent). GHG emissions are expected to increase as the population continues to grow.
3.2 GOVERNMENT GREENHOUSE GAS EMISSIONS BY CATEGORY
3.2.1 Government Electricity
3.2.1.1 Government Purchased Electricity
The City’s accounts for calendar year 2019 (TECO) contain 32,555 monthly records from November 26, 2018 through December 31, 2020. The first step was to extract a complete year of data for 2019 (i.e., January 2019 through December 2019) and aggregate kilowatt hour (KWH) consumption annually for each meter address. Additional columns identify the city department, facility name, and facility address. The 2009 GHG inventory did not report activity data (specifically the KWH consumed) in either the technical report, appendices, or the associated excel tool, thus comparing electricity consumption directly is not possible for government operations. In total, 176,380,772 KWHs were consumed by Government Operations, accounting for 75,315 mtCO2e in 2019 (Table 3-2). GHGs from purchased electricity accounted for nearly 30 percent of the total GHG emissions from Government Operations.
| Department | Electricity Consumption (KWHs) | GHG Emissions (mtCO2e) | Percent Total |
|---|---|---|---|
| Water and Wastewater | 75,268,981 | 32,140 | 42.67 |
| Parks and Recreations | 55,000,036 | 23,485 | 31.18 |
| Not Categorized | 11,539,349 | 4,927 | 6.54 |
| Convention Center | 10,550,150 | 4,505 | 5.98 |
| Police | 6,683,683 | 2,854 | 3.79 |
| Fire | 4,733,606 | 2,021 | 2.68 |
| Parking | 3,685,943 | 1,574 | 2.09 |
| Administration | 2,941,350 | 1,256 | 1.67 |
| Transportation | 1,586,109 | 677 | 0.90 |
| Solid Waste | 1,424,447 | 608 | 0.81 |
| Public Works | 1,086,360 | 464 | 0.62 |
| Infrastructure | 698,880 | 298 | 0.40 |
| Public Library | 529,280 | 226 | 0.30 |
| Health | 322,379 | 138 | 0.18 |
| Real Estate | 191,039 | 82 | 0.11 |
| Facilities Management | 139,180 | 59 | 0.08 |
| Total | 176,380,772 | 75,315 | |
| Estimated Cost to the City | $1,608,593 | ||
Notes: A custom emission factor for 2019 emissions was used to estimate GHG emissions for electricity consumption with methodology presented in Appendix B. The average price reported by the was $0.0912 per KWH for commercial accounts.
(https://www.eia.gov/electricity/sales_revenue_price/pdf/table7.pdf)EIA’s utility bundled retail sales report for 2019
The Departments with the highest electricity consumption in 2019 were Water and Wastewater (Figure 3-4), which correlates to the highest GHG emissions. Top electricity consuming facilities were disaggregated and identified in Figure 3-5, showing electricity consumed by water treatment and pumping. Additionally, data was used to identify the top 10 energy consuming buildings (Figure 3-6). By far, the Tampa Convention Center leads in electricity consumption followed by the Police Headquarters, and City Hall.
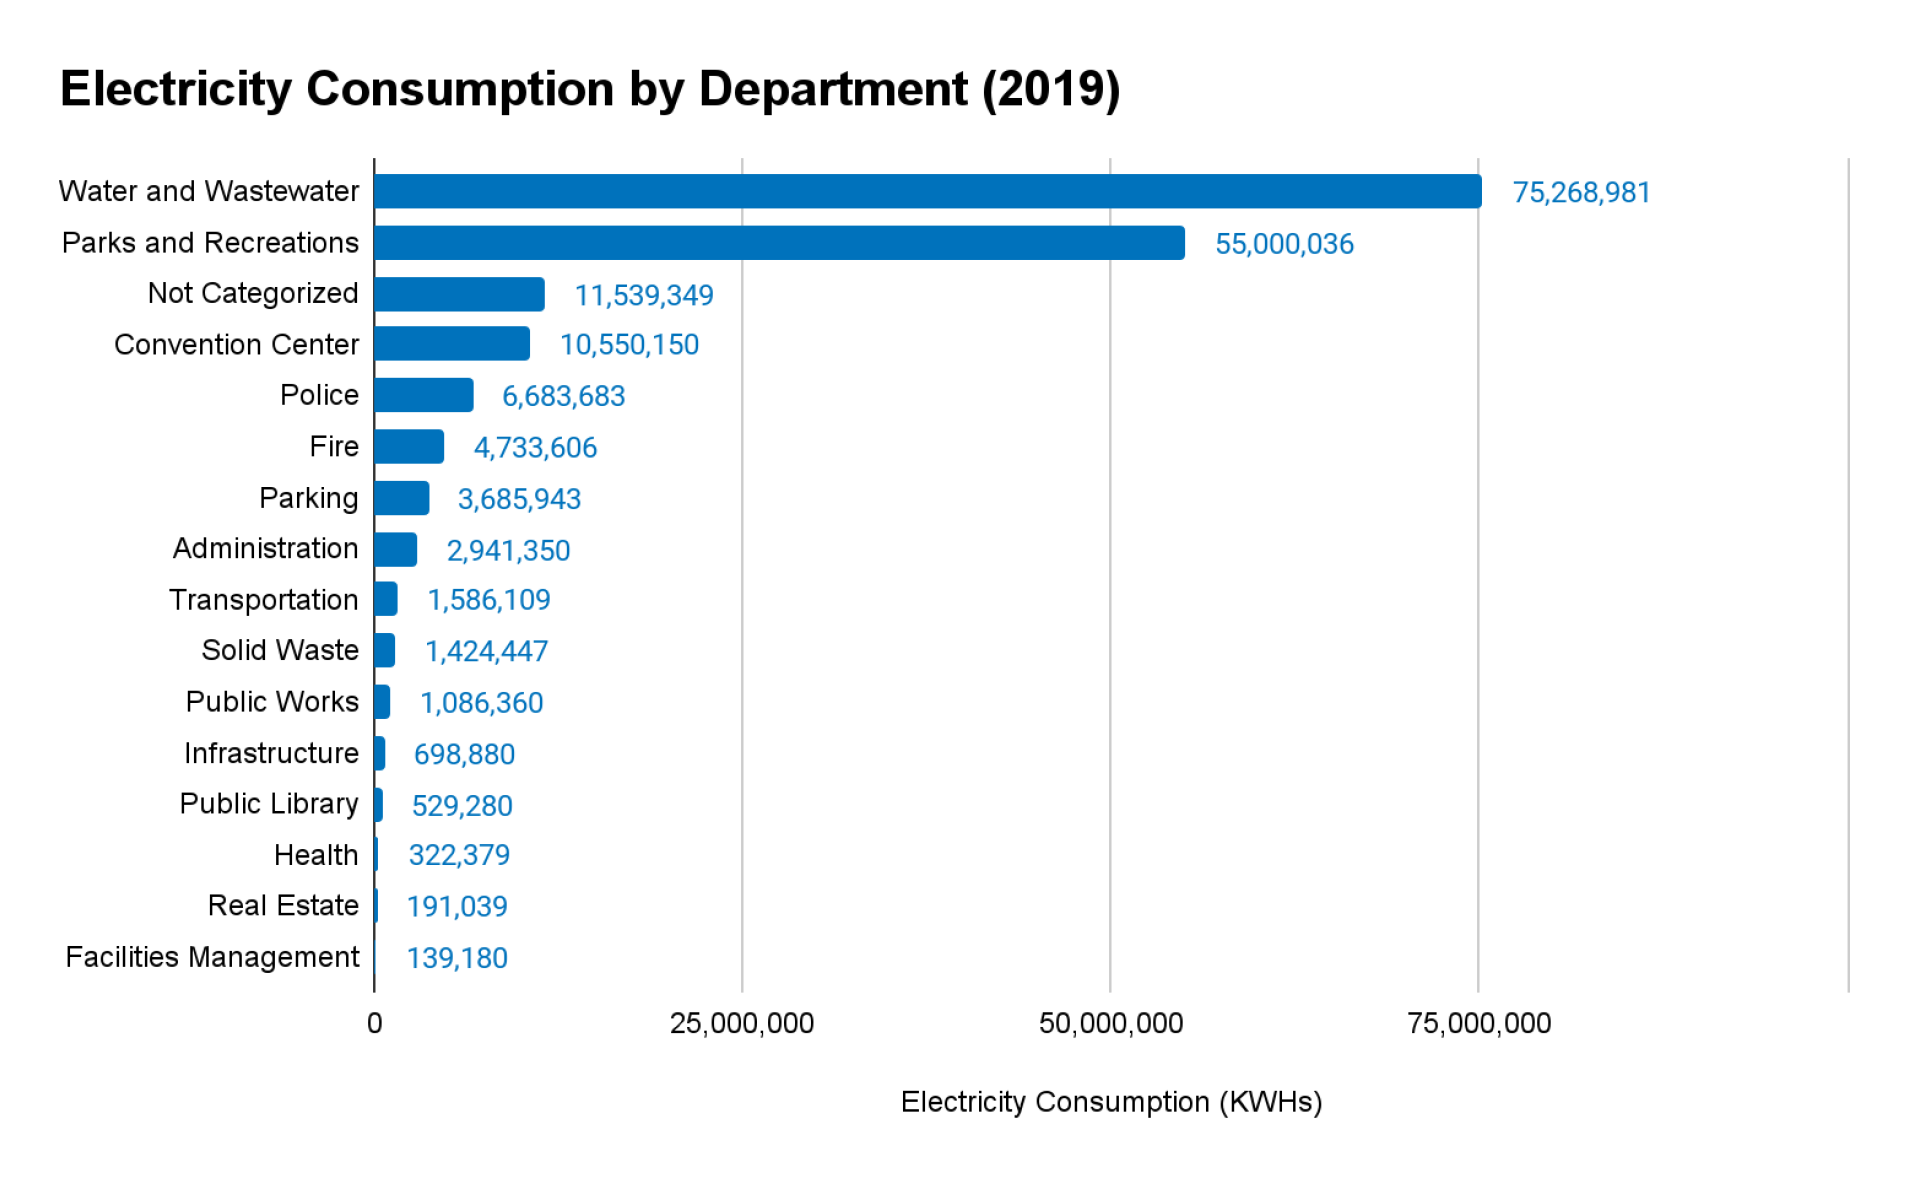
Figure 3-4. Electricity Consumption and Greenhouse Gas Emissions from Government Operations (2019)
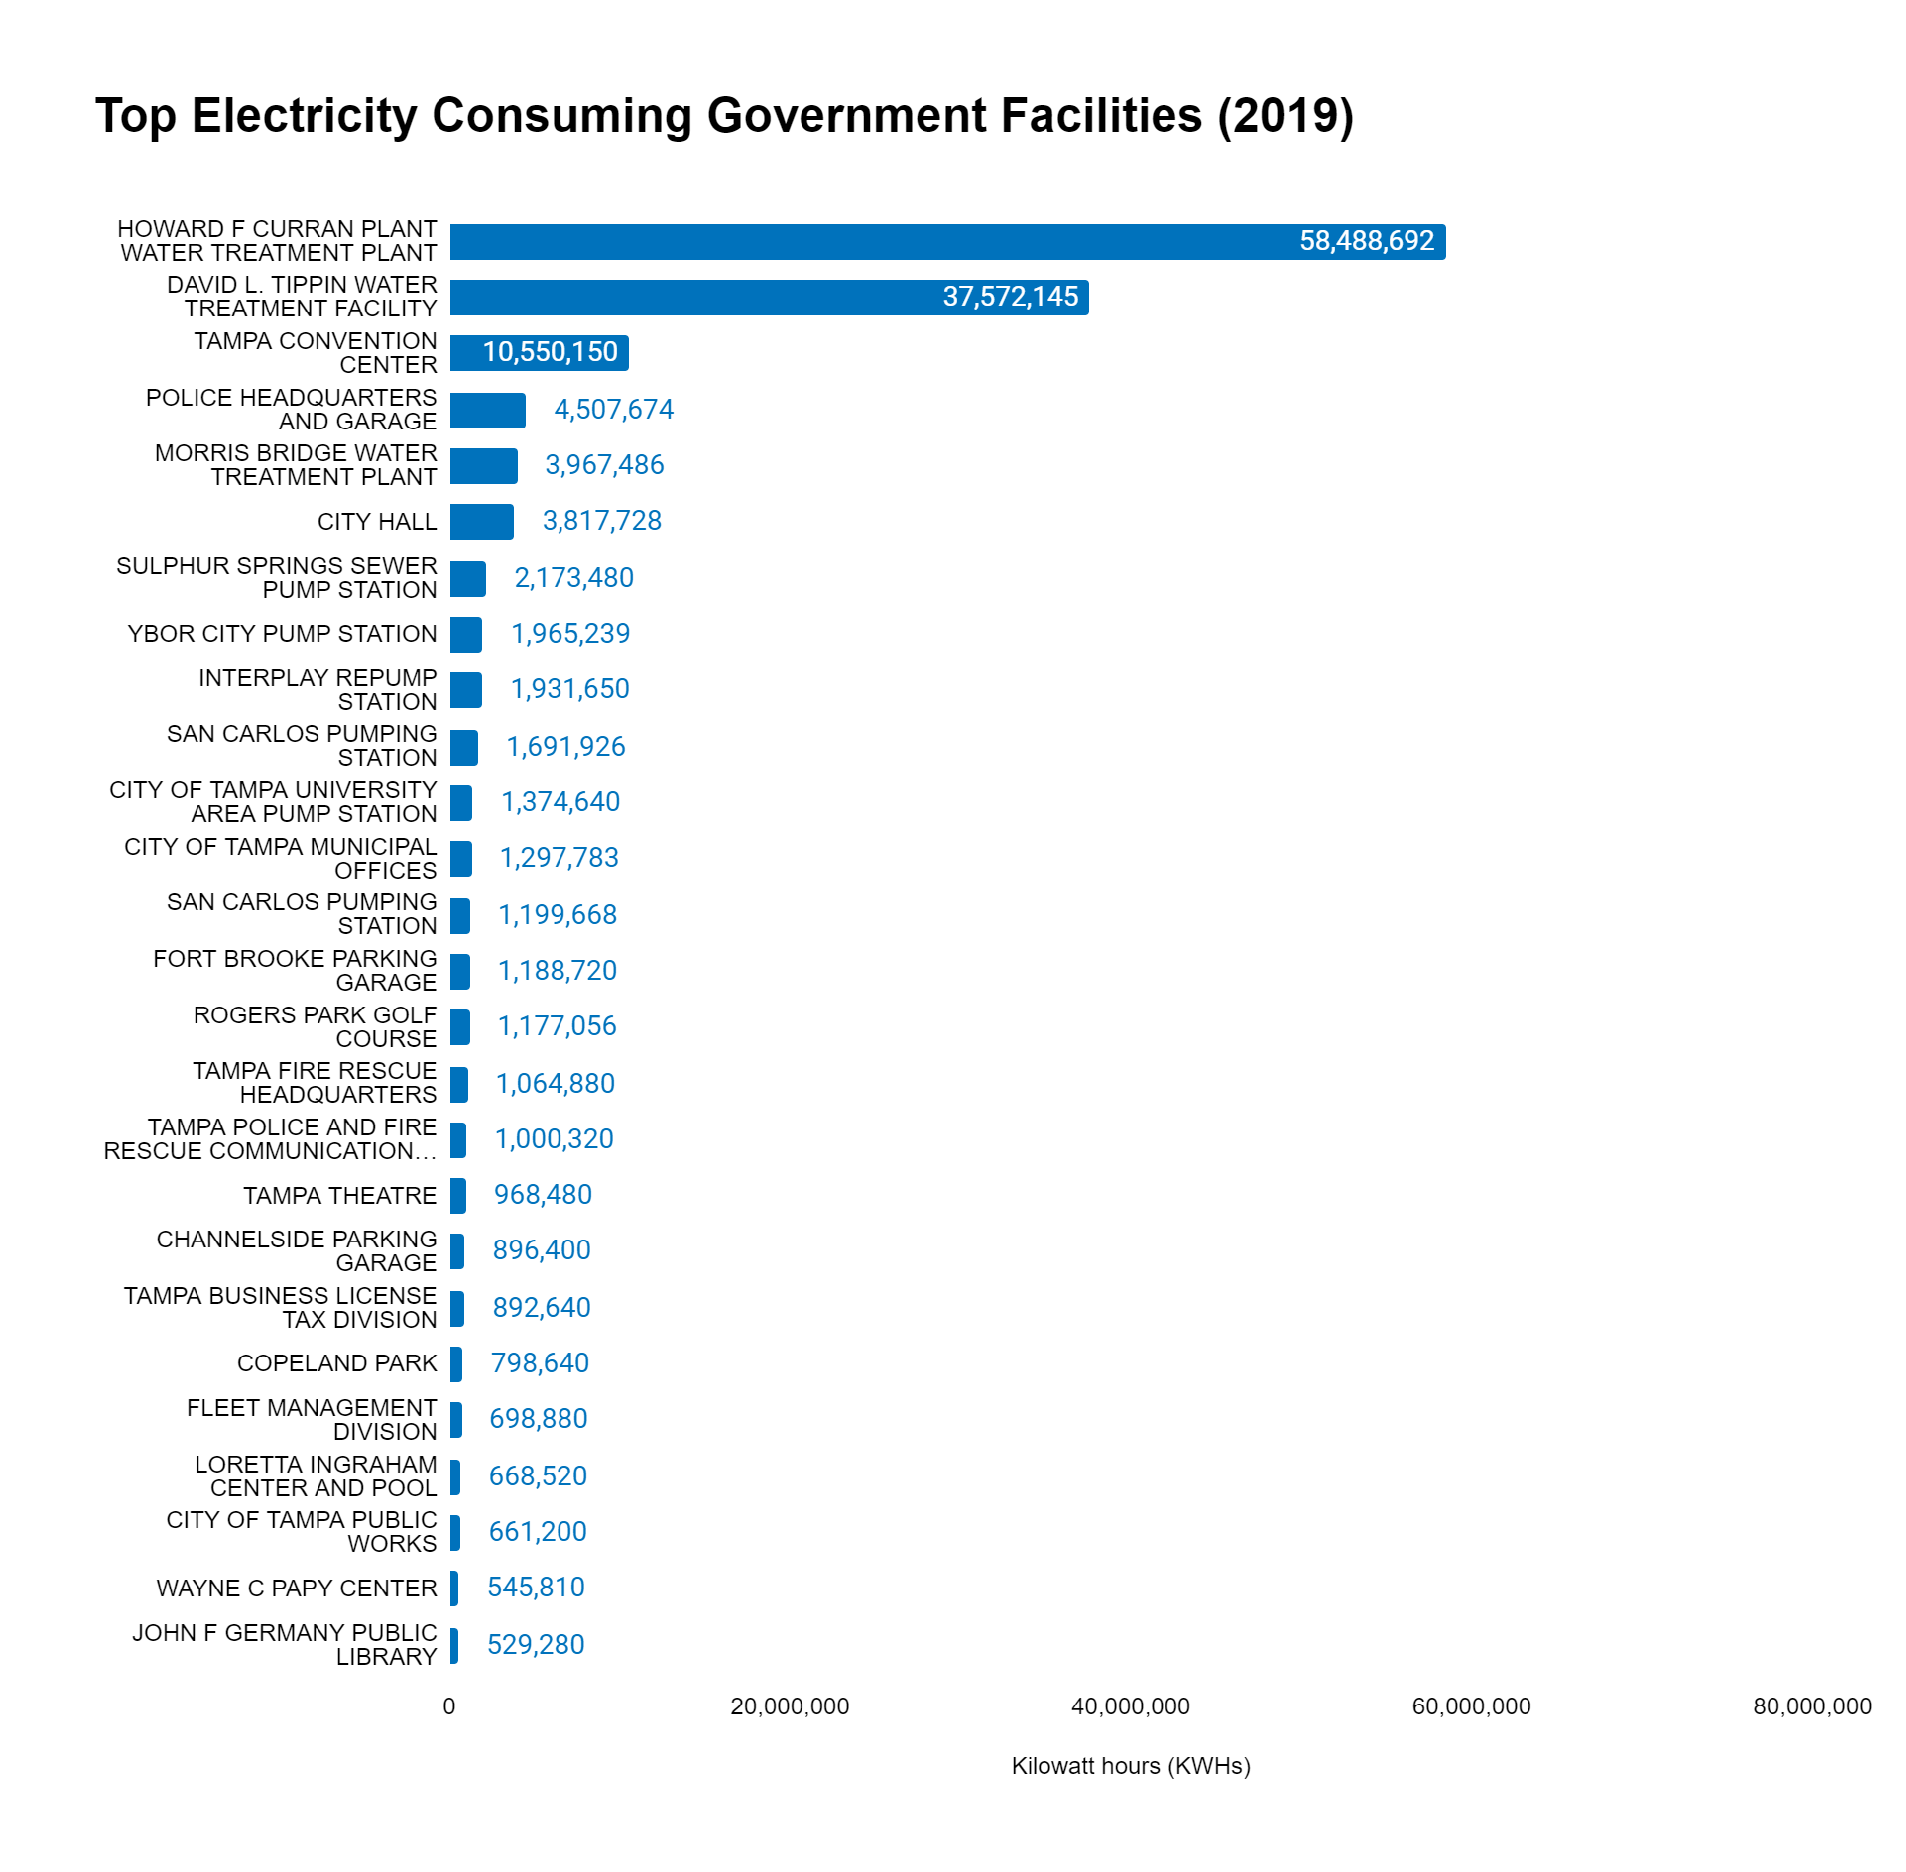
Figure 3-5. Electricity Consumption from Government Operations by Facility (2019)
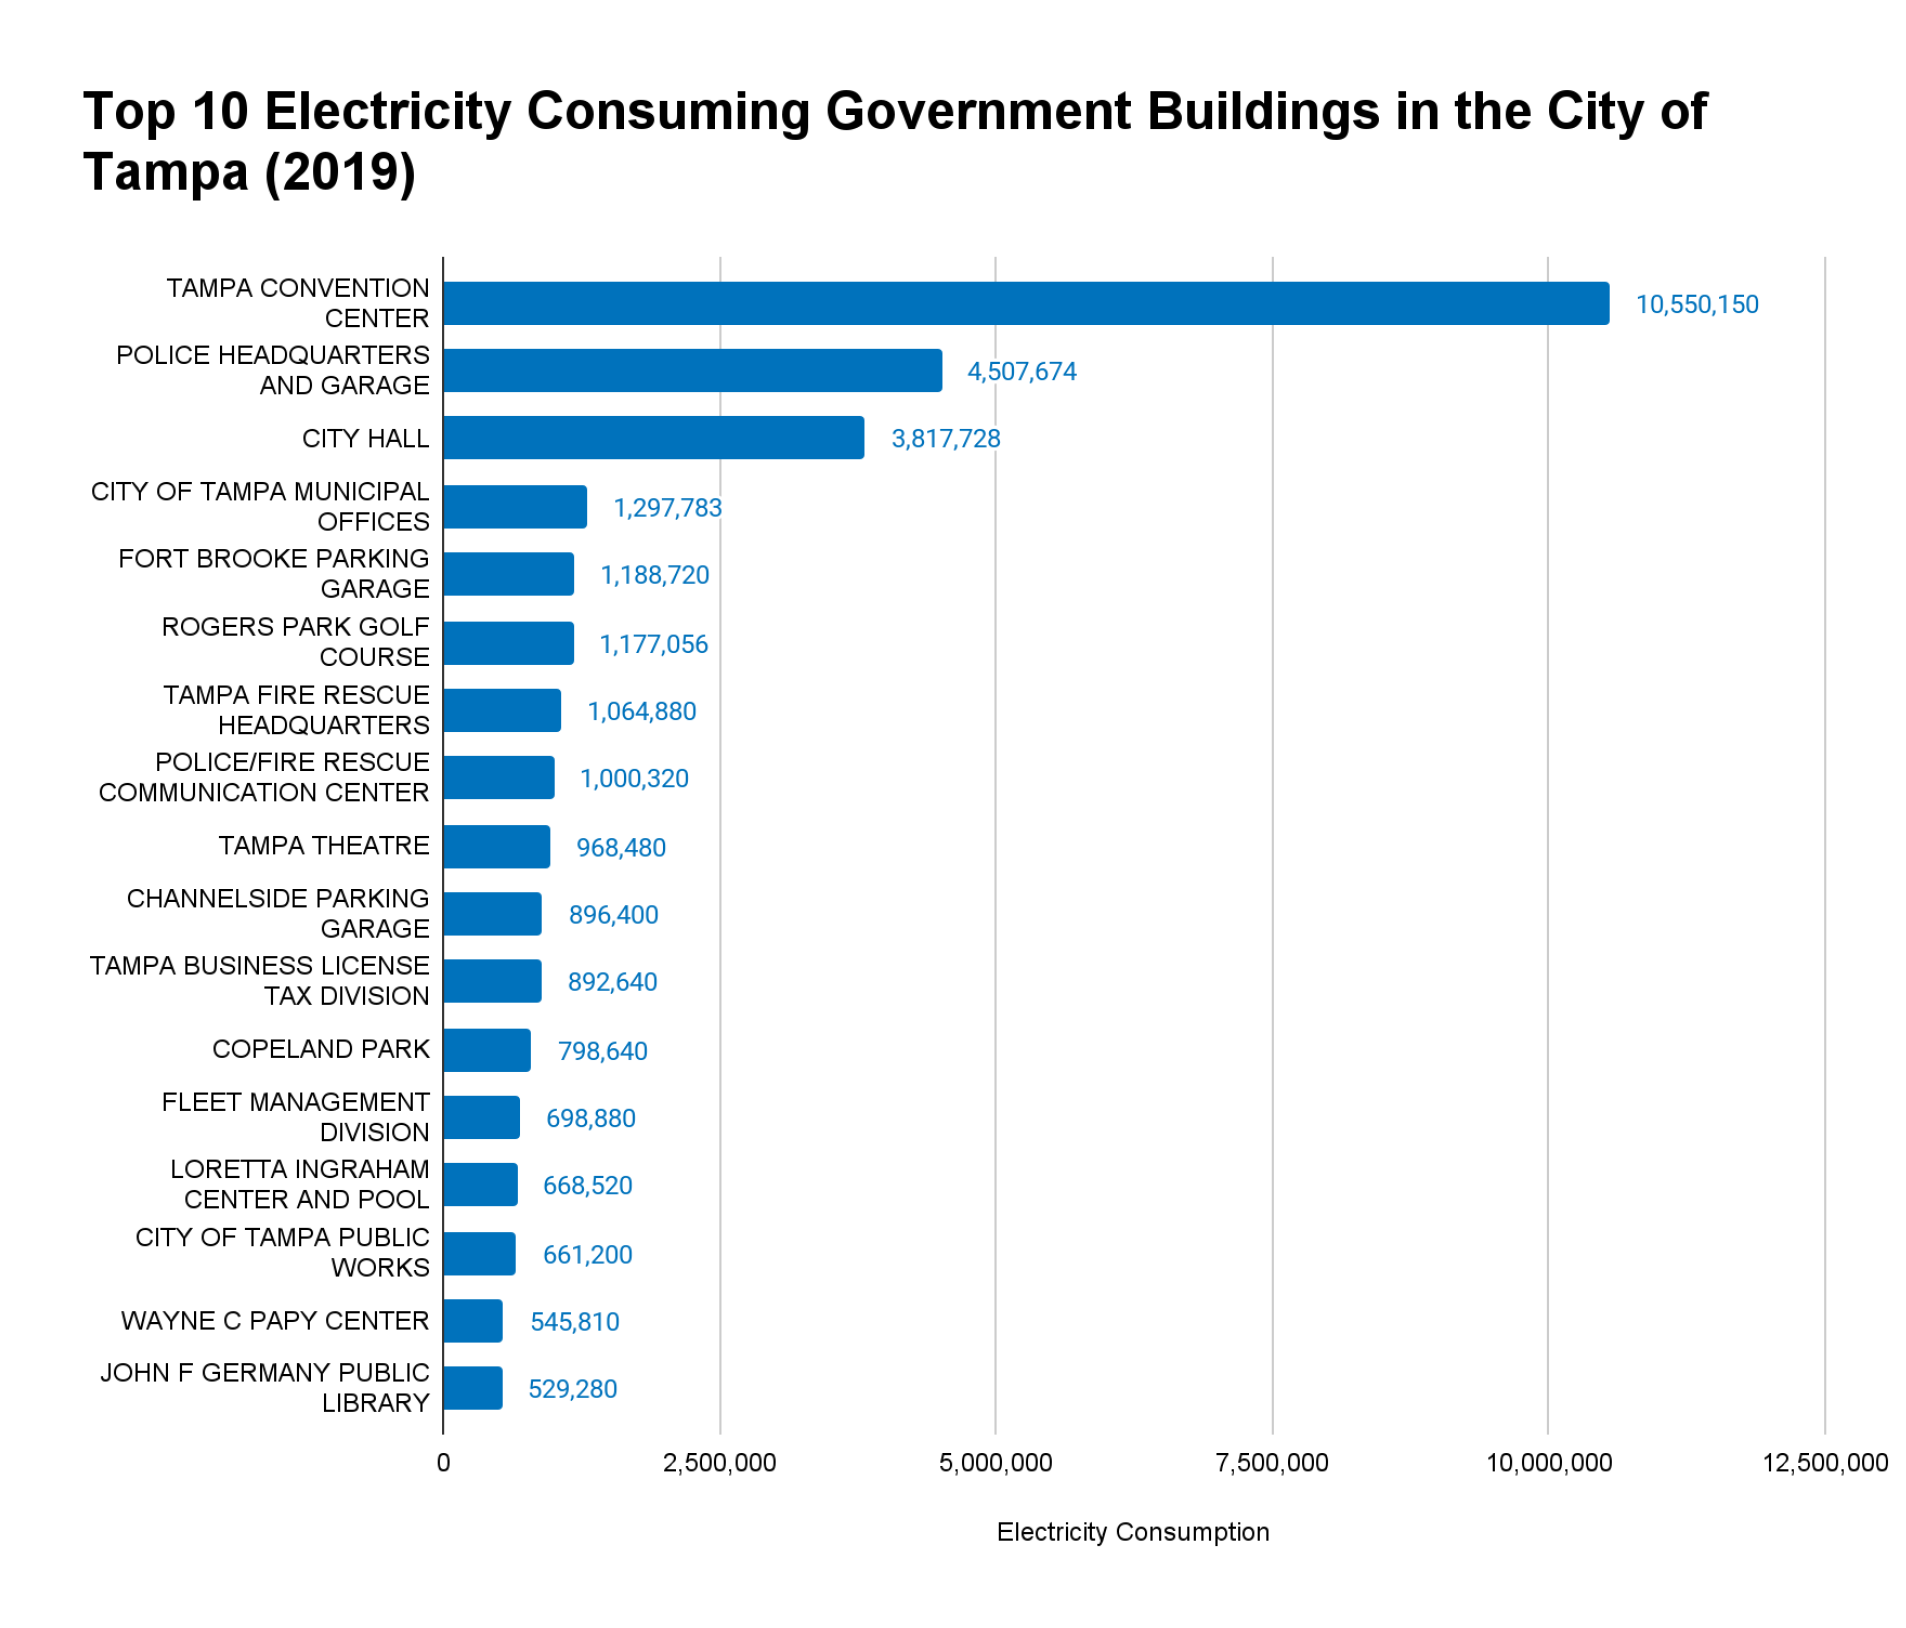
Figure 3-6. Top 10 Electricity Consuming Buildings in Government Operations (2019)
3.2.1.2 Government Electricity Production from McKay Bay Refuse-to-Energy Facility
The McKay Bay Refuse-to-Energy Facility is owned and operated by the City of Tampa with a total nameplate capacity of 22.1 MegaWatts (MWs). According to EPA’s EGRID database,9 the facility generated 144,601,000 KWH of electricity in 2019. Up to 20 MW of electricity generated at the McKay Bay Refuse-to-Energy facility must be sold to Seminole Electric Cooperative under a purchase agreement (Contract period from 8/1/2011 through 7/31/2026).
3.2.1.3 Government Electricity Production from Solar Installations
The City of Tampa facilities did not have any solar panels installed in 2019.
3.2.1.3 Key Findings: Government Electricity
Electricity consumption represents the second largest GHG emissions source in Government Operations. Government emissions are low in comparison to City-wide emissions. However, opportunities exist to reduce City-wide emissions through improvements to utilities (i.e., solid waste, water, and wastewater utilities). Improving City-wide water efficiency and the type of energy consumed, particularly when tied to the movement and processing of water/wastewater, will have a large impact on Net GHG reductions. GHG reduction opportunities should focus on energy and water GHG reduction strategy that improves operational efficiencies. City-wide water conservation will reduce the energy demand in the Water/Wastewater sector. Perform detailed audits on the 26 government buildings that are responsible for over 80 percent of the GHG total footprint. Each building has very specific operational constraints, which will need to be accounted for in making actionable recommendations. Lead by example opportunities exist to showcase City efforts (e.g., public education at the Tampa Convention Center). GHG reduction strategies that improve energy efficiency and water conservation have a high potential to reduce GHG emissions in the City. Rooftop solar and/or purchase carbon credits would also offset GHG emissions.
9 EPA Egrid database available at: (https://www.epa.gov/egrid/download-data). Reported GHG emissions reported in short tons and were converted to metric tons (1.10231 short tons = 1 metric ton) to be consistent with other GHG emission categories in this inventory.
3.2.2 Government Purchased Natural Gas
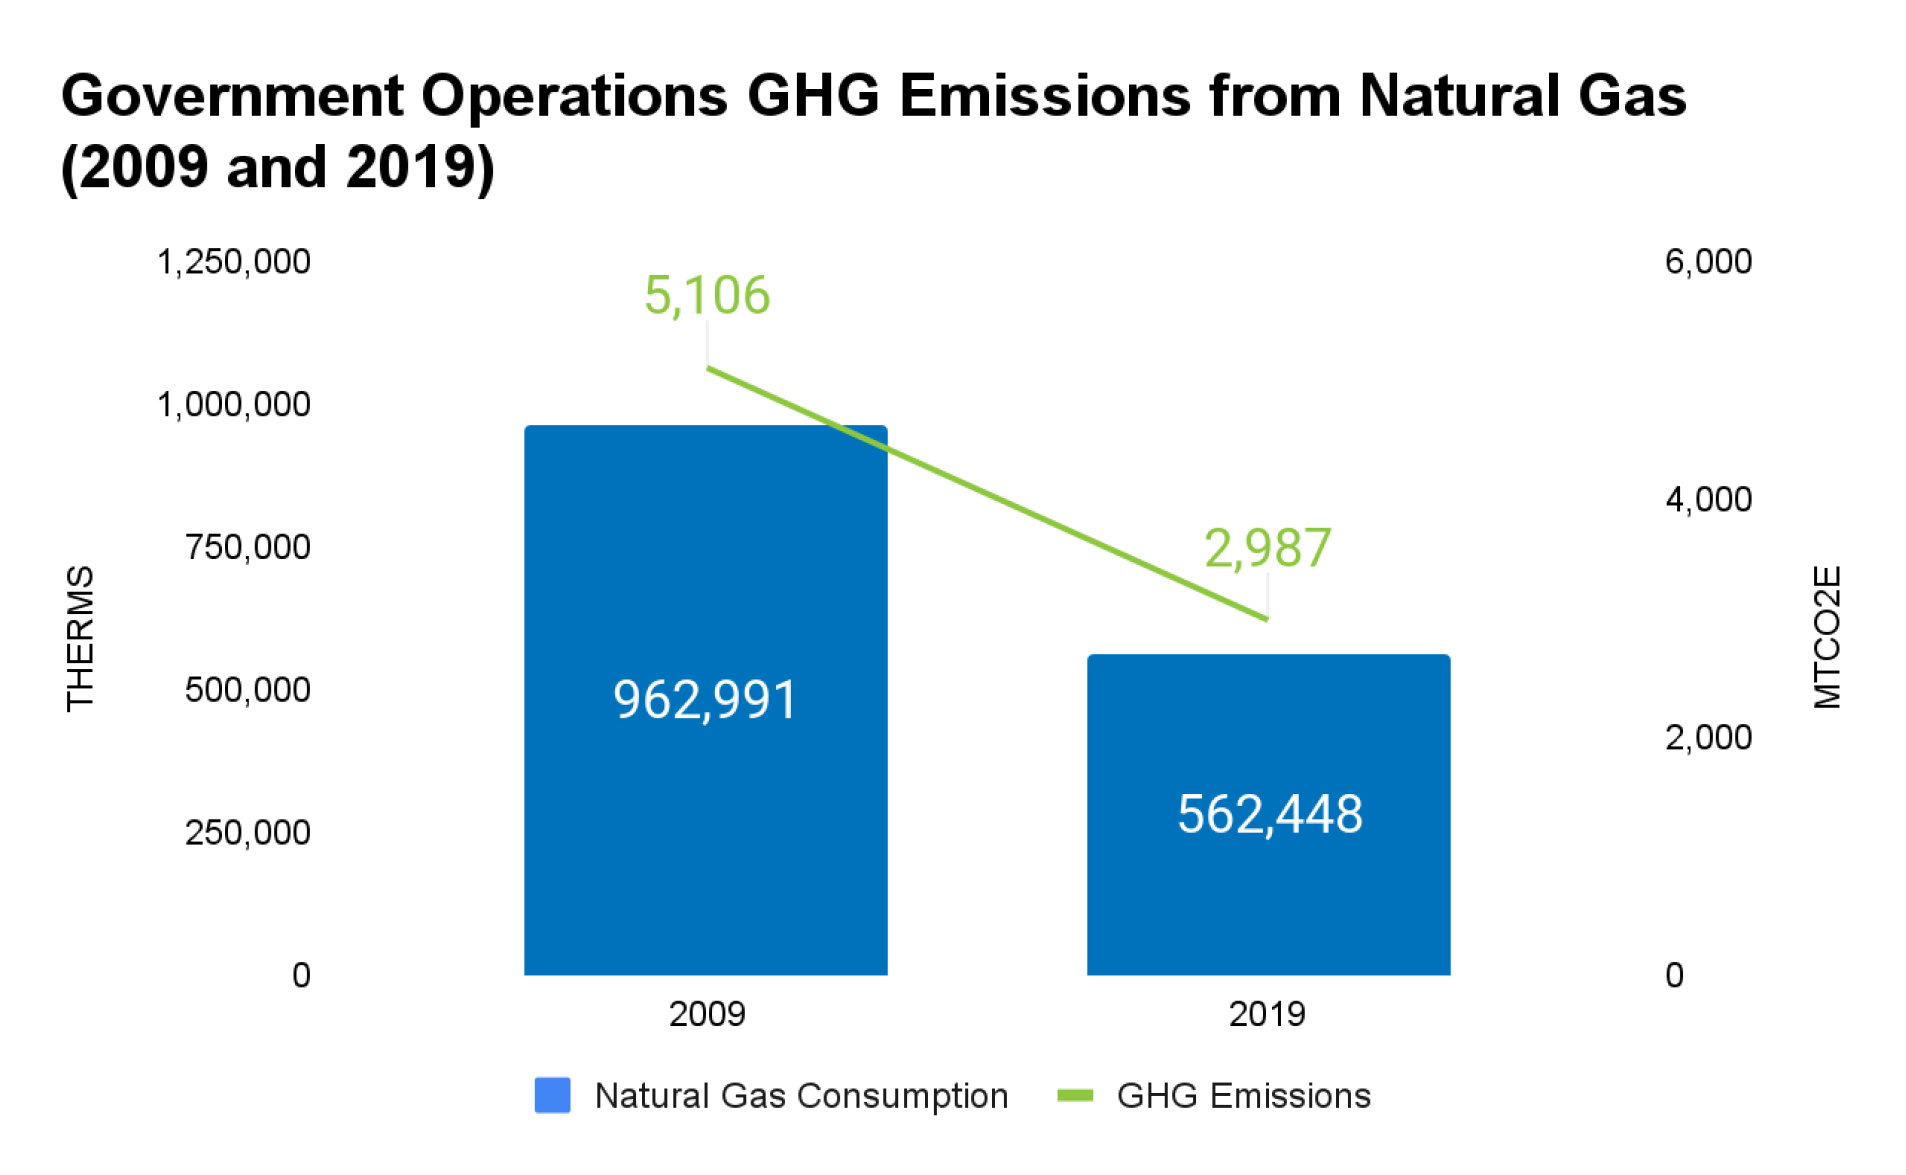
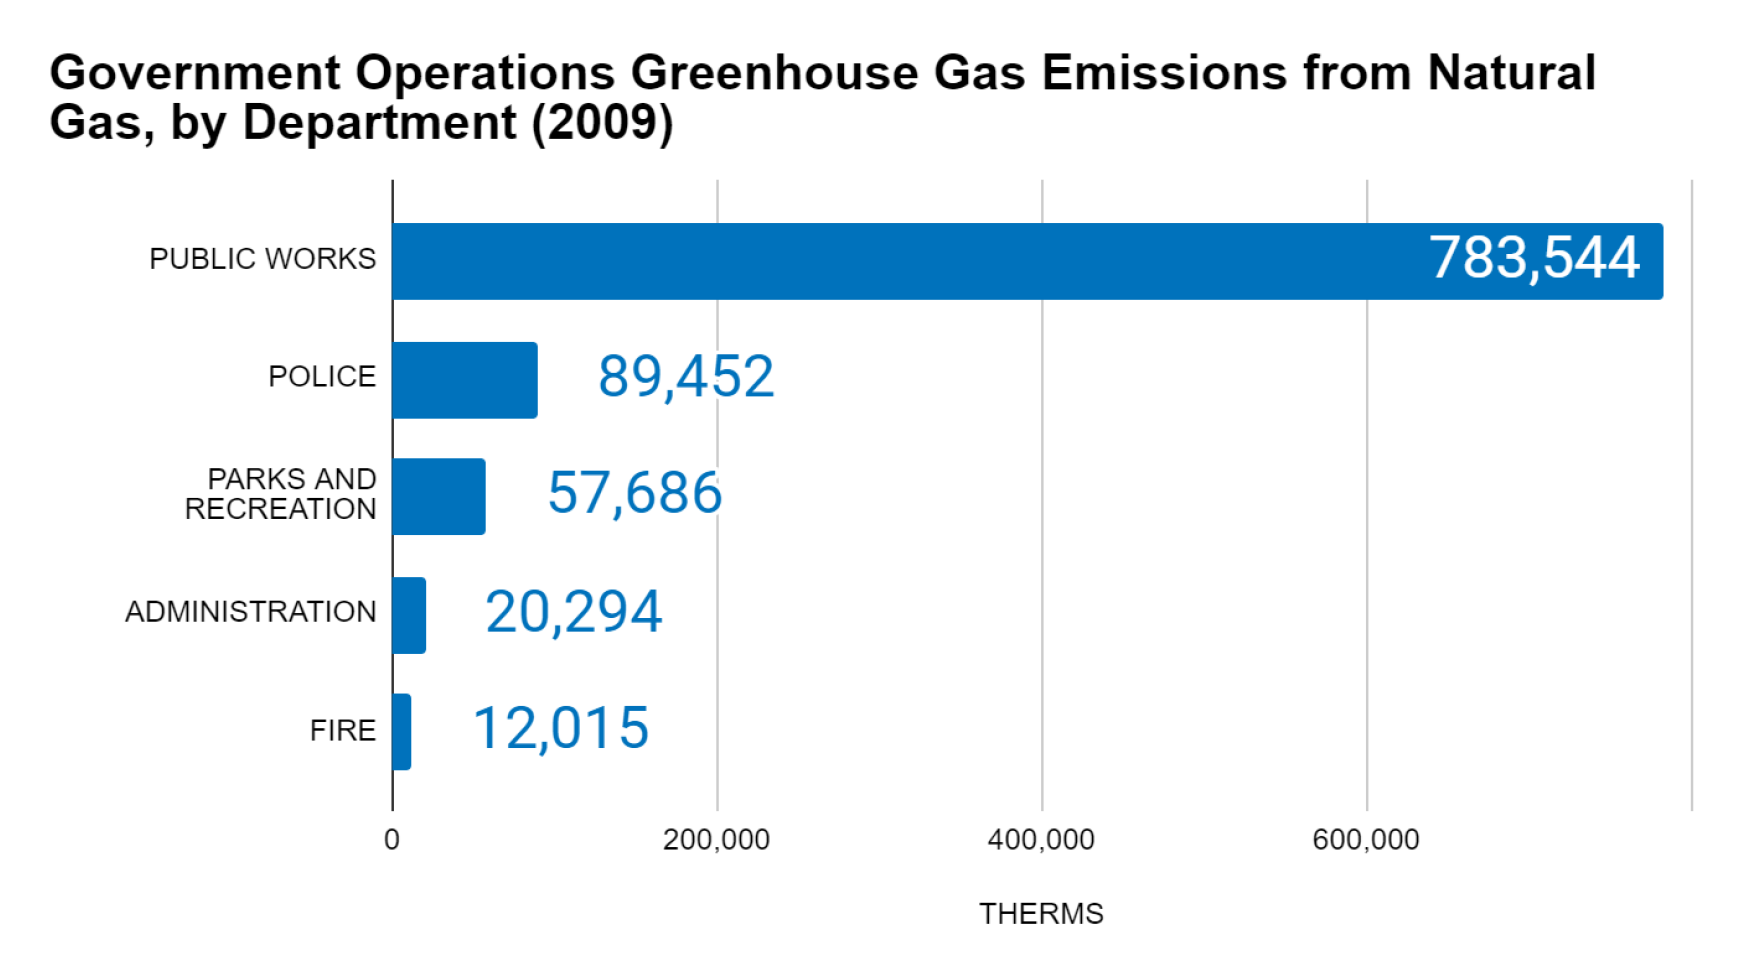
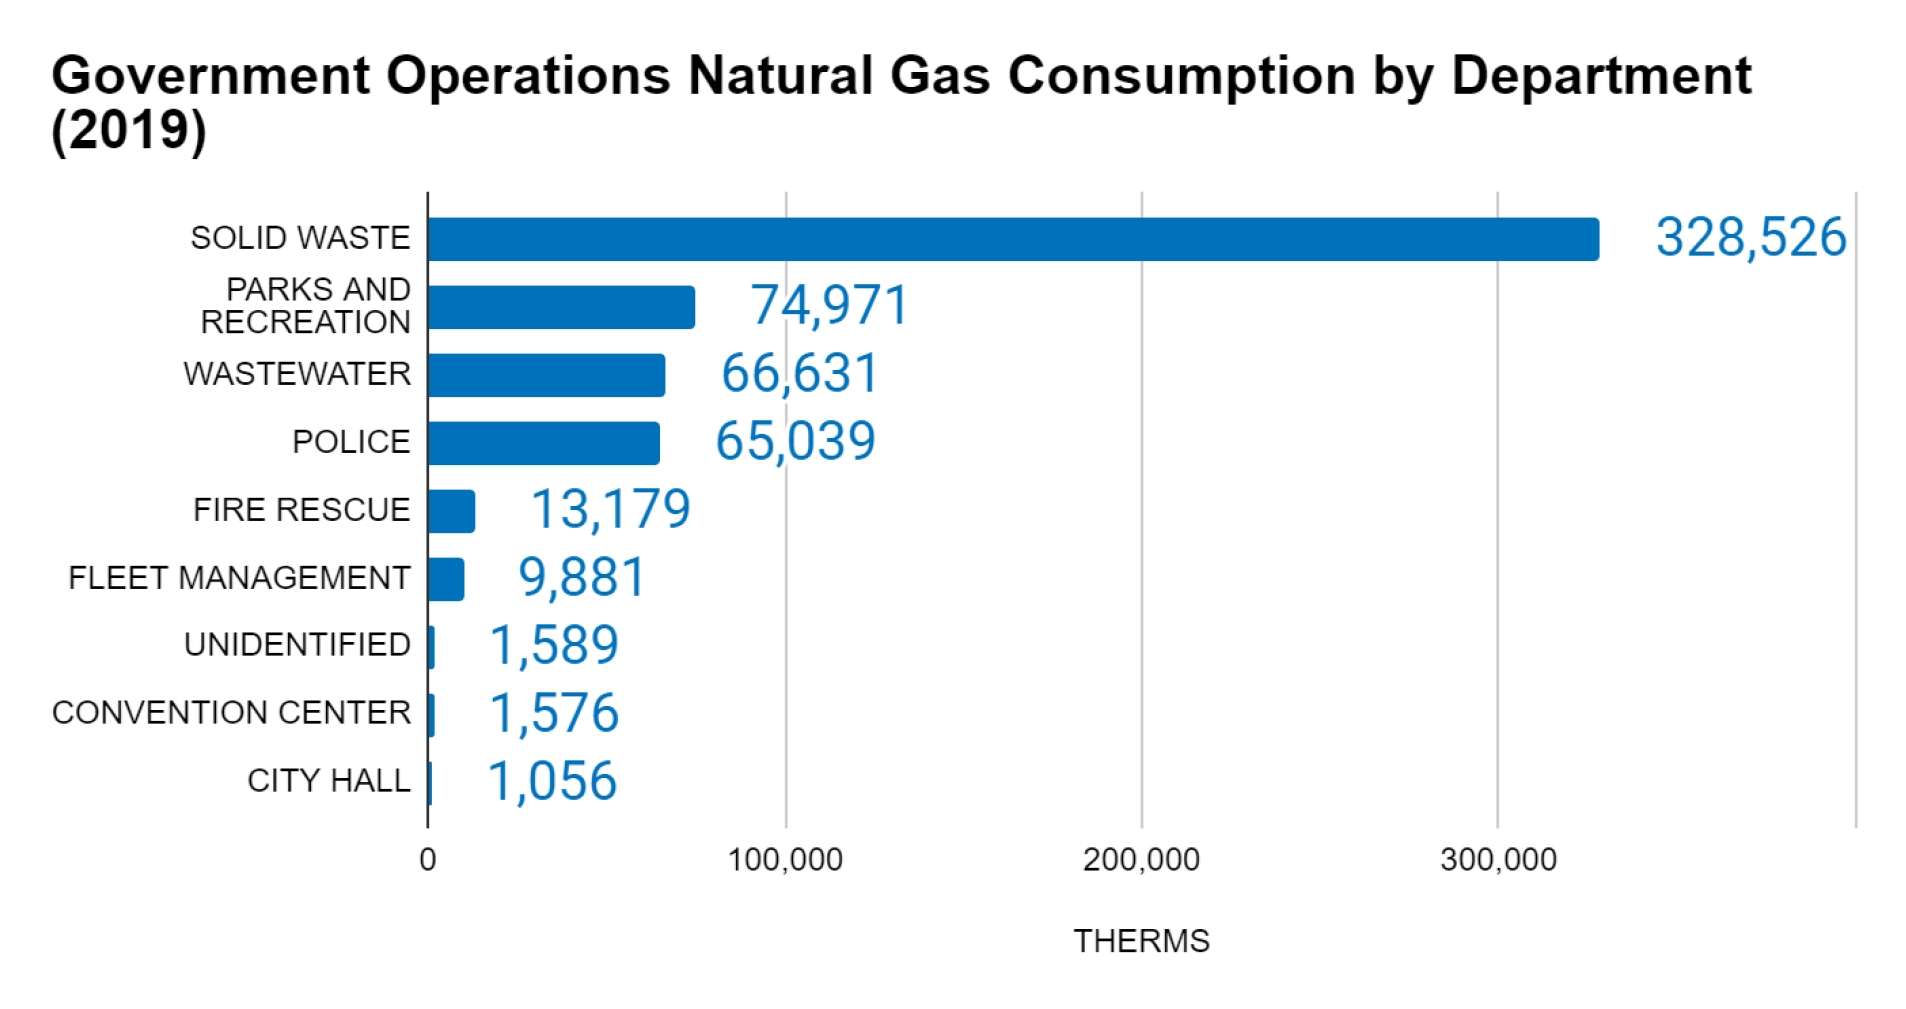
Natural gas is purchased from TECO’s Peoples Gas and accounts for a small percentage of GHG emissions overall (1.2 percent) from Government Operations (Figure 3-7). The City of Tampa has 33 metered accounts from nine departments (Figure 3-8). Solid waste consumes the most natural gas (used in the City’s 22 Compressed Natural Gas (CNG) MSW trucks). Parks and Recreation (heated pools) and Fire Rescue (13 stations) use natural gas. Natural gas is used at the Howard F. Curren Advanced Water Treatment, making the facility the third largest consumer of natural gas. People’s Gas consumption data is billed using the “therm”, which were multiplied by the standard emission factor (0.005311) mtCO2e/therm) to estimate GHG emissions.
3.2.2.1 Key Findings: Government Natural Gas
Natural gas purchased from TECO’s Peoples Gas represents a little more than one percent of total Government GHG emissions. Natural gas used at the Howard F. Curren Advanced Water Treatment Plant, to power 22 CNG solid waste vehicles and to a lesser degree to heat community pools and in fire stations.
3.2.3 Government Fleet
The City of Tampa has a fleet of 1,759 on-road vehicles and 426 off-road vehicles. The inventory includes year, make, model, and gallons of fuel consumed for all vehicles. Vehicle miles traveled (VMT) for on-road vehicles and hours of use for off-road vehicles is also provided. As shown on Table 3-3, the majority of vehicles operated are gasoline powered. However, GHG emissions are nearly equal for gasoline versus diesel fuel vehicles (Table 3-4). Diesel powered vehicles emit more carbon dioxide than gasoline-powered vehicles (published emissions factors from the GHG Protocol are 0.01015 and 0.00881 mtCO2/gallon, respectively) which accounts for the difference. Figures 3-9 to 3-10 and Table 3-5 provide GHG emissions by department, VMTs, and off-road GHG emissions, respectively. GHGs from the City’s Fleet account for close to four percent of the total GHG emissions from government operations.
| Vehicle Type | Number of Diesel Vehicles | Number of EVs | Number of Gasoline/Hybrids | Total Number of Vehicles |
|---|---|---|---|---|
| Construction | 4 | 4 | ||
| Dump truck | 178 | 178 | ||
| Golf cart | 1 | 1 | ||
| Hybrid | 5 | 5 | ||
| Light industrial truck | 144 | 144 | ||
| Motorcycle | 1 | 1 | 2 | |
| Passenger car | 410 | 410 | ||
| Passenger truck/suv | 1 | 824 | 825 | |
| Passenger van | 83 | 83 | ||
| Utility vehicle | 6 | 6 | ||
| Total | 327 | 1 | 1,330 | 1,759 |
Data Source: Fleet data provided by the City of Tampa
| Fuel Type | On-Road | Off-Road | Total |
|---|---|---|---|
| Gasoline | 4,862 | 247 | 5,109 |
| Diesel | 2,621 | 2,245 | 4,866 |
| Total | 7,482 | 2,492 | 9,974 |
Data Source: Fleet data provided by the City of Tampa
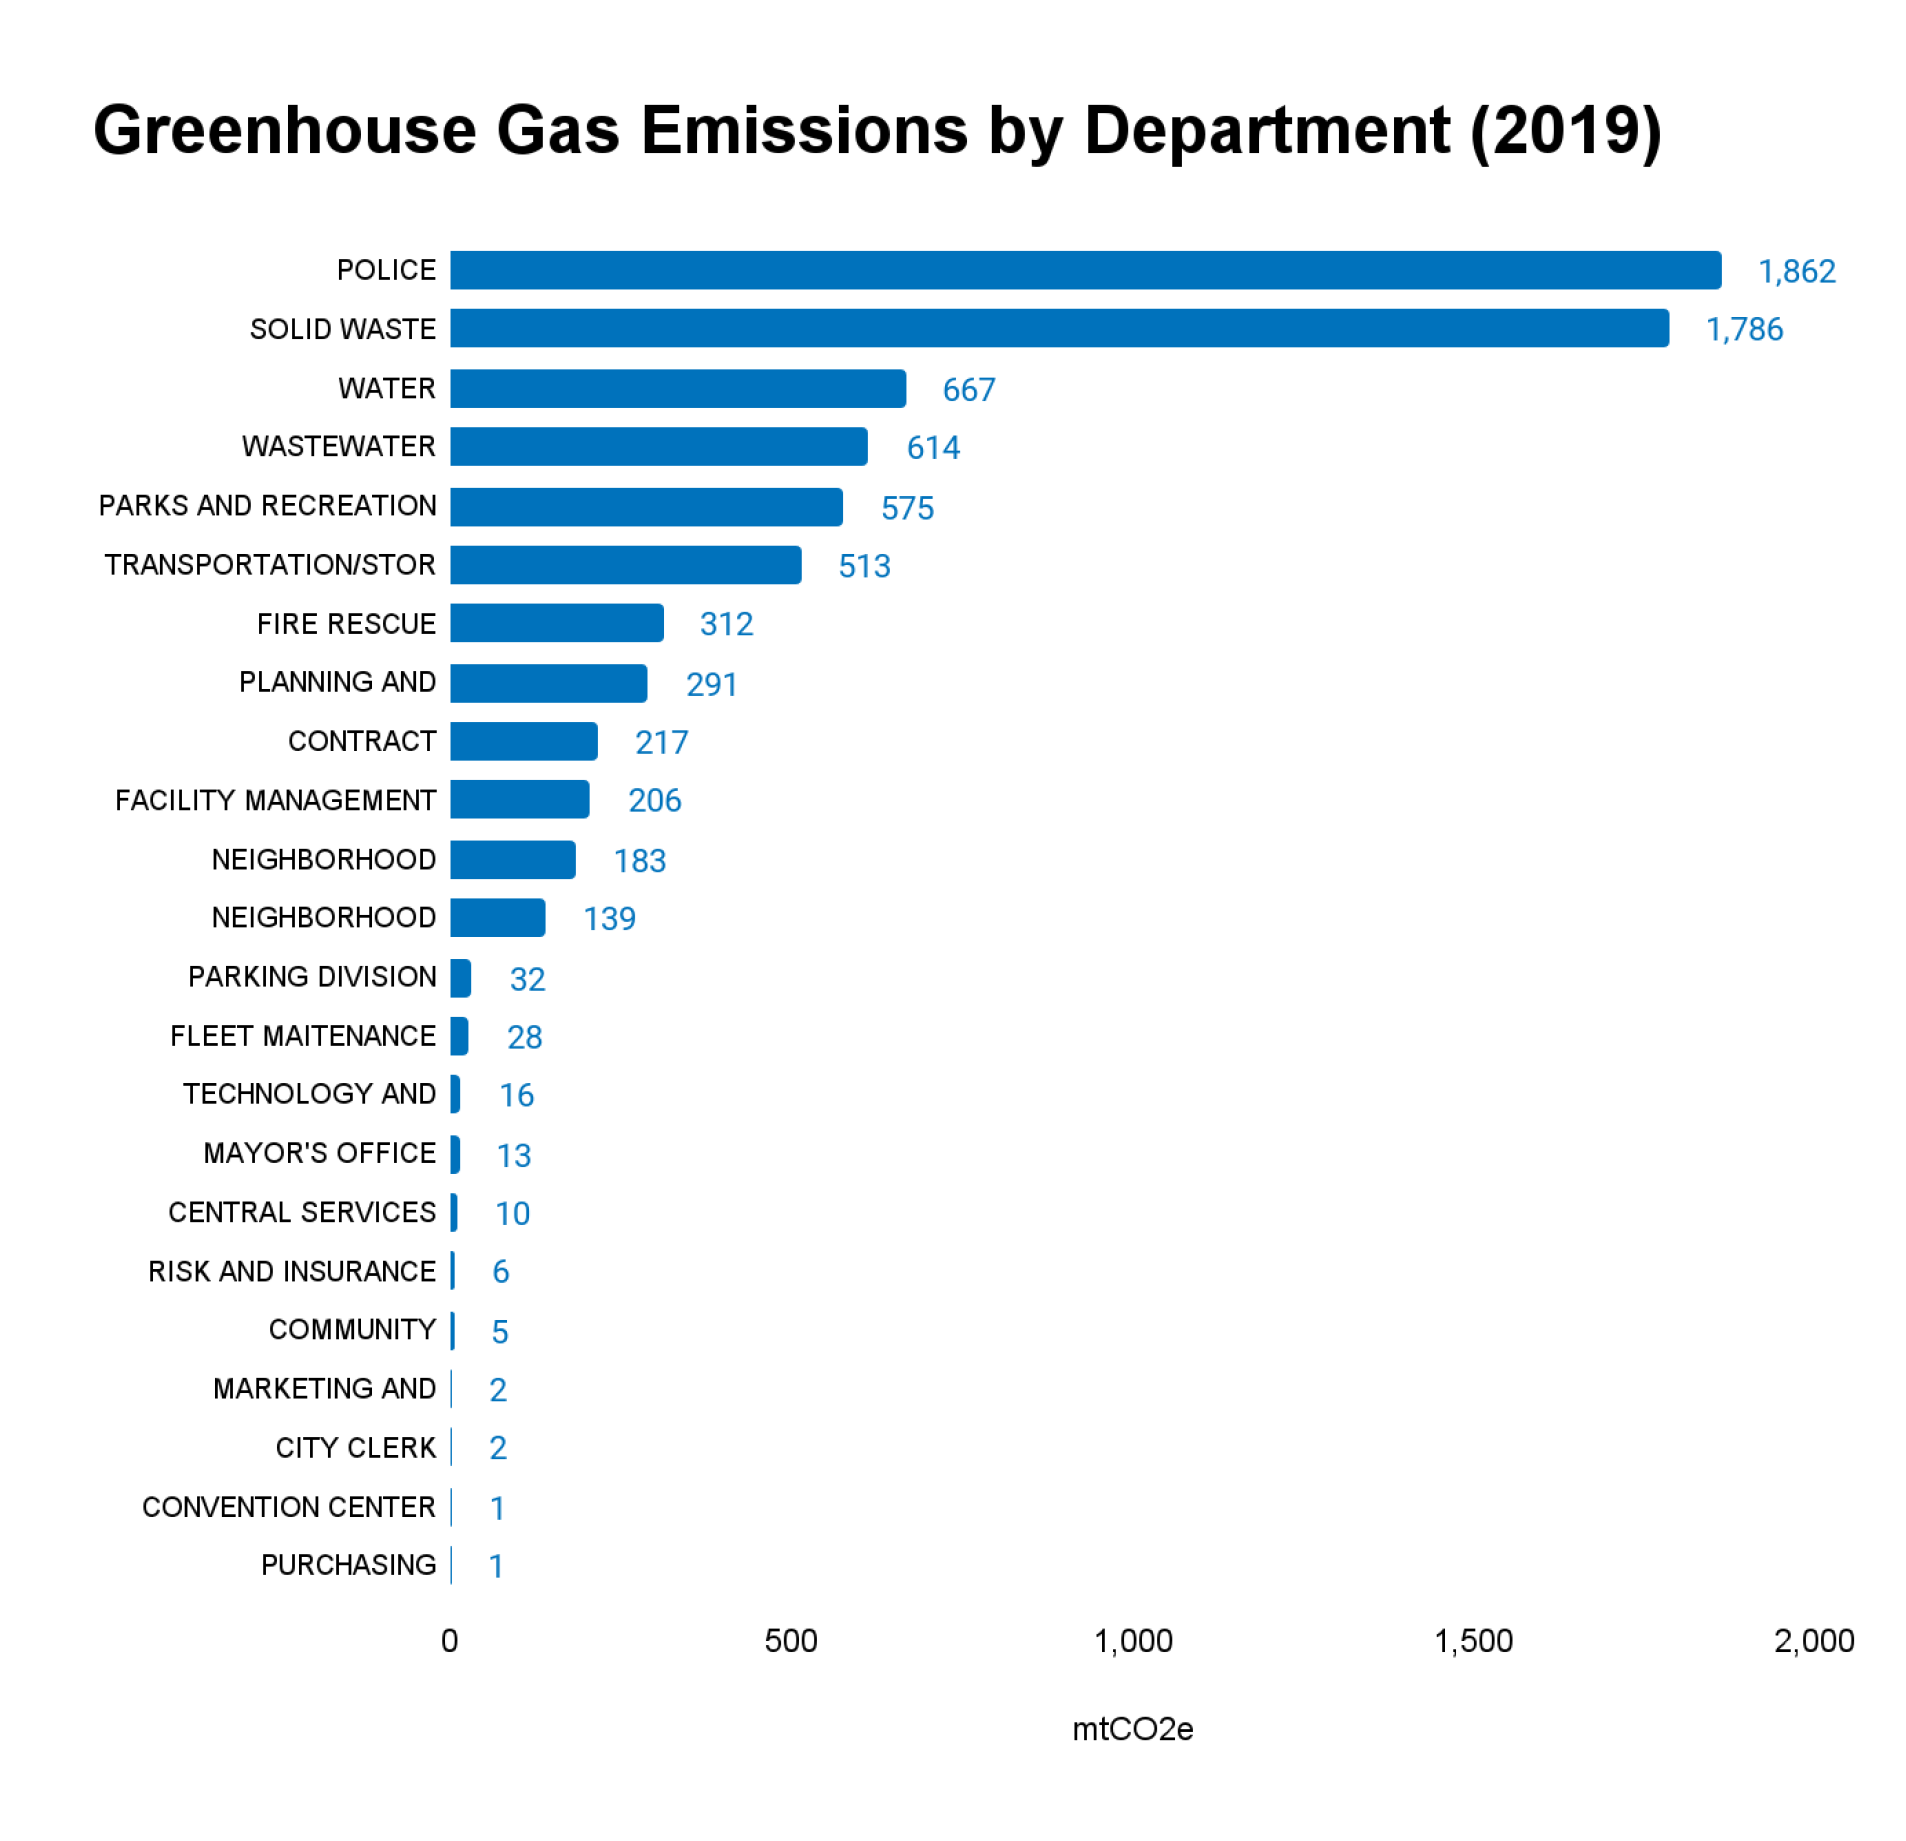
Figure 3.9. Greenhouse Gas Emissions from On-Road Fleet Transportation (2019)
Note: GHG emissions calculated on a fuel type basis.
| Department | Hours | GHG Emissions (mtCO2e) |
|---|---|---|
| CONVENTION CENTER | 120 | 4 |
| FACILITY MANAGEMENT | 46 | 2 |
| FIRE RESCUE | 320 | 11 |
| FLEET MAINTENANCE DIVISION | 654 | 23 |
| NEIGHBORHOOD ENHANCEMENT DIVISION | 242 | 9 |
| PARKS AND RECREATION | 20,360 | 722 |
| POLICE | 582 | 25 |
| SOLID WASTE | 5,207 | 183 |
| TRANSPORTATION/STORMWATER | 3,942 | 427 |
| WASTEWATER | 21,910 | 775 |
| WATER | 9,188 | 312 |
| Grand Total | 62,571 | 2,492 |
3.2.3.1 Key Findings: Government Fleet
Fleet operations account for approximately four percent of total GHG government operation emissions. Not surprising that the Tampa Police Department recorded the largest vehicle miles traveled of all the departments followed by solid waste, water, and wastewater departments. Fuel sources for the City’s fleet are primarily from gasoline and diesel; the City acquired 22 CNG vehicles in 2013 which would result in a GHG reduction. EV replacement policy and CNG trucks (about in Natural gas).
3.2.4 Government Solid Waste
The City of Tampa collects all municipal solid waste (MSW) generated within City limits. The majority of municipal solid waste (MSW) generated in the City of Tampa is combusted in the McKay Bay Refuse-to-Energy Facility with the remainder being sent to the Southeast County Landfill, located over 20 miles to the southeast (Figure 3-11). In 2019, 80 percent of all waste was combusted, 18 percent was sent to the landfill with a small percentage (less than three percent) recycled. Sources of GHG emissions from MSW include direct emissions from the burning of solid waste and from fugitive emissions from landfills. Total GHG emissions from solid waste is presented in Figure 3-12.
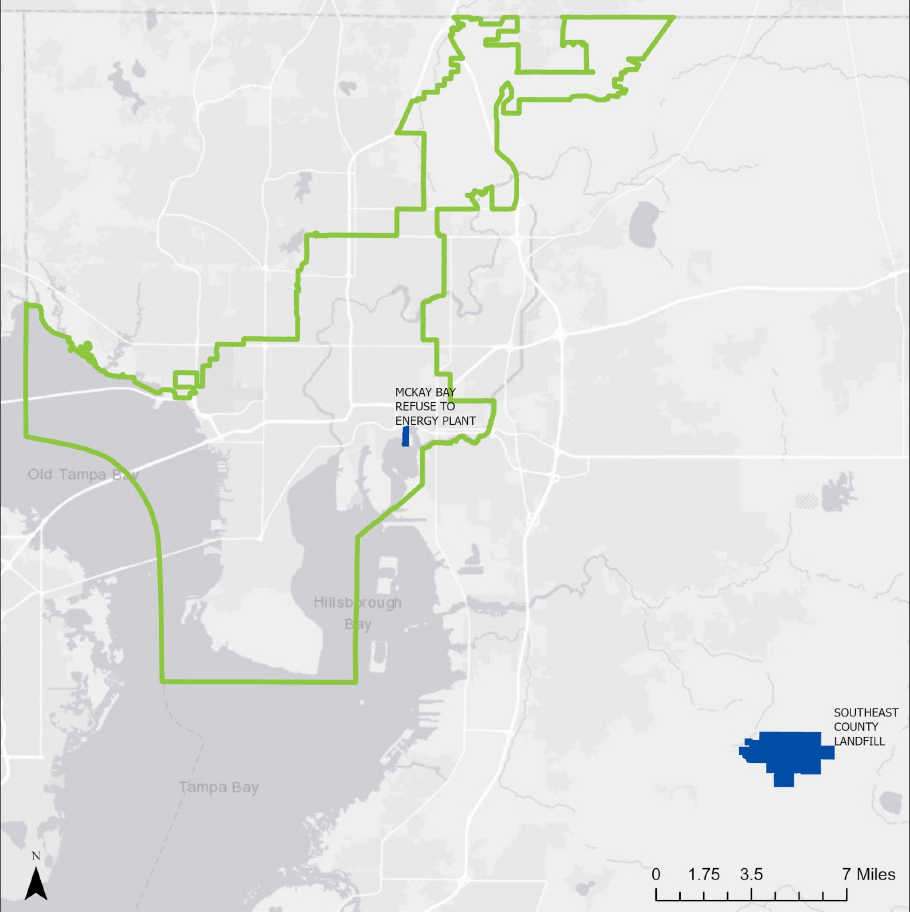
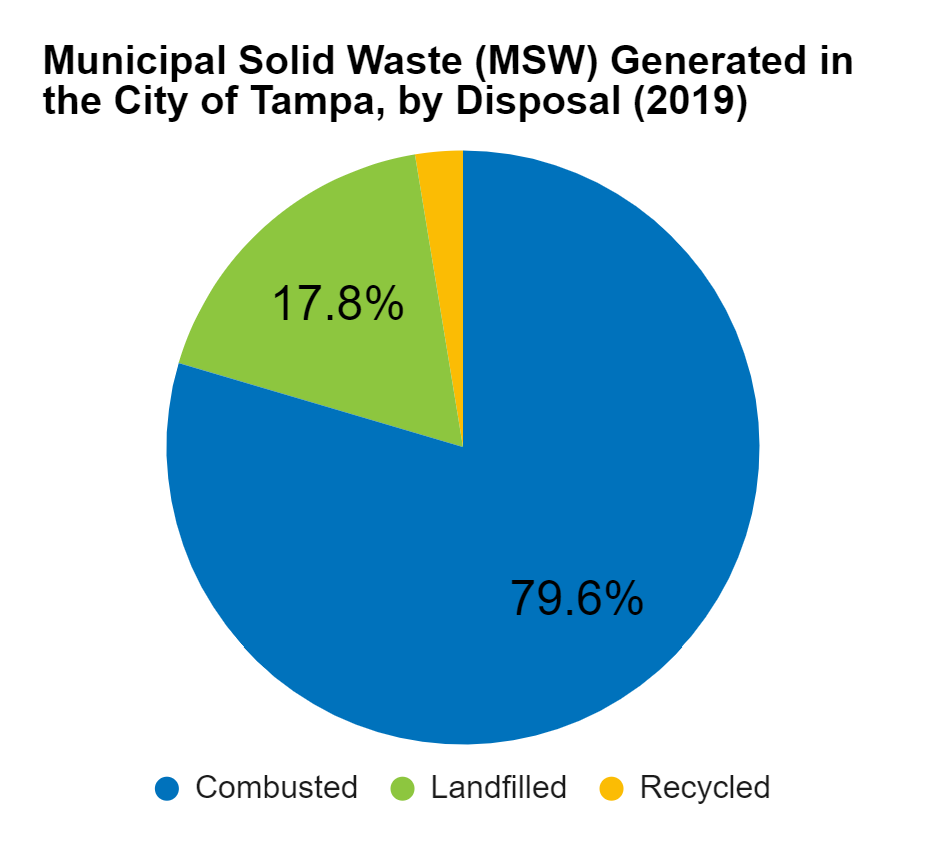
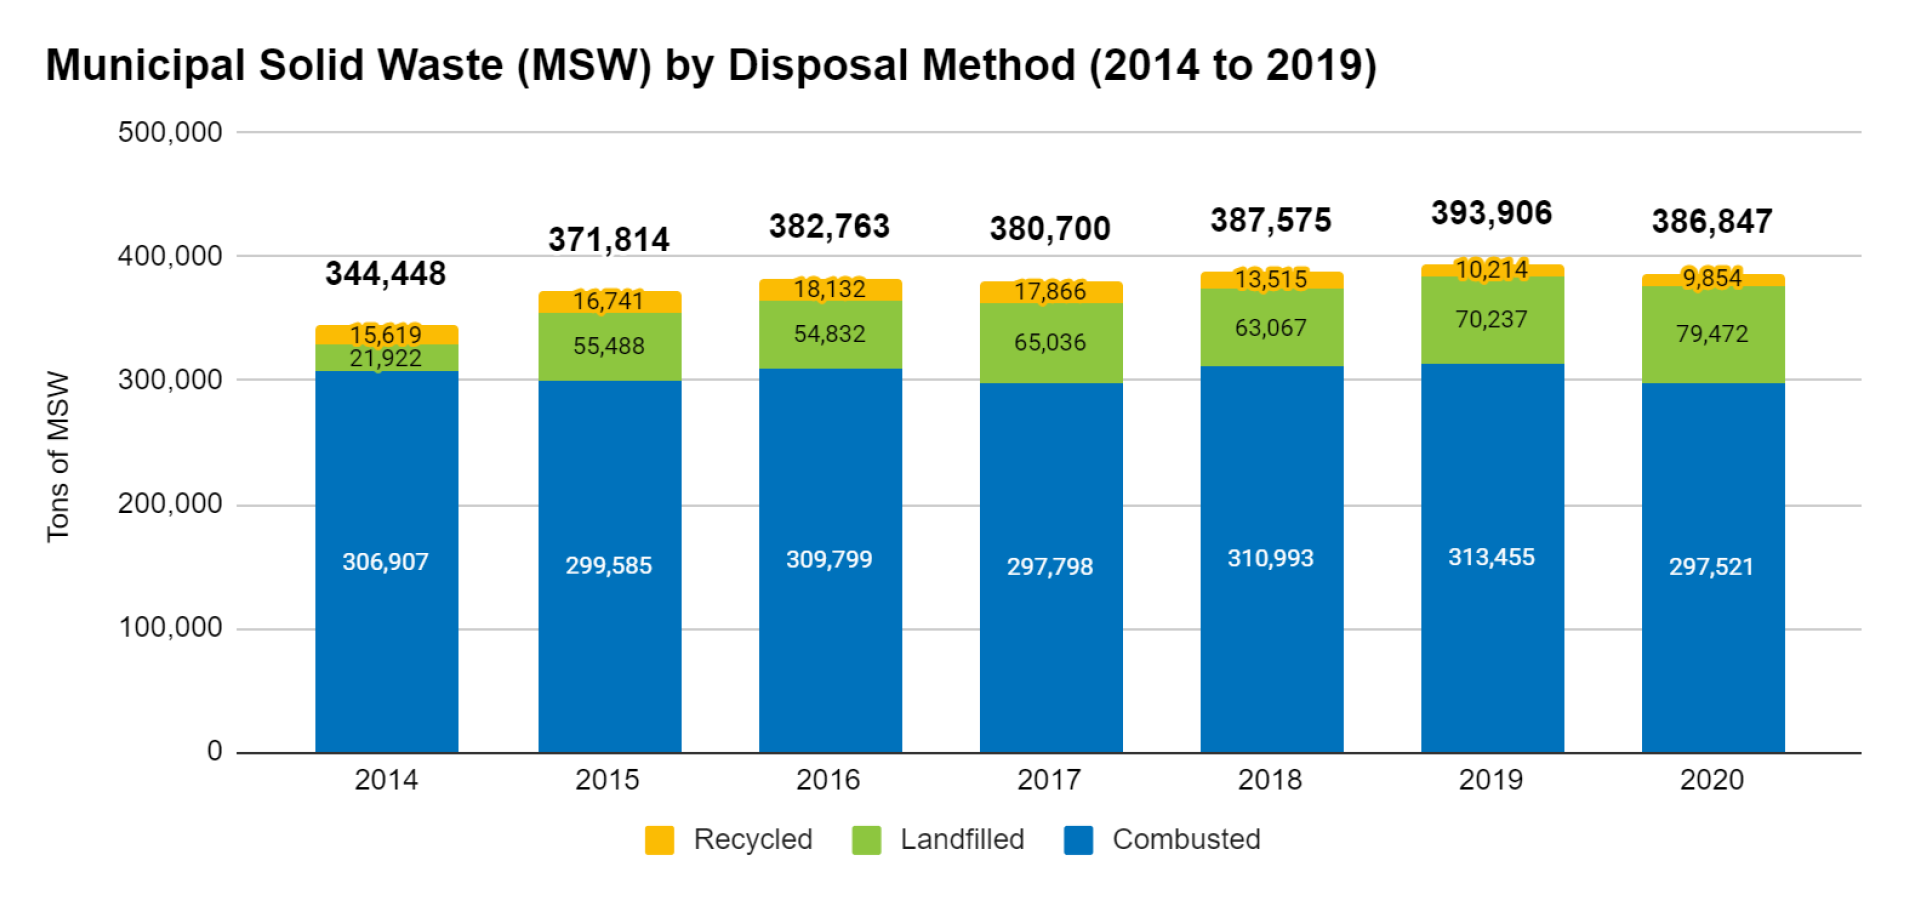
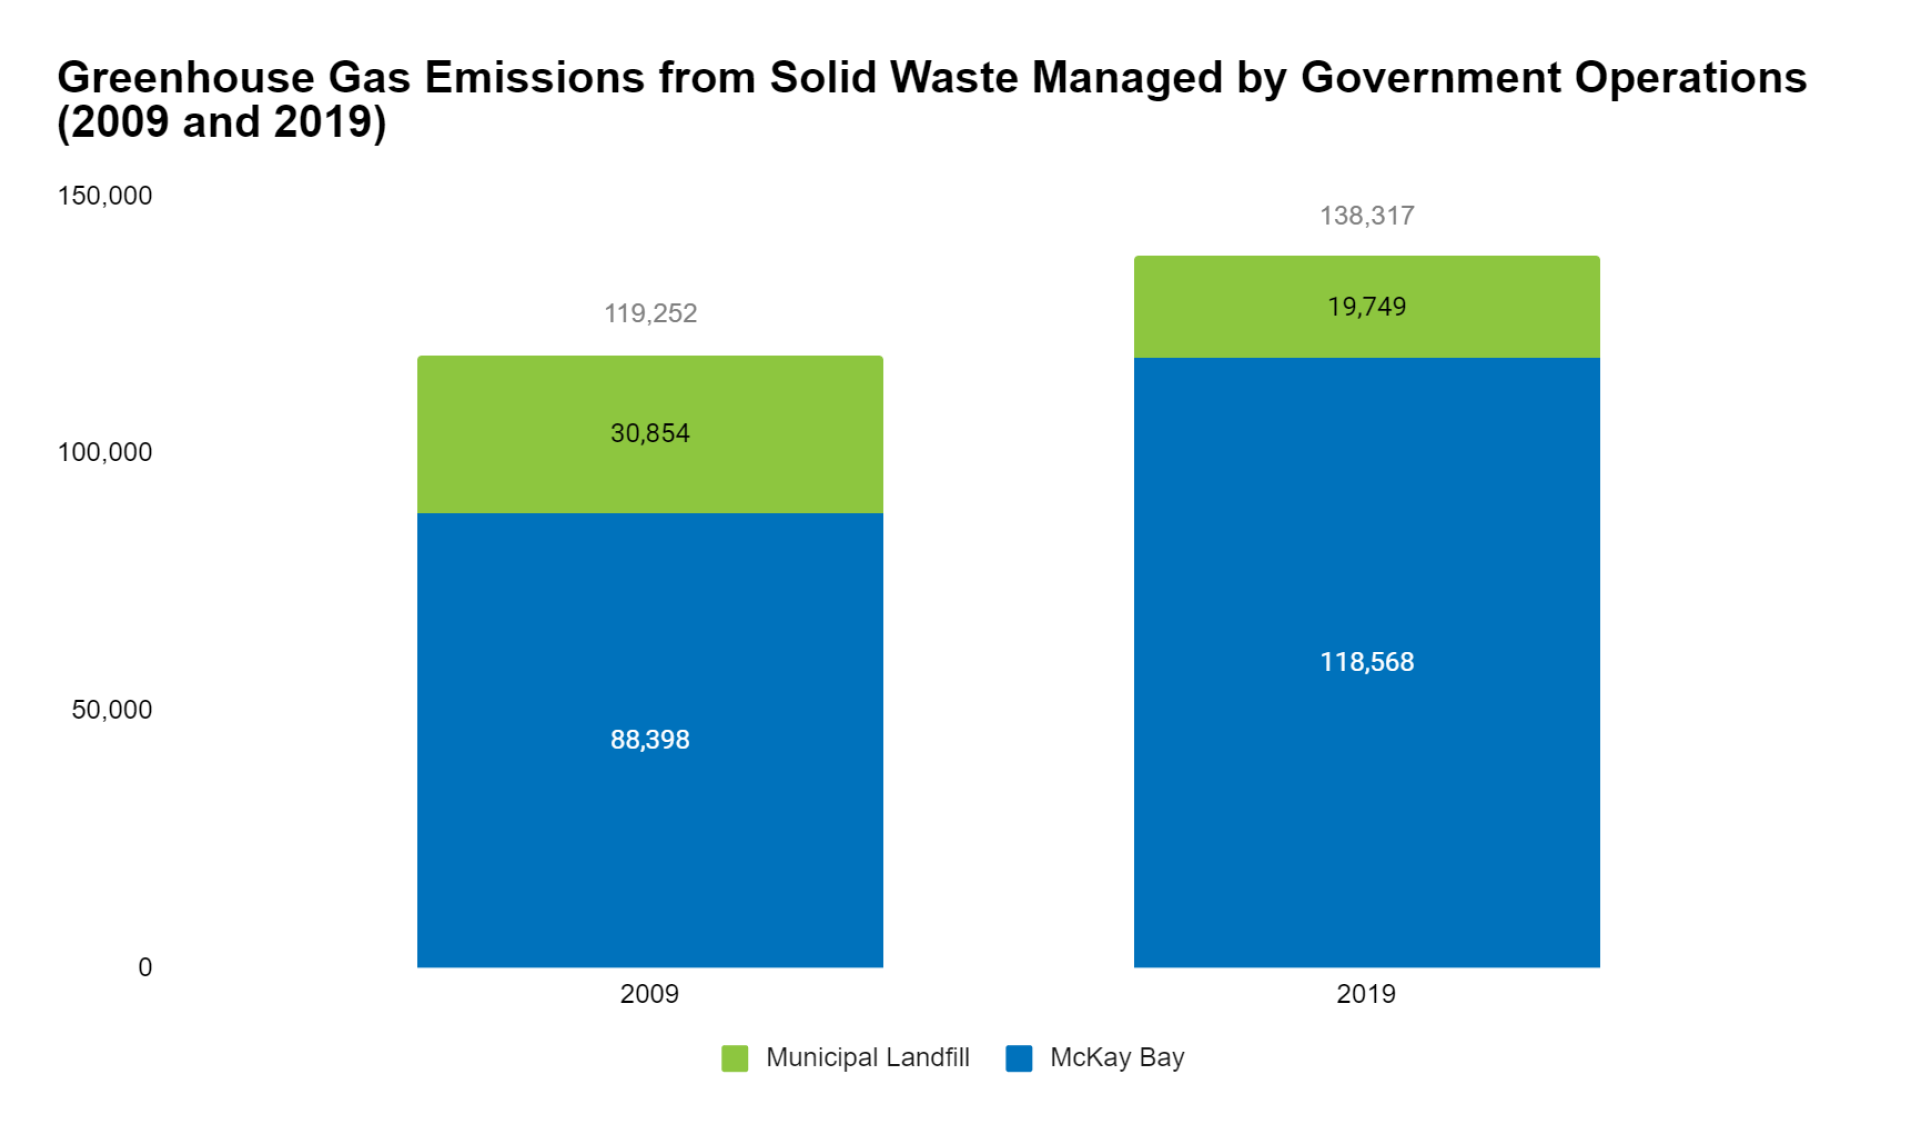
Figure 3-12. Greenhouse Gas Emissions from Solid Waste by Facility (2009 and 2019)
3.2.4.1 Government Solid Waste Combustion
The City of Tampa has been burning its municipal solid waste since 1967 when the first Tampa Incinerator was (<http:built.10>)built.10 The incinerator operated until 1979 when the McKay Bay Refuse-to-Energy Facility was constructed to replace it in 1985. A private contractor, Covanta Energy, operated the facility until 2020 when the City of Tampa took operational control. The electricity generated from the facility is sold to Seminole Electric Cooperative and is committed for 20 MW of its 22.1 MW capacity.</http:built.10>
GHG emissions are emitted from burning waste and ash is generated as a result. In 2019, 65,998 tons of ash was transported to Cedar Trails landfill in Bartow, Florida for use as daily cover. Activity data for GHG emissions from combustion was derived directly from the EPA FLIGHT database11 that reports direct emissions from McKay Bay Refuse-to-Energy Facility. Data is available annually from 2010 through 2019. Figure 3-13 presents GHG emissions reported by the McKay Bay Refuse-to-Energy Facility.
- Brief history of the City of Tampa’s Solid Waste Department, available at: (<https:>)https://www.tampa.gov/solid-waste.</https:>
- EPA FLIGHT raw data available at: (<https:>)https://ghgdata.epa.gov/ghgp/main.do#</https:>
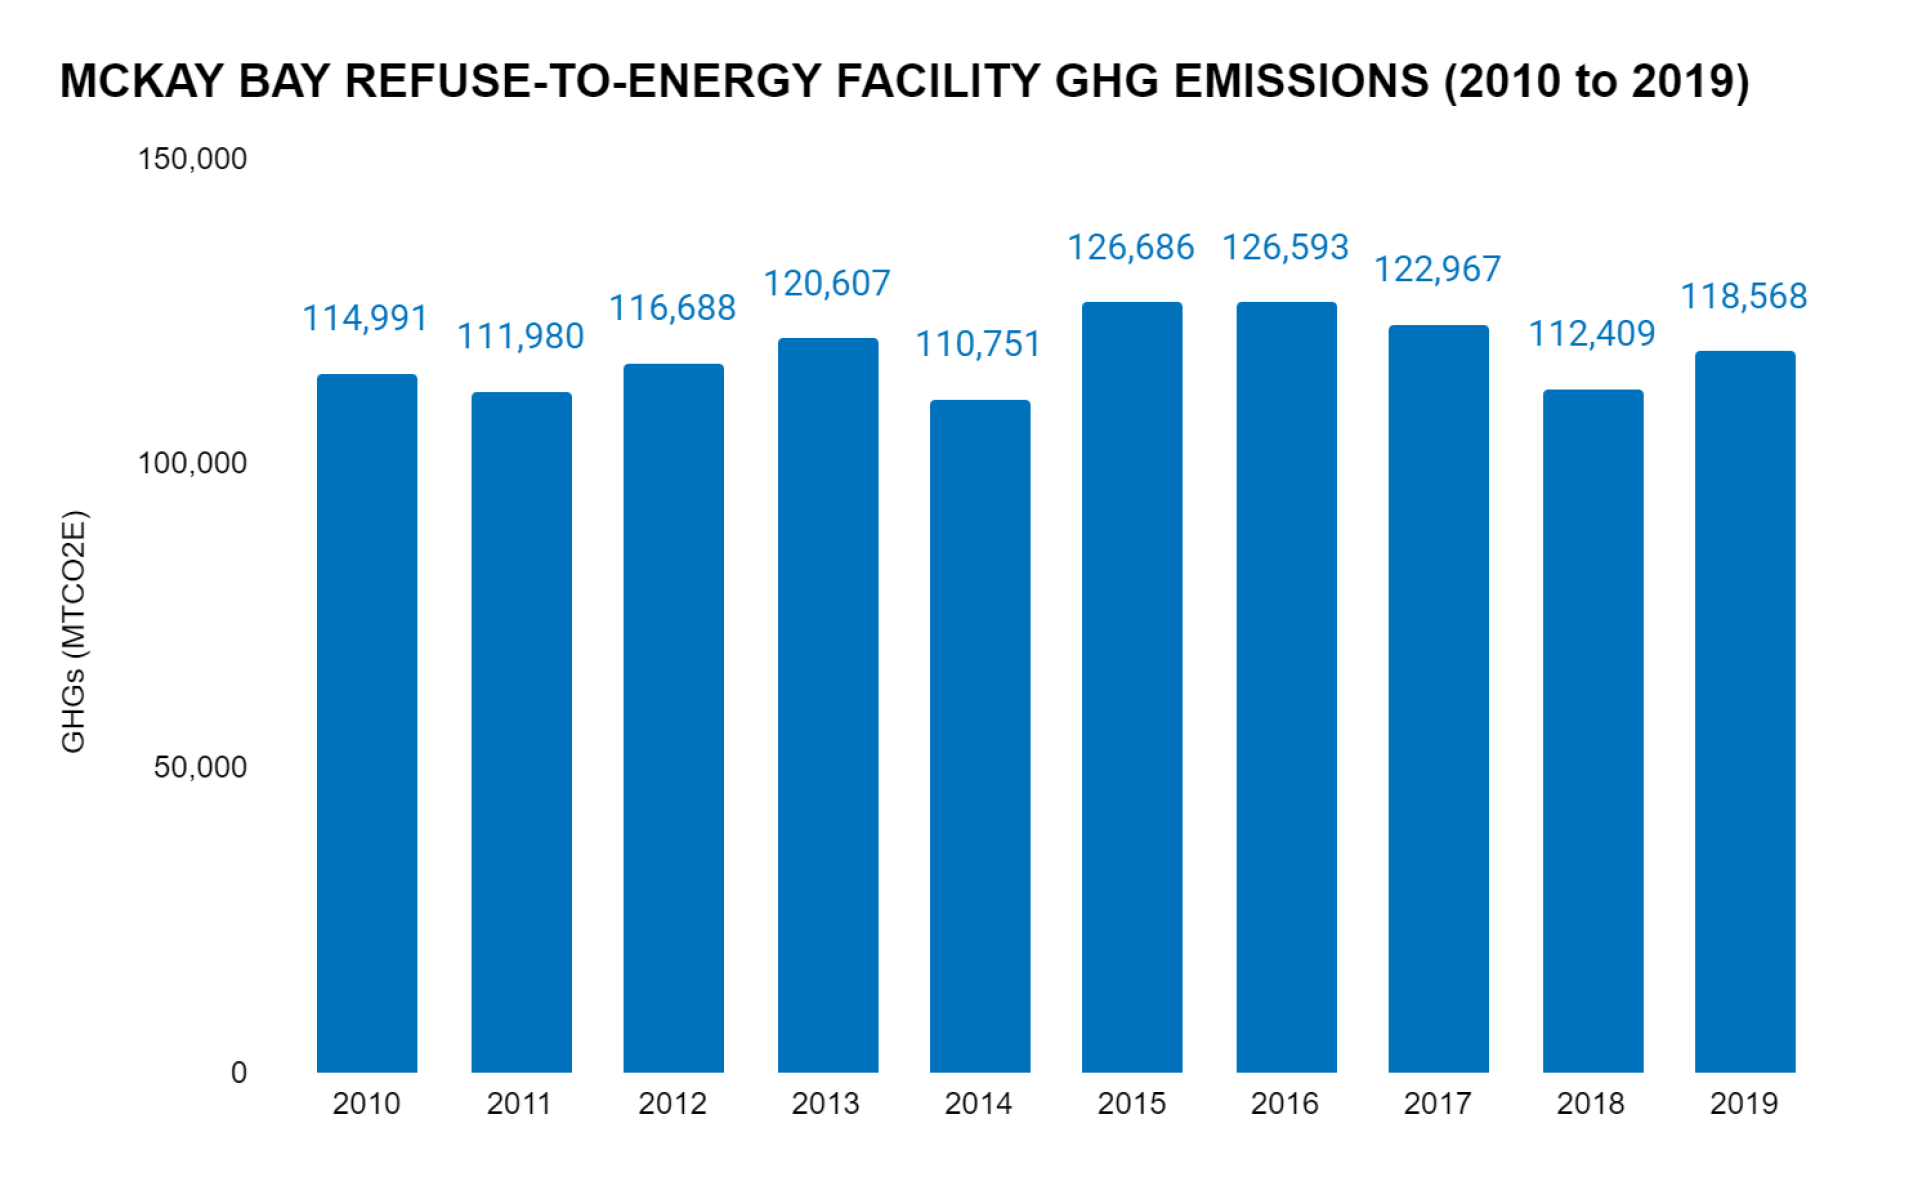
Figure 3-13. McKay Bay Waste-to-Energy Facility Greenhouse Gas Emissions in the City of Tampa (2010 to 2019)
Data Source: EPA’s GHGRP’s FLIGHT database
3.2.4.2 Government Solid Waste Landfill
In 2019, approximately 18 percent of MSW generated in the City was trucked to over 20 miles outside City boundaries to the Southeast County Landfill which is operated by Hillsborough County. MSW data for 2014 through 2020 was obtained from the City of Tampa’s Solid Waste Department, disaggregated by disposal type, and compared to the 2009 estimate from the 2009 GHG inventory. The total waste sent to the landfill has more than doubled from 2009 to 2019 (Figure 3-14). The GHG Protocol provides two methods for estimating GHG emissions from landfills. The first method, using a first order decay (FOD) model that accounts for the lifetime GHG emissions from landfill waste, was selected for its precision and reliability as indicated in the GHG Protocol. This GHG inventory used the WARM model, a tool developed by the EPA, to estimate GHG emissions. Activity data was split into categories of waste (i.e., corrugated cardboard, newspaper, recyclables, and compostable materials) using the percent distribution from the 2015 waste composition study at Hillsborough County’s Resource and Recovery Facility, assuming the City of Tampa’s waste stream is similar to surrounding communities. The resulting GHG emissions from the WARM output are reported for both 2009 and 2019.
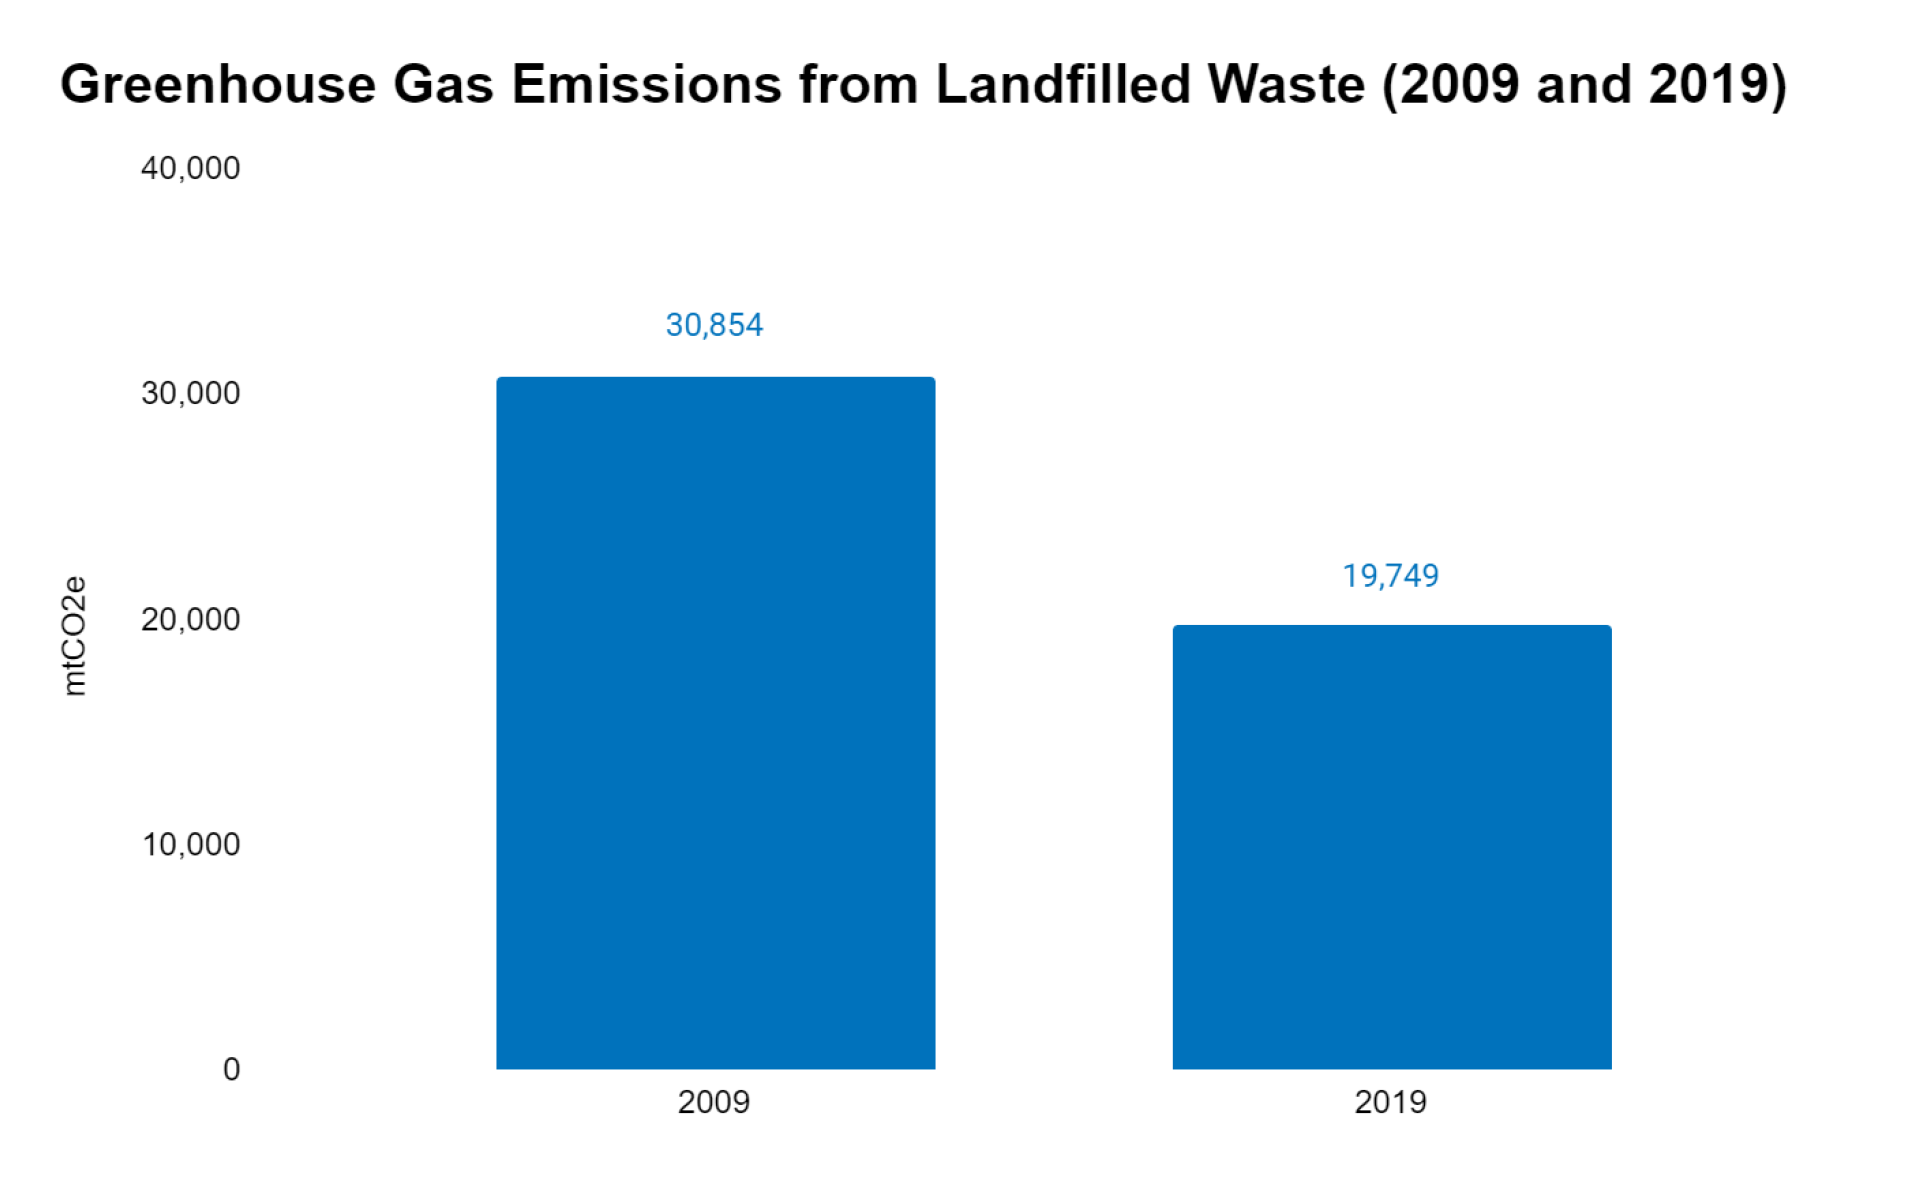
3.2.4.3 Avoided Greenhouse Gas Emissions from Recycling
GHG emissions are avoided when materials are recycled rather than combusted or landfill. In 2019, 7,758 tons of residential and 1,451 tons of commercial waste were recycled. In addition, 10,347 tons of metals, 9,596 tons of yard waste, and 18,770 tons of C&D waste was also recycled. Avoided GHG emissions from recycling was estimated assuming that all recycled material would be sent to the landfill and that the composition of the trash is similar to the county facility (Figure 3-15).
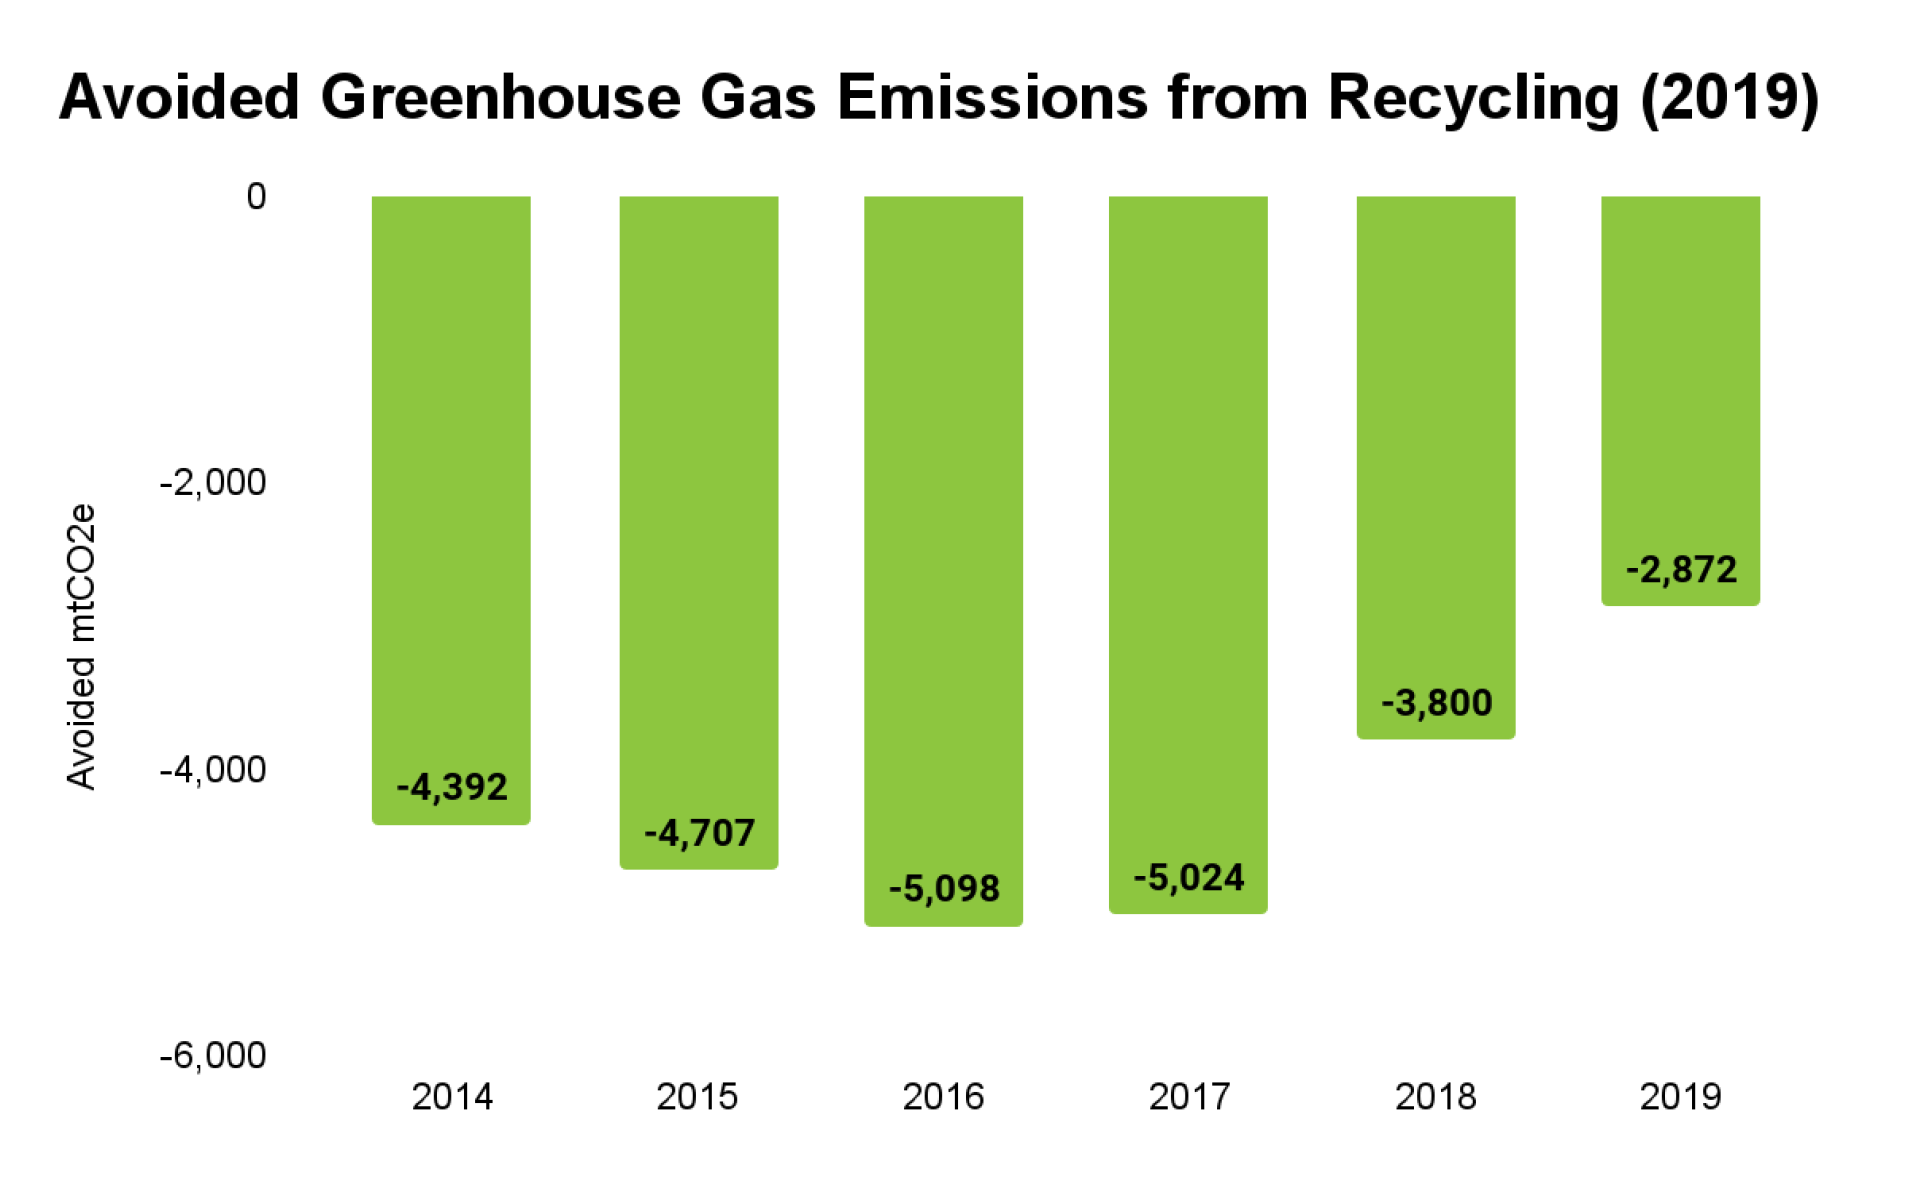
3.2.4.3 Key Findings: Government Solid Waste
Solid Waste comprises over 50 percent of government operation GHG emissions due to the city having operational control of all city generated waste. The majority of waste is combusted at the McKay Bay Refuse-to-Energy Facility and the City took over the facility in 2020. Electricity generated at McKay Bay is sold to Seminole Electric Cooperative, who can claim renewable energy credits, not the City of Tampa. More waste is generated than can be combusted at the RTE plant and the overflow is sent to the Southeast County landfill located over 20 miles outside the city boundary. Total waste sent to the landfill has more than doubled from 2009 to 2019. Even with the increase in waste sent to the landfill, a reduction in GHG emissions was observed which is explained by the fact that Hillsborough County began flaring methane gas, which emits less GHGs compared to no flaring which was not in operation in 2009. The recycling rate in the City of Tampa has decreased from approximately 4.5 percent in 2009 to 2.5 percent in 2019. Opportunities exist by increasing the recycling rate that include fewer GHG emissions from the landfill by avoiding the trip which also adds fuel consumption from trucking waste.
3.2.5 Government Water and Wastewater
3.2.5.1 Government Water
The City of Tampa operates water and wastewater for the entire City. Water is supplied mostly from the Hillsborough River, with aquifer withdrawals during the dry season. Water is treated at the David L. Tippin Water Treatment Facility, and piped to customers throughout the City. In 2009, the City of Tampa purchased 3,344,390 million gallons of water from Tampa Bay Water to meet shortages which resulted in 5,681 MTCO2e12 for that year. In 2020, the City of Tampa purchased 1.46 million gallons per day from Tampa Bay Water. However, there were no purchases from TBW13 from 2017-2019, as is shown on Figure 3-16.
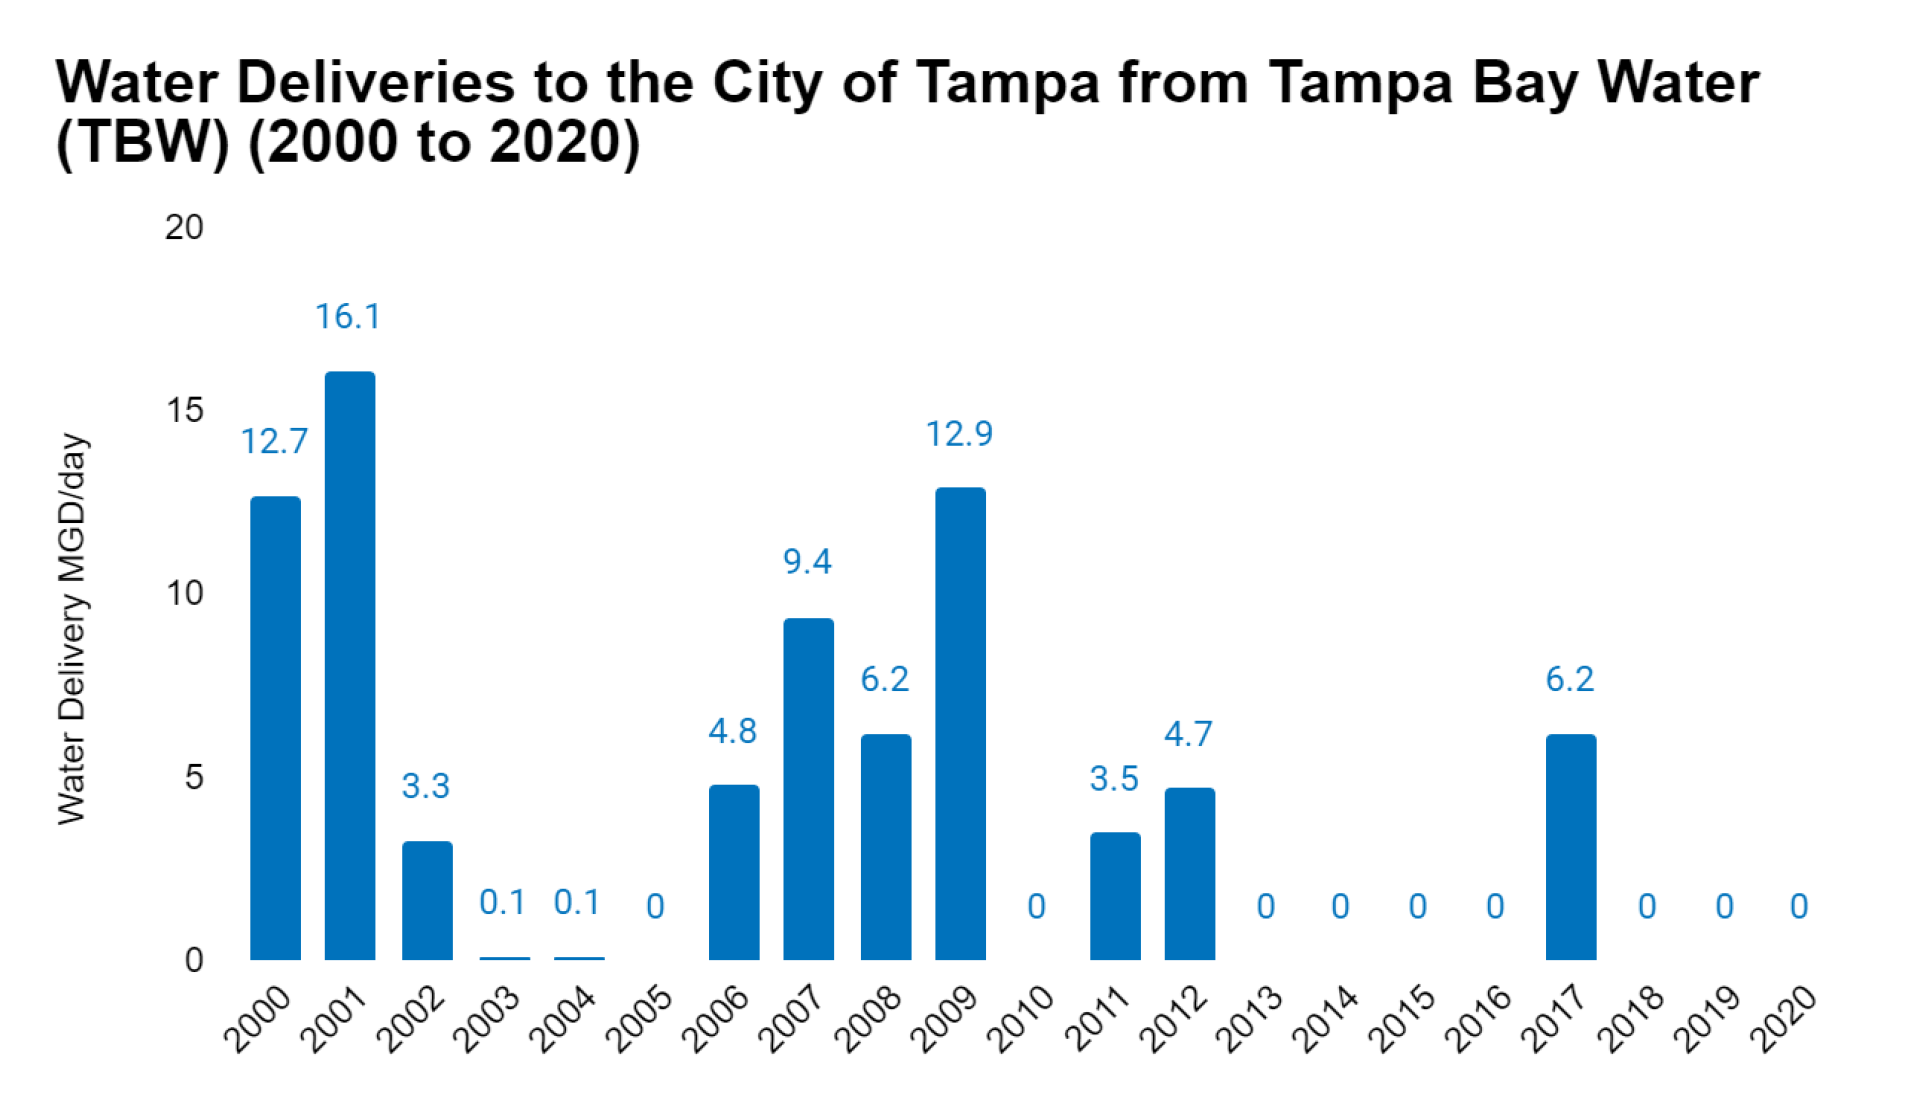
12 Reported in the 2009 GHG Inventory published in 2011
13 Tampa Bay Water’s Five Year Conservation Plan, available at: (https://www.tampabaywater.org/Portals/0/Documents/Members_Five_Year_Conservation_Plans_2016.pdf)
3.2.5.2 Government Wastewater
Sewage is routed to two wastewater plants located within the service area. GHG emissions were estimated using the Local Government Operations Protocol (LGOP), version 1.1’s wastewater emissions module. The estimate is based on population and the population of Tampa was used for data inputs. Based on these estimates, GHG emissions from fugitive wastewater totaled 7,491 mtCO2e.
3.2.5.3 Key Findings: Government Water and Wastewater
The City of Tampa is responsible for supplying clean water and treating wastewater within City limits. These activities are energy intensive and most GHG emissions are from electricity which are presented in Section 3.2.1. Fugitive GHG emissions from wastewater represent nearly 16 percent of the total GHG emissions from government operations. During times of water shortages, additional water is purchased from Tampa Bay water. However, In recent years, no additional water was needed to supplement existing supplies. High GHG emissions are associated with imports from Tampa Bay Water and its desalination plant.
3.3 GOVERNMENT GHG EMISSIONS FROM ENERGY SOURCES
In 2019, more than 80 percent of the City of Tampa operation is powered on natural gas either through natural gas powered electricity plants or from imported natural gas (Figure 3-17). Coal is used to power the Big Bend Power Plant and this addition comprises about five percent of the energy mix. Recent reductions in coal use by TECO has resulted in lowered GHG emissions across the utility’s service area (see Appendix B provides an analysis of TECO’s energy mix).
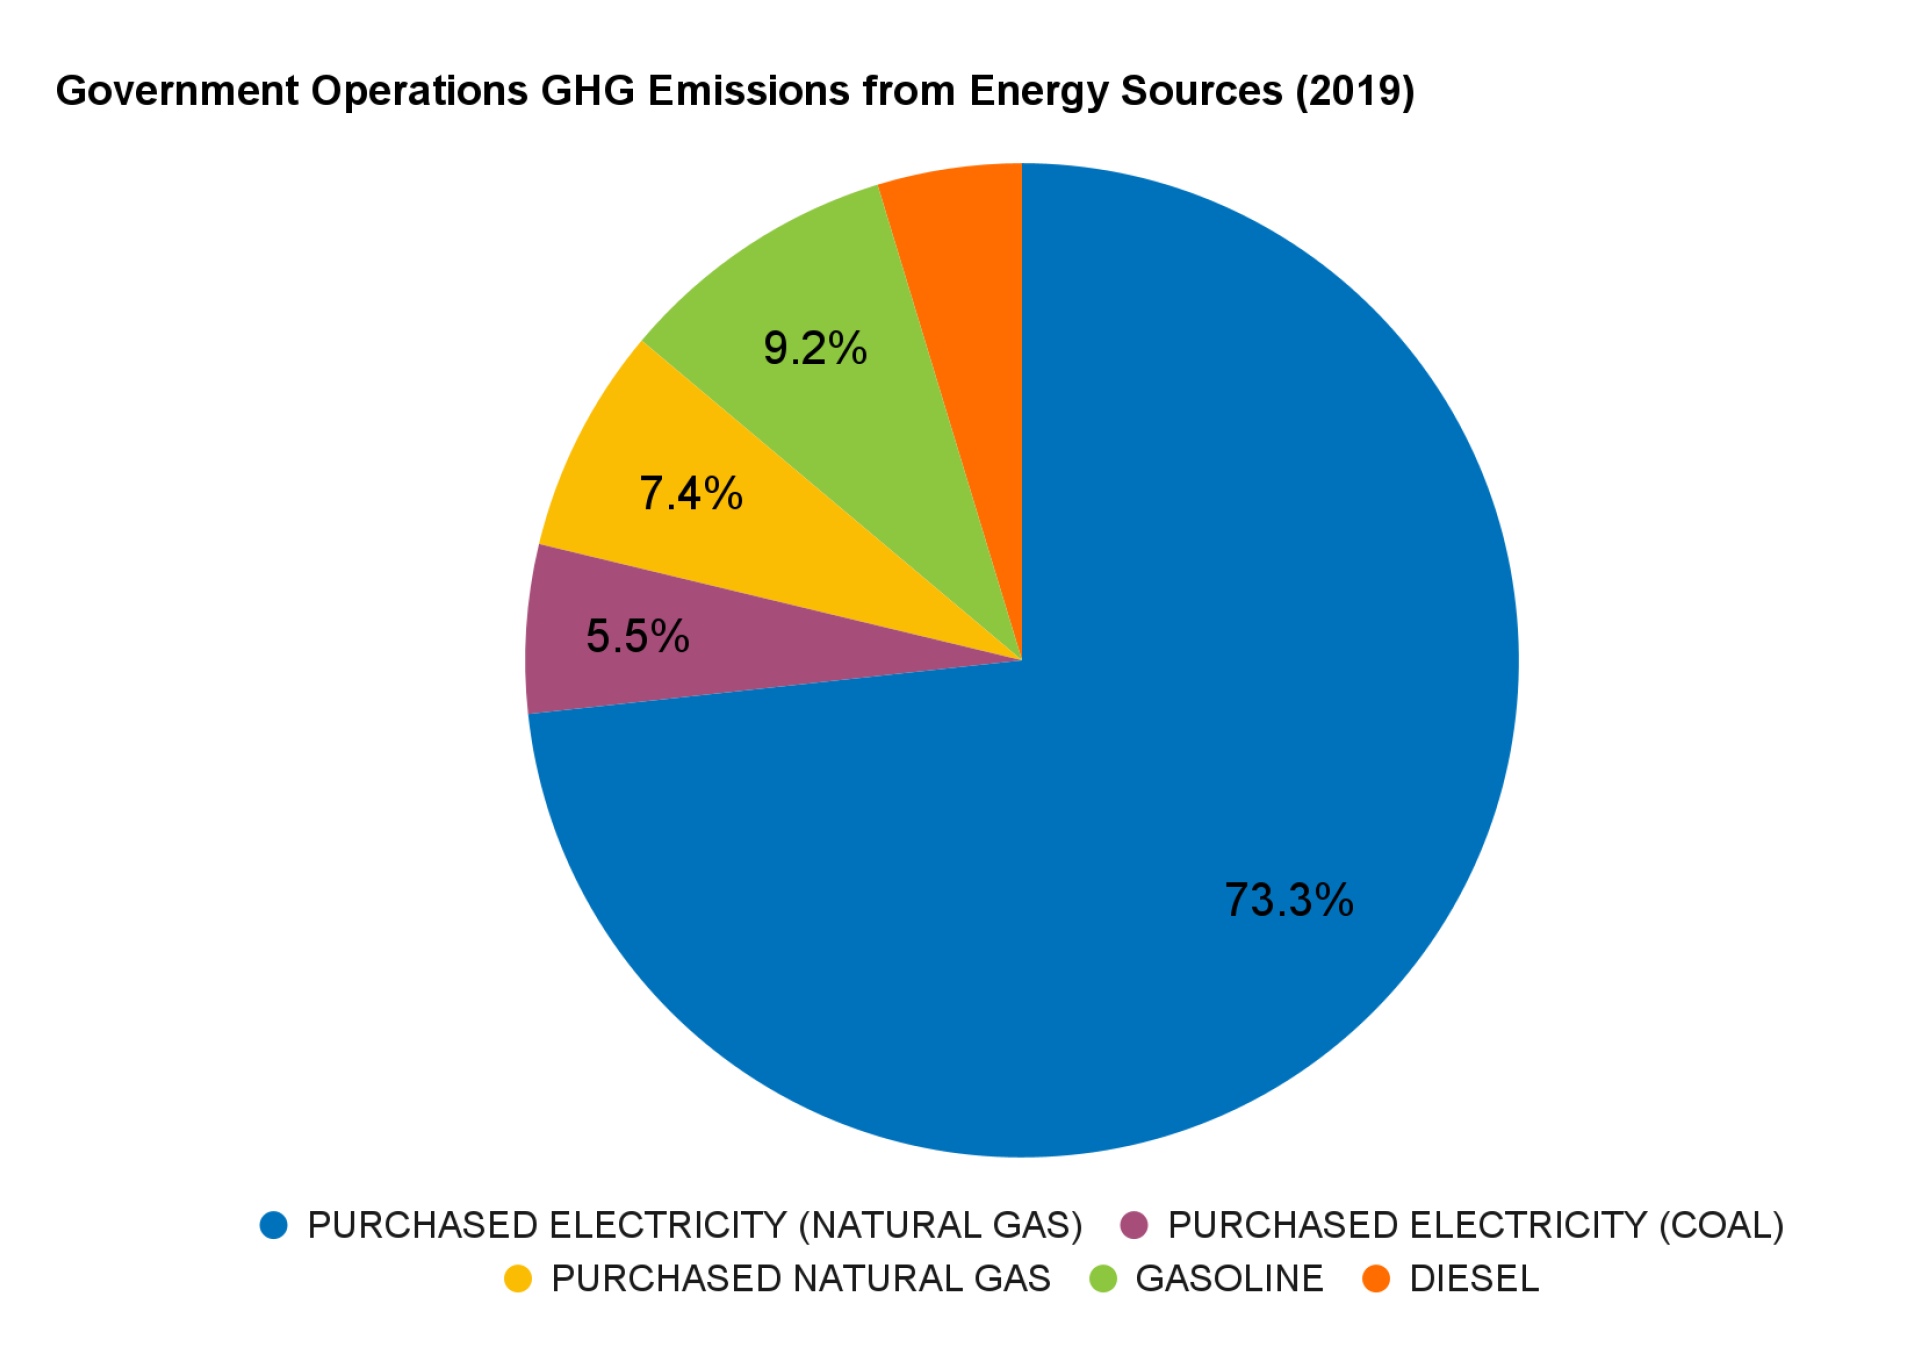
3.3.1 Key Messages: Government Operations Energy Mix
- Over 80 percent of the City’s operation is powered from natural gas.
- Coal is still in the mix due to TECO’s continued use of coal in one of its generating units. The percent in the mix though is over five percent.
- Gasoline and diesel fuel comprise a total of approximately 13 percent of the total energy mix.
- The City of Tampa had no renewable energy in its energy mix.
4.0 CITY-WIDE GREENHOUSE GAS INVENTORY
4.1 CITY-WIDE GREENHOUSE GAS EMISSIONS OVERVIEW
4.1.1 City-wide Total and Categorical GHG Emissions
City-wide net GHG emissions decreased by more than 20 percent between 2009 and 2019, while the City’s population increased by 28 percent over the same time period (Figure 4-1). Typically, GHG emissions trend with the population. The disparity between the City of Tampa’s emission reduction can be explained by the following factors. First, the City’s electricity provider changed its fuel source from coal to natural gas at the Big Bend Power Plant (see Appendix B). Coal produces about twice the GHG emissions as natural gas for the same energy output. Secondly, residential electricity consumption rates have increased at a slower rate than population growth indicating increased energy and fuel efficiencies across the city. Table 4-1 provides an overview of all categories and sub-categories. Two sub-categories had a decrease (electricity and landfilled waste) while the others trended upward, but at a slower rate than population, indicating improved efficiencies are occurring. As shown on Figure 4-2, transportation represents the largest source of GHG emissions. See Section 4.2 for a summary of GHG emissions from each category and sub-category.
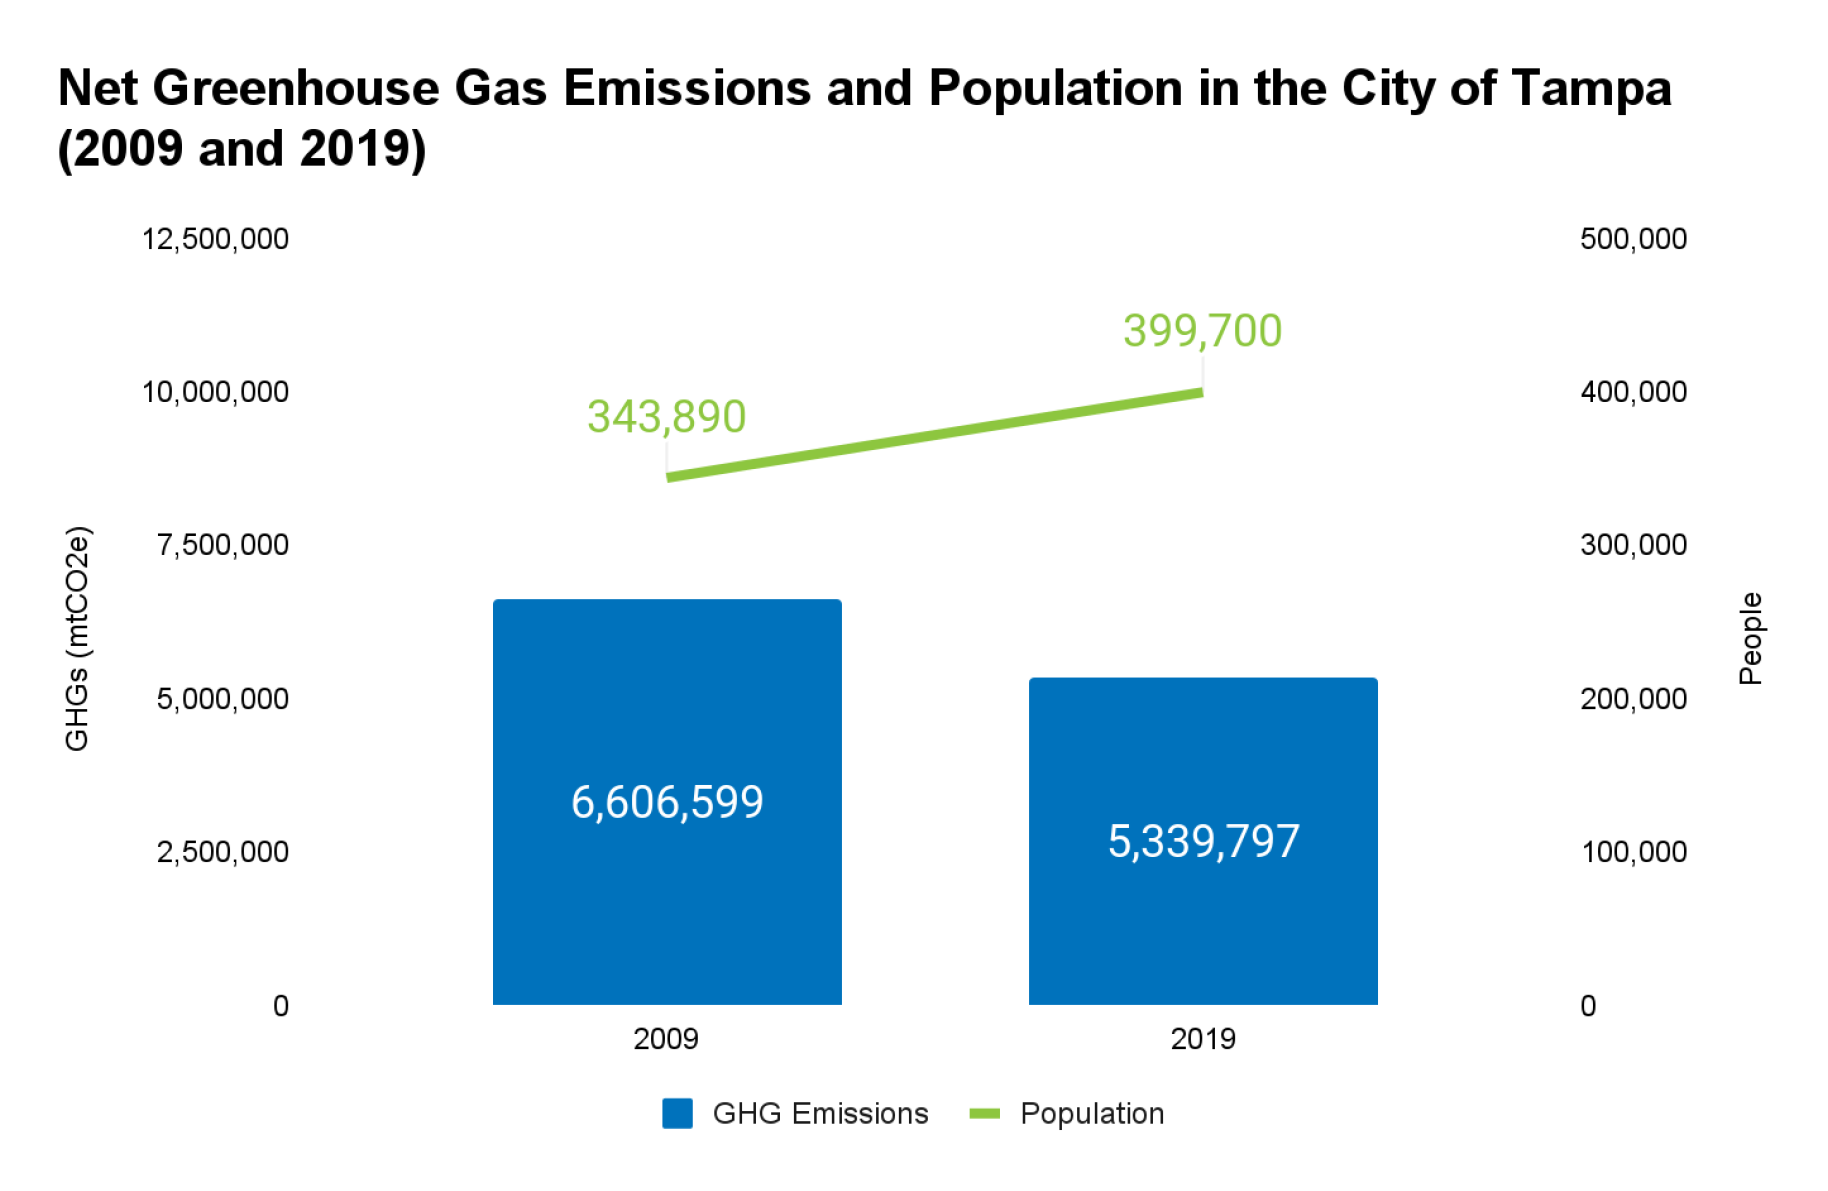
Figure 4-1. City-Wide Net Greenhouse Gas Emissions Compared to Population (2009 to 2019)
Table 4-1. City-Wide Greenhouse Gas Emissions and Sinks (2009 to 2019)
| Greenhouse Gas Category and Subcategory | 2009 | 2017 | 2018 | 2019 | Percent Change (2009-2019) |
|---|---|---|---|---|---|
| Energy | |||||
| Electricity Consumption | 4,128,240 | 3,376,555 | 3,087,091 | 2,385,358 | -42.2 |
| Natural Gas Consumption | 173,939 | - | 192,390 | 197,108 | 13.3 |
| Fugitive Emissions from Natural Gas | 40,417 | - | - | 28,859 | -28.6 |
| Transportation | |||||
| On-road Transportation | 1,677,139 | 1,827,349 | 1,856,069 | 1,884,301 | 12.4 |
| Off-road Transportation | 132,354 | 176,182 | 185,746 | 191,332 | 44.6 |
| Locomotive | 15,472 | 38,872 | 65,050 | 67,102 | 333.7 |
| Aviation | 239,455 | 214,362 | 194,683 | 200,825 | -16.1 |
| Marine | 38,986 | 162,046 | 220,745 | 227,709 | 484.1 |
| Municipal Solid Waste | |||||
| McKay Bay Refuse-to-Energy | 114,991 | 122,967 | 112,409 | 118,568 | 3.1 |
| Municipal Landfill | 19,178 | - | - | 19,749 | 3.0 |
| Water and Wastewater | |||||
| Methane from Wastewater Process | 30,000 | - | - | 7,491 | 40.3 |
| Purchased Water from Tampa Bay Water | 5,681 | - | - | - | - |
| Industrial Processes and Product Uses (IPPU) | |||||
| Industrial Processes | 0 | - | - | 28,690 | 48.6 |
| Industrial Product Uses | 151,237 | - | - | 193,585 | 33.8 |
| Agriculture, Forestry and Other Land Uses | |||||
| Fertilizer Applications | 1,092 | - | - | 1,074 | -1.6 |
| TOTAL GHG EMISSIONS | 6,768,181 | - | - | 5,551,751 | -18.0 |
| Avoided Emissions from Renewable Energy | -2,245 | - | - | -15,239 | 578.8 |
| Avoided Emissions from Recycling | -4,392 | - | - | -2,872 | -34.6 |
| Urban Forests | -154,943 | - | - | -193,824 | 25.1 |
| TOTAL GHG SINKS | 161,580 | - | - | 211,935 | 31.2 |
| NET GHG EMISSIONS | 6,606,559 | - | - | 5,339,797 | -19.2 |
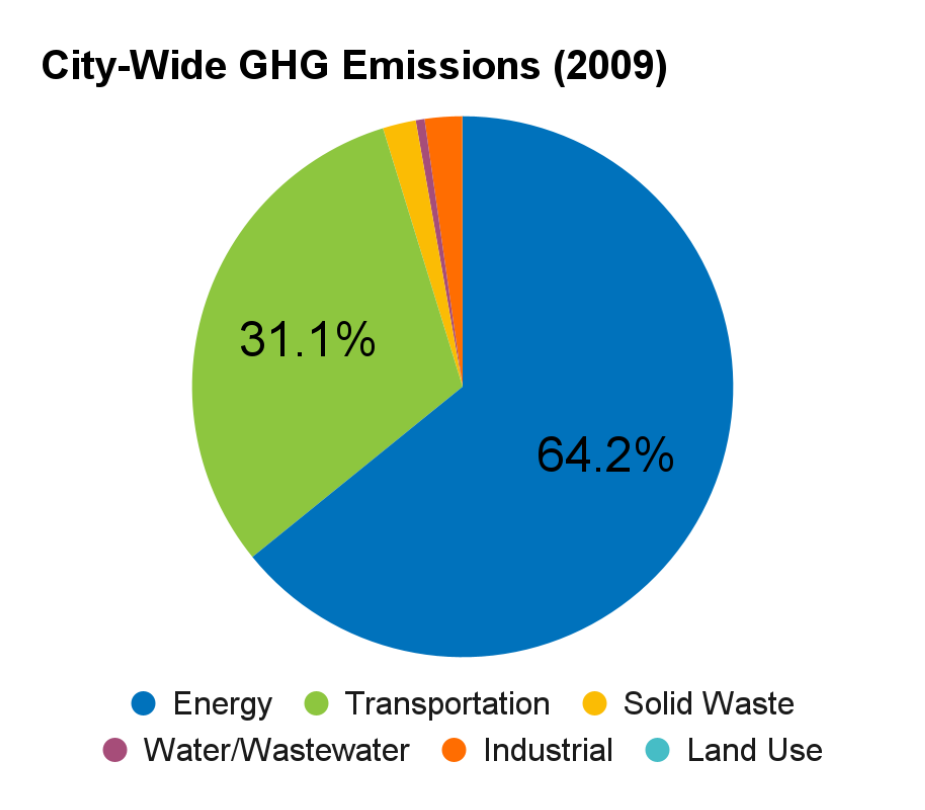
Figure 4-2. City-Wide Categorical Greenhouse Gas Emissions (2009 and 2019)
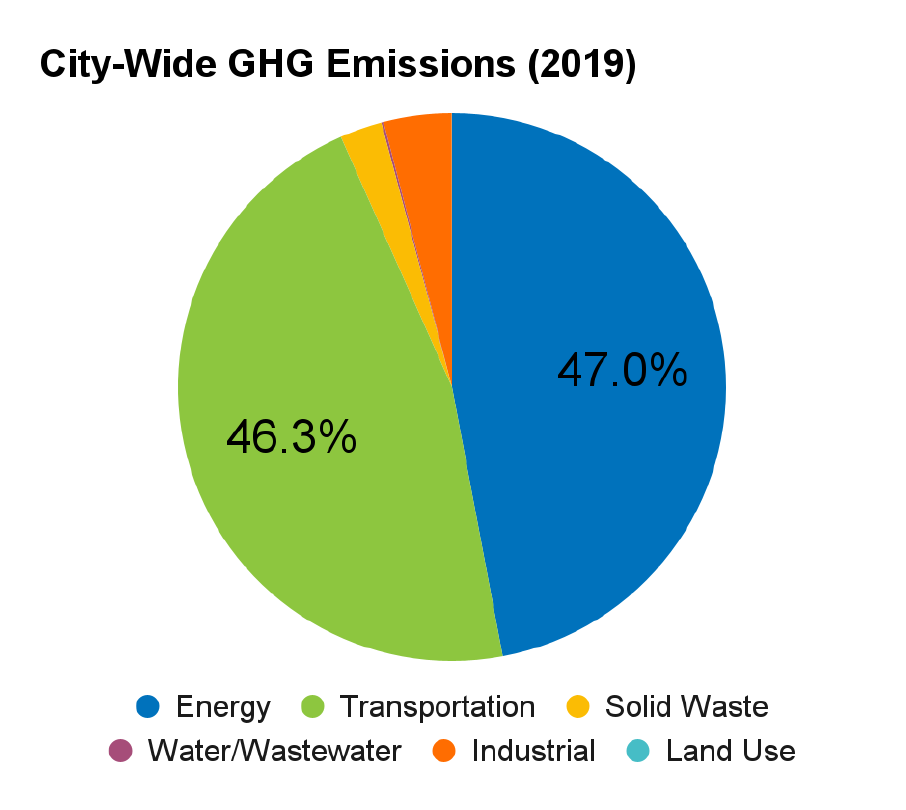
4.1.2 City-Wide Per Capita GHG Emissions
Per capita GHG emissions have decreased from 19 to 13 per person in 2019 which is comparable to GHG emissions from other municipalities (Figures 4-3 and Table 4-2).

Figure 4-3. City-Wide Per Capita Greenhouse Gas Emissions (2009 and 2019)
Table 4-2. Per Capita Greenhouse Gas Emission City Comparisons
| Local Government | Per Capita GHG Emissions (mtCO2e per person) |
|---|---|
| <https://www.myclearwater.com/government/city-departments/greenprint-clearwater-s-sustainability-plan>City of Clearwater | 11.7 (2007) 9.7 (2018) |
| <https://www.miamibeachfl.gov/wp-content/uploads/2017/11/2015-Report-GHG-Emissions-Inventory-Presentation.pdf>City of Fort Lauderdale | 17.7 (2010) |
| <https://www.miamigov.com/files/sharedassets/public/ghg-inventory-2018-full-report.pdf>City of Miami | 11.57 (2006) 7.41 MT CO2e (2018) |
| <https://www.miamibeachfl.gov/wp-content/uploads/2017/11/2015-Report-GHG-Emissions-Inventory-Presentation.pdf>City of Miami Beach | 13.3 (2014) |
| City of Sarasota | 12.6 (2015) 16.2 (2003) |
| City of St. Petersburg | 10.9 (2016) |
| City of Orlando | 21* |
| New York City | 5.8** |
*Reported in the City of St. Petersburg Community GHG Inventory
**Calculated using 2018 reported emissions divided by the City of Orlando population in 2018. Previously capita emissions were reported to be 24.2
4.1.3 City-Wide Greenhouse Gas Emissions by Sector
Categorical GHG emissions were aggregated into six sectors: residential energy, commercial energy, government energy, transportation, waste, and land use. As shown in Figure 4-4, the largest contributor of GHG emissions, by sector, was on-road transportation (35 percent) followed by commercial and residential energy (19 and 17 percent, respectively).
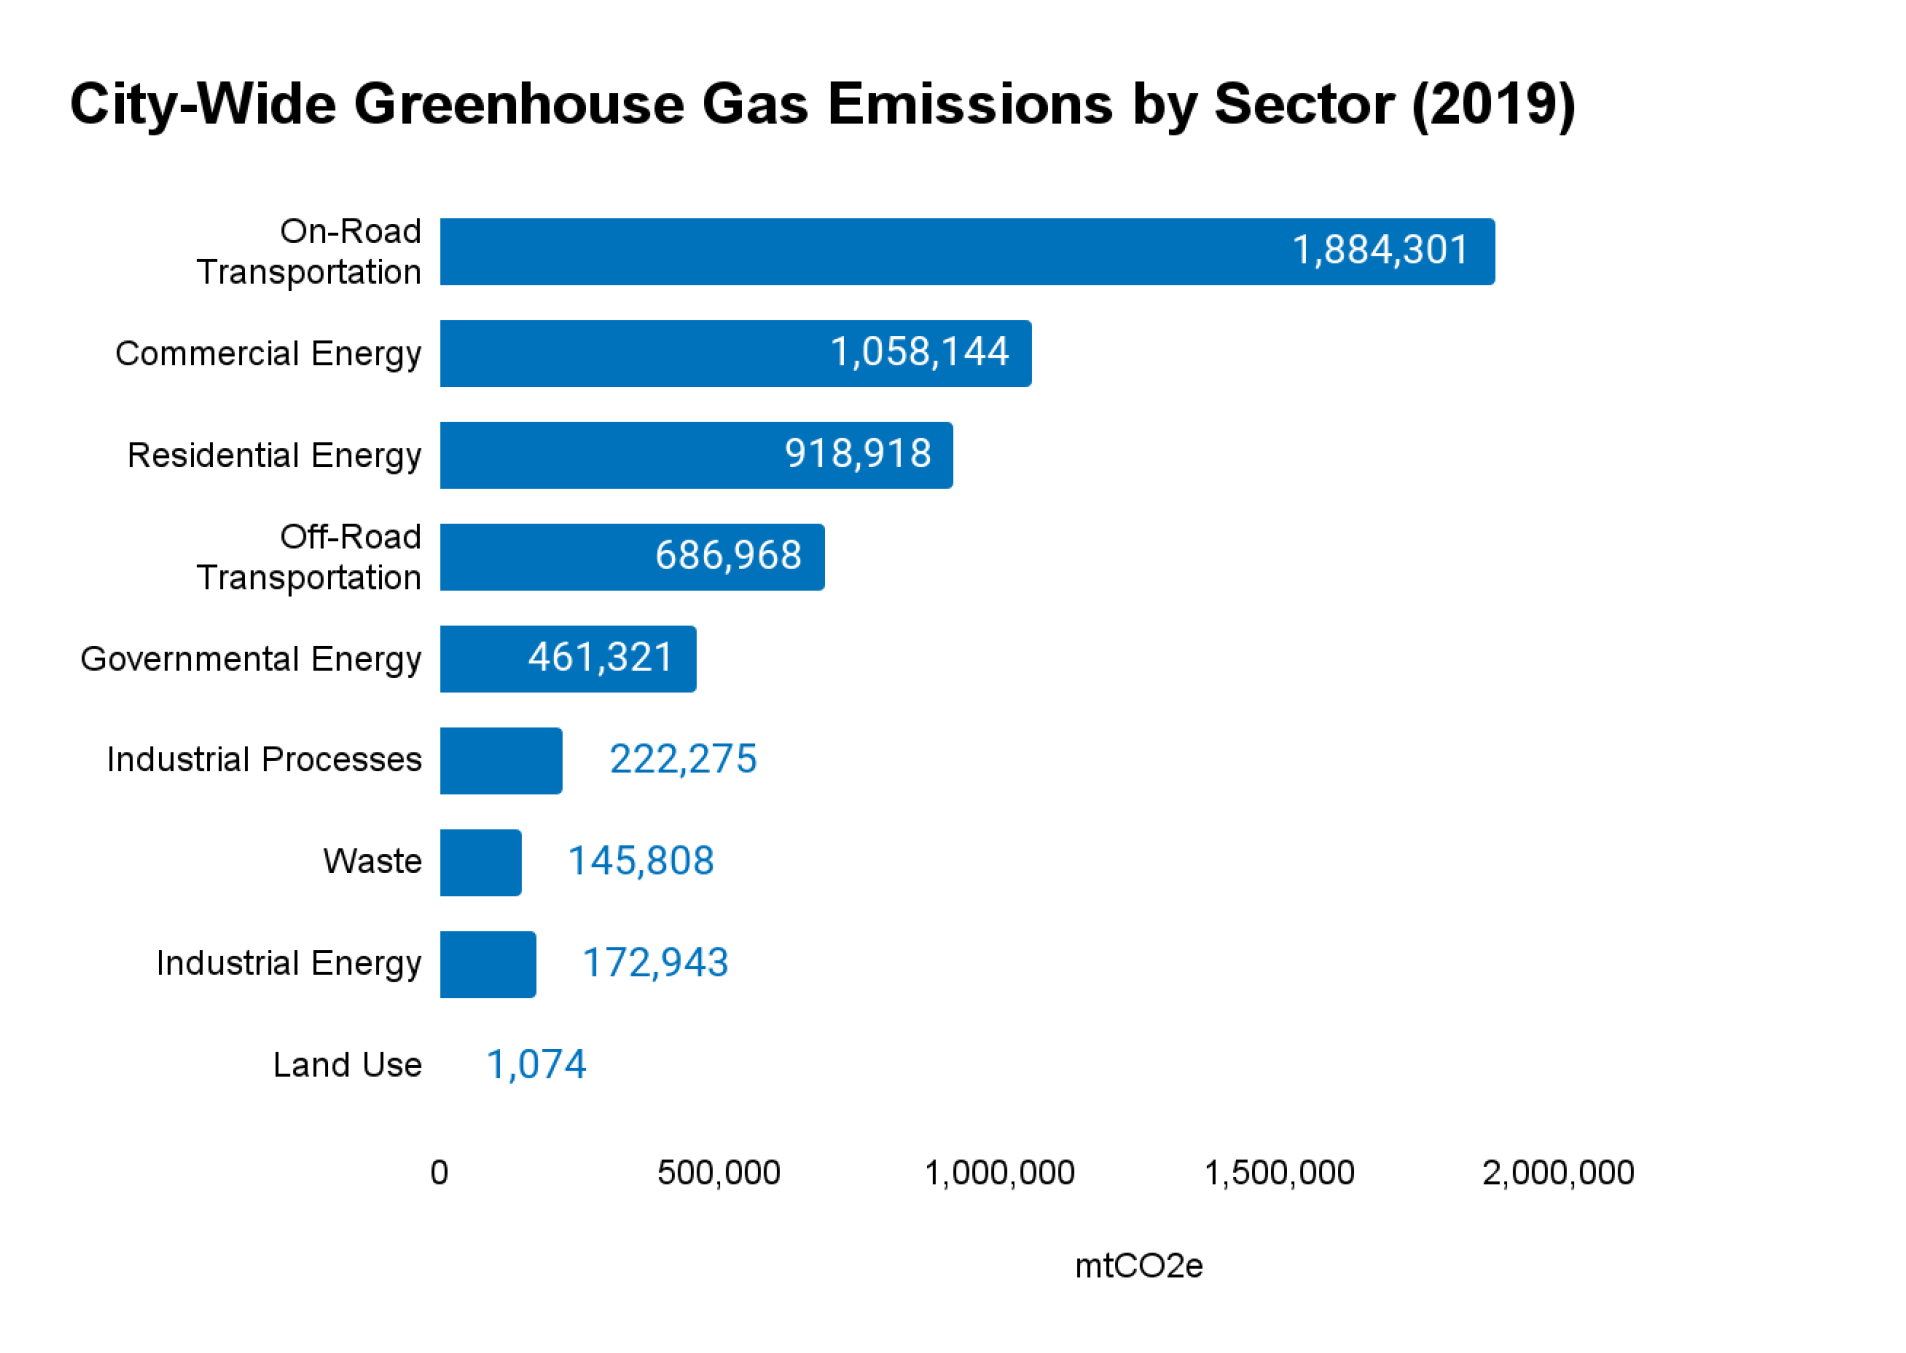
4.1.4 City-Wide Greenhouse Gas Emissions by Gas
As shown in Figure 4-5, the overwhelming greenhouse gas emitted in the City of Tampa is carbon dioxide. This is expected, given that the majority of emissions derive from the burning of fossil fuels that directly emit mostly carbon dioxide with small amounts of methane and nitrous oxide.
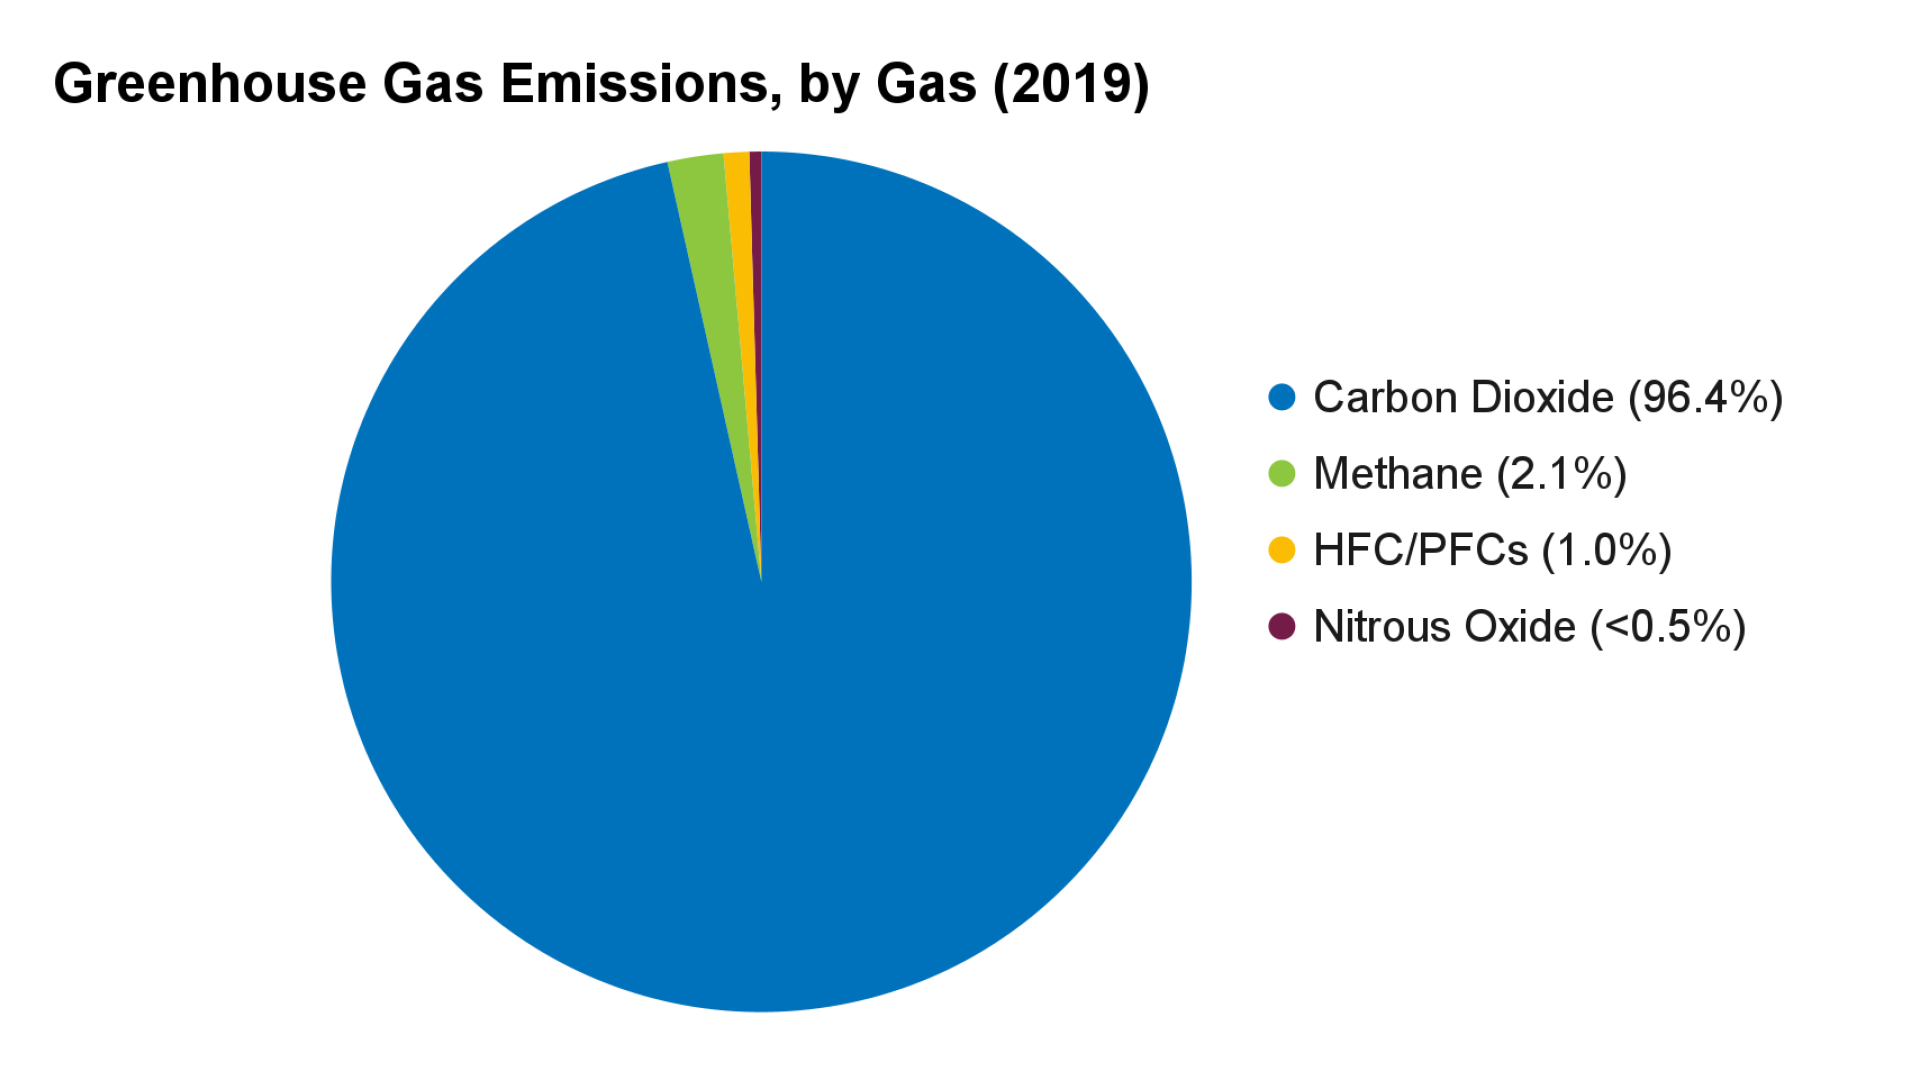
4.1.5 City-Wide Greenhouse Gas Forecast
GHG emission trends from each category were used to project overall GHG emissions to both 2040 and 2050. The City should consider aligning targets with existing policy horizons, like Tampa’s Comprehensive Plan (Imagine 2040) so that GHG emissions could be mainstreamed into all City’s planning efforts. Additionally, projects for 2050 are standard practice in GHG accounting and included below.
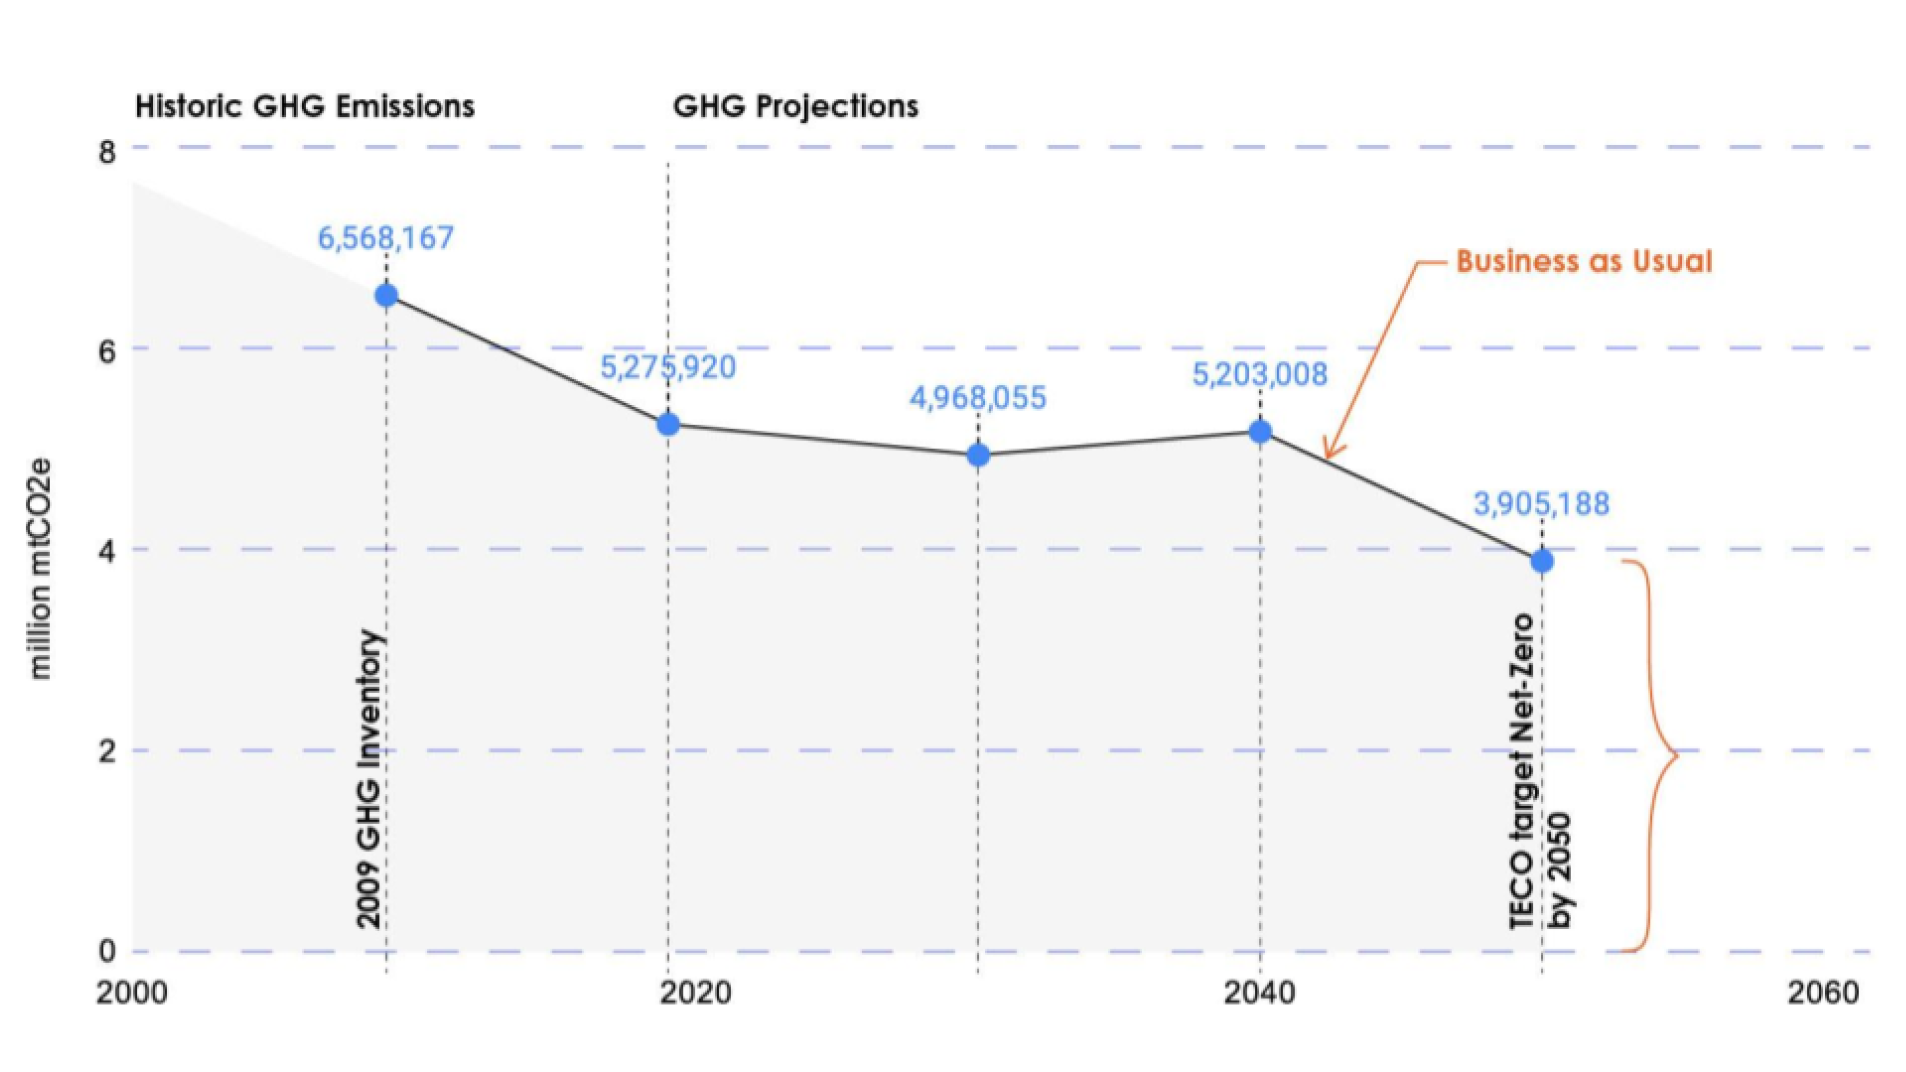
4.1.6 Key Findings: Overall City-Wide Greenhouse Gas Emissions
Net City-wide GHG emissions have decreased from approximately 6.6 to 5.3 million overall due mostly from fuel switching and other improvement projects from the electric utility (TECO). Per capita emissions have reduced from 19 to 13 mtCO2e per person from 2009 to 2019, which is comparable to other local governments in Florida. The Florida per capita emissions was reported exactly at 12.6 for calendar year 2018. Emissions from energy (mostly electrical) and transportation make up 95 percent of total emissions. Solid waste, industrial, and other categories contribute less than 5 percent. By sector, on-road transportation and commercial and residential energy are the largest contributors of GHG emissions. Due to the fact that the majority of emissions are from burning of fossil fuels, carbon dioxide makes up over 96 percent of GHGs emitted in the City. GHG emissions have declined in the last 10 years, but that trend won’t continue with a growing population. Reductions will be seen from the electric utility; however, emissions are expected to rise as more people consume more energy, water, and material goods.
4.2 CITY-WIDE GHG EMISSIONS BY CATEGORY
4.2.1 City-Wide Electricity
4.2.1.1 City-Wide Electricity Consumption
TECO provided electricity consumption data for calendar years 2017, 2018, and 2019, by zip code for all of Hillsborough County. Figure 4-7 compares electricity consumption data from 2009 along with more current years. Activity data for the electricity sub-category is measured in the kilowatt-hour (KWH) and was aggregated annually into the following sectors: residential, commercial, industrial, and public authorities (called “governmental” in this inventory). To account for the zip codes that cross the boundary between City limits and unincorporated Hillsborough County, total electricity consumption in those areas was apportioned by using the percent land in each zip code (see Appendix B for a detailed accounting of both the activity data and GHG emissions for TECO energy). Figure 4-8 presents electricity consumption distribution in Hillsborough County.
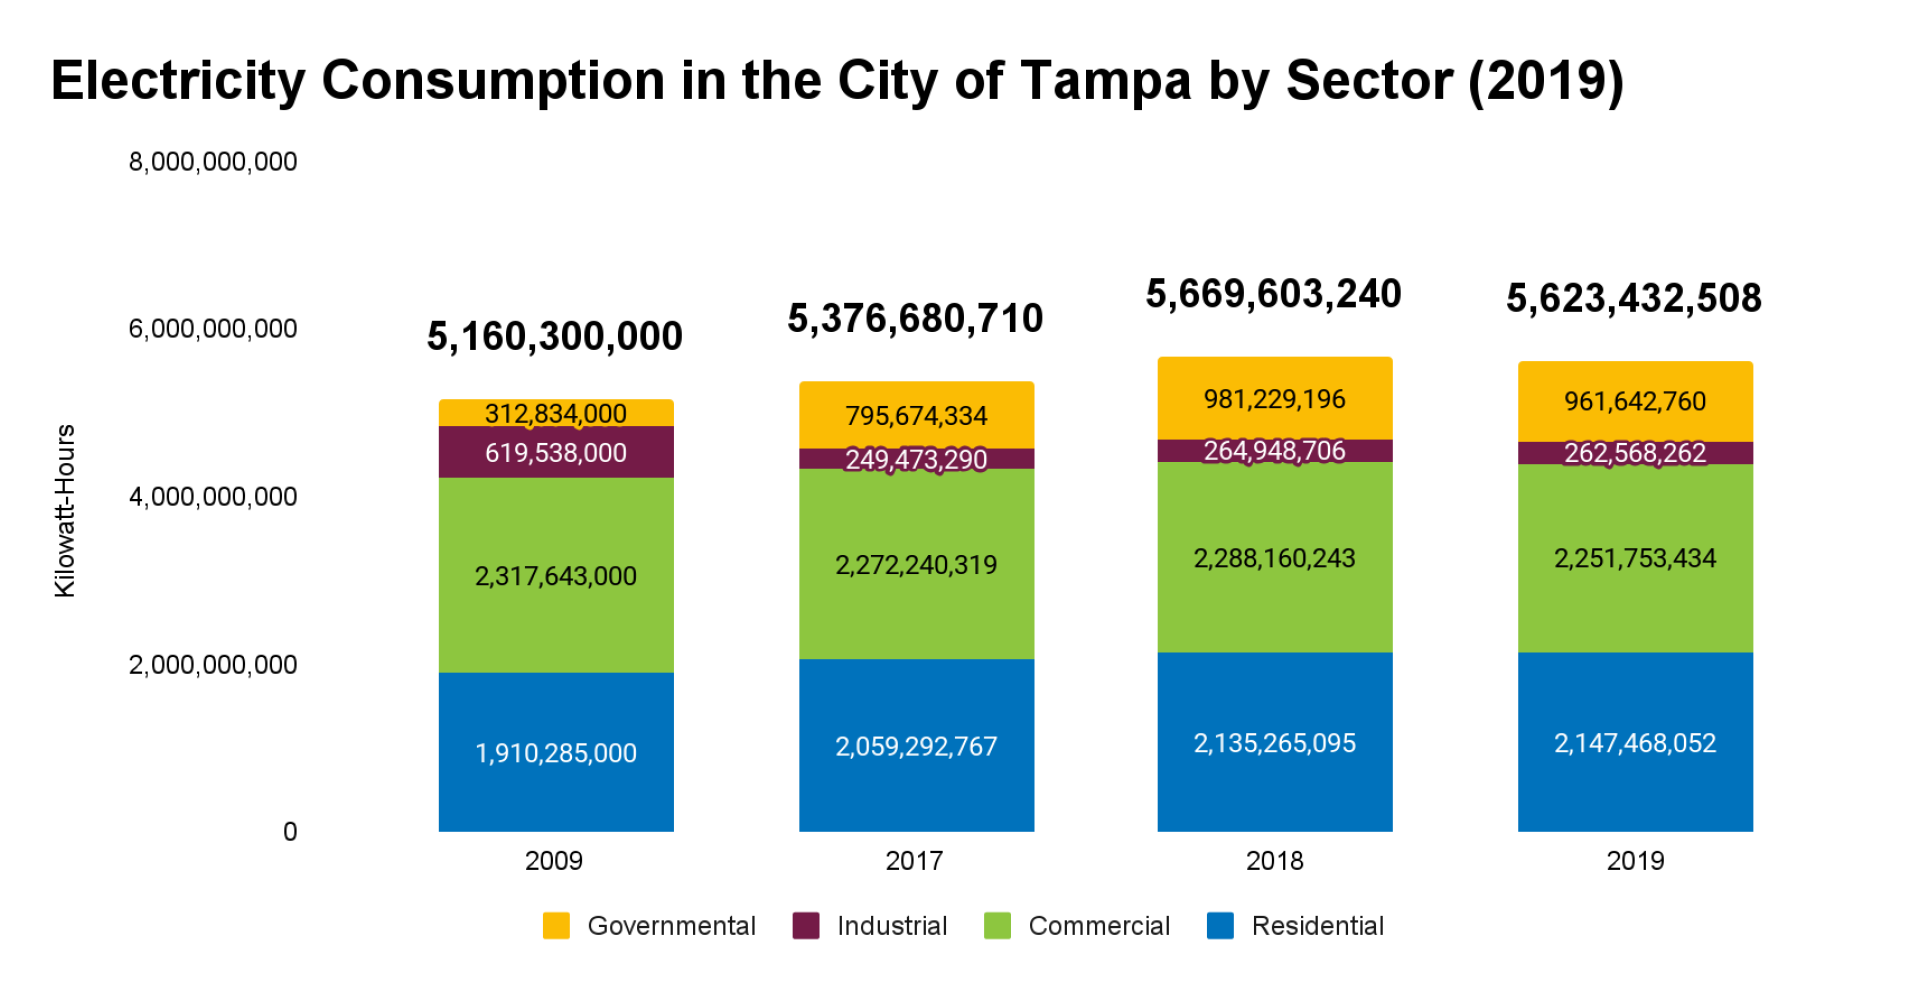
Data Source: TECO Energy
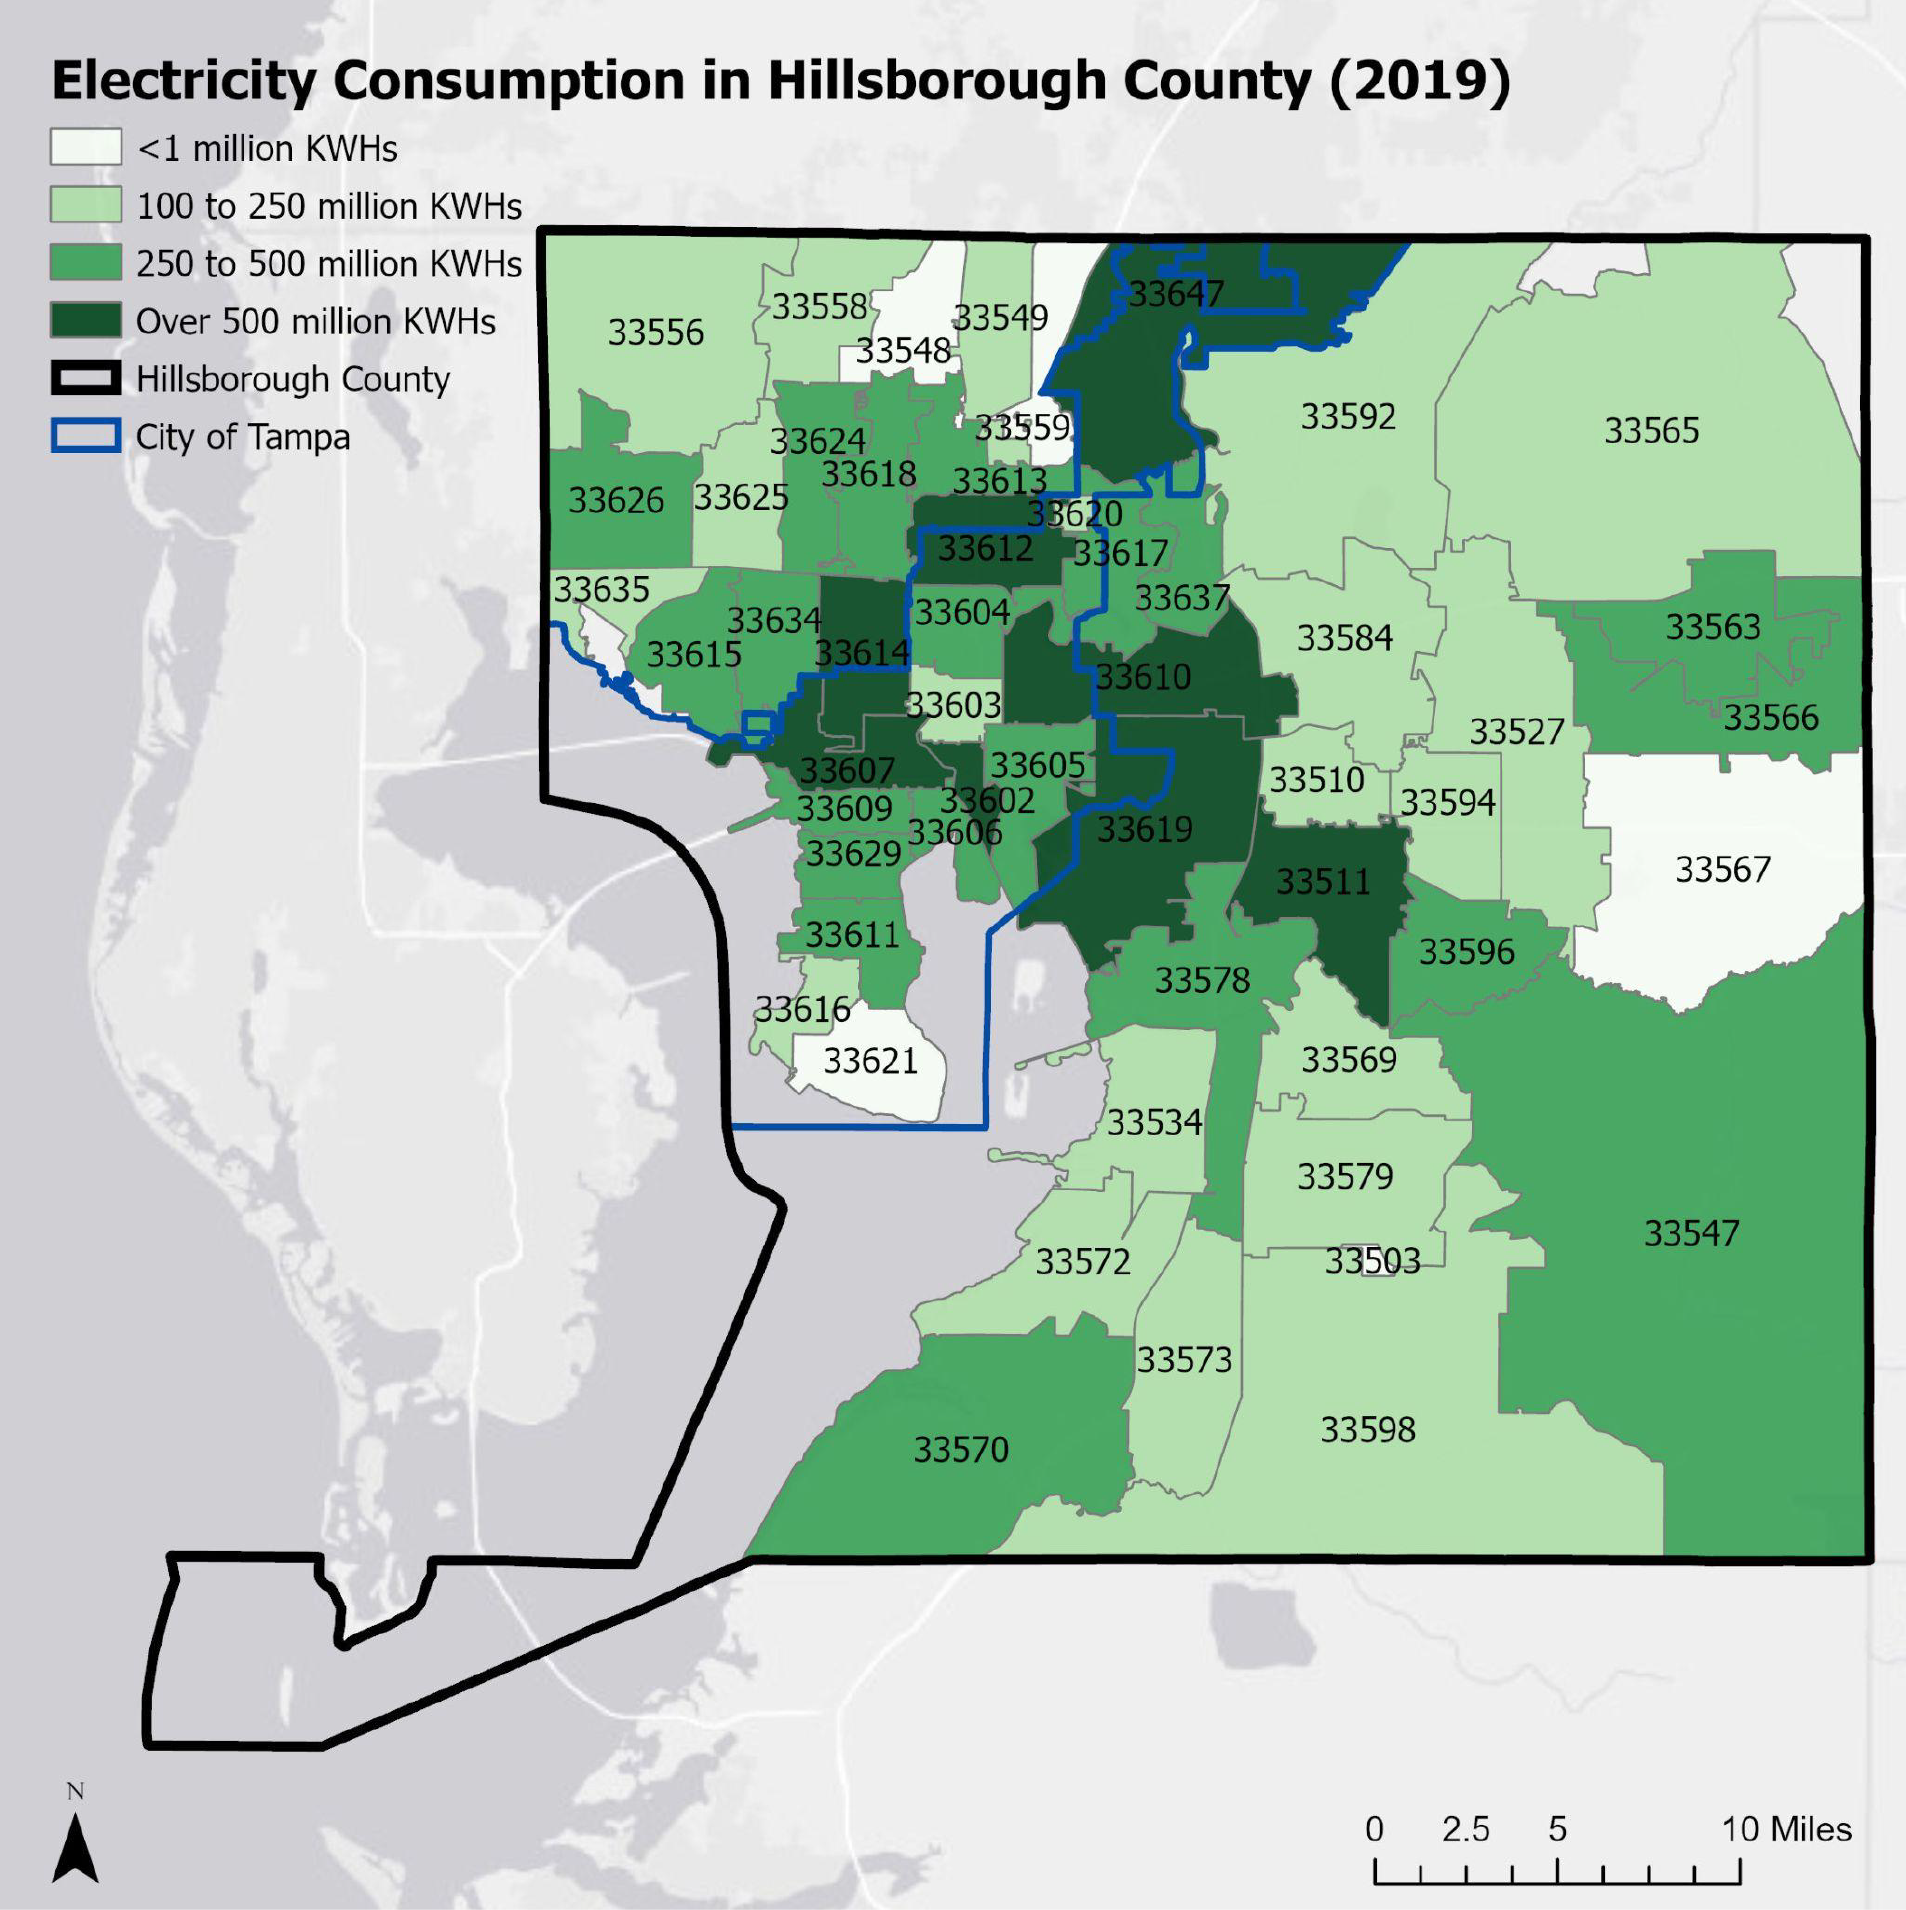
Data Source: zip code data was obtained from TECO Energy for 2017, 2018, and 2019. See Appendix B for an analysis of this data.
GHG emissions were calculated using custom emission factors developed with electricity generation data from each plant and total annual electricity sold (see Appendix B for a detailed methodology). Figure 4-9 shows that while electricity consumption has increased by 3 percent from 2009 to 2019, GHG emissions have decreased by 23 percent over the same time period. This is due to a rapid transition from coal to natural gas (TECO fuel source) starting in 2013.
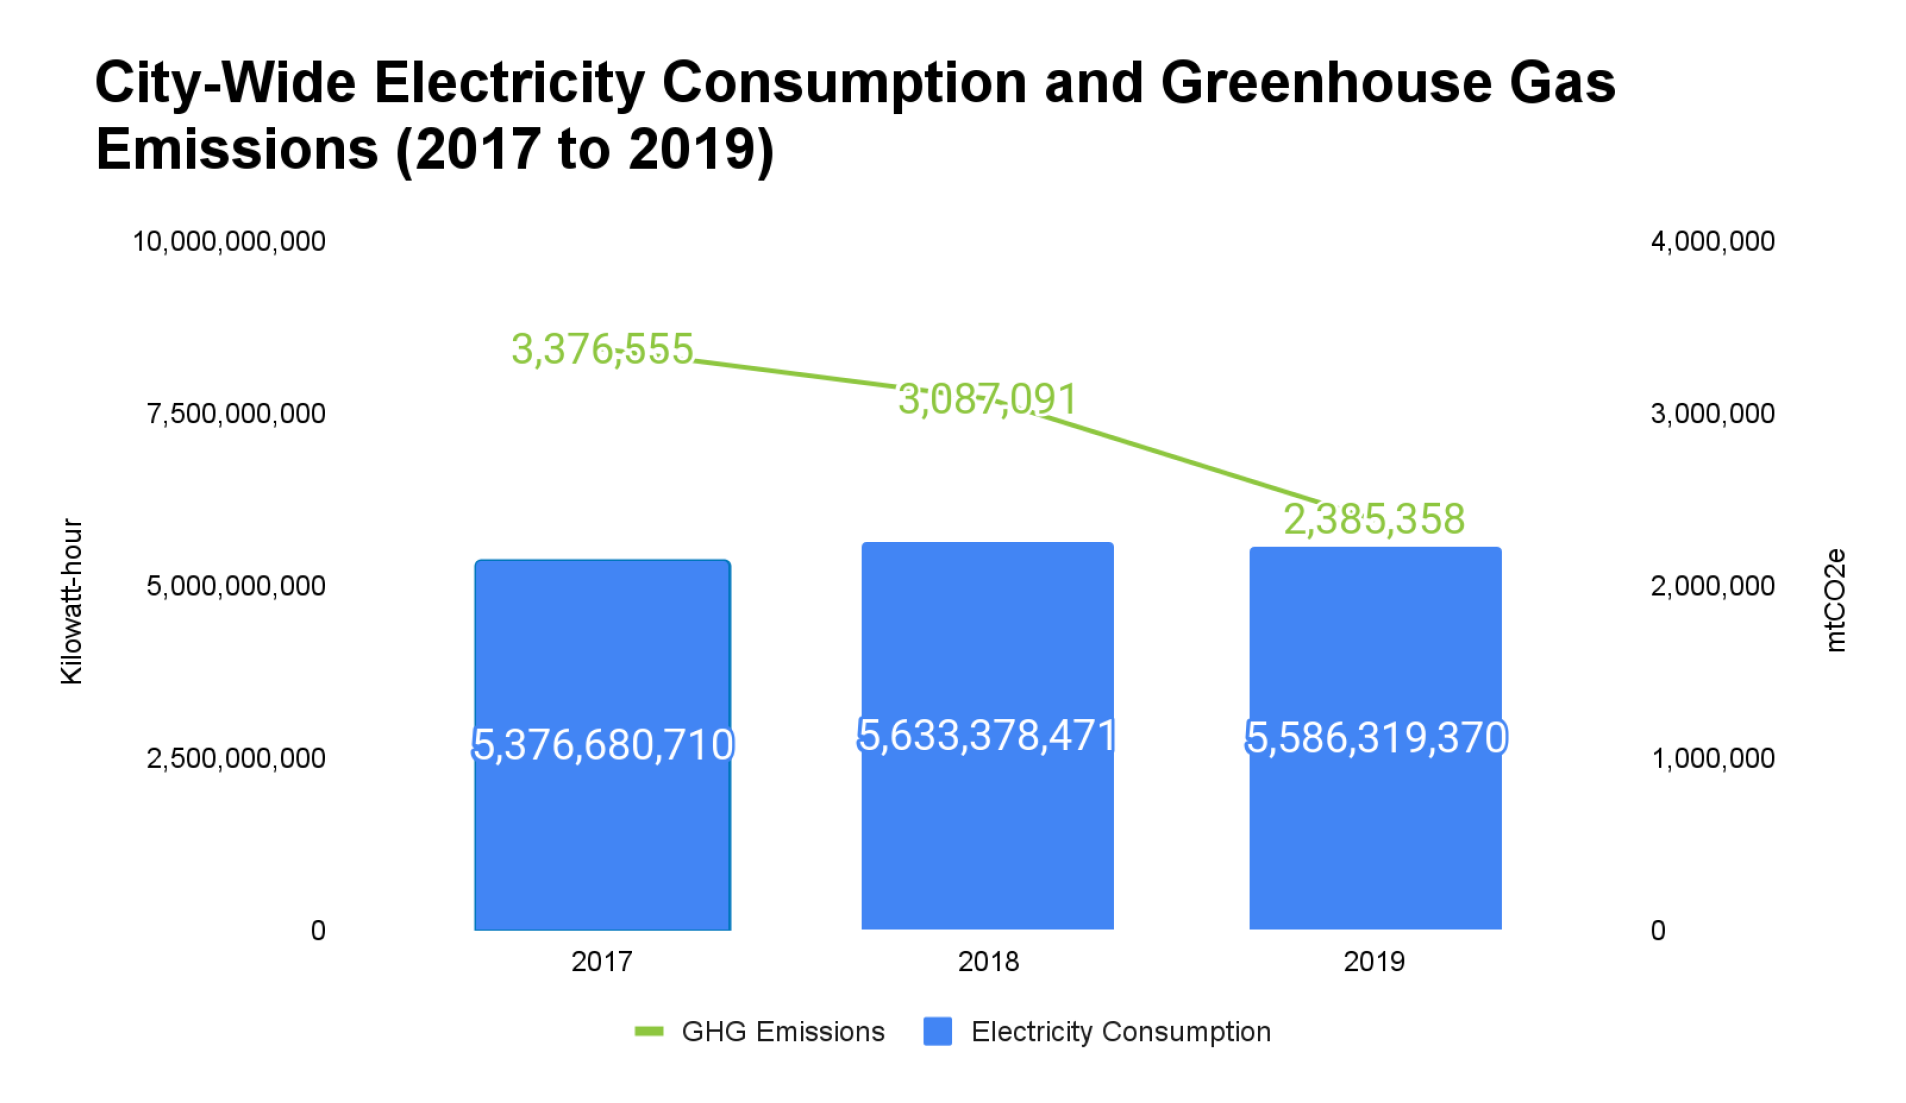
Figure 4-9. City-Wide Electricity Consumption and Greenhouse Gas Emissions (2009 to 2019)
4.2.1.2 City-Wide Electricity from McKay Bay Refuse-to-Energy Facility
As described in the Government GHG Inventory above, the McKay Bay Refuse-to-Energy Facility is owned and operated by the City of Tampa with a total nameplate capacity of 22.1 MegaWatts (MWs). Electricity production and GHG emissions are presented in Section 3.2.1.2. In summary, GHG emissions from the facility increased by 34 percent between 2009 and 2019.
4.2.1.3 City-Wide Electricity from Solar
Rooftop solar data was not available for buildings in the City of Tampa; however, data was available for all of Hillsborough County from customer net metering accounts published by TECO. Hillsborough County solar installations were compiled and GHG emission estimates were calculated using TECO custom emission factors. An estimate of avoided GHG emissions if all qualifying buildings were equipped with solar panels from Google Sunroof’s data. Rooftop solar has increased significantly over the last decade (Figure 4-10).
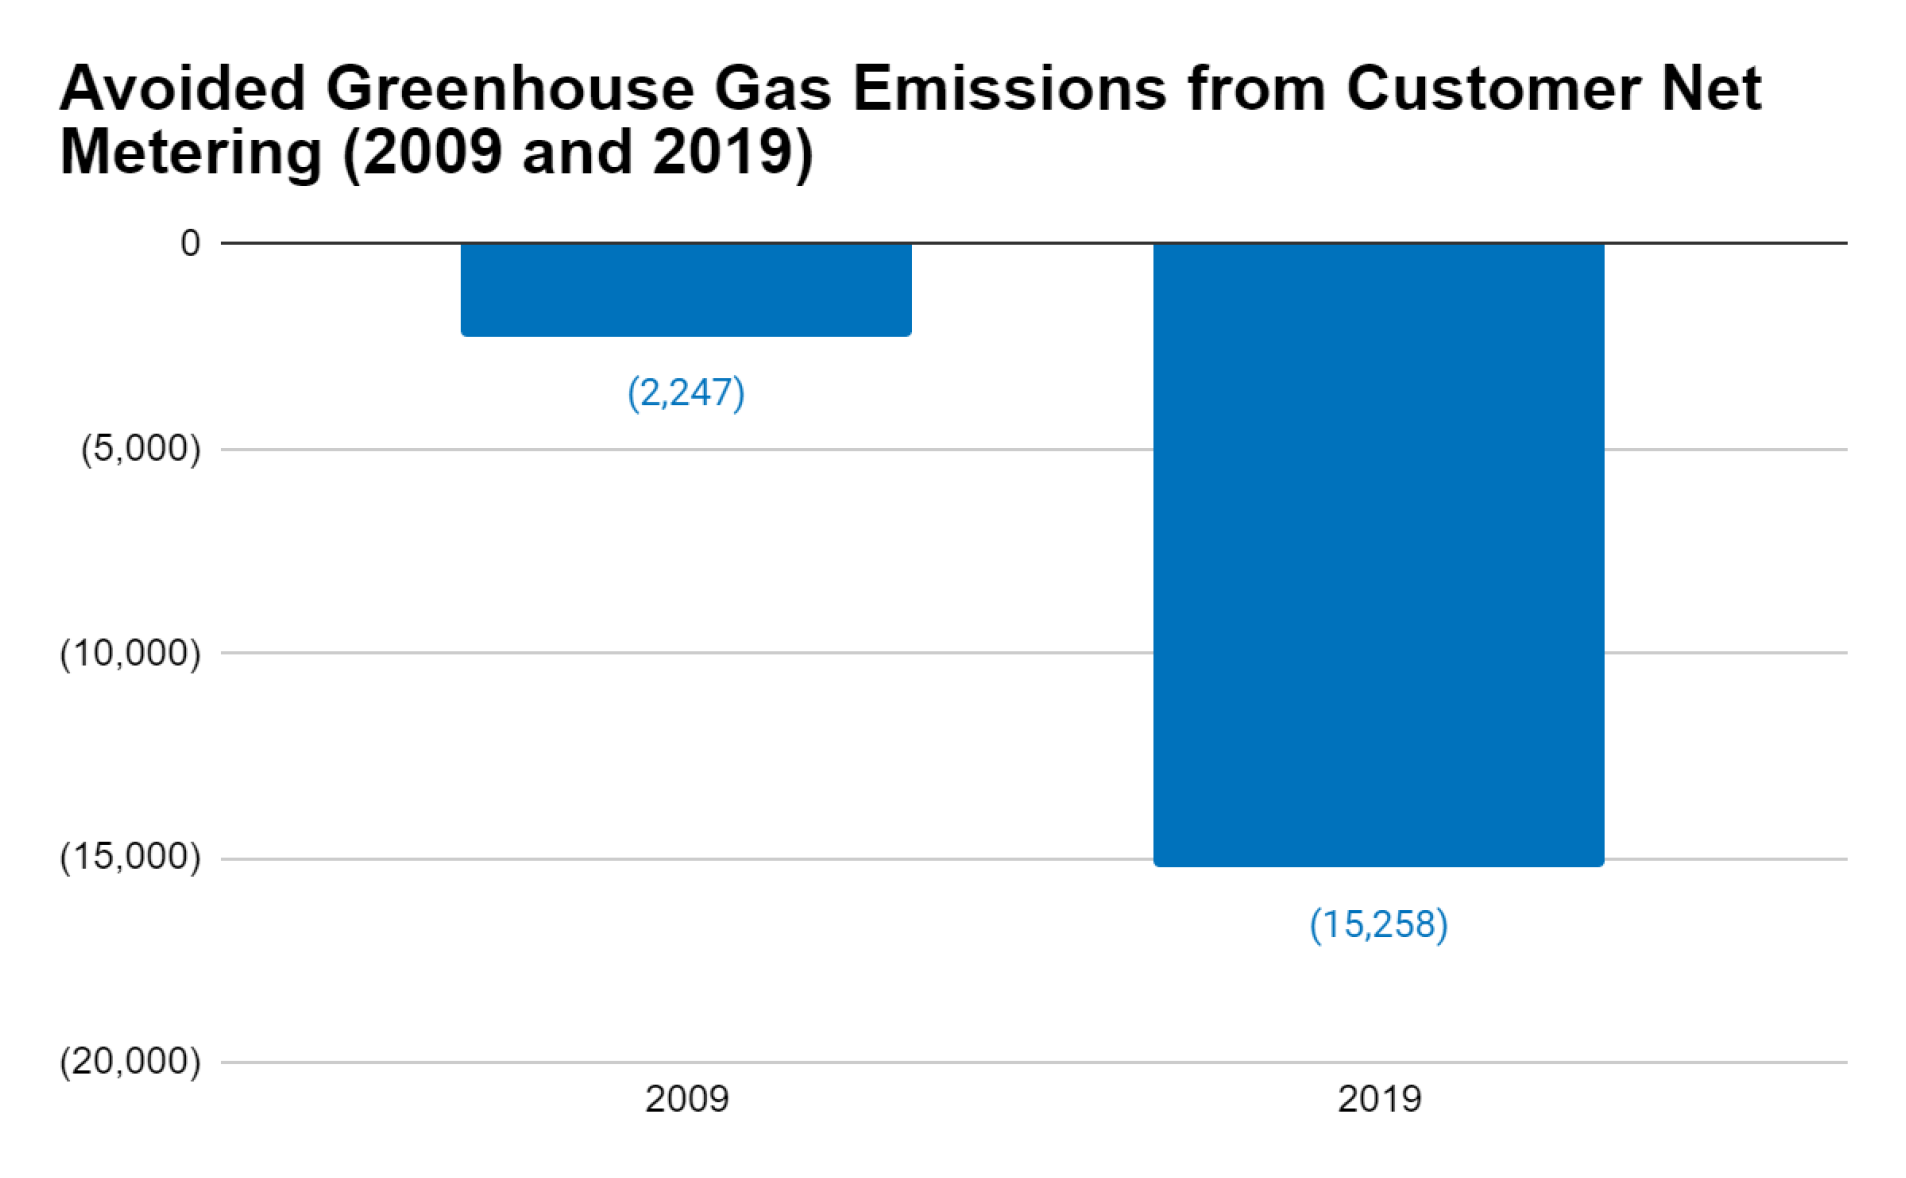
Figure 4-10. Avoided Greenhouse Gas Emissions from Rooftop Solar (2009 and 2019)
4.2.1.4 Key Findings: City-Wide Electricity
Electricity consumption represents 43 percent of City-wide GHG emissions. The commercial sector is the largest consumer of electricity, followed closely by residential, with government and industrial consumption low in comparison. Electricity consumption increased approximately three percent City-wide from 2009 to 2019, while GHG emissions decreased by 23 percent. The City’s population increased 28 percent over the 10 year time period, meaning energy efficiency is increasing overall. Rooftop solar has increased significantly; however, the avoided emissions account for less than 0.01 percent of the electricity consumed in the City.
4.2.2 City-Wide Natural Gas
4.2.2.1 City-Wide Natural Gas Consumption
Natural gas is provided by TECO’s Peoples Gas to residential, commercial, industrial, and governmental customers throughout the City of Tampa. Figure 4-11 shows that the City of Tampa consumes more natural gas than surrounding Hillsborough County. Natural gas consumption data was obtained from the City of Tampa for calendar year 2019. The data is provided in total therms consumed on a monthly basis. Raw activity data, broken into departments, was obtained from the 2009 GHG inventory report.
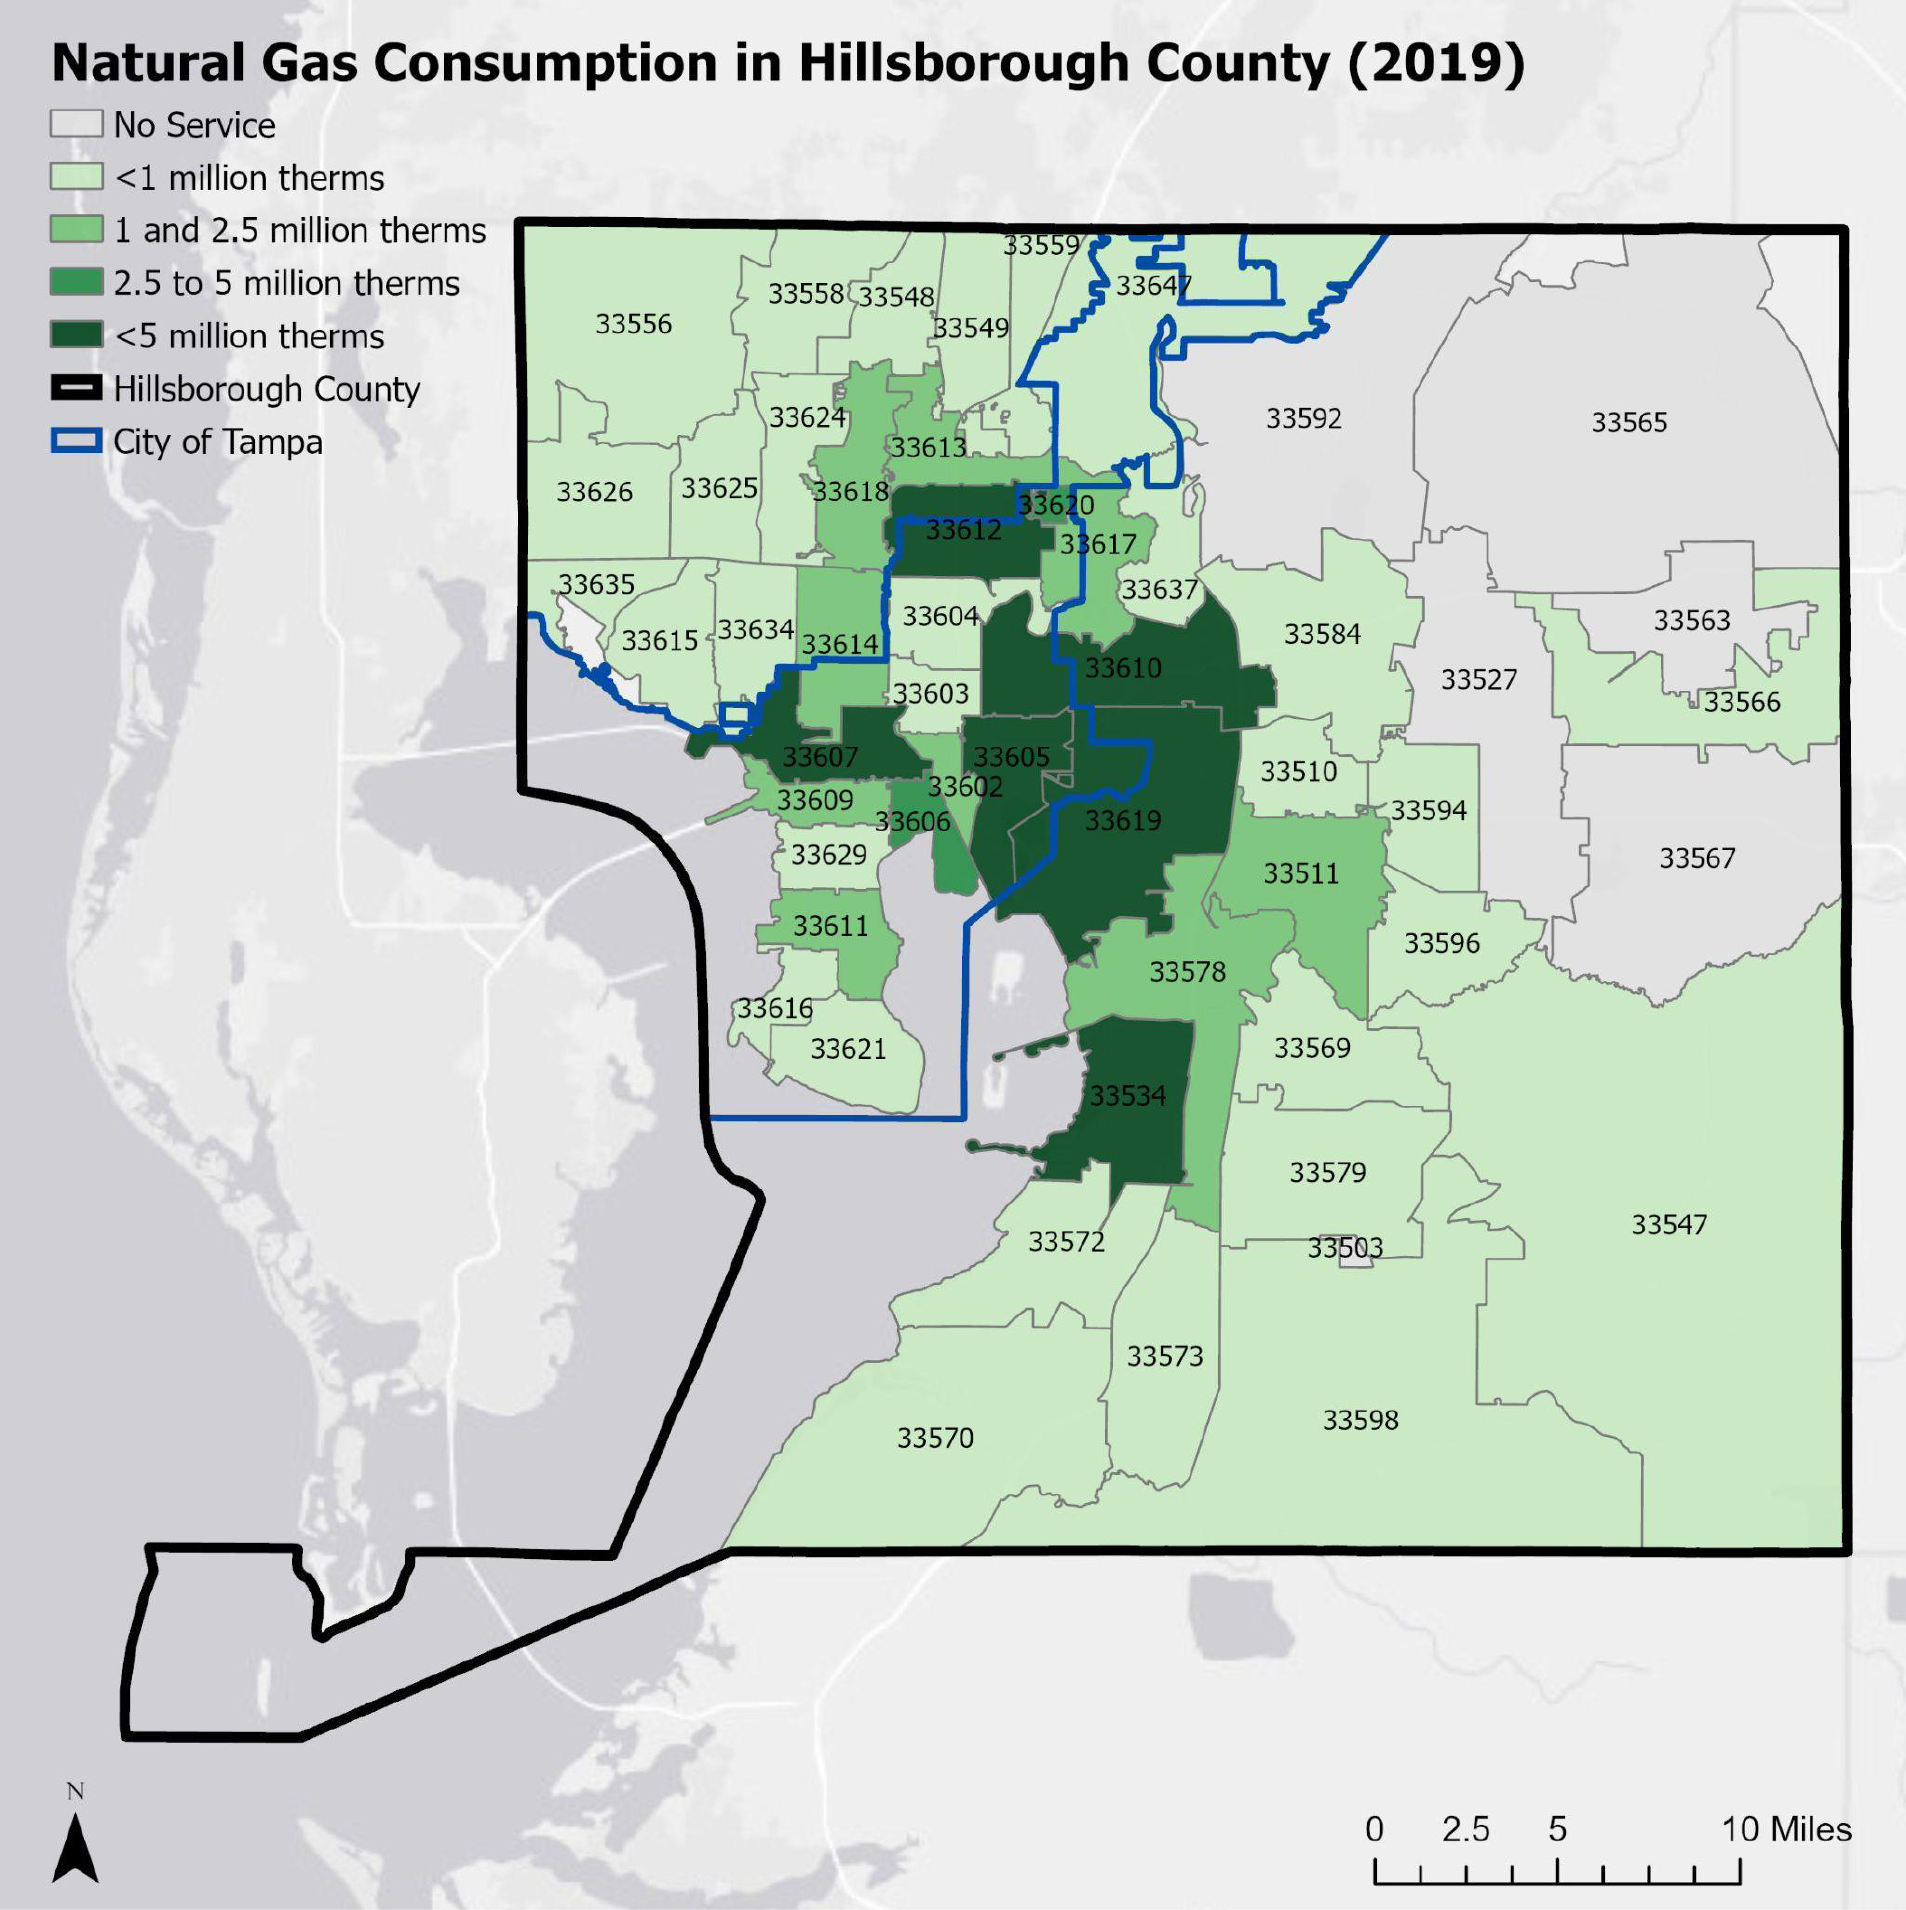
Fugitive methane emissions from natural gas provided by People’s Gas are reported annually in EPA’s Flight Data. Direct GHG emissions are available from 2011 through 2019. People’s Gas reports total fugitive emissions from the entire service area, including accounts outside of City boundaries. Values were scaled by the ratio of consumption in the City versus Hillsborough County (the City consumed 72 percent of natural gas Countywide). These fugitive emissions totaled 28,859 mtCO2e.
Figure 4-12 shows natural gas activity data (therms) and total GHG emissions (combined consumption and fugitive emissions in mtCO2e) from 2009 to 2019. People’s Gas natural gas consumption data is billed using the “therm”, which was converted to a standardized emissions unit (factor 0.005311 mtCO2e/therm). Zip code natural gas data was split using the same land use area proportions presented in the Methods: electricity consumption sub-category above.
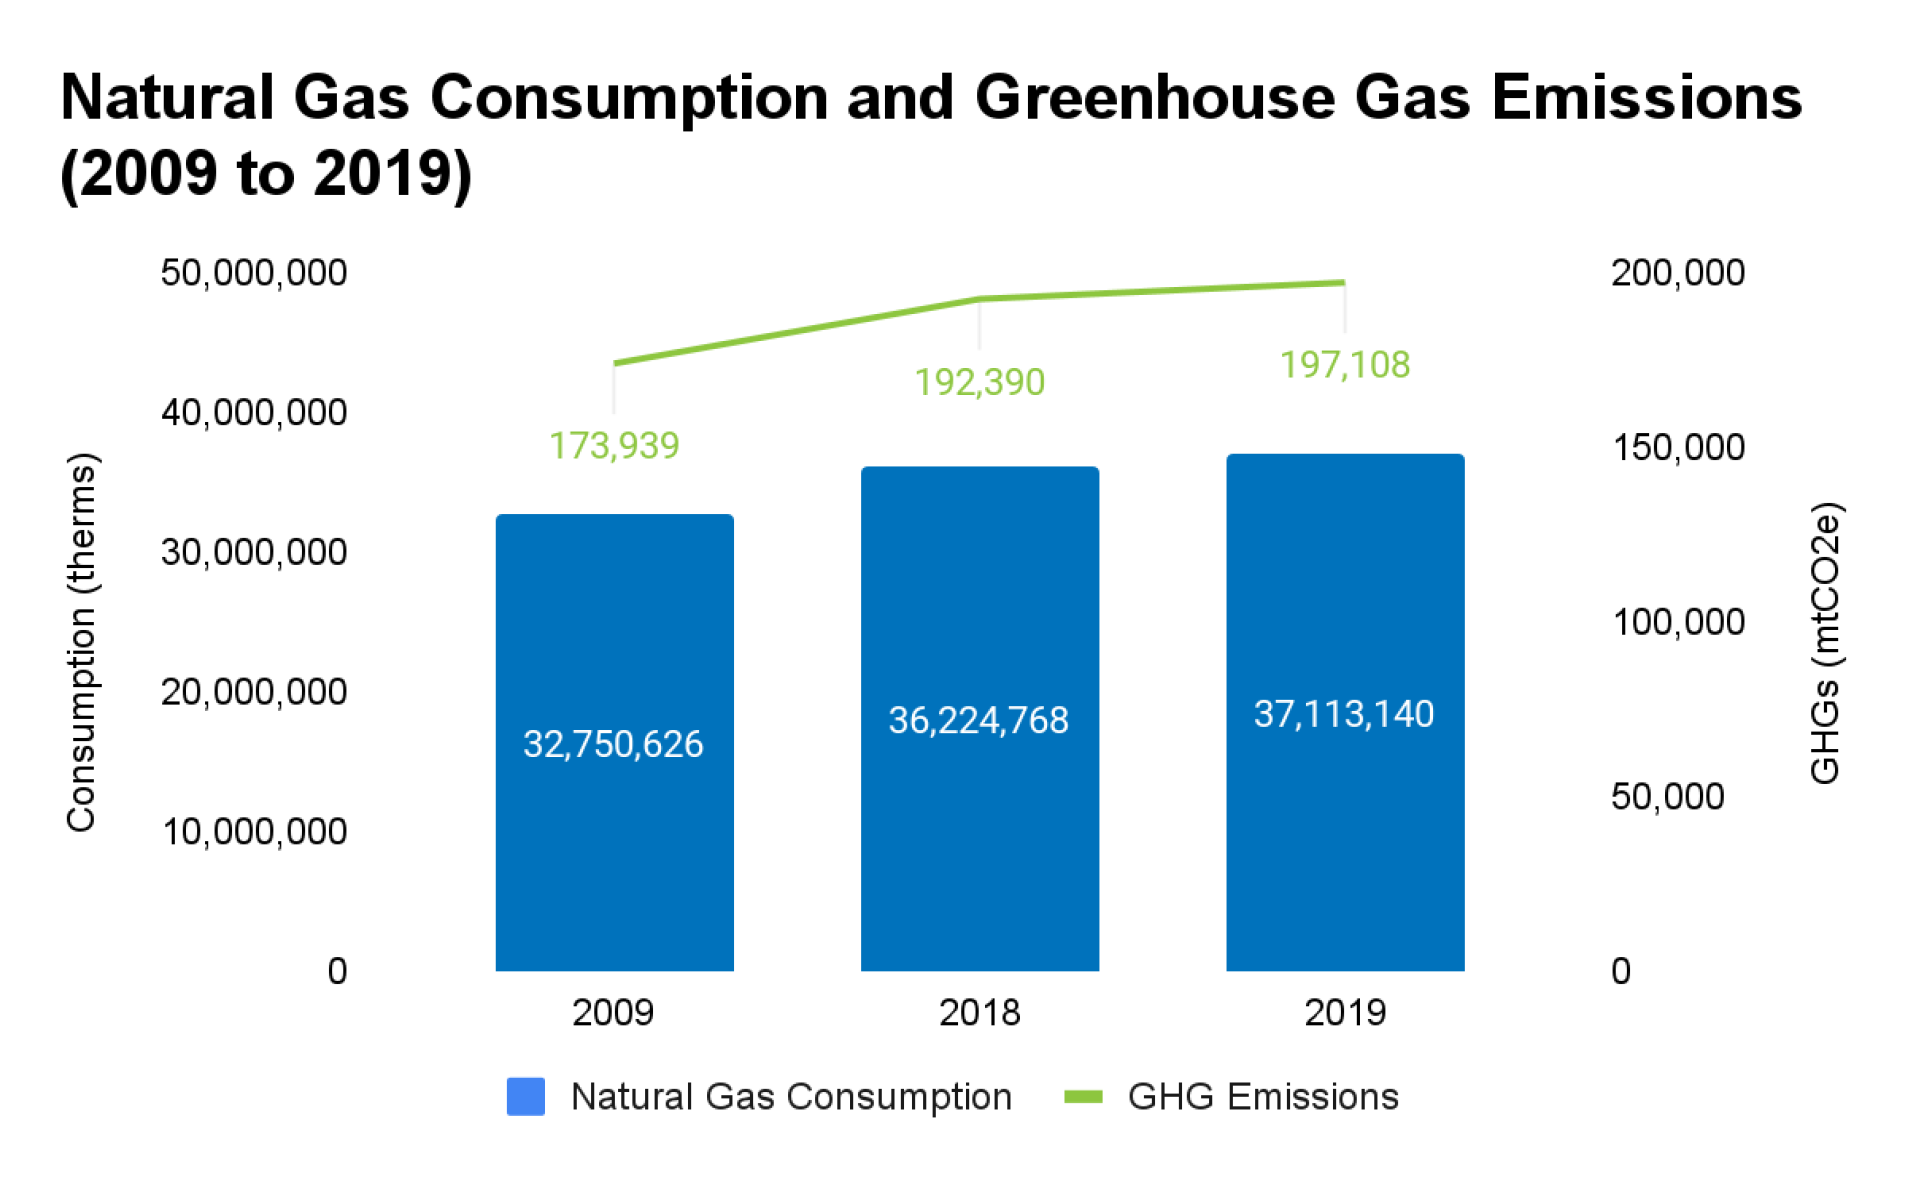
4.2.2.3 Key Findings: City-Wide Natural Gas
Natural gas is the primary energy source in power plants in 2019. Electricity generation demonstrated a sizable shift in GHG emissions, as is demonstrated by the shift from coal (2009) to natural gas (2019). These emissions are accounted for above in Section 4.2.1. Natural gas supplied to residential, commercial, industrial, and governmental customers is low in comparison to energy provided by electricity production; GHG emissions from these natural gas hookups plus fugitive emissions from natural gas leaks represent less than 0.5 percent.
4.2.3 City-Wide Transportation
This section details City-wide GHG emissions for the transportation sector. Per the GHG Protocol, transportation categories include on-road, off-road, marine, air, and rail transportation. From 2009 to 2019, GHG emissions from transportation increased approximately 20 percent as shown on Figure 4-13.
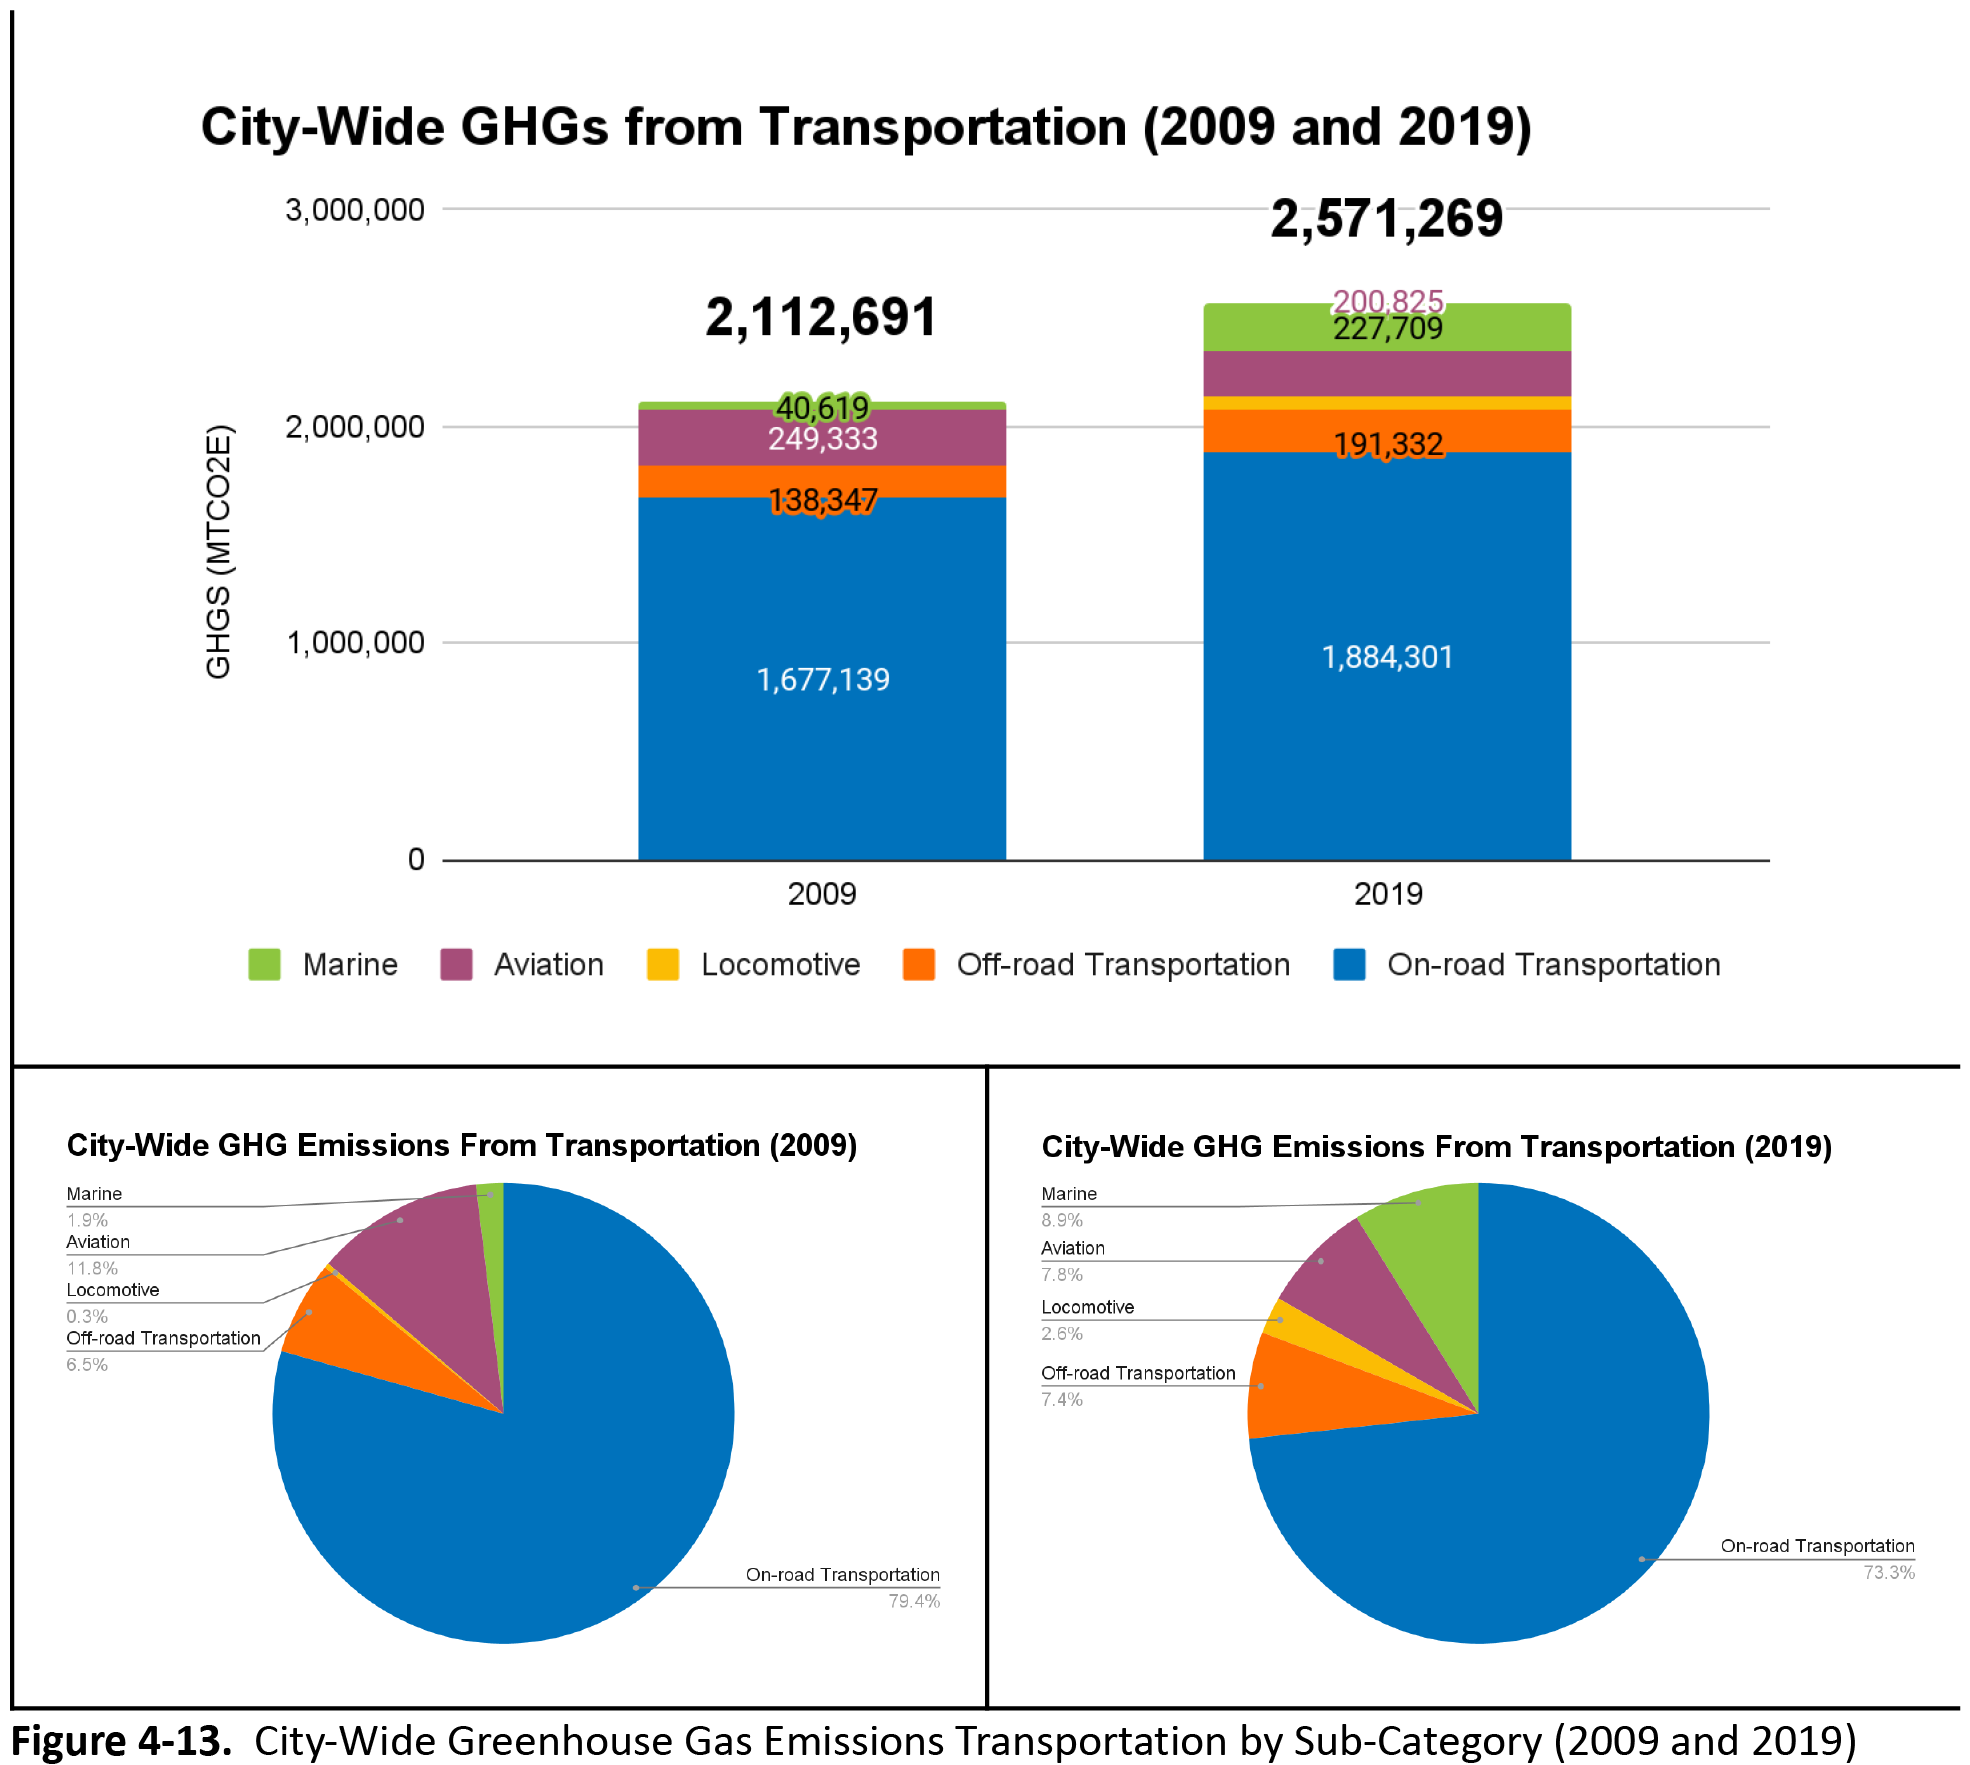
4.2.3.1 City-Wide On-Road Transportation
The City of Tampa has approximately 2,800 lane miles of roads, approximately 28 percent of all Hillsborough County roads14 (Figure 4-14). GHG emissions from on-road transportation originate from the burning of motor fuel (gasoline, diesel, and natural gas). Emissions from electric vehicles depend on the power source that charges the vehicles (i.e., energy from the grid/regional producer using fossil fuels vs solar panel array).
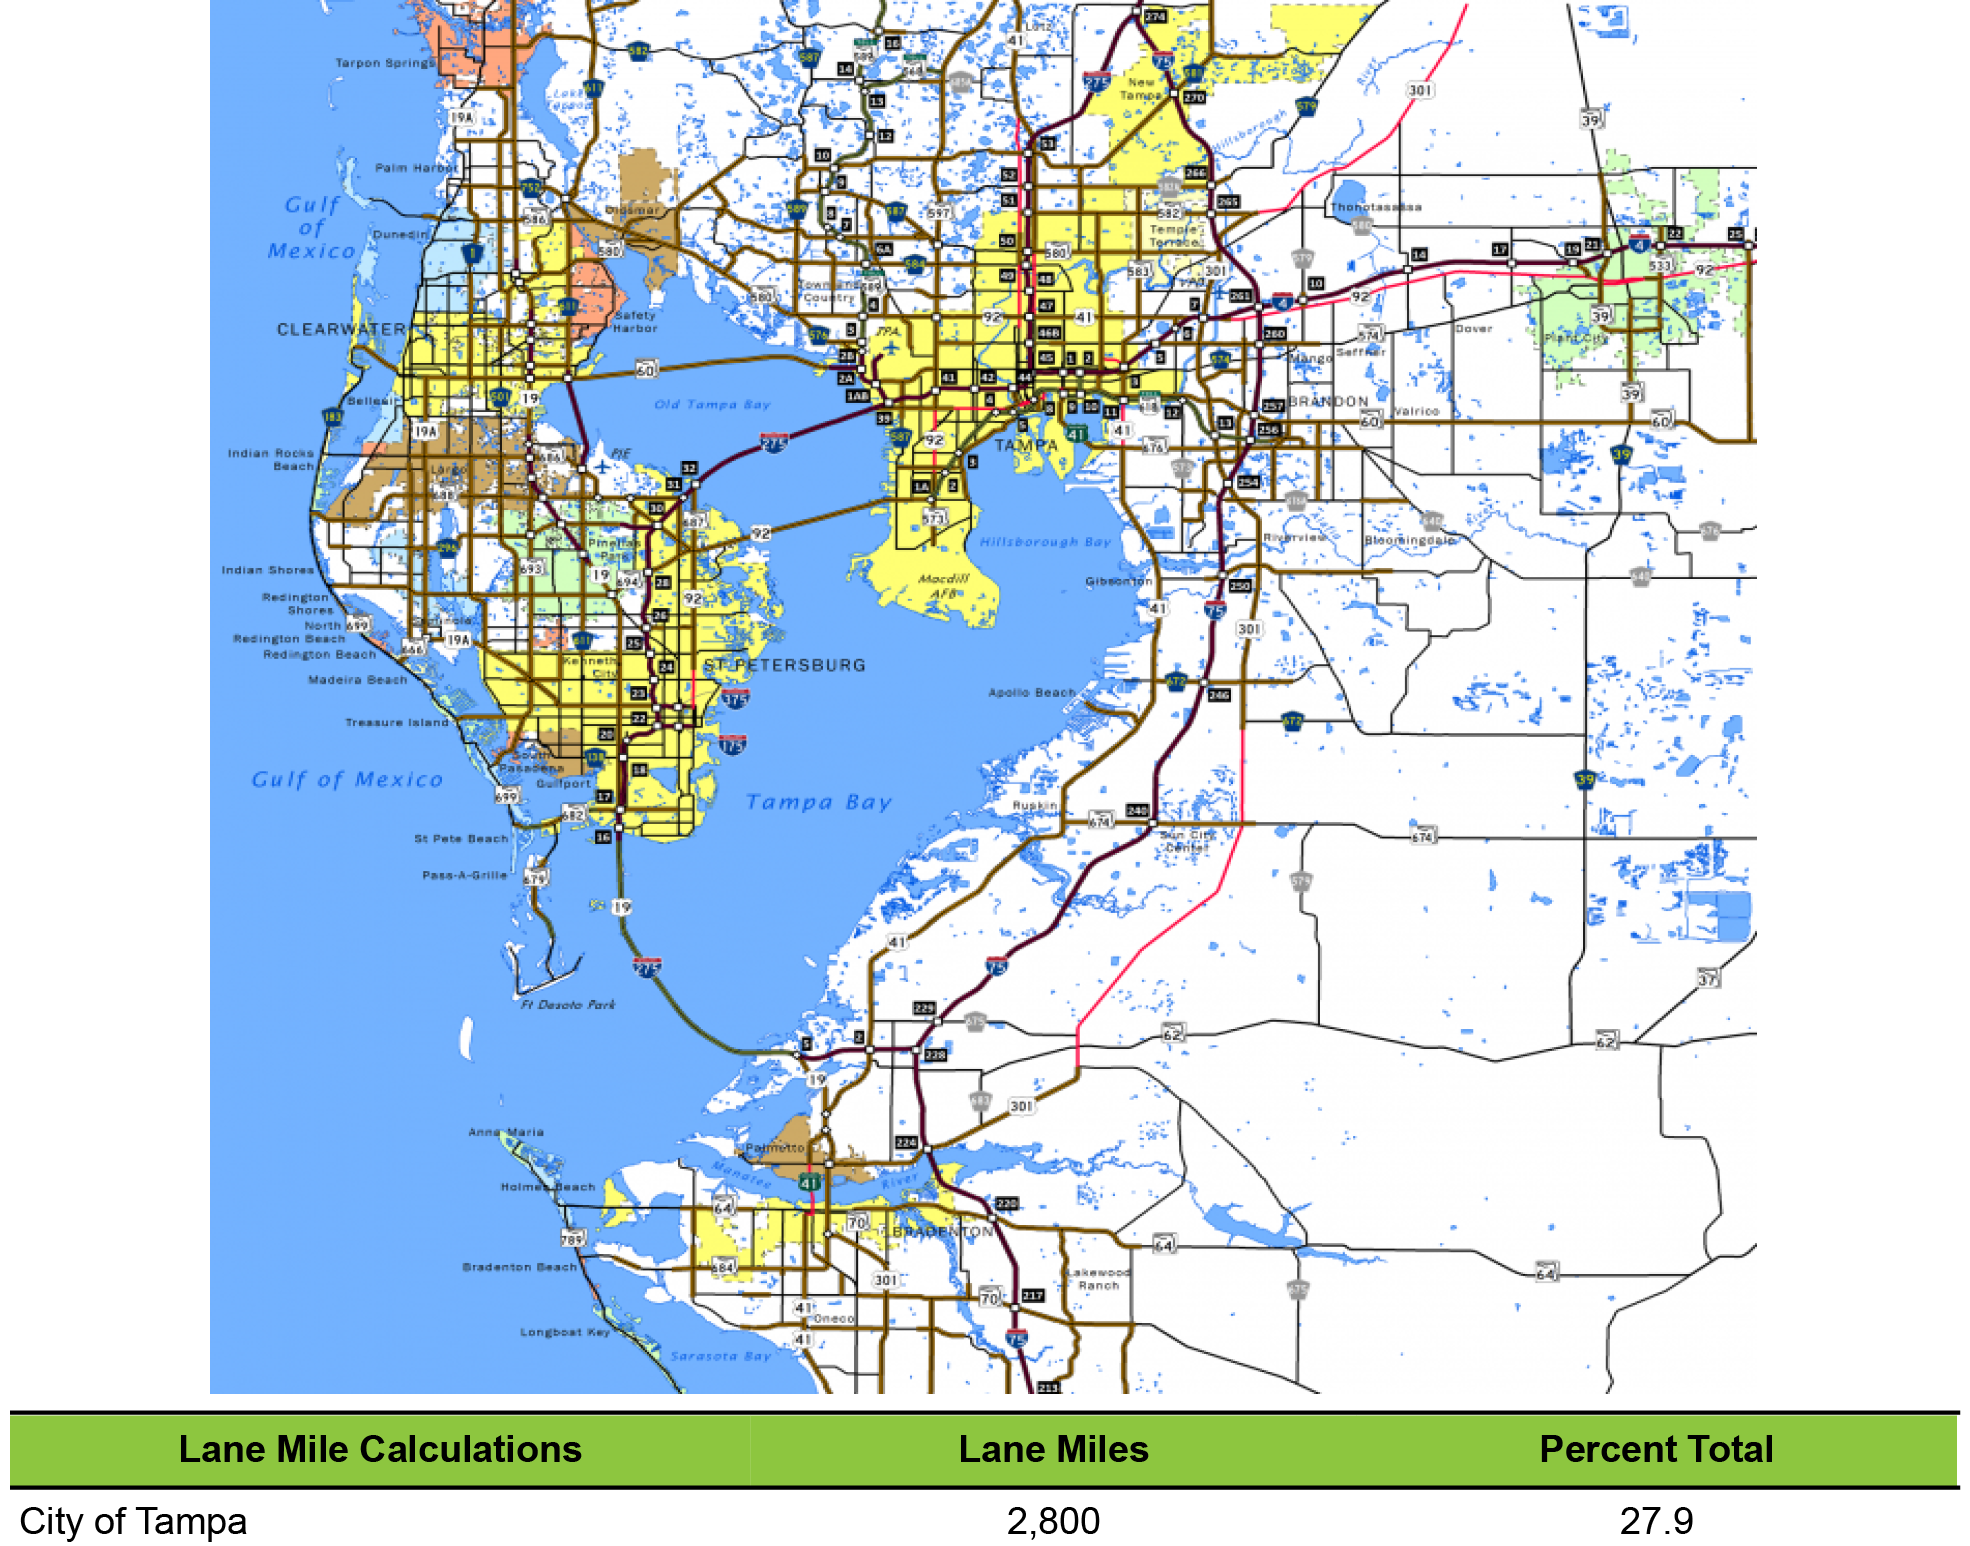
| Jurisdiction | Lane Miles | Percent Total |
|---|---|---|
| Hillsborough County | 6,920 | 69.0 |
| Plant City | 150 | 1.5 |
| Temple Terrace | 165 | 1.6 |
| Total Lane Miles | 10,035 | 100.0 |
Data source: Hillsborough County State of the Roads Report, 2016, available at .
14 From Hillsborough County State of the Roads Report, 2016, available at . The 2018 report did not contain data on lane miles.
Fuel and VMT data is not available by the type of vehicular activity (i.e., buses, passenger cars, trucks/SUVs, tractor trailers, etc.). GHG emissions from vehicles depend on two factors: the fuel efficiency of the vehicle and the total miles driven. GHG emissions from on-road vehicles are estimated in two different ways. Vehicle miles traveled (VMT) at the County level is used as a proxy to CH4 and N2O emissions from the combustion of fossil fuels. VMTs are converted to gallons burned, then to GHG emissions by using emission factors that are published in the GHG Protocol. Secondly, the total gallons of fuel (gasoline and diesel) purchased within the County is used to calculate CO2 emissions, using emission factors that are published in the GHG Protocol. On-road transportation is complicated by flow-through traffic and daily commuters from outside the City boundaries. Figure 4-15 shows that GHG emissions from on-road transportation have increased by 12.4 percent from 2009 to 2011 and gasoline is the dominant energy source for transportation.
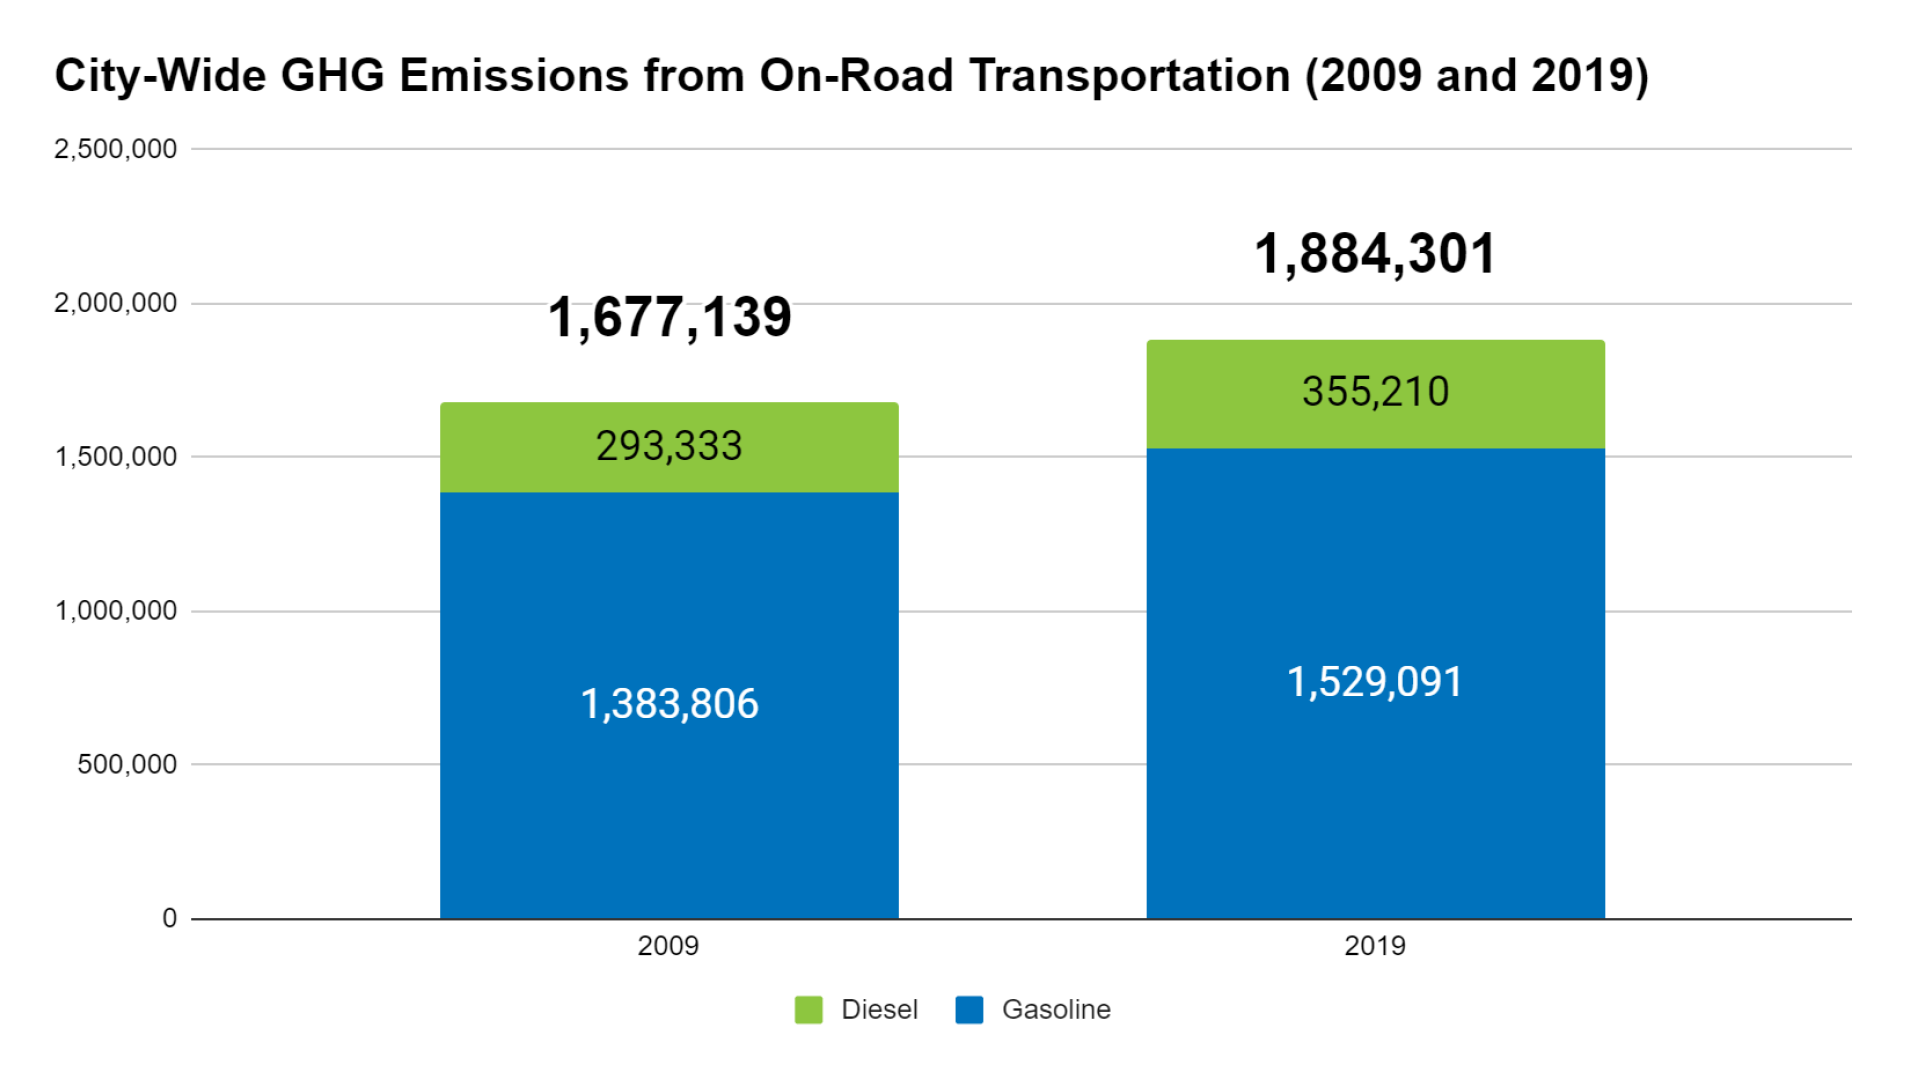
Data Source: Annual fuel sales for Hillsborough County were scaled using the number of lane miles.
4.2.3.2 City-Wide Off-Road Transportation
Off-road vehicles include tractors, landscaping equipment, and all-terrain vehicles. GHG emissions from off-road vehicles were estimated by using a population scaled emission factor and estimated statewide GHG emissions from the SIT model, assuming that off-road activity is roughly equal statewide. These estimates are included in Figure 4-16.
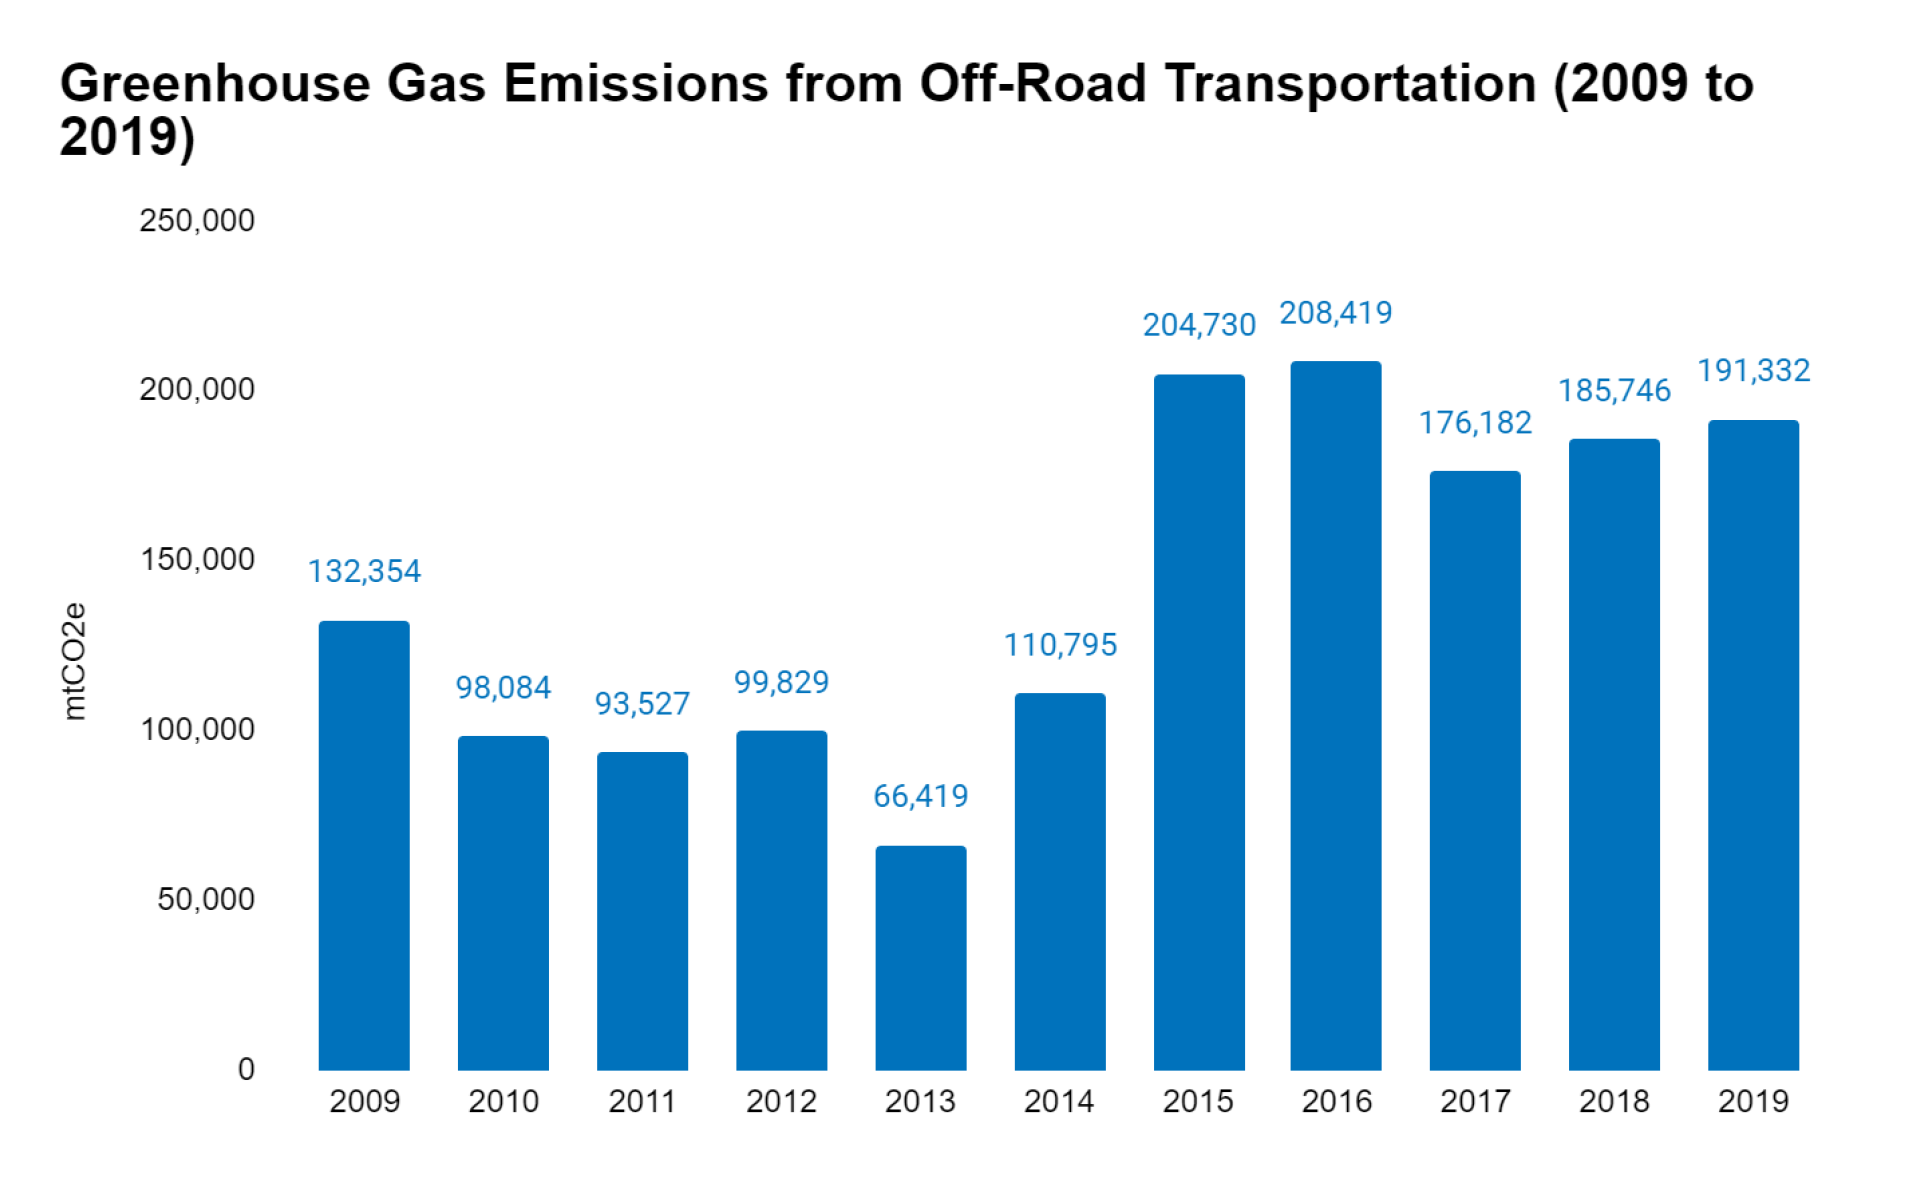
4.2.3.3 City-Wide Marine Transportation
In the City of Tampa, approximately 83 percent of marine vessels are permitted as recreational. The remaining are commercial fishing, freight barges, and passenger vehicles for the water-taxis. GHG emissions from marine transportation were estimated by using a population scaled emission factor and calculated statewide GHG emissions from the SIT model, assuming that marine activity is roughly equal across the state. These estimates are included in Figure 4-17.
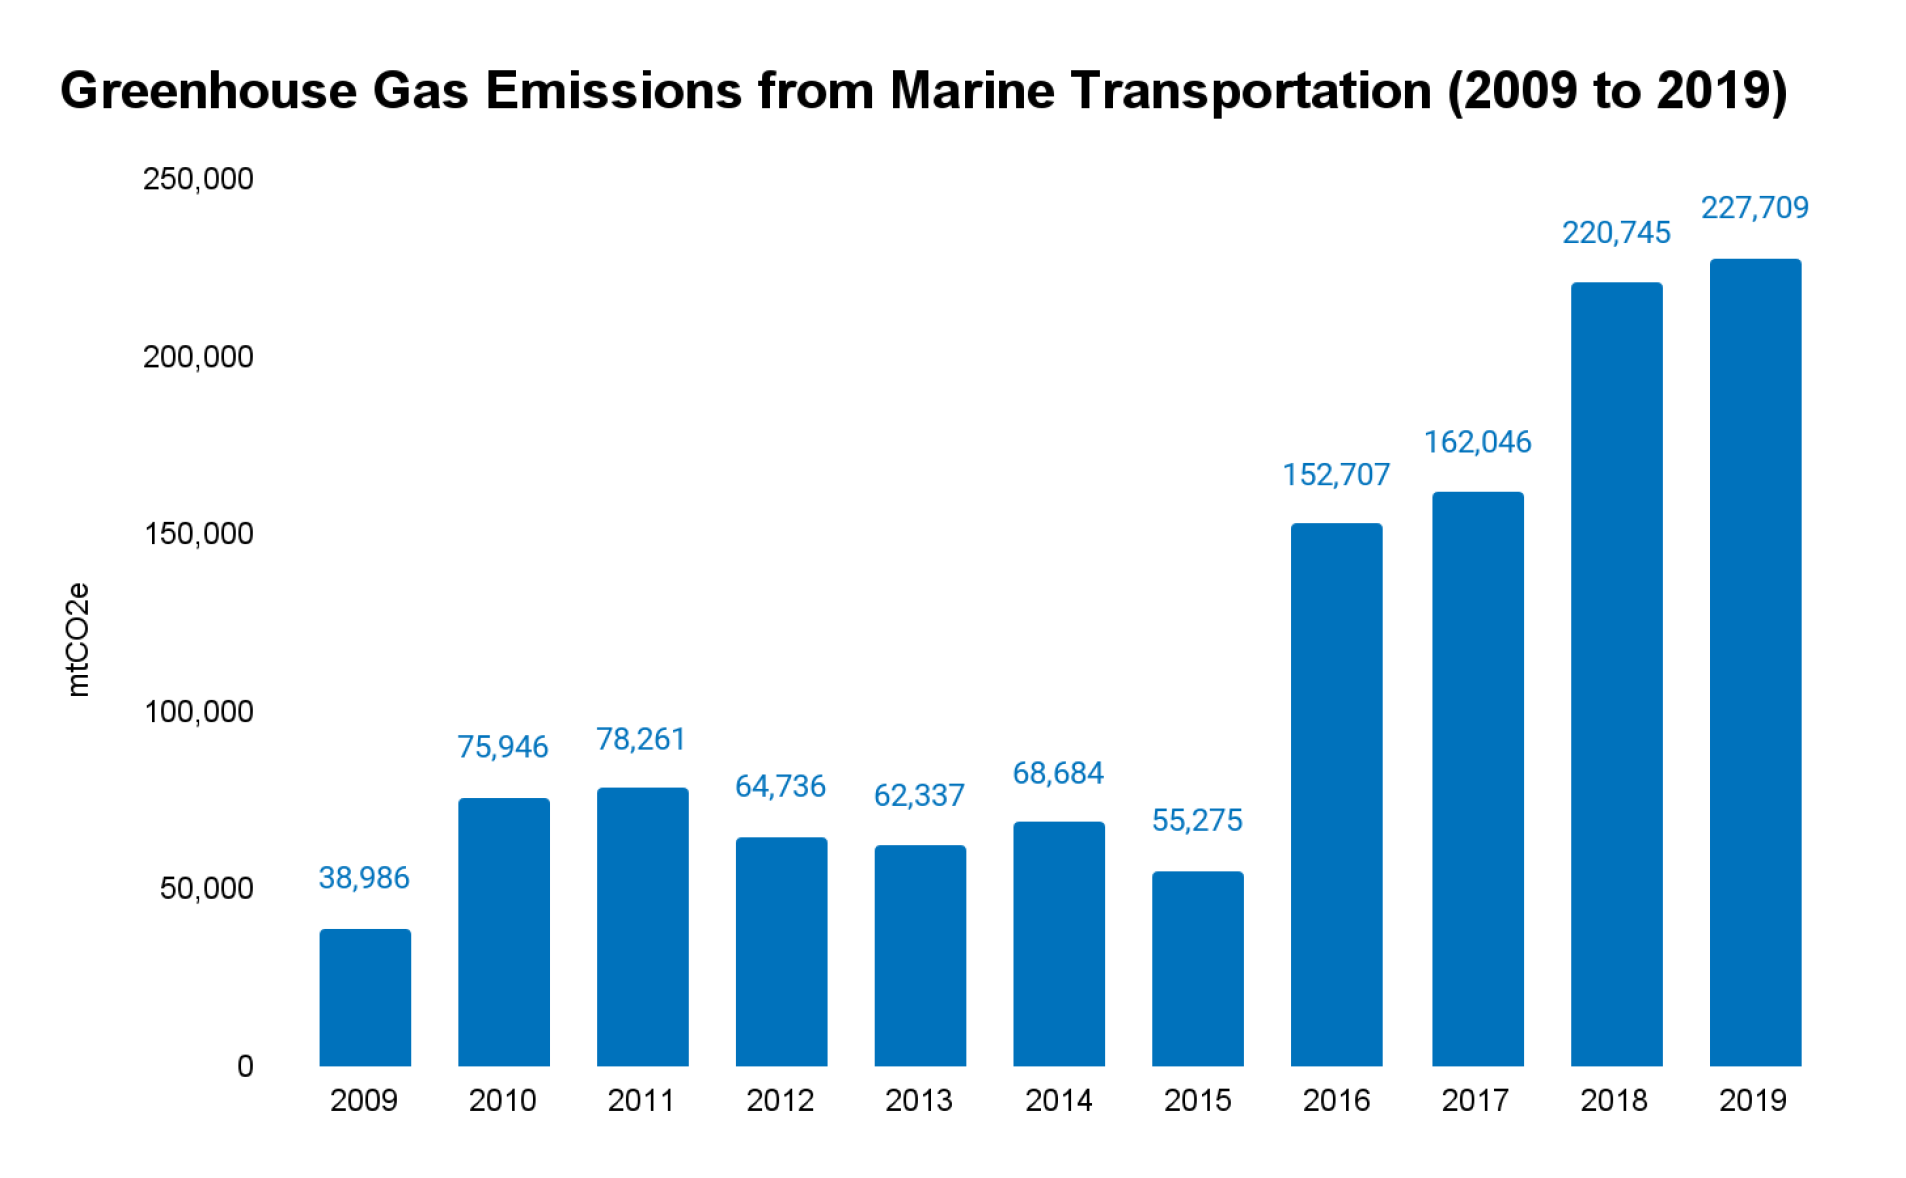
4.2.3.4 City-Wide Air Transportation
There is one international airport, Tampa International Airport (TIA), that serves the greater Tampa Bay Region, one airfield located at McDill Airforce Base, and two smaller airports located in unincorporated Hillsborough County. Passenger travel at the TIA increased by 34 percent from 2010 to 2019 (Figure 4-18) with close to 11 million passengers boarding 83,314 scheduled flights in 2019. Since the TIA serves the greater Tampa Bay Region, the Inventory used a population scaled emissions factor and statewide GHG emissions from air travel. This method assumes each person in Florida flies equally which likely underestimates emissions in this sub-category. Tampa International Airport has its own Sustainable Management Plan with GHG emissions tracking protocol for air travel and site-based operations.
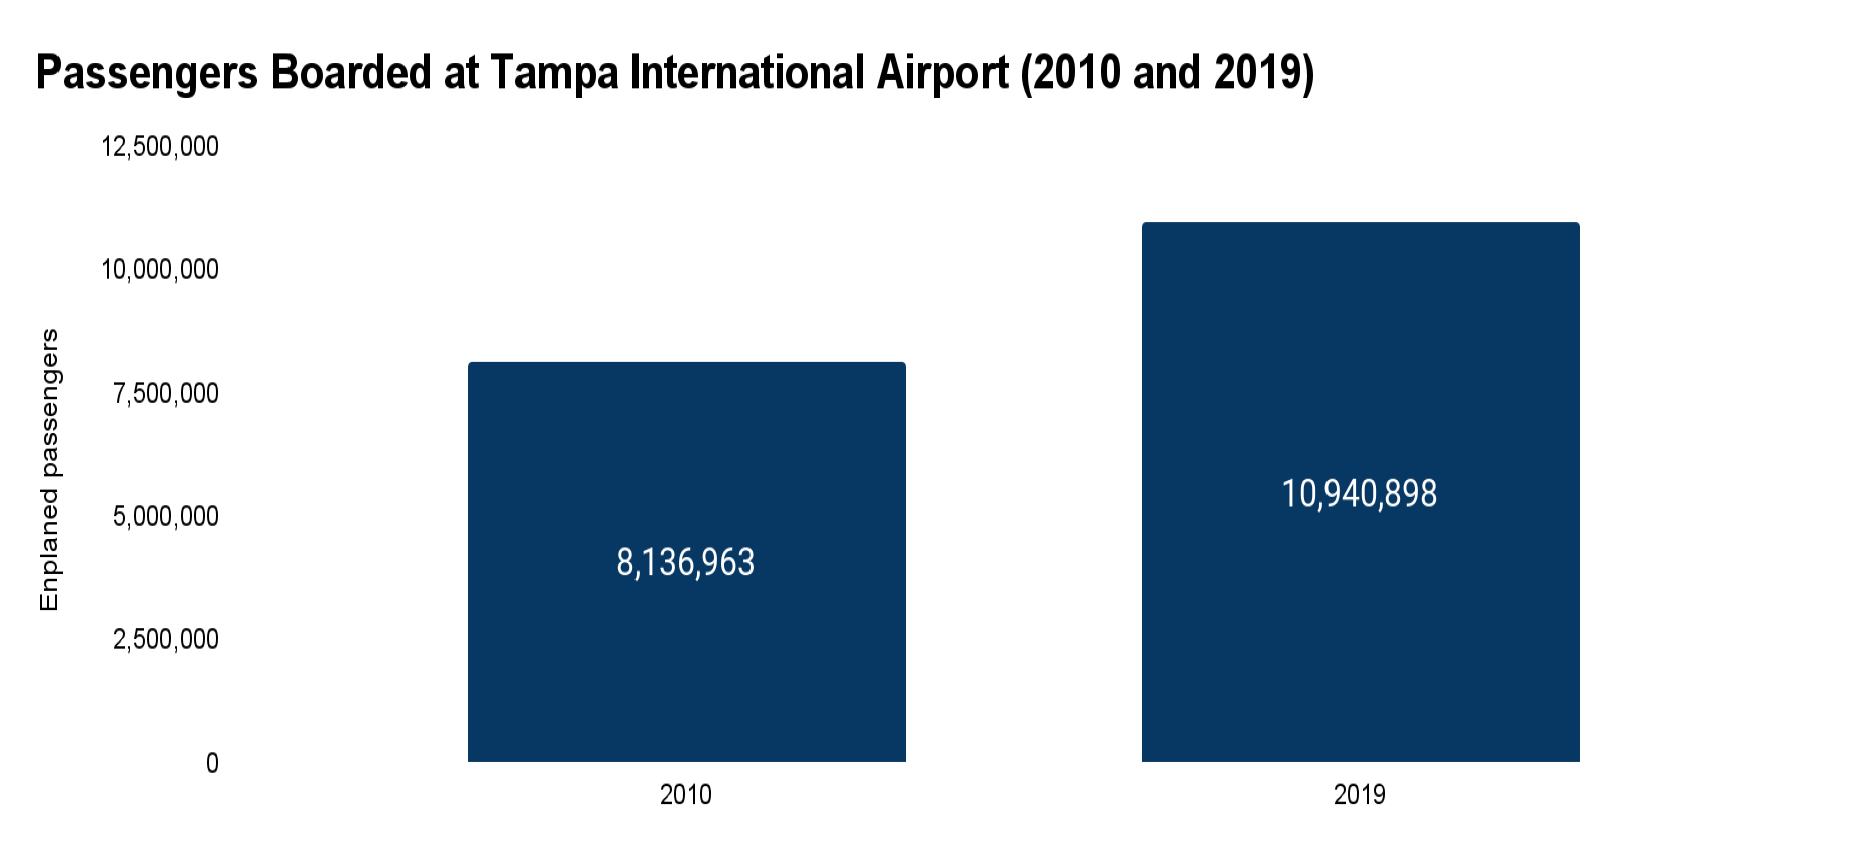
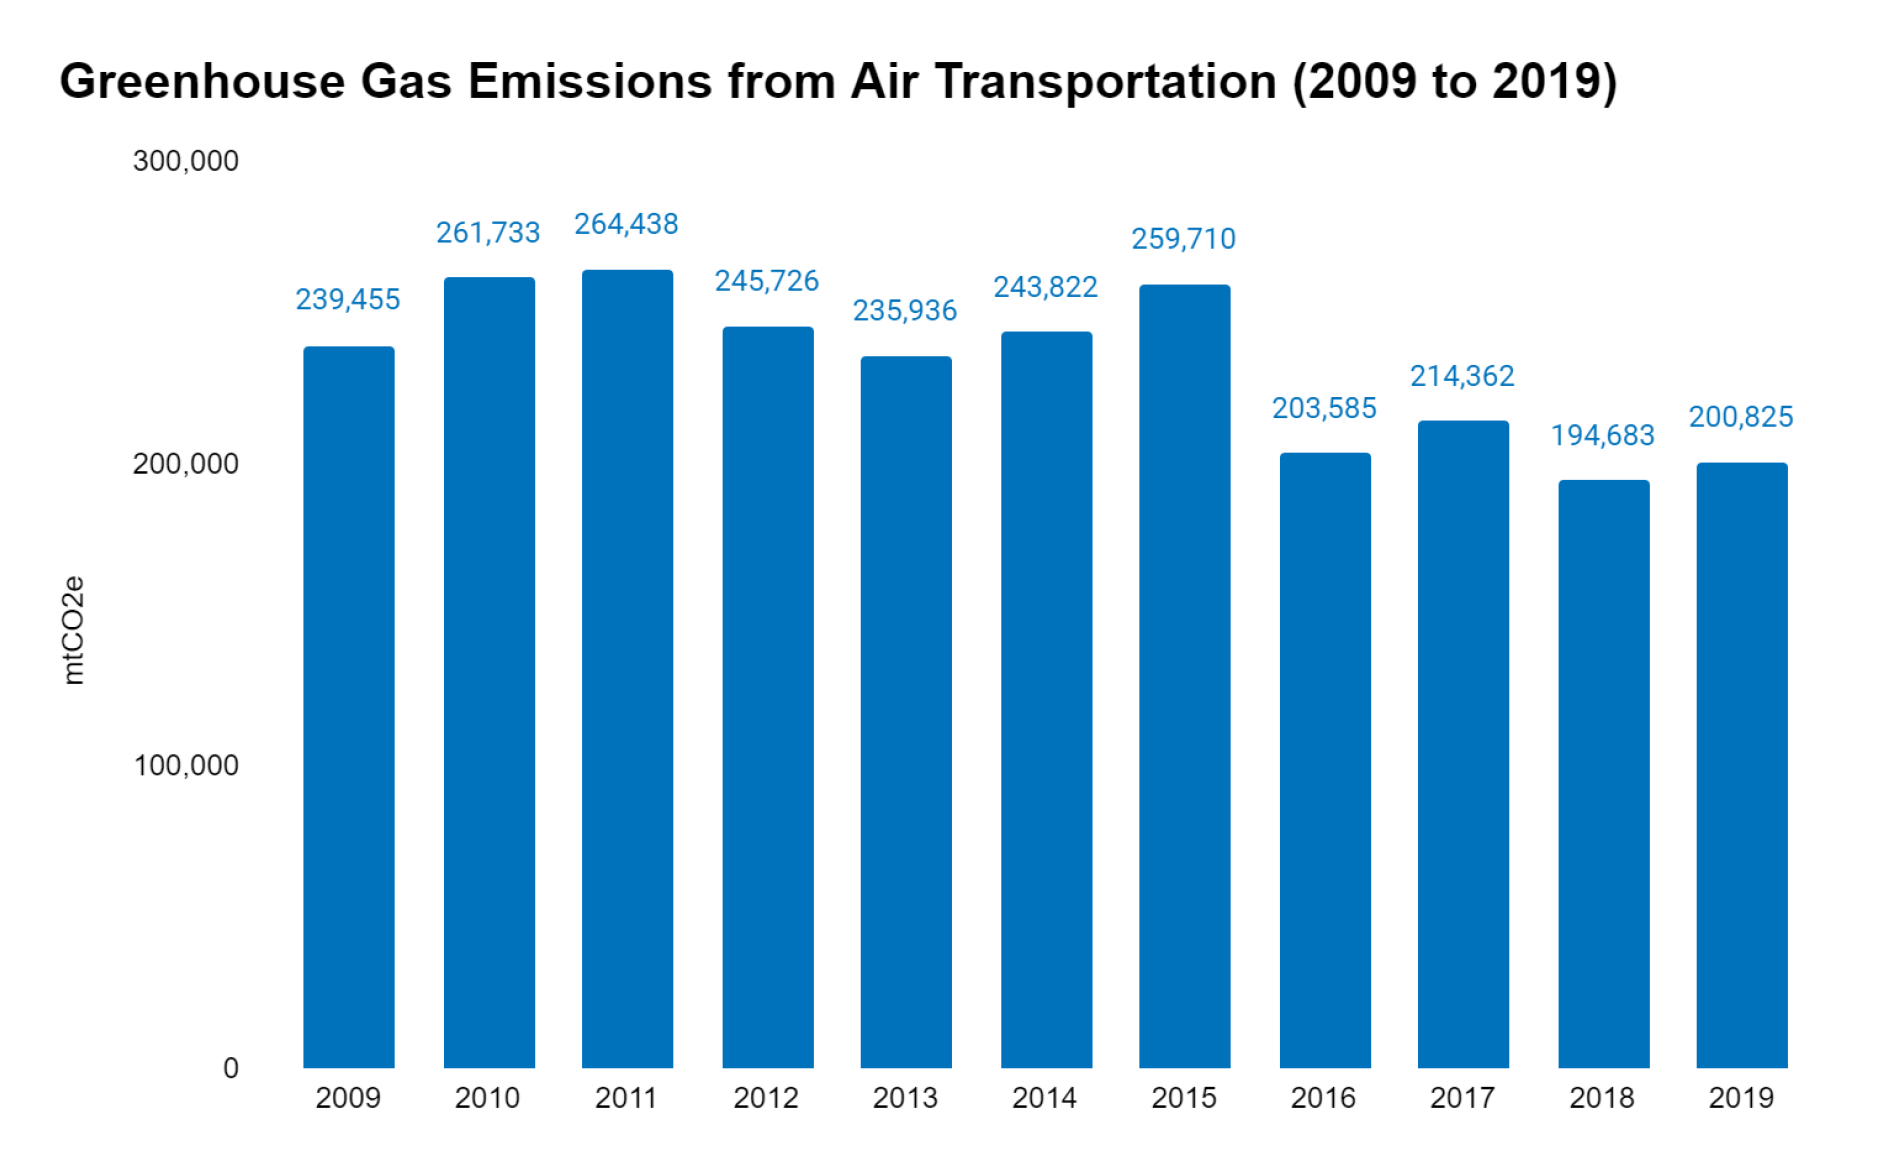
Data Sources: Air transportation GHG emissions obtained from the SIT Model that has not been updated with 2019 data. 2018 was imputed for the 2019 calendar year.
4.2.3.5 City-Wide Rail Transportation
A total of 2,782 miles of rail15 run through the State of Florida, 136 miles16 of which are located within the City boundary. As shown on Figure 4-20, the vast majority of rail is operated by CSX with multiple connections coming into the City. Additionally, TECO operates an electric-powered trolley in the downtown region and TIA operates light rail to connect the airport to its parking garage and rental car facility. The total mileage of track for all of CSX and for the Streetcar was obtained from the Association of American Railroads and the miles of track within the City of Tampa boundary was extracted using ArcGIS. Statewide GHG emissions were used to estimate GHG emissions in the City using the percent of track lanes for heavy and light rail as a share of statewide emissions (Figure 4-21). This methodology assumes equal usership across all rail in the State. As a cross-check, the total GHG emissions was also estimated by population, which yielded a similar result. Thus, the total miles of railroad was used as the activity data.
- The Association of American Railroads, data and reports at: (https://www.aar.org/publications/)
- Miles of railway in the City of Tampa were calculated using ArcGIS, using the Tampa city layer to clip the boundary.
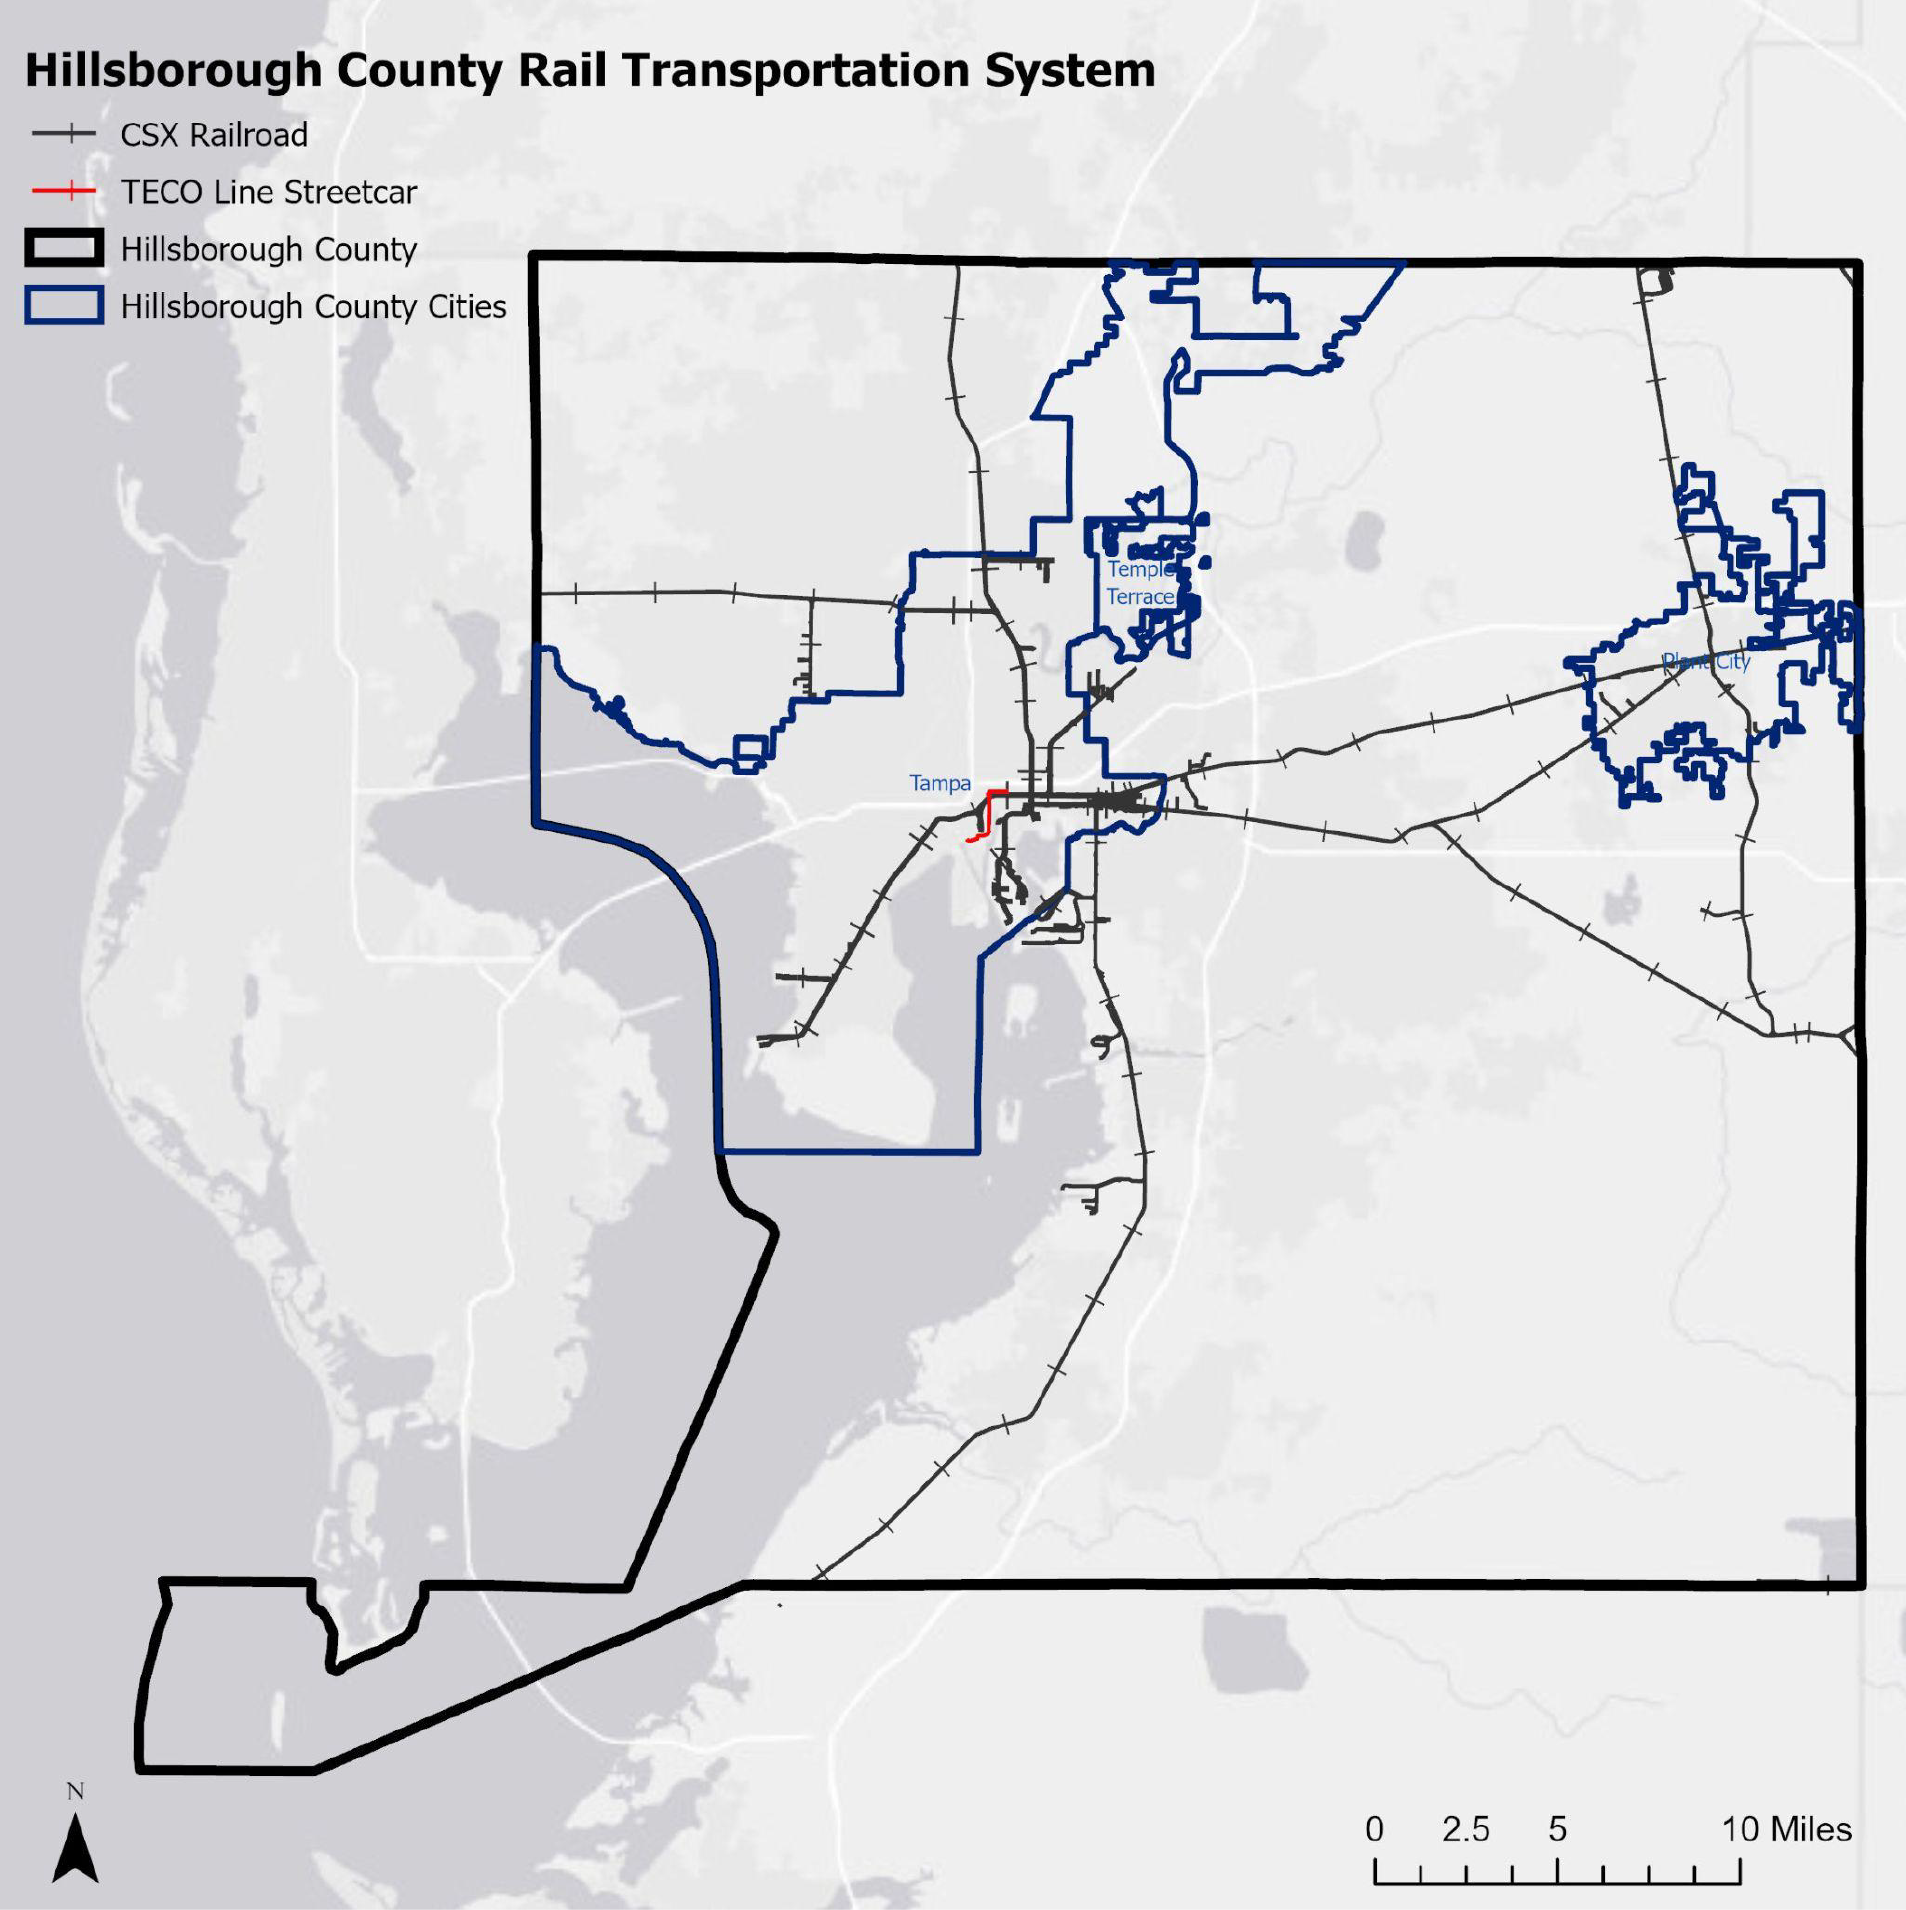
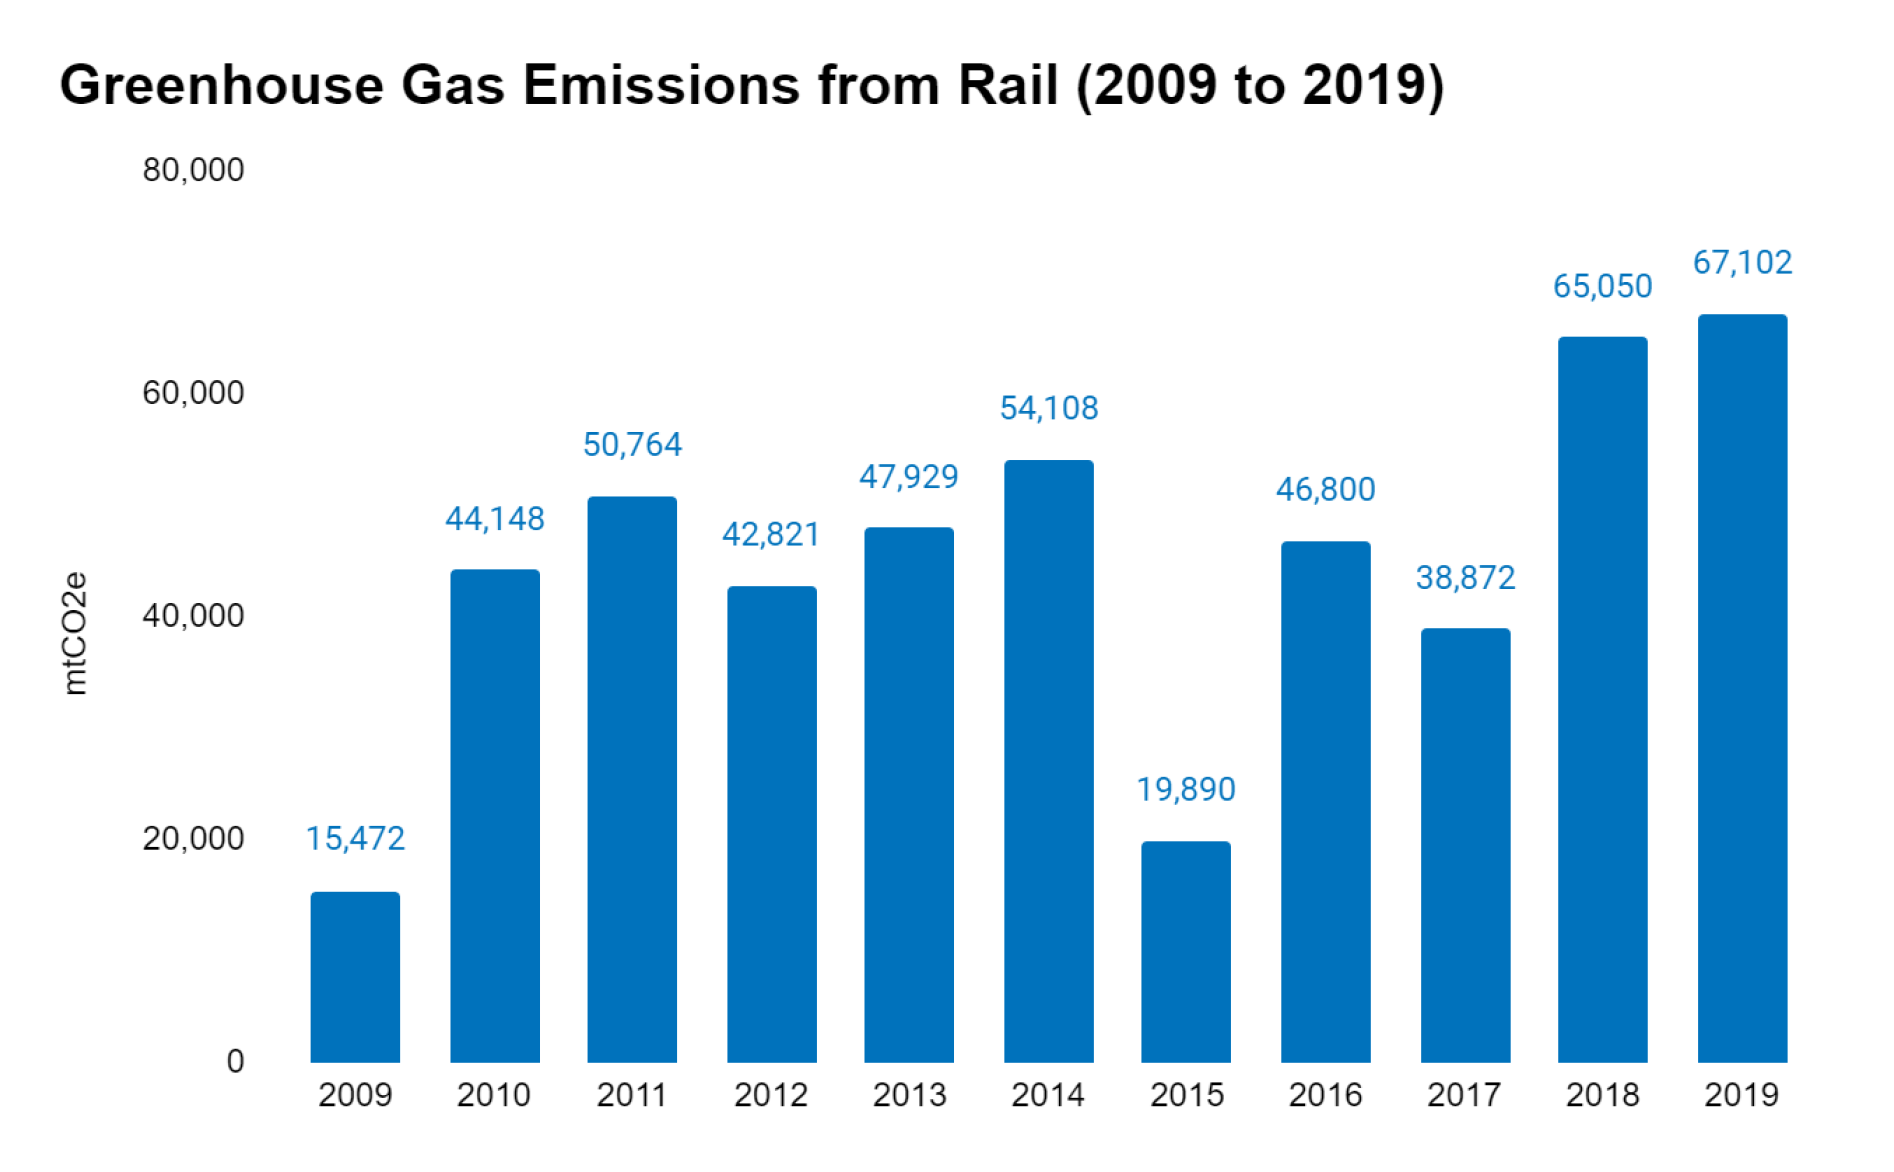
4.2.3.6 Key Findings: City-Wide Transportation
GHG emissions from transportation account for 46 percent of all emissions and have increased by 22 percent. On-road transportation from automobiles, buses, and trucks represent the dominant source of GHG emissions City-wide, with increased GHG emissions by 12.4 percent from 2009 to 2019. Transportation construction and landscaping are the main source of off-road GHG emissions, which have increased by 44 percent. Marine GHG emissions are small in comparison, but GHG emissions from boating have increased by close to 500 percent. Aviation GHG emissions have decreased by 16 percent from 2009 to 2019, even though the Tampa International Airport (TIA) has experienced a 34 percent increase in passenger travel during the same time period. Rail travel represents a small portion of City-wide GHG emissions but has increased from 2009 to 2018. The majority of rail related GHG emissions are derived from the CSX line that transports mostly industrial products and coal into the region. The City of Tampa has a streetcar that serves the downtown region with connections planned to the airport, USF, and to other neighborhoods across the City. More rail transportation would reduce GHG emissions from on-road transportation.
4.2.4 City-Wide Municipal Solid Waste
City-wide municipal solid waste is collected and managed by the City of Tampa’s Solid Waste Department. A detailed analysis of wastes generated, treatment of that waste, and resultant GHG emissions from this waste is presented in the Government Operations inventory (Section 3.2.4).
4.2.5 City-Wide Water and Wastewater
The City of Tampa is responsible for providing potable drinking water and for managing the wastewater that results from water usage. Therefore, this category is presented in the Government Operations inventory. A detailed analysis of water and wastewater is presented in Section 3.2.5.
4.2.6 City-Wide Industrial Processes and Product Use
4.2.6.1 Industrial Processes
One industrial plant, Envirofocus Technologies, meets the threshold of emitting over 25,000 mtCO2e annually and has reported GHG emissions to EPA’s Flight since 2012. The facility emits carbon dioxide from smelting lead as well as stationary combustion of natural gas. Emissions from natural gas are assumed to be connected to TECO’s People’s Gas (but this is unknown) and those emissions are included in industrial energy emissions so as not to double count these GHG emissions. GHGs from lead production in 2019 for this facility totaled 28,690 mtCO2e.
4.2.6.2 Industrial Product Use
Ozone depleting substances (ODS) such as chlorofluorocarbons (CFCs) are also potent GHGs and have been phased out as a result of the Montreal Protocol. Substitutes for the CFCs are also potent GHG emissions. Table 4-3 presents GHG emission estimates for each type of industrial use that has been scaled using the population scaling factor. Data at the local level is time intensive and the state SIT Model does not have a statewide estimate. However, these emissions represent approximately 3.5 percent of total emissions.
| Industrial Product Use | 2005 | 2015 | 2016 | 2017 | 2018 | 2019 |
|---|---|---|---|---|---|---|
| Refrigeration/Air Conditioning | 99,204 | 140,212 | 143,543 | 143,997 | 146,834 | 151,373 |
| Aerosols | 11,834 | 23,369 | 21,787 | 19,971 | 18,156 | 18,496 |
| Foams | 4,534 | 15,617 | 17,021 | 17,929 | 18,383 | 18,269 |
| Solvents | 1,880 | 2,022 | 2,156 | 2,156 | 2,269 | 2,269 |
| Fire Protection | 1,217 | 2,584 | 2,723 | 2,837 | 2,950 | 3,177 |
| Total GHGs | 118,669 | 183,804 | 187,230 | 186,890 | 188,592 | 193,585 |
Data Source: EPA’s Inventory of Greenhouse Gas Emissions.
Data scaled to the City of Tampa population assuming that all people in the nation use the same level industrial products.
4.2.7 City-Wide Land Use
Land use plays a large role in determining the sources of GHG emissions and sinks. For example, carbon is stored in upland and wetland forests and generally will represent a carbon sink. If forested land is converted to a residential land use, sequestration potential is lost AND the carbon that was stored is
released back into the environment (in a clear cut scenario). Additionally, the new land use generally will be a GHG emission source (e.g., electricity consumed by building operations). Thus, an accurate accounting of current and historical land uses are needed to identify GHG sources and sinks and to model future land use change to 2050. This section presents GHG emissions from sources (i.e., fertilizer applications and refrigerants) and from GHG sinks from forested land and in the urban forest.
Over 80 percent of the City is urbanized primarily with residential, commercial, and related infrastructure. According to the 2017 Florida Land Use Cover and Forms Classification (FLUCCS),17 the City’s land use is occupied primarily with high-density residential development (defined as having six or more dwellings per acre) (41.2 percent) and commercial development (16.9 percent) (Figures 4-22 and 4-23). Institutional (i.e., governmental)18 land uses are the third largest land use with nearly 10 percent of all land coverage. The total acres of land classified within the City of Tampa were calculated from FLUCCS data for 2009 and 2017 (the closest year with data). Table 4-4 indicates that over 1,000 acres of high-density residential land was converted from other land uses (e.g. over 600 acres of open land have been converted).
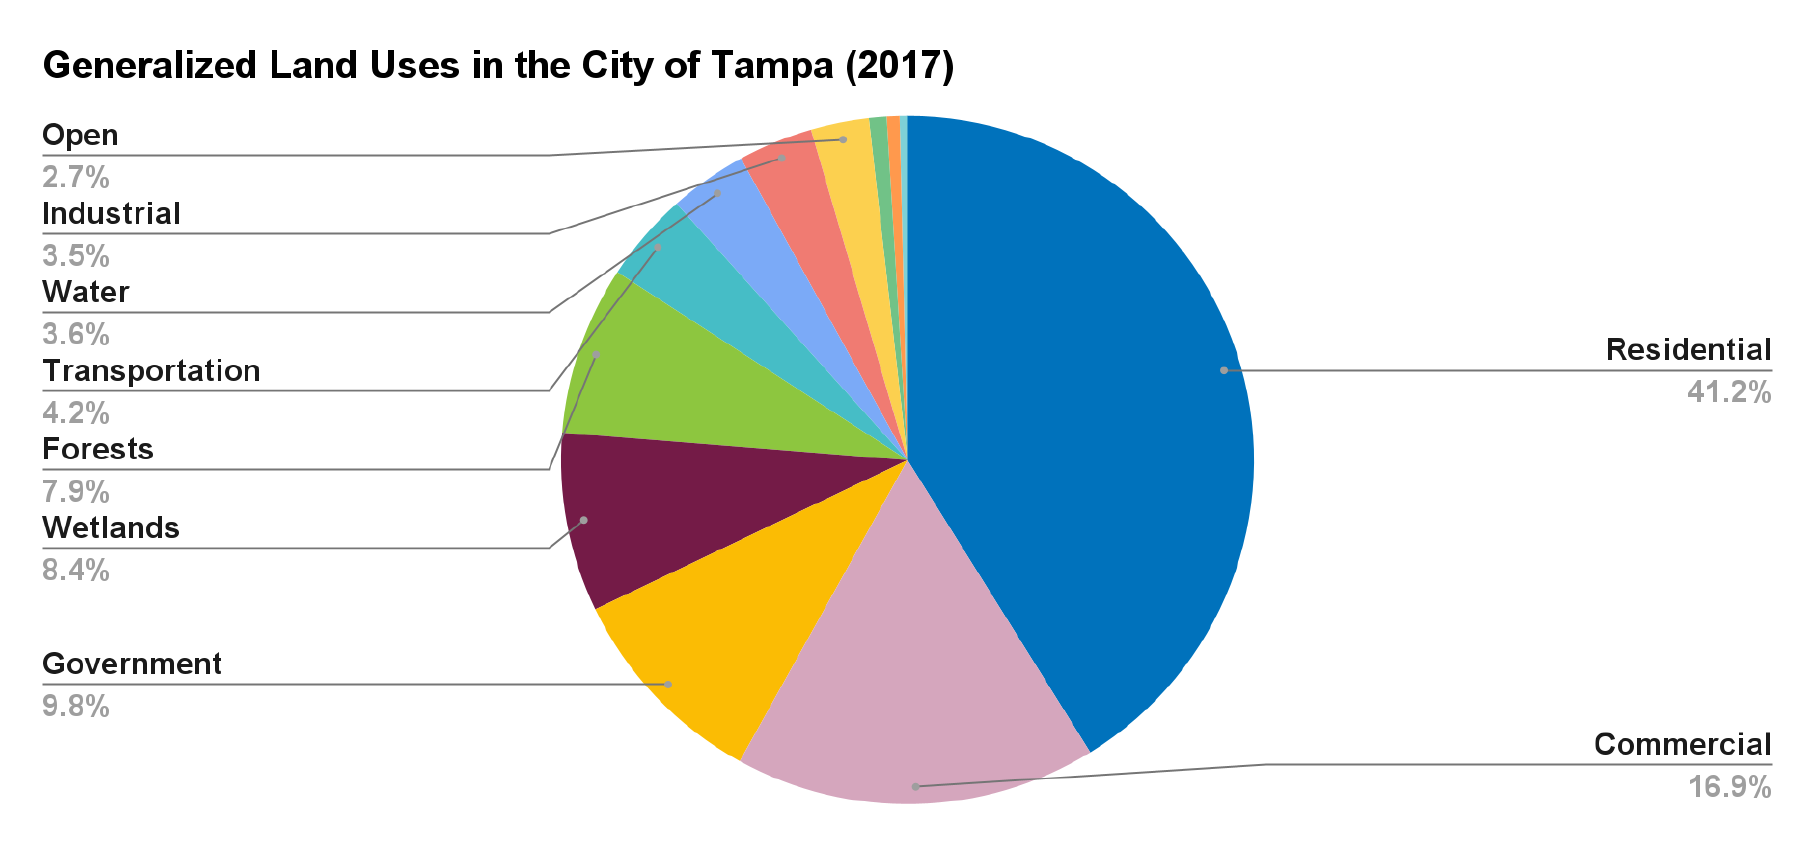
Data Source: Percents obtained by calculating the total number of acres in FLUCCS (2017)
- Florida Land Use Cover and Forms Classification (FLUCC) GIS data is available for selected years from the Southwest Florida Water Management district, (https://data-swfwmd.opendata.arcgis.com/search?groupIds=880fc95697ce45c3a8b078bb752faf40).
- Institutional refers to governmental land uses and can include federal, state, local, and other quasi-and inter-governmental agencies.
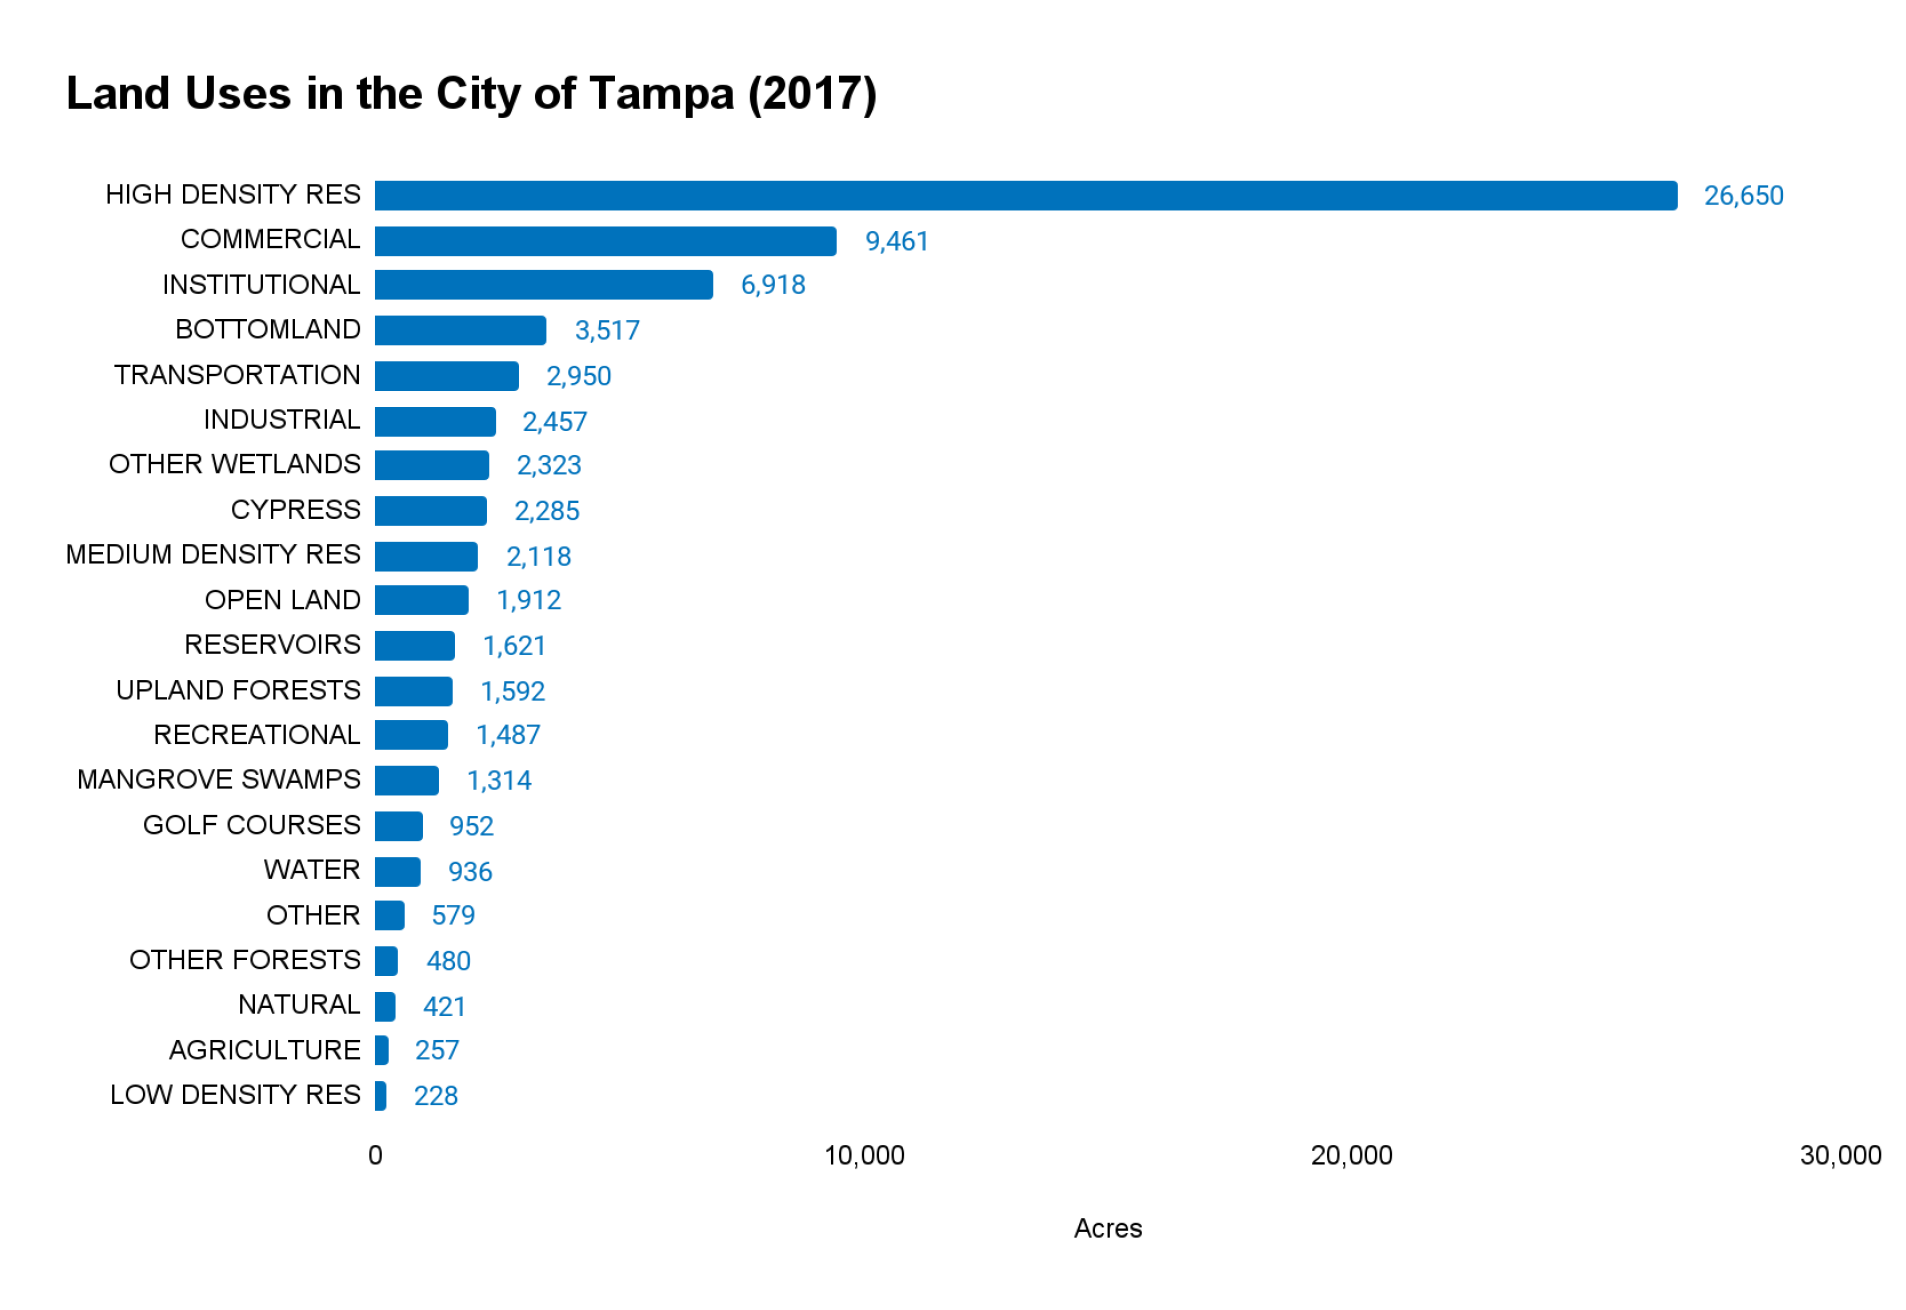
| Land Use | 2009 | 2017 | Acres | Percent Change |
|---|---|---|---|---|
| Commercial and services | 9,457.00 | 9,460.96 | 3.97 | 0.04 |
| Golf courses | 974.89 | 952.24 | -22.65 | -2.32 |
| Industrial | 2,449.33 | 2,456.63 | 7.30 | 0.30 |
| Institutional | 6,937.35 | 6,918.28 | -19.07 | -0.27 |
| Open land | 2,536.98 | 1,911.79 | -625.19 | -24.64 |
| Recreational | 1,454.58 | 1,487.18 | 32.60 | 2.24 |
| Residential high density (6 or more dwelling units per acre) | 25,578.60 | 26,649.60 | 1,071.00 | 4.19 |
| Residential low density (< 2 dwelling units per acre) | 261.82 | 228.30 | -33.52 | -12.80 |
| Residential medium density (2 to 5 dwelling units per acre) | 2,442.84 | 2,118.09 | -324.75 | -13.29 |
| Total | 52,093.37 | 52,183.05 |
Data Source: FLUCCS, 2017
4.2.7.1 City-Wide Fertilizer Applications
Fertilizer applications are small in comparison to other GHG categories and were estimated as part of the materiality assessment and because the 2009 estimate was high. However, based on scaled estimates using top-down Florida state GHG calculations, the preliminary screening resulted in a total of 1,092 mtCO2e and 1,074 mtCO2e for 2009 and 2019, respectively. This represents less than one percent of total GHG emissions.
4.2.7.2 City-Wide Forested Land
According to the conducted for the City of Tampa, 29 percent of land area in the City has a tree canopy. According to the study, an additional 29 percent of land could be enhanced with an urban forest (Figure 4-24). Total carbon stored and annual carbon sequestration is quantified using remote sensing at the census block level in EPA’s . Figure 4-25 shows the relative differences in carbon sequestration annual rates in both natural and urban forests in the City of Tampa and the surrounding community. The annual total carbon sequestered in the City of Tampa was calculated to be -193,824 mtCO2e.
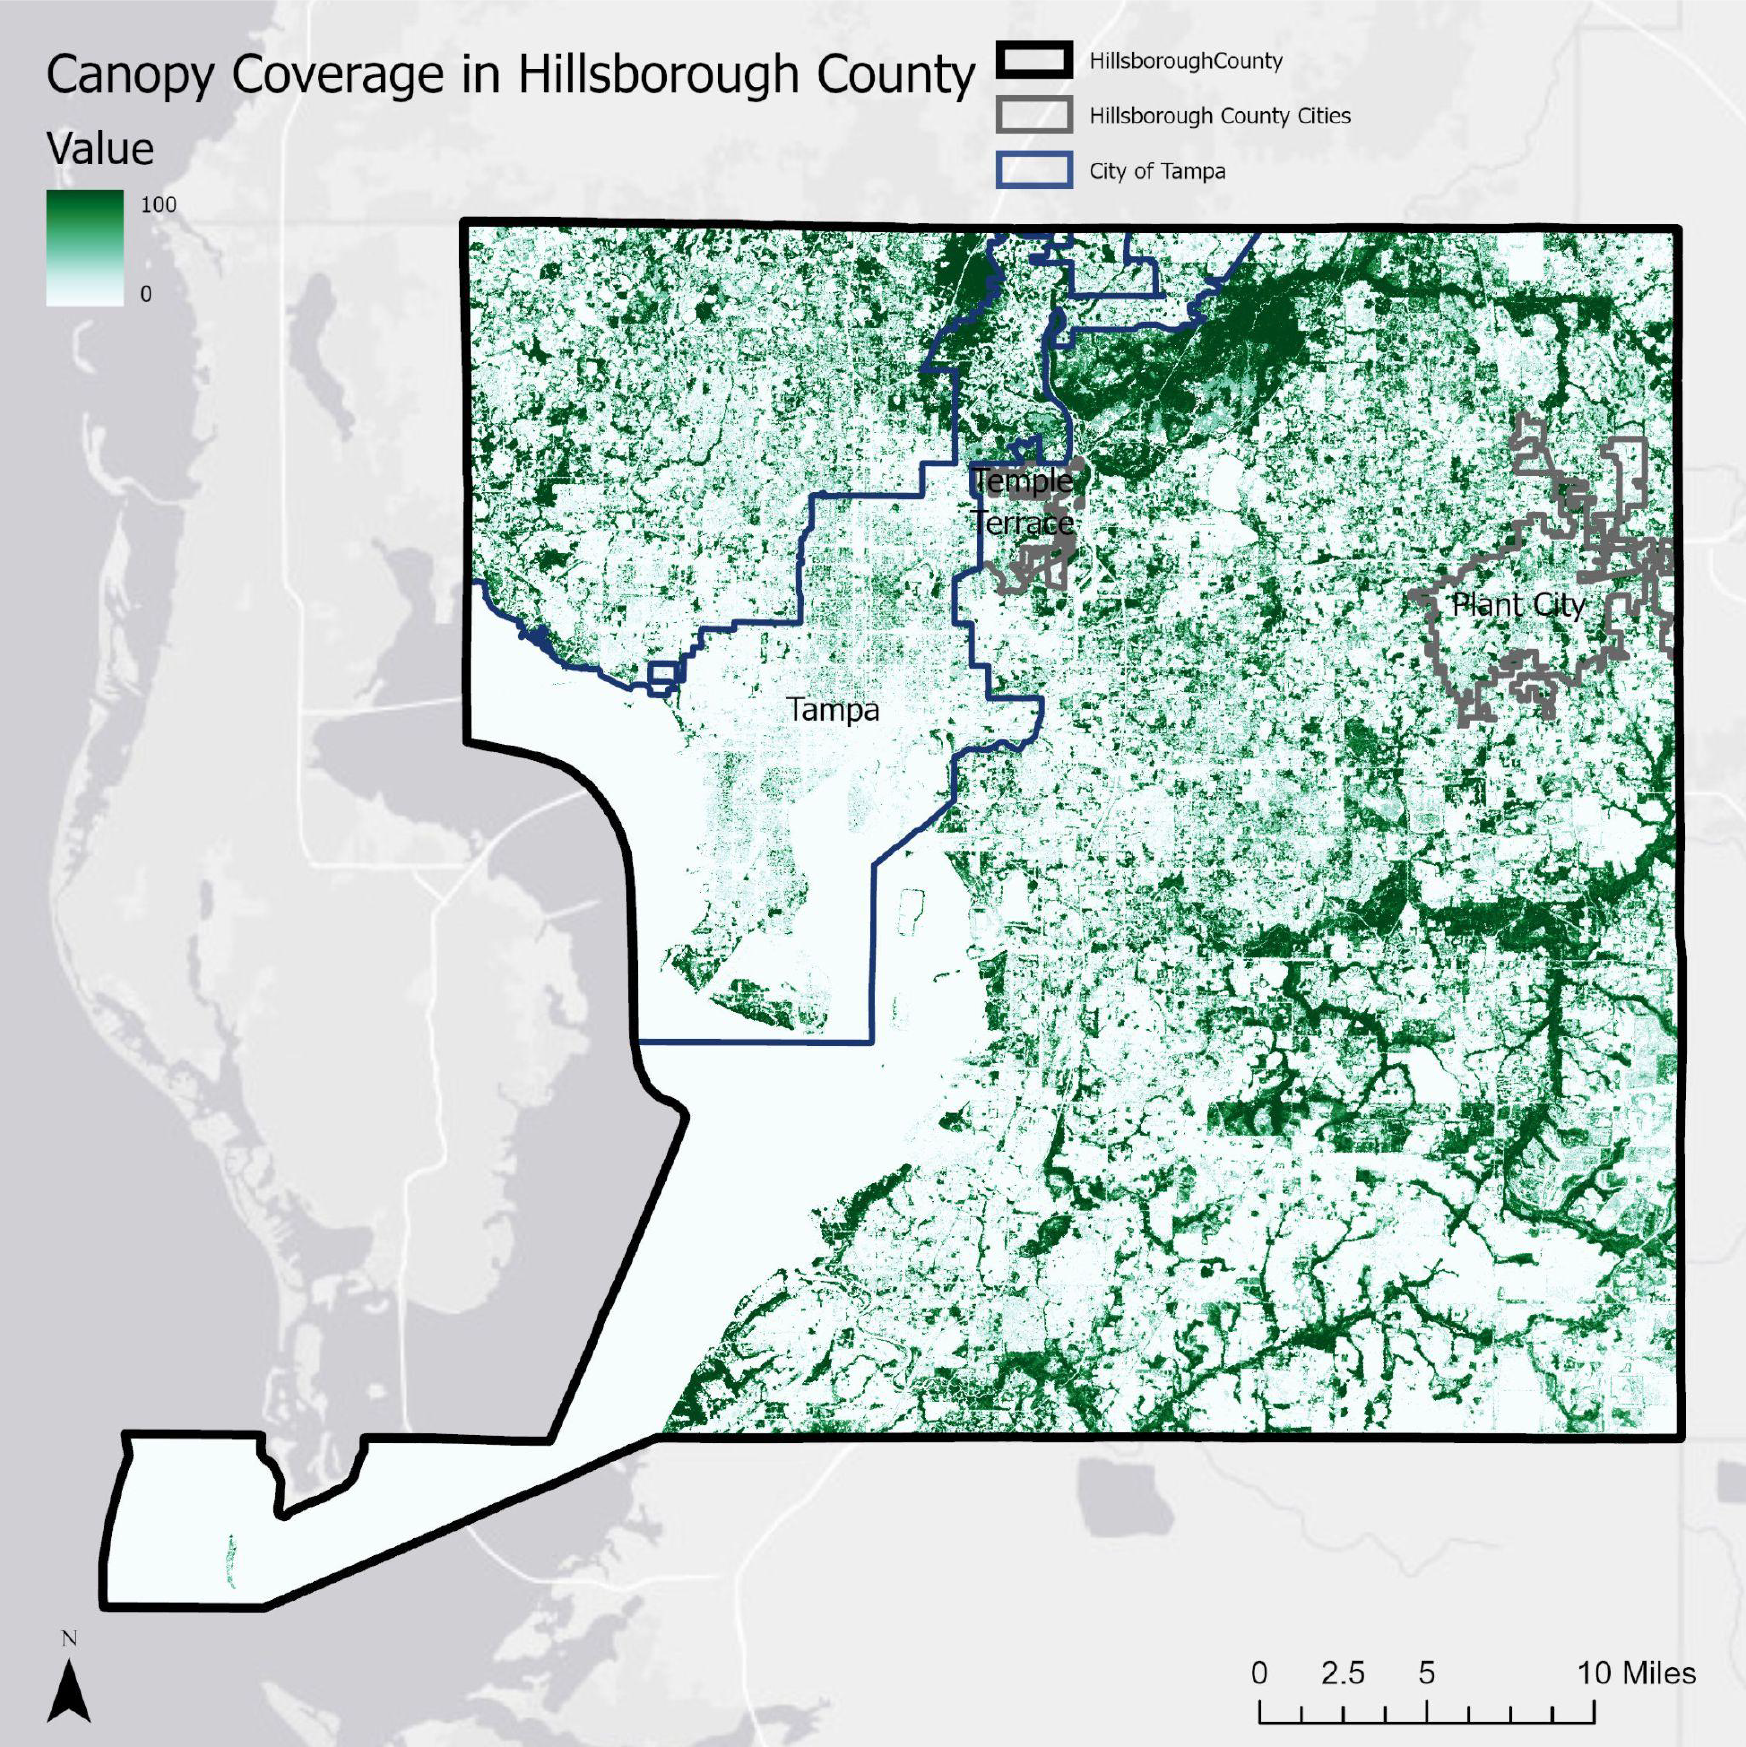
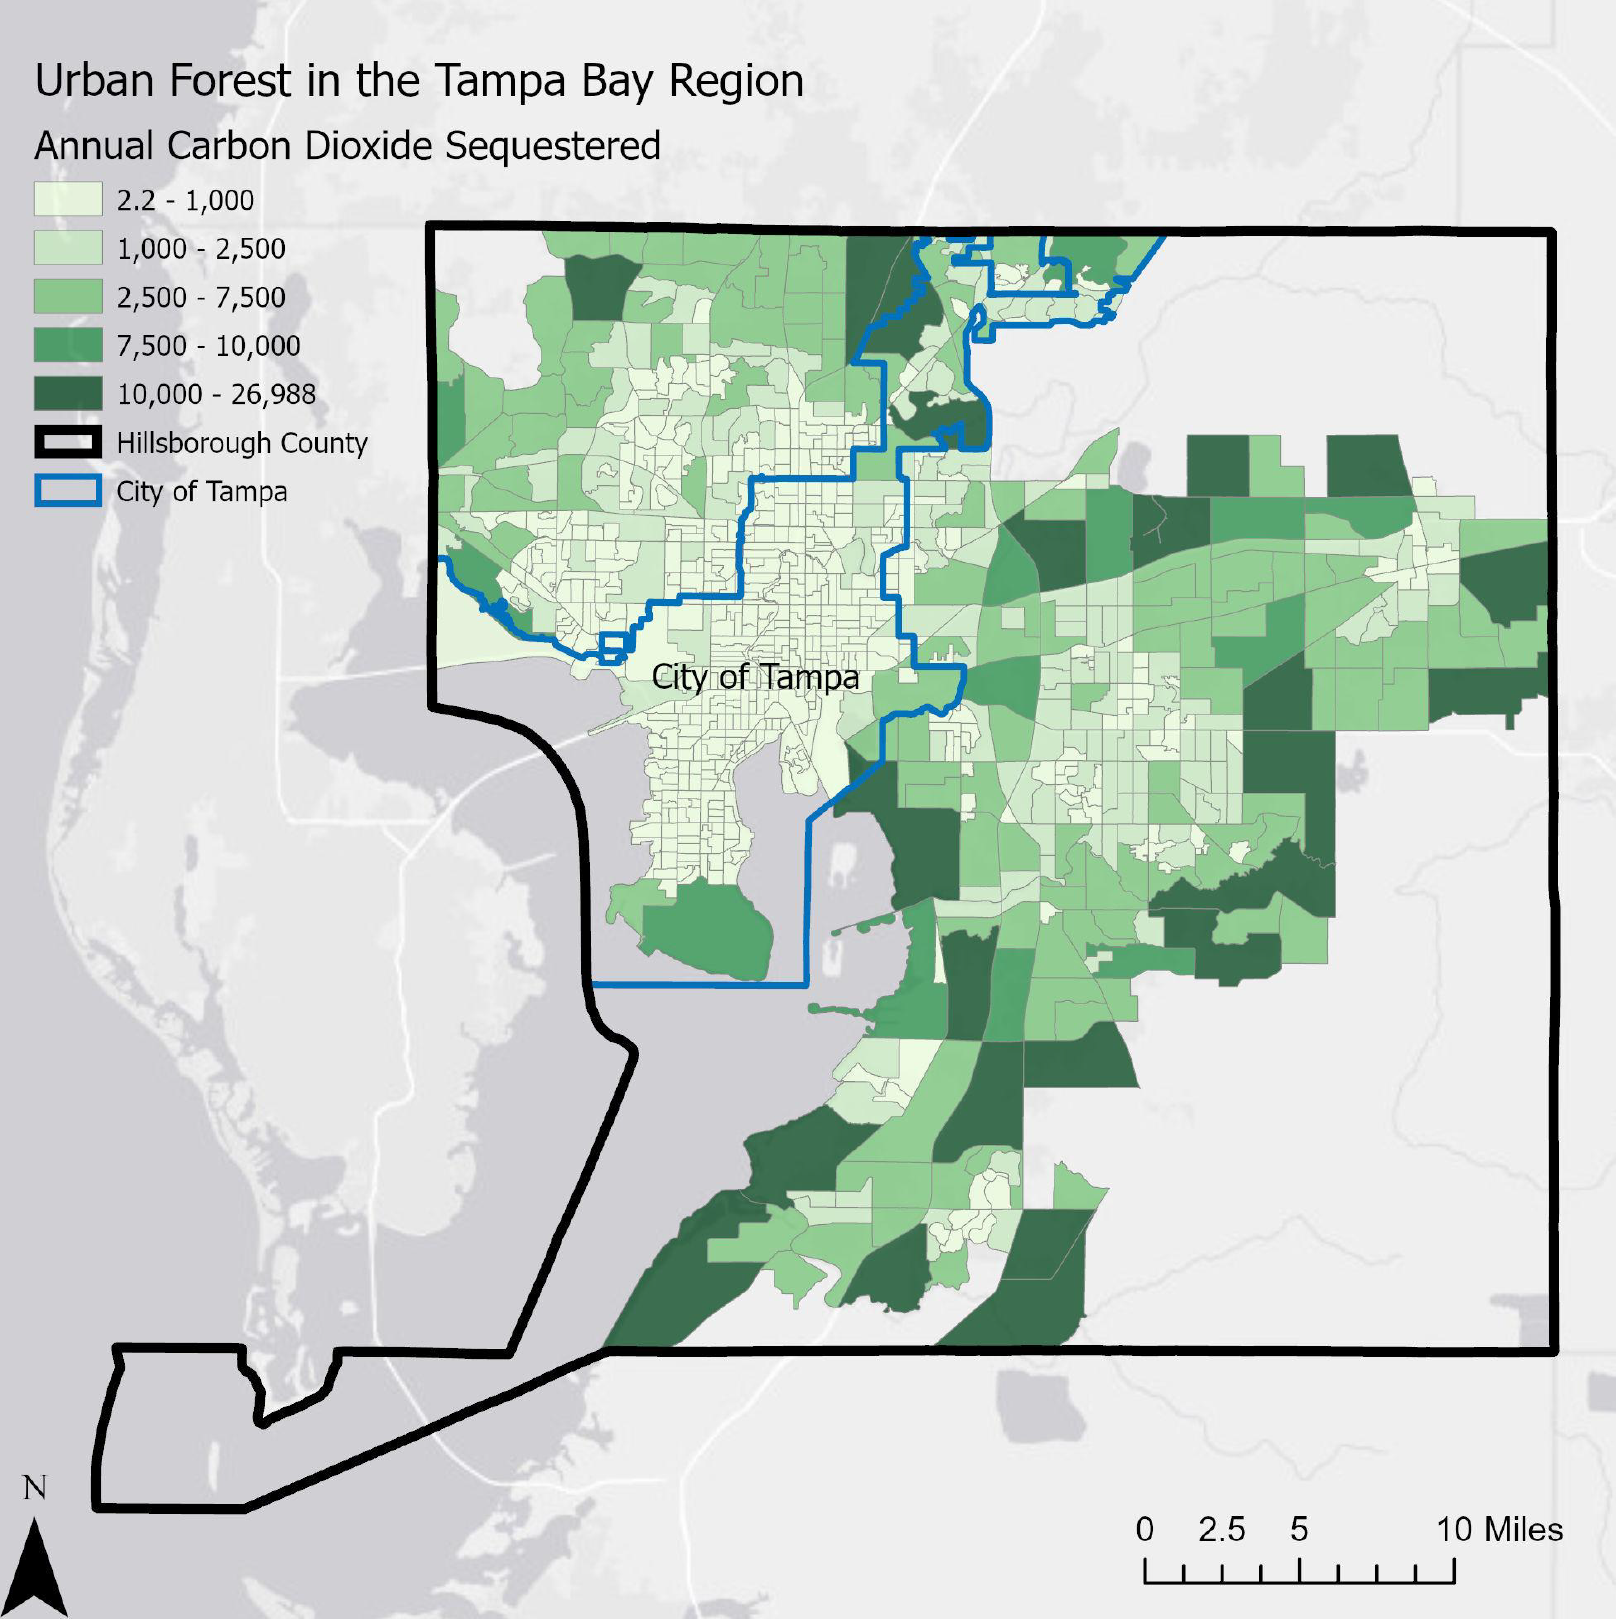
Figure 4-25. Carbon dioxide sequestered from Tampa’s Urban Forest
Data Source: (https://enviroatlas.epa.gov/enviroatlas/DataFactSheets/pdf/ESC/Totalcarbonstoredbytreecover.pdf)EPA’s EnviroAtlas
4.2.7.3 Key Findings: City-Wide Land Use
The City of Tampa is over 70 percent built out, with the majority of land use in residential and commercial development. Converting natural land to urban uses results in both a reduction of carbon sequestration, particularly if the natural land was a forest, while also adding GHG emissions from electricity construction and increased transportation. The City of Tampa is nearly built out and little change has occurred within the built environment. Agricultural land uses in the City of Tampa have reduced significantly over the last decade. While some agricultural land remains particularly in the northern section, the majority of agricultural uses in Hillsborough County are in the surrounding community. Urban forests increased carbon stored from 2006 to 2016. Natural forests within the City remained small; however, they represent important carbon sinks. Opportunities exist to expand the urban forest which would offset GHG emissions.
4.3 CITY-WIDE GREENHOUSE GAS EMISSIONS BY SECTOR
Categorical GHG emissions were aggregated into six sectors: residential energy, commercial energy, government energy, transportation, waste, and land use. As shown in Figure 4-26, the largest contributor of GHG emissions by sector was on-road transportation (35 percent) followed by commercial and residential energy (19 and 17 percent, respectively). Transportation, waste, industrial, and land use emissions are detailed in Section 4.2. This section examines GHG emissions from the residential, commercial, industrial, and government energy sectors in more detail.

On-Road transportation, waste, industrial processes, and land use sectors align with GHG emission categories presented in Section 4.2. The remainder of this section provides a summary of City-Wide energy, which combines both electricity and natural gas consumption for four sectors (i.e., commercial, residential, industrial, and governmental).
As shown on Figure 4-27, the highest energy consumption in the City of Tampa is in the commercial sector with over 40 percent of the consumption in 2019. Residential consumption accounted for 36 percent, government approximately 18 percent, and industrial is the least at 6 percent. Overall, electricity consumption in the City of Tampa has increased 3.0 percent over the last three years, compared to a 3.7 percent increase in population over the same time period (see Section 2.2). This indicates that emissions were reduced at a faster rate than population growth. From Figure 4-28, the
vast majority of GHG emissions from the energy sector is from electricity consumption (versus natural gas) and Figure 4-29 shows the distribution of energy consumption geospatially by zip codes. Further breakdown of each sector follows.
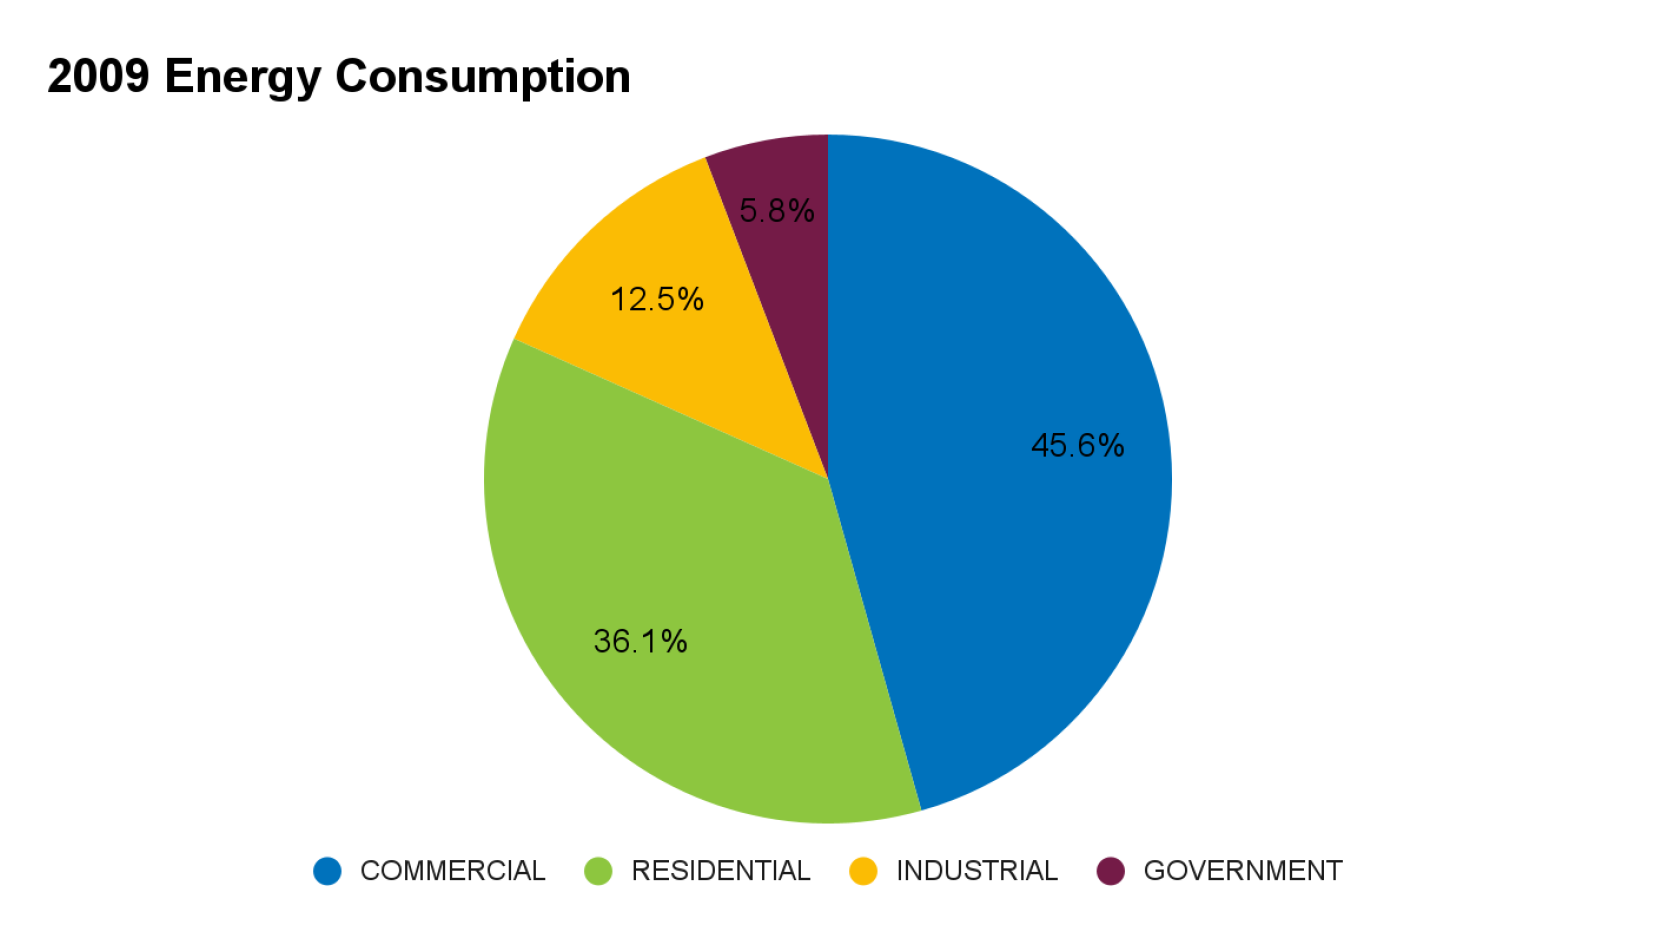
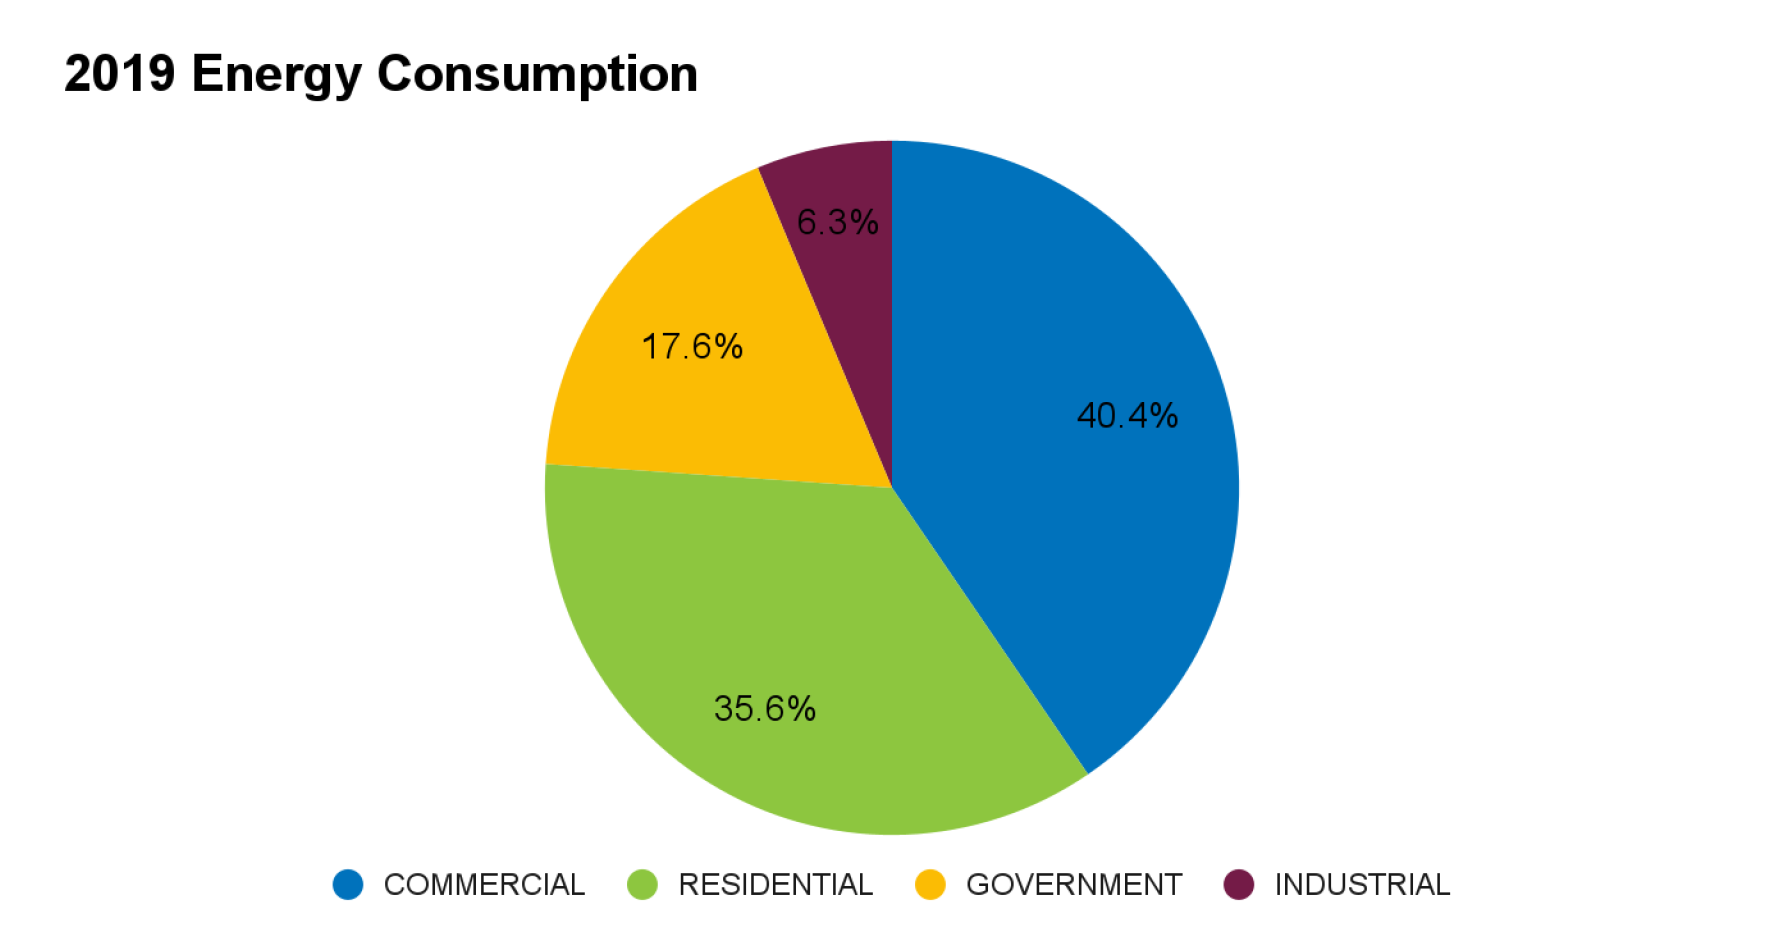
Figure 4-27. City-Wide Greenhouse Gas Emissions from the Energy Sector (2009 and 2019)
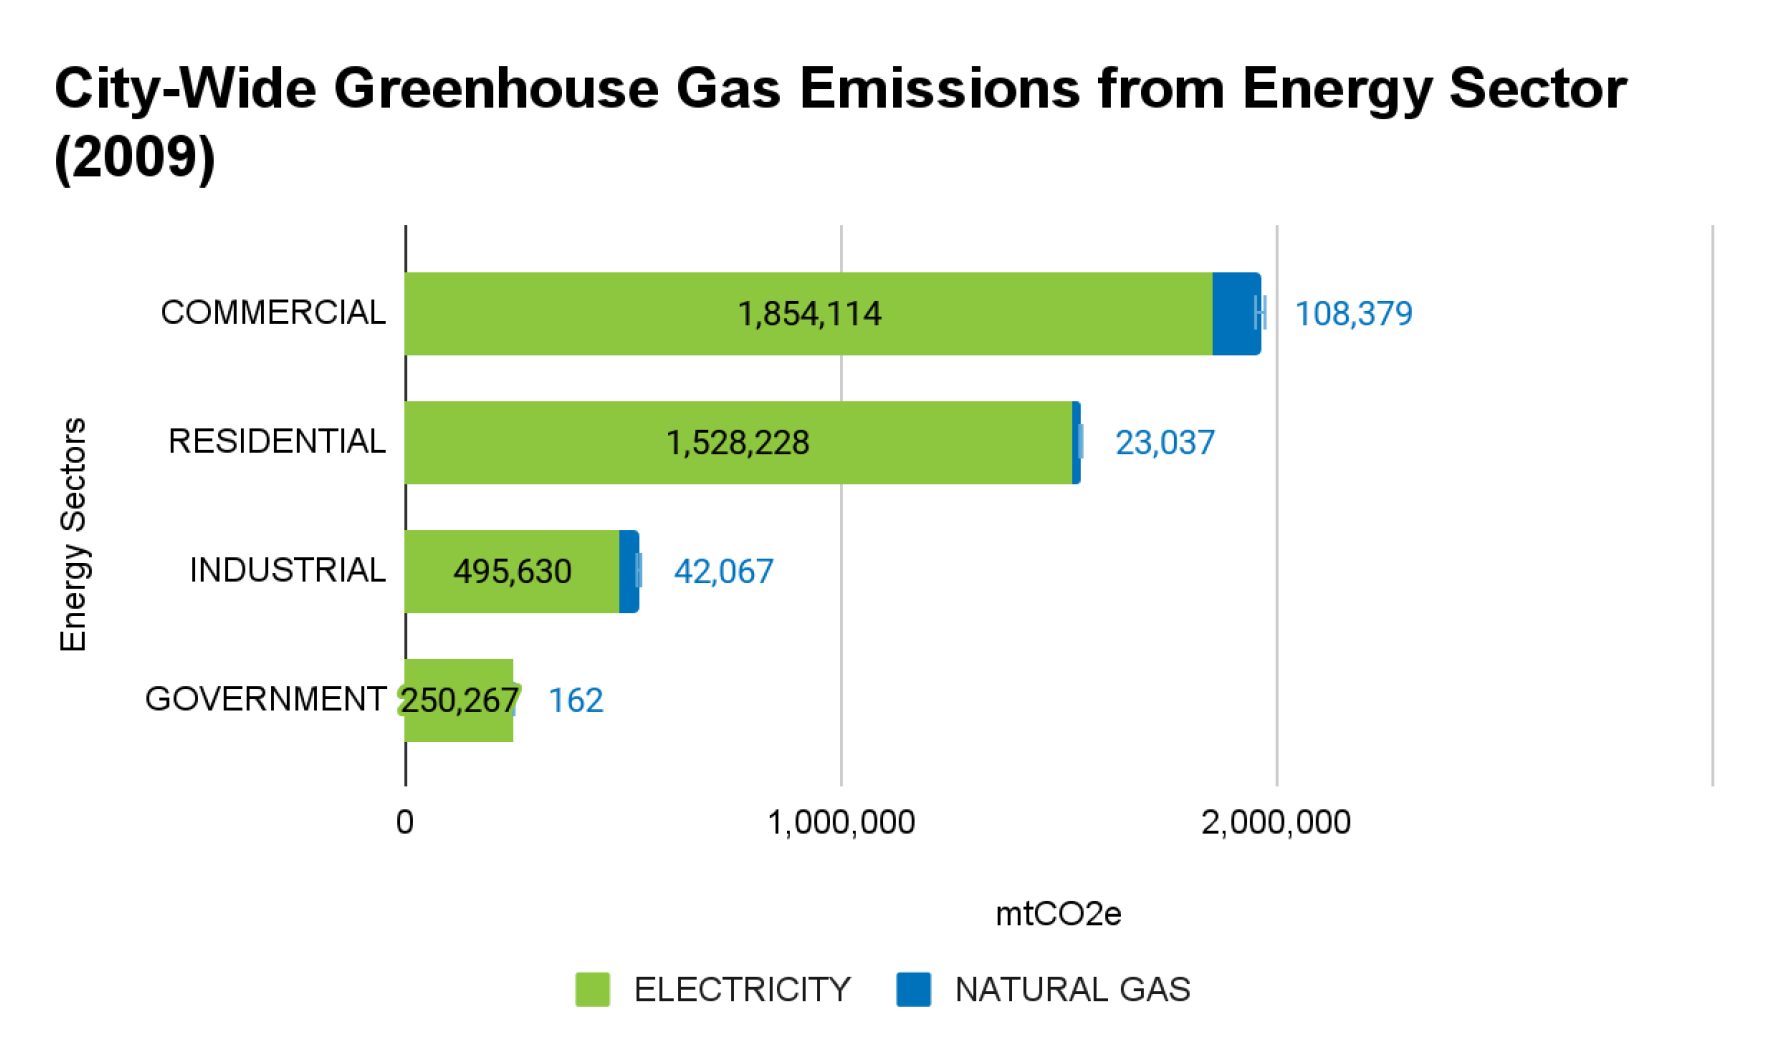
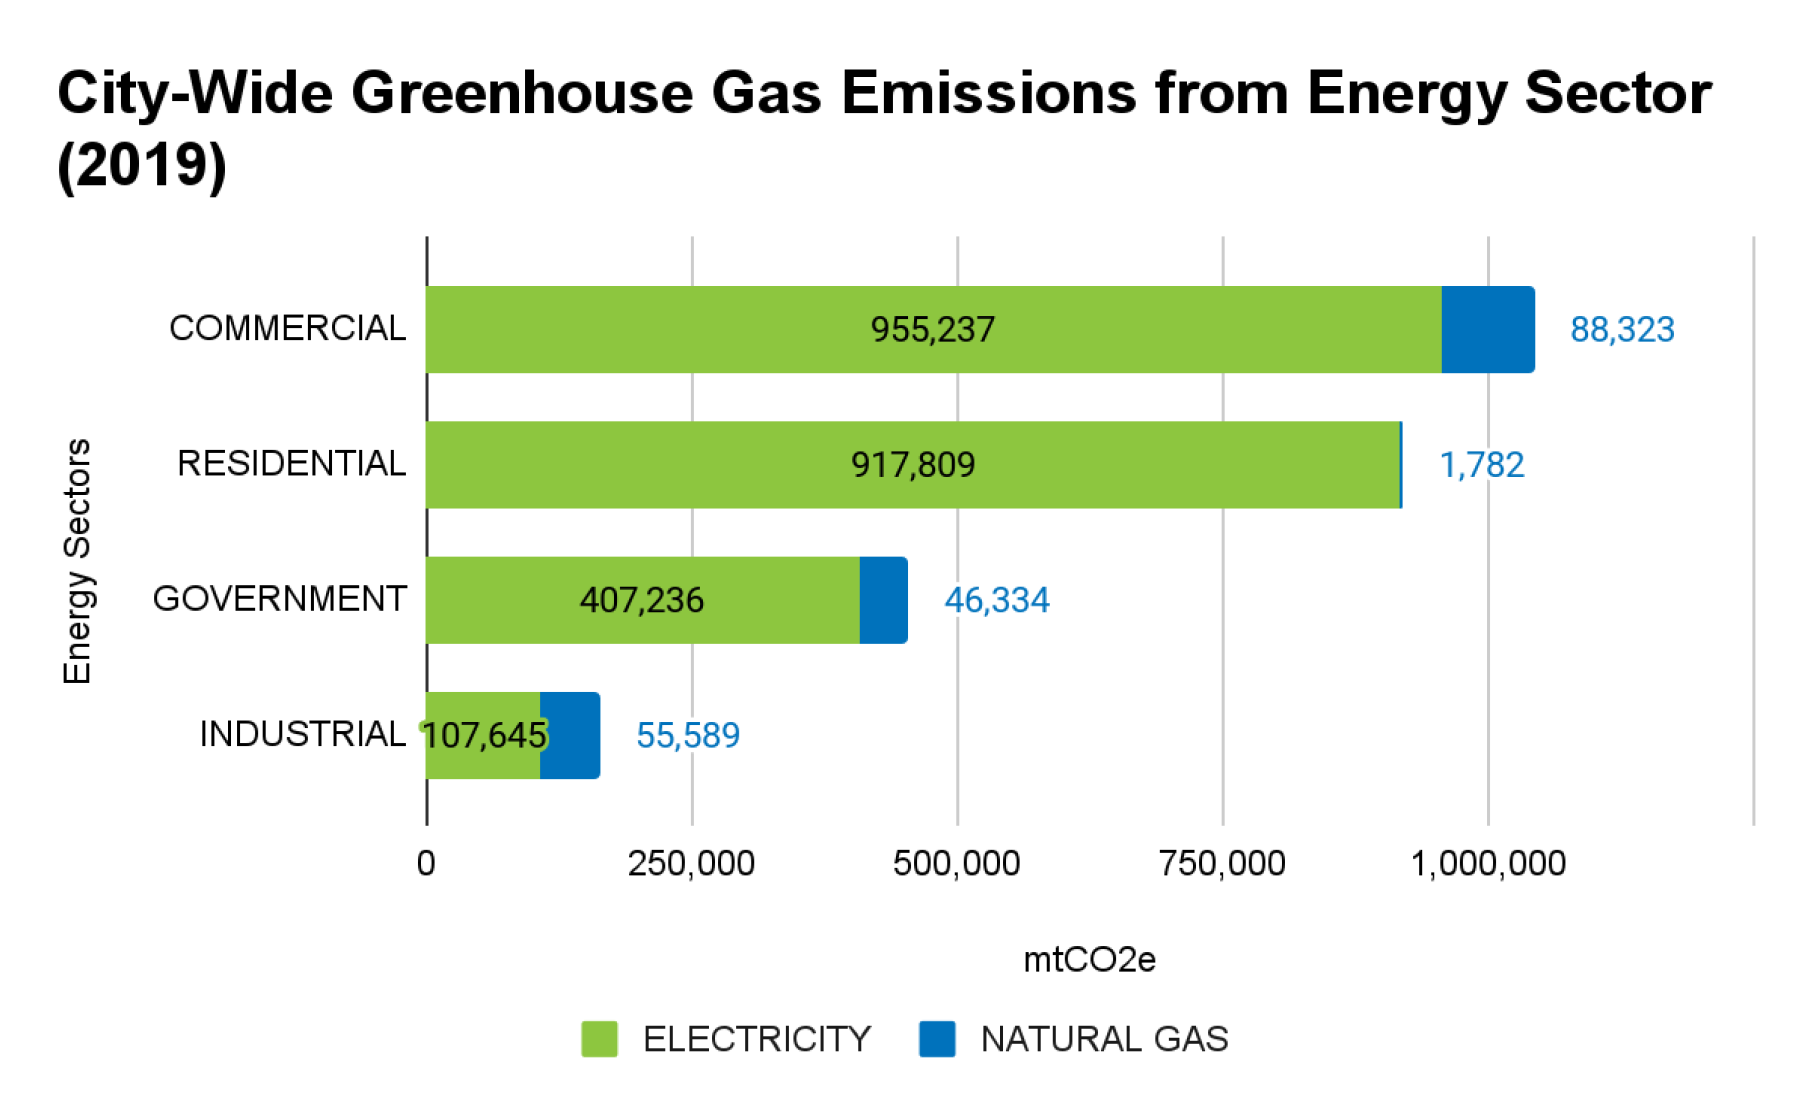
Figure 4-28. Greenhouse Gas Emissions from Energy Sectors by Energy Type (2009 and 2019) Note: The energy sector includes both electrical (in green) and natural gas (in blue) consumption.
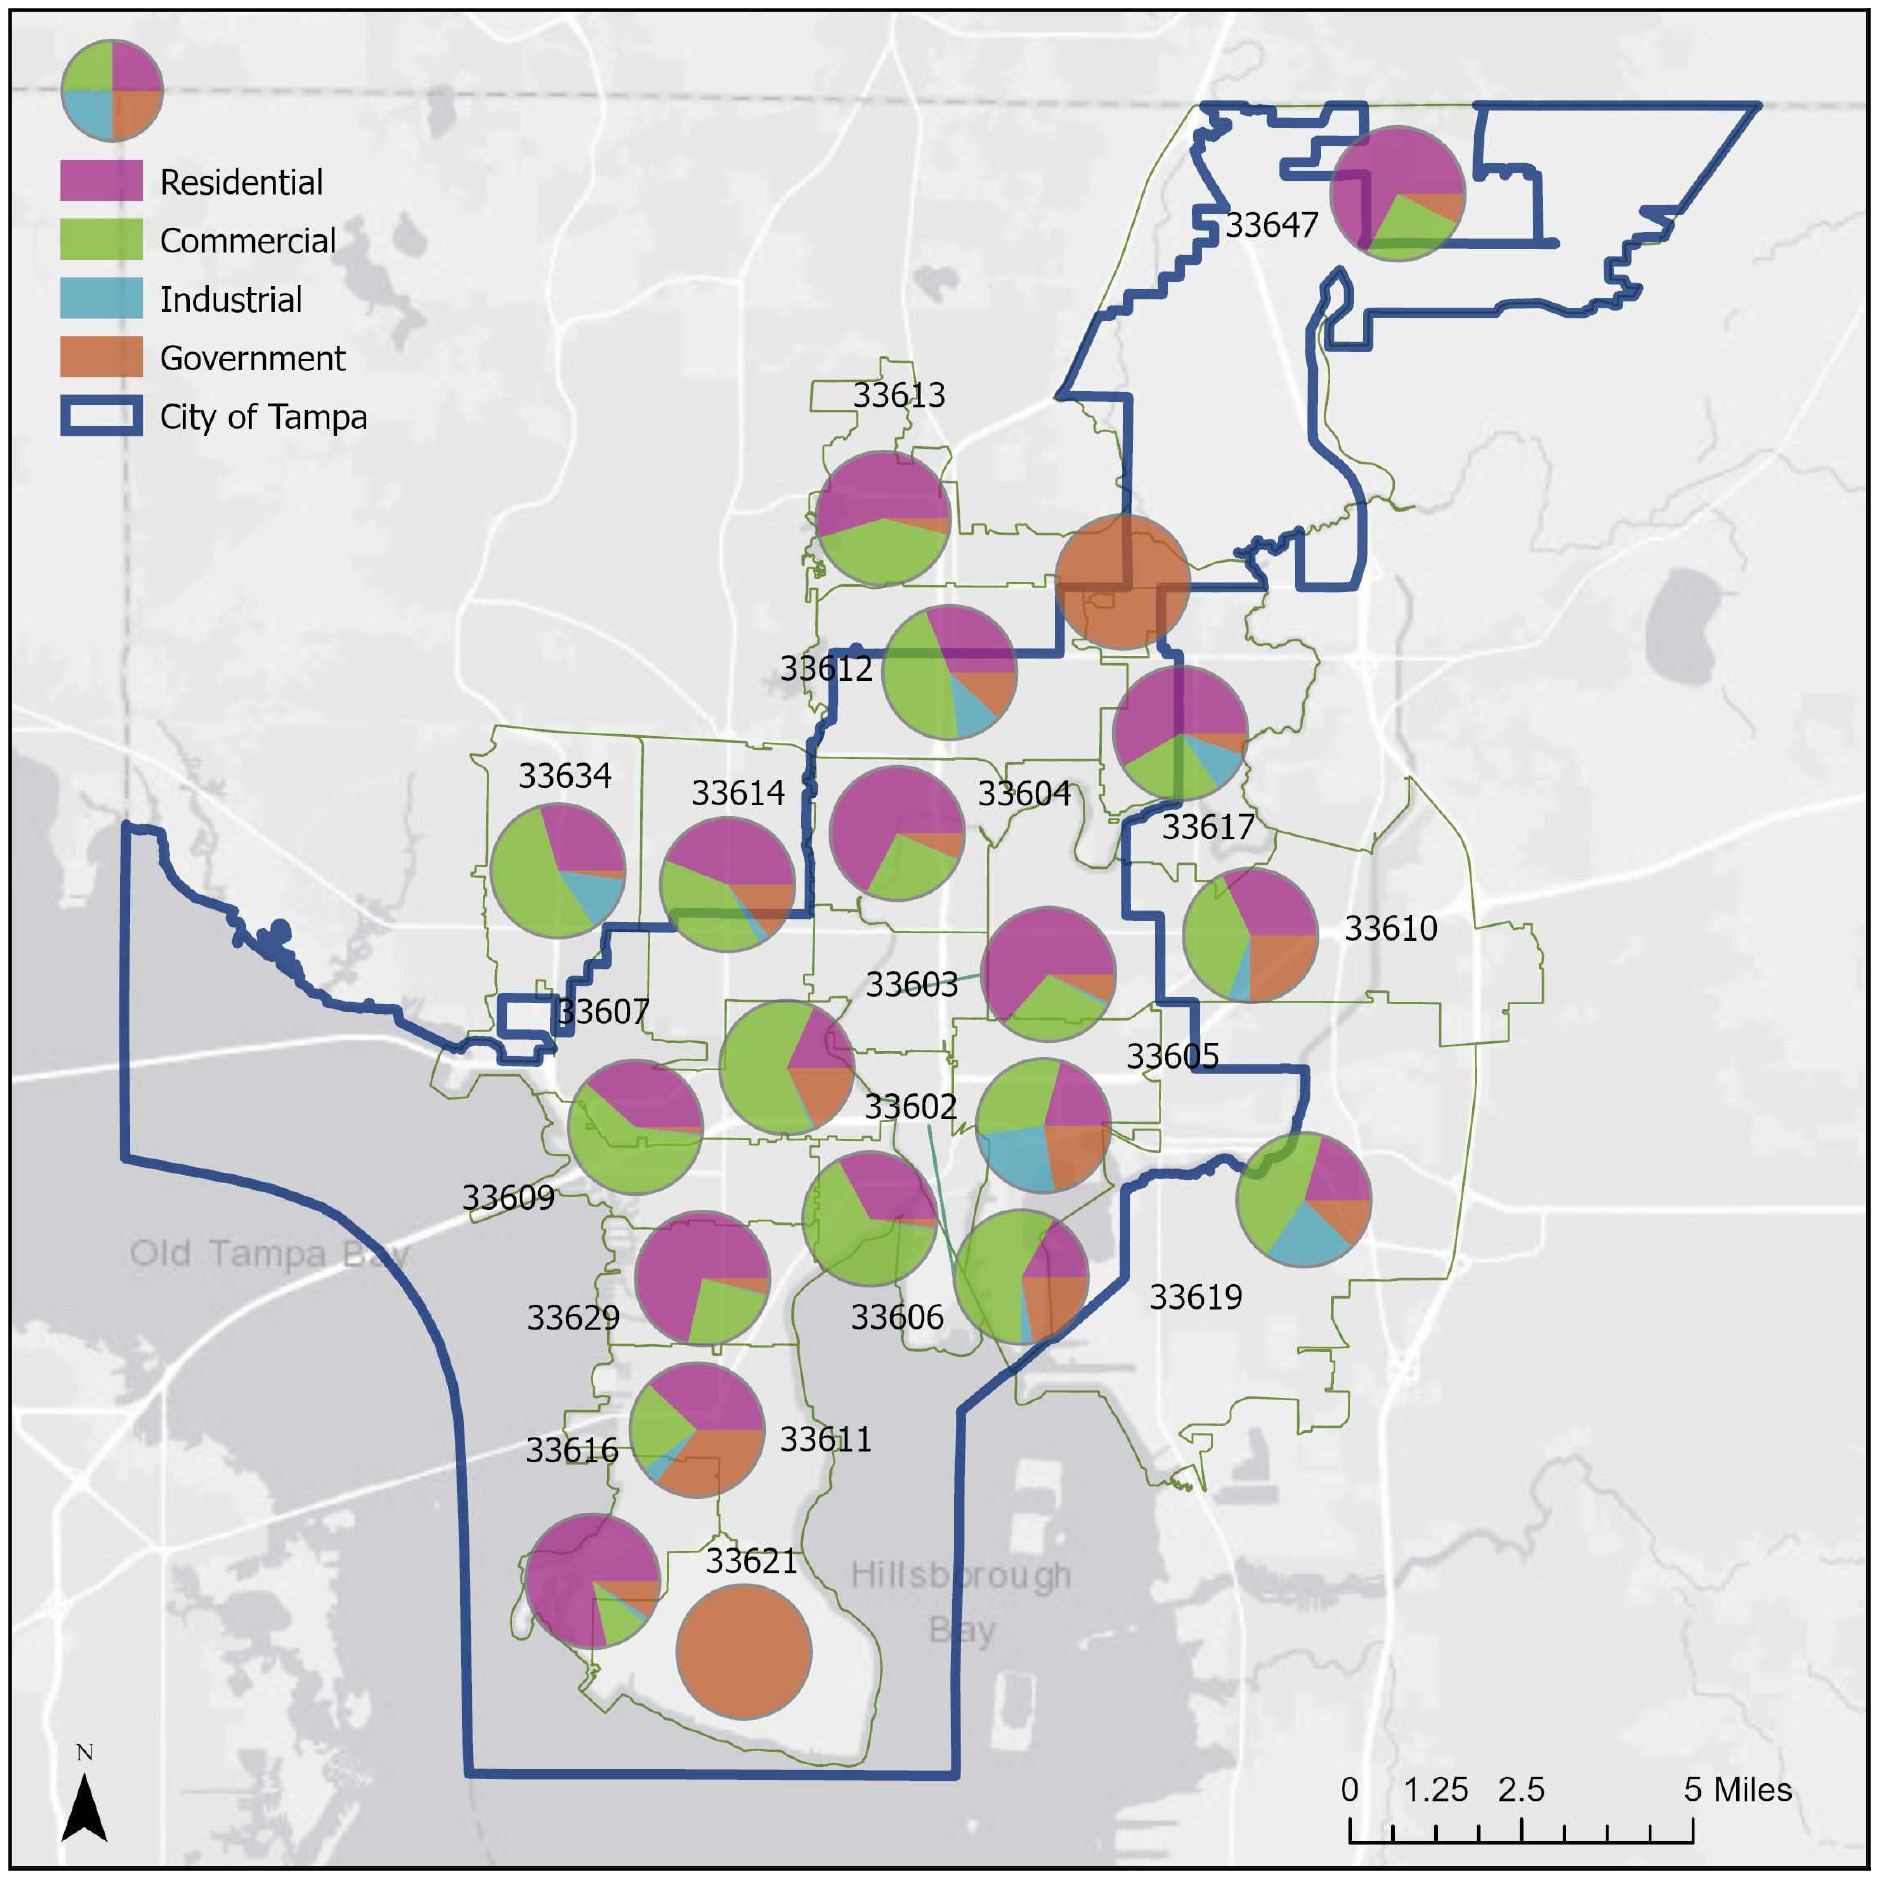
Note: Percent breakdowns based on total mtCO2e for electricity and natural gas combined.
4.3.1 City-Wide Commercial Energy Sector
Figure 4-30 shows the geospatial distribution of commercial electricity and natural gas consumption and Figure 4-31 breaks down commercial property by commercial use.
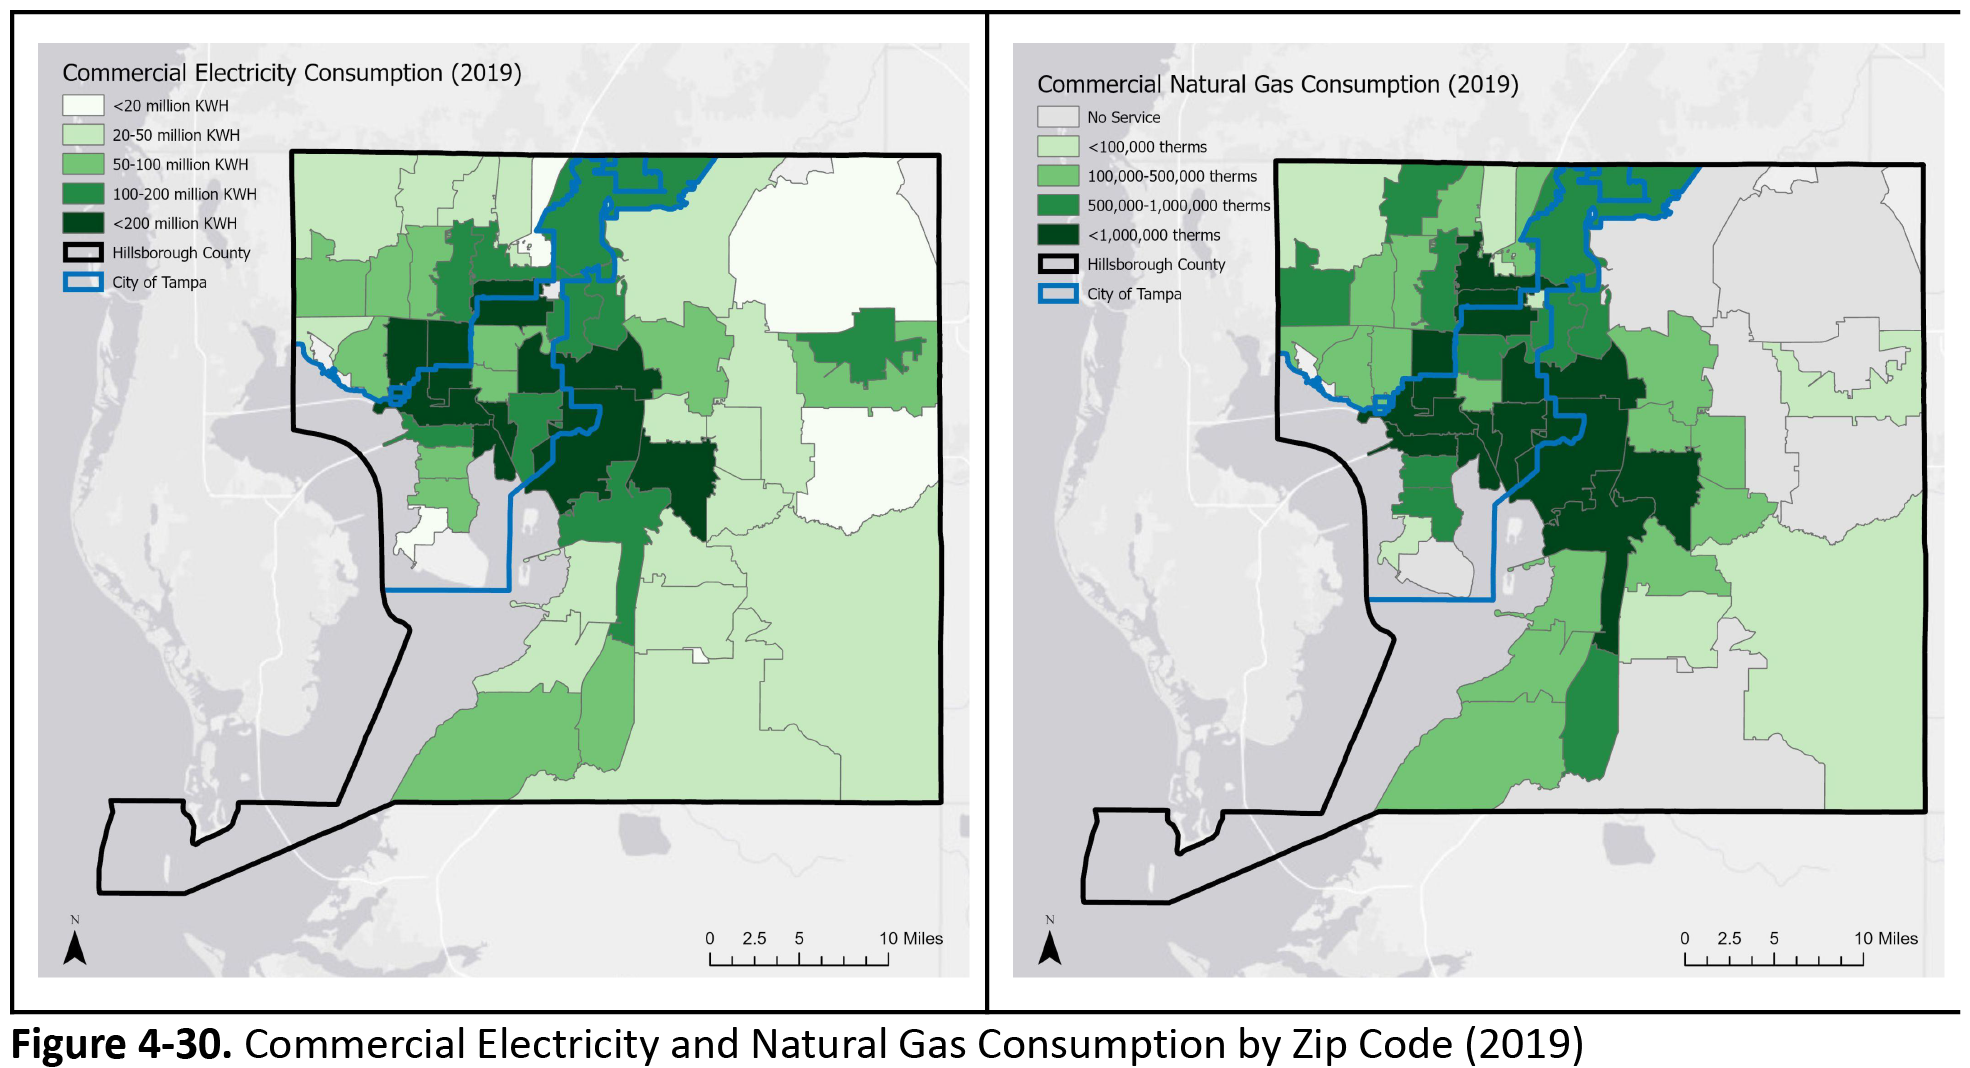
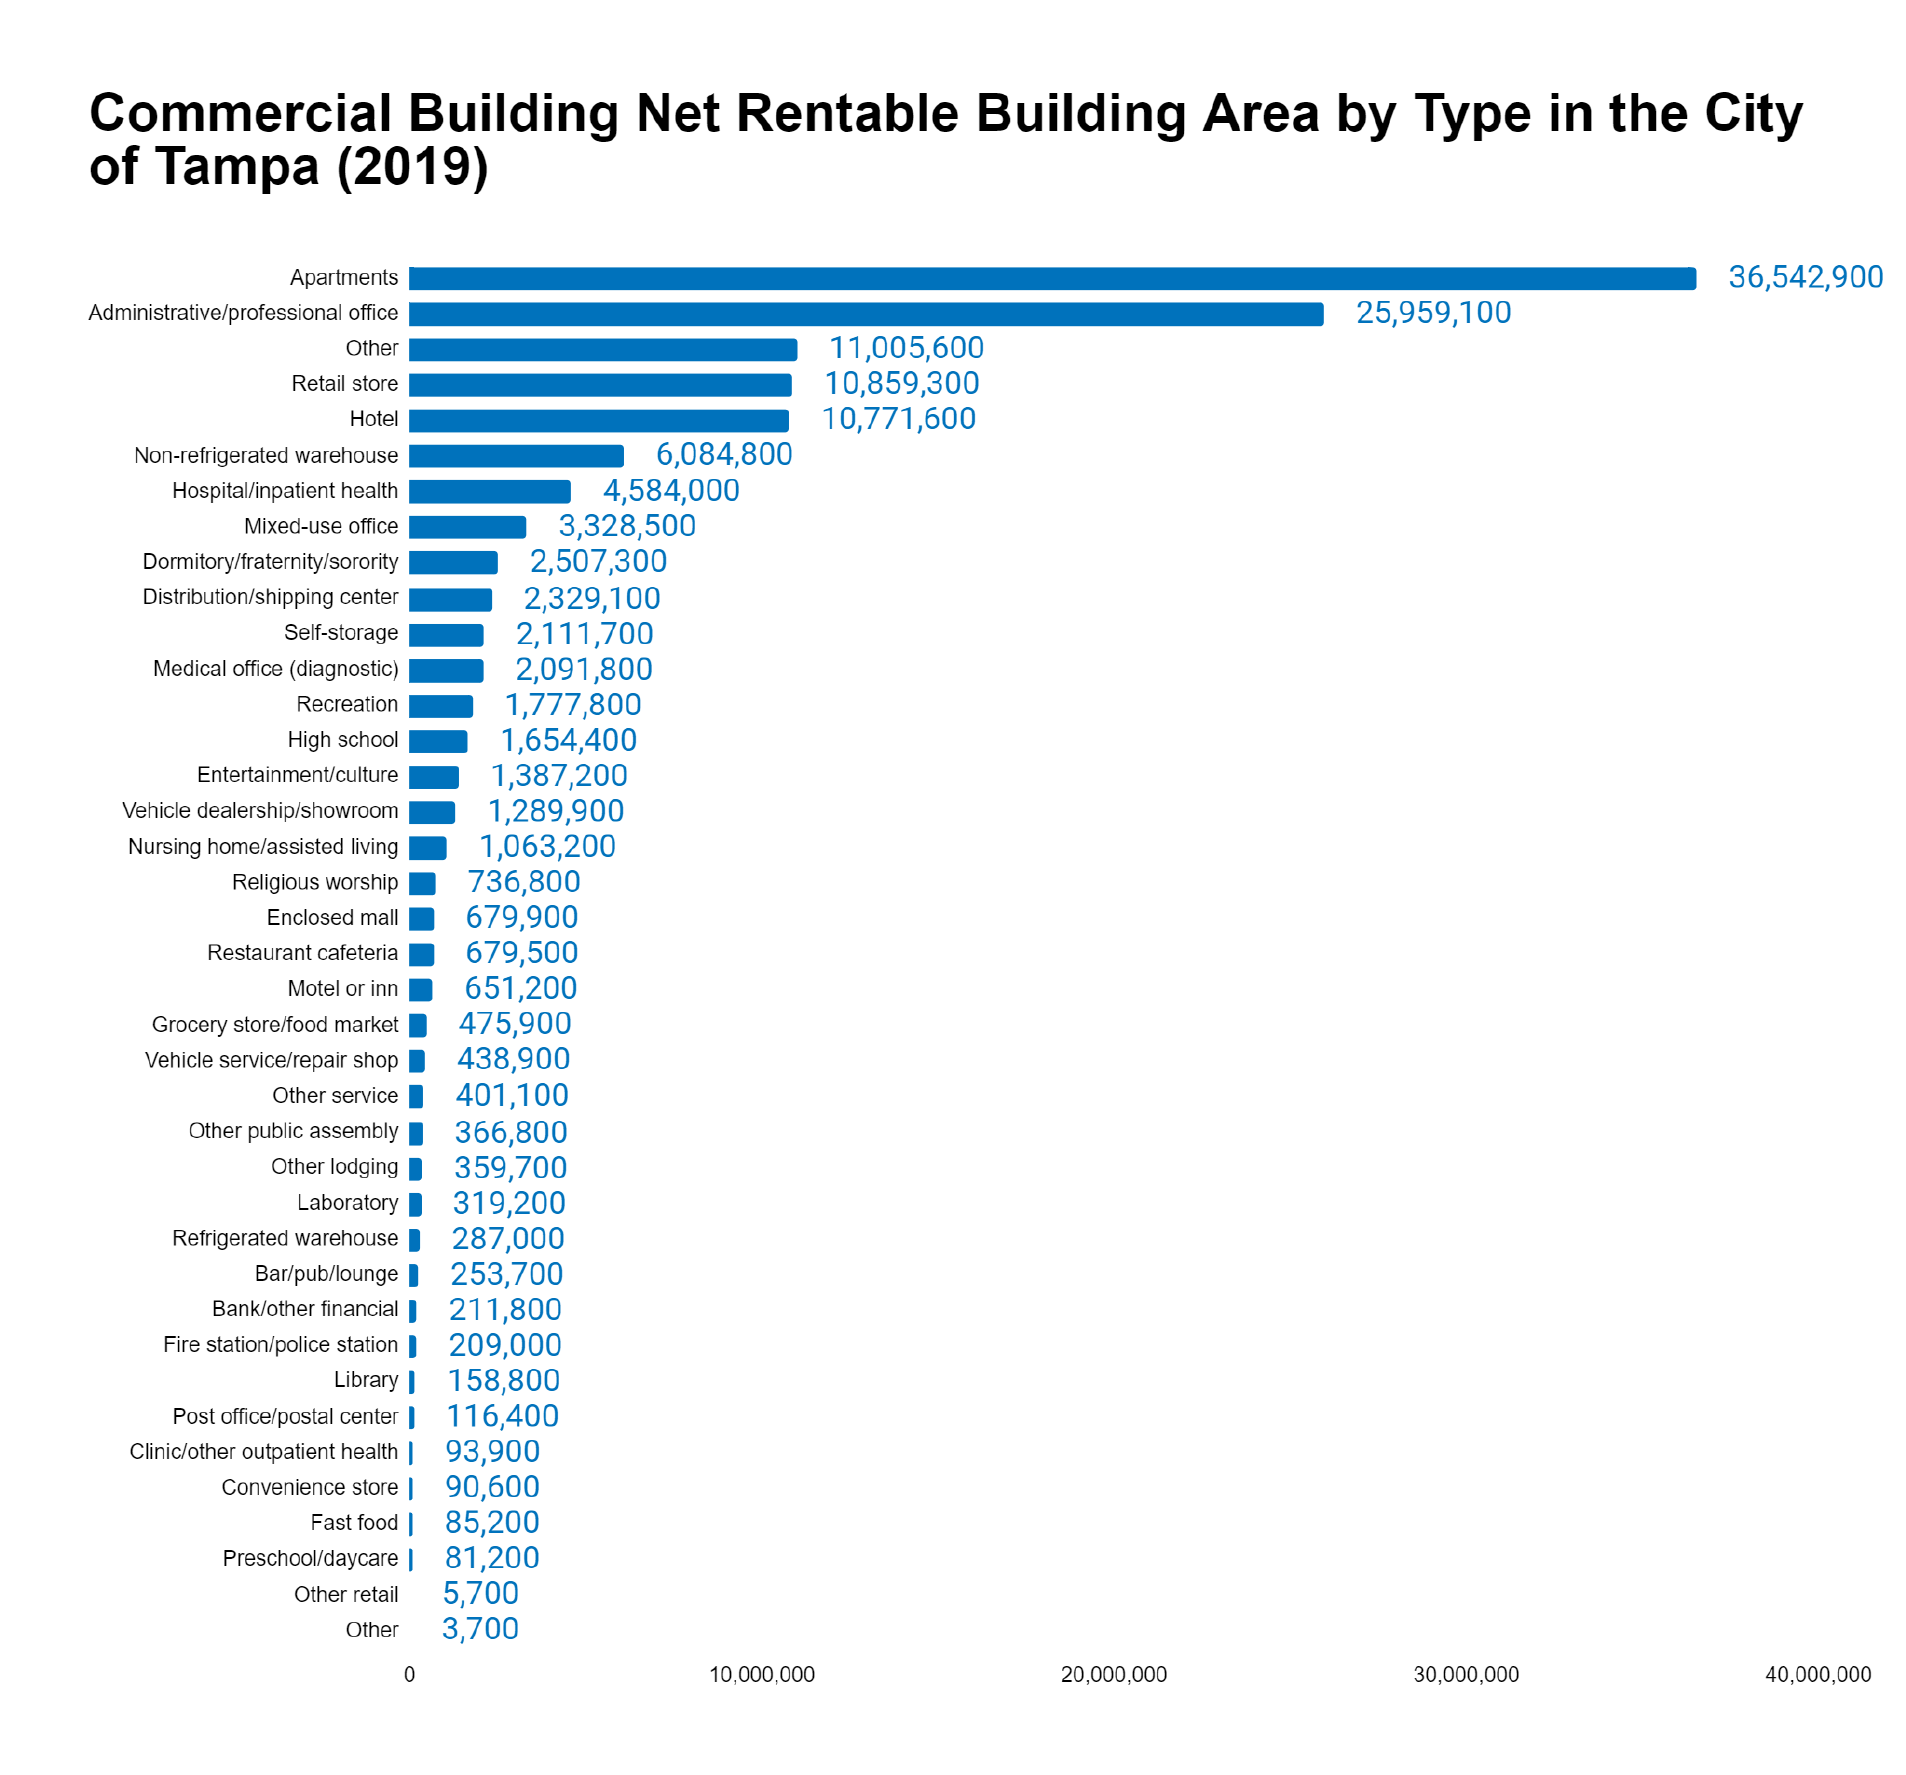
Data Source: Open Energy Data Initiative
(https://openei.org/doe-opendata/dataset/city-and-county-commercial-building-inventories/resource/811f977b-634b-4a1d-9a5b-48f5665e19b5)
4.3.2 City-Wide Residential Energy Sector
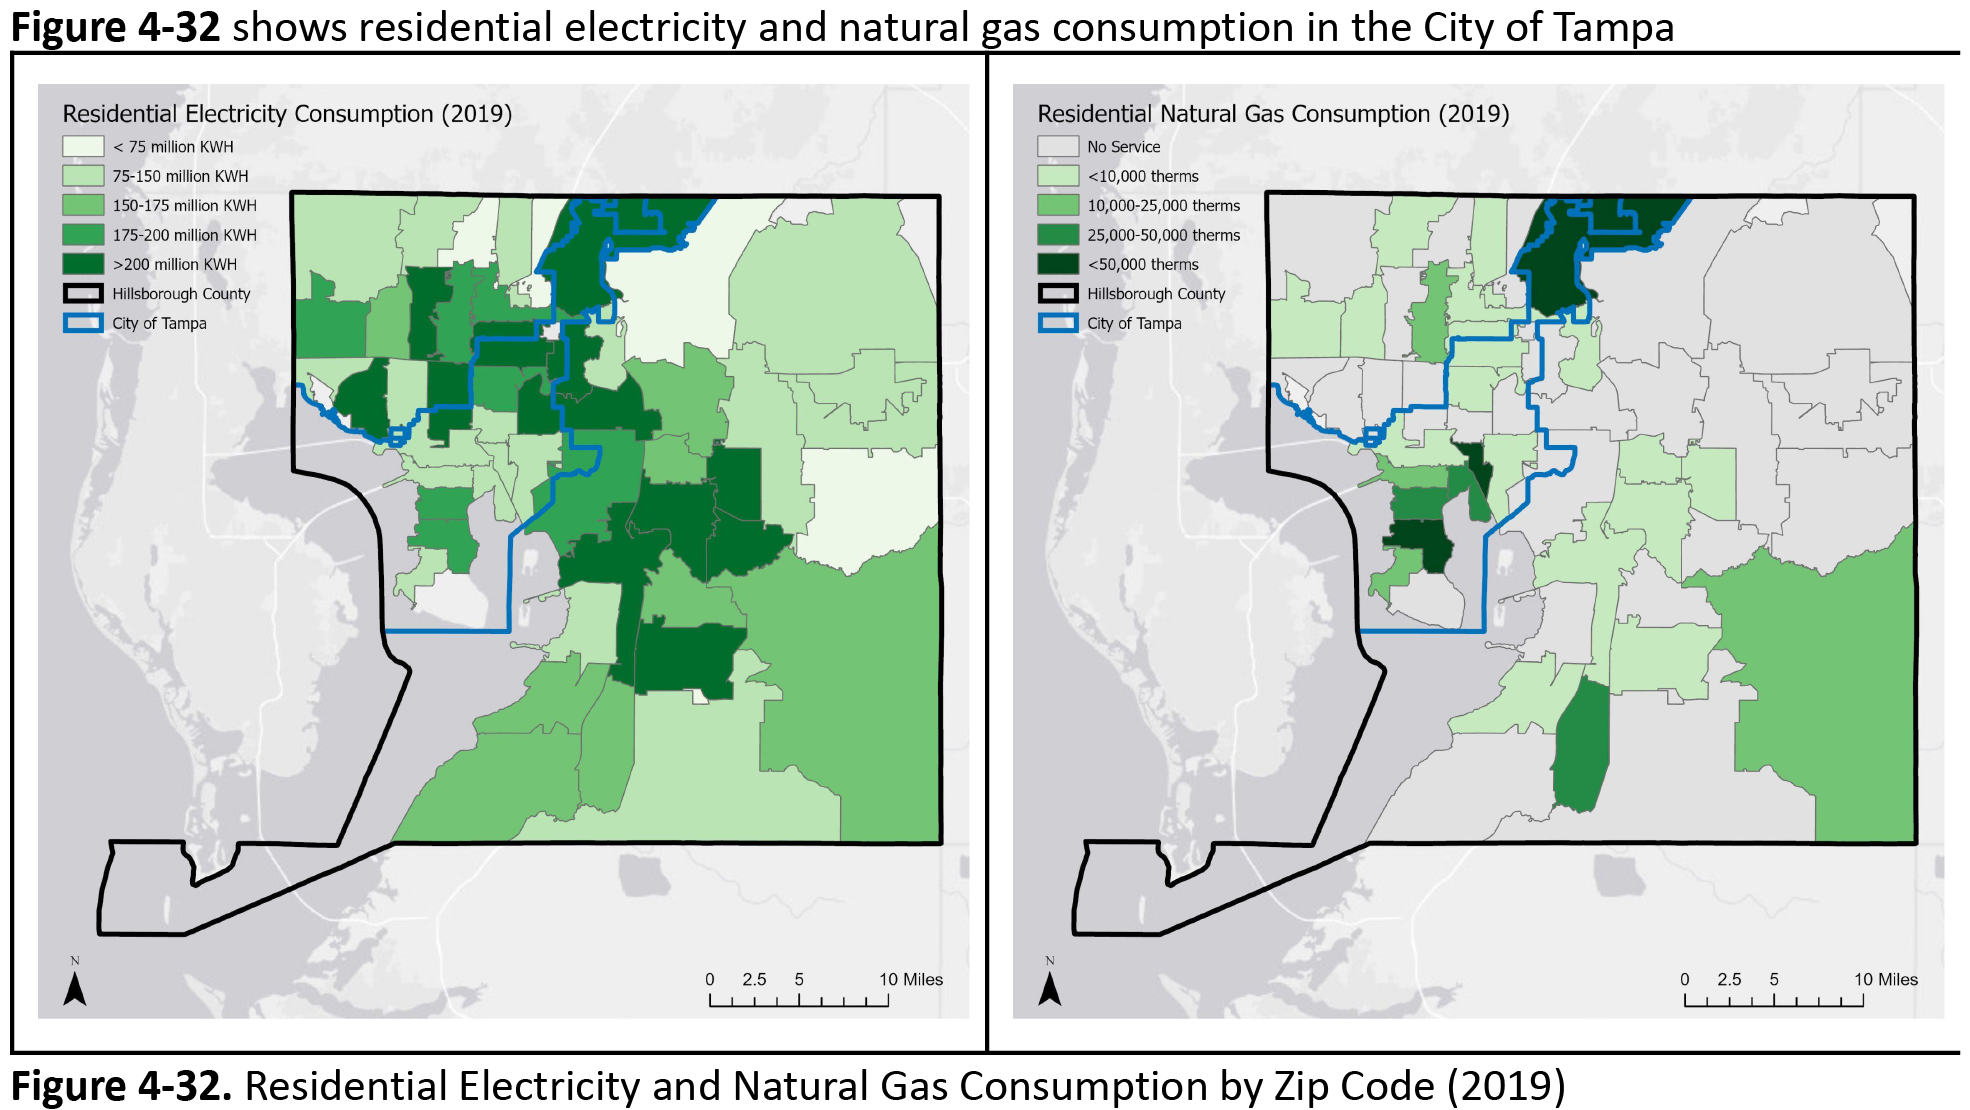
4.3.3 City-Wide Industrial Energy Sector
Figure 4-33 shows residential electricity and natural gas consumption in the City of Tampa.
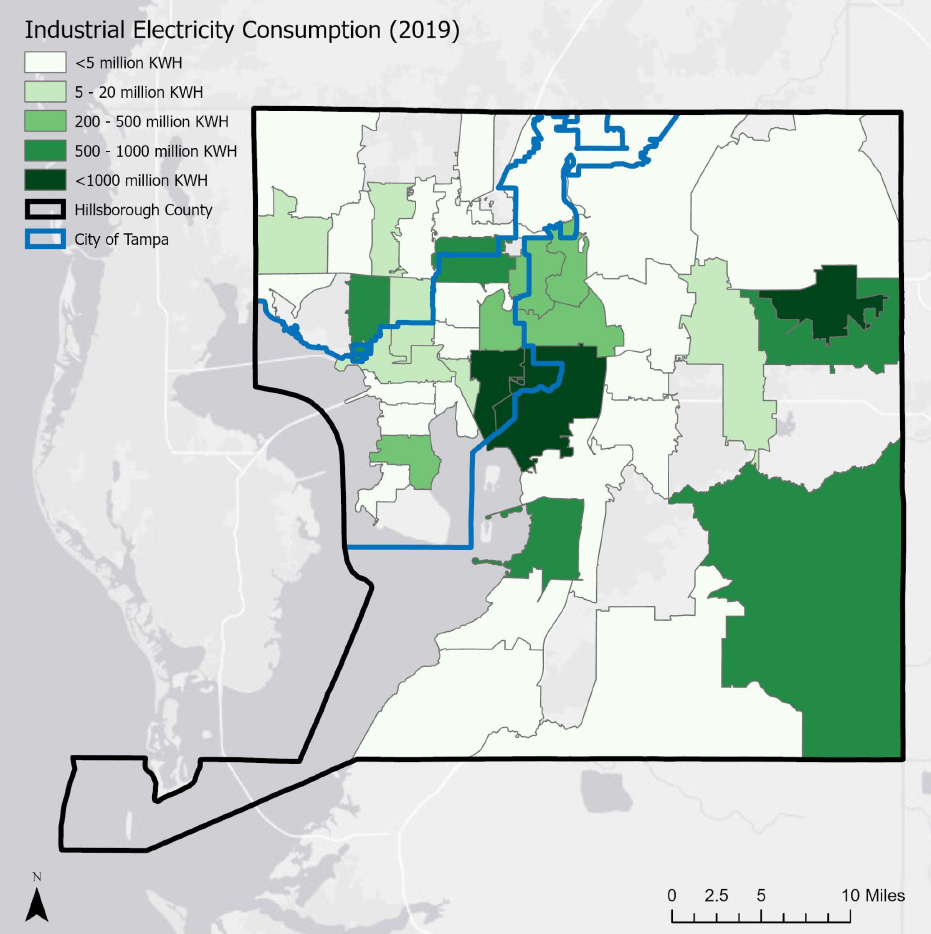
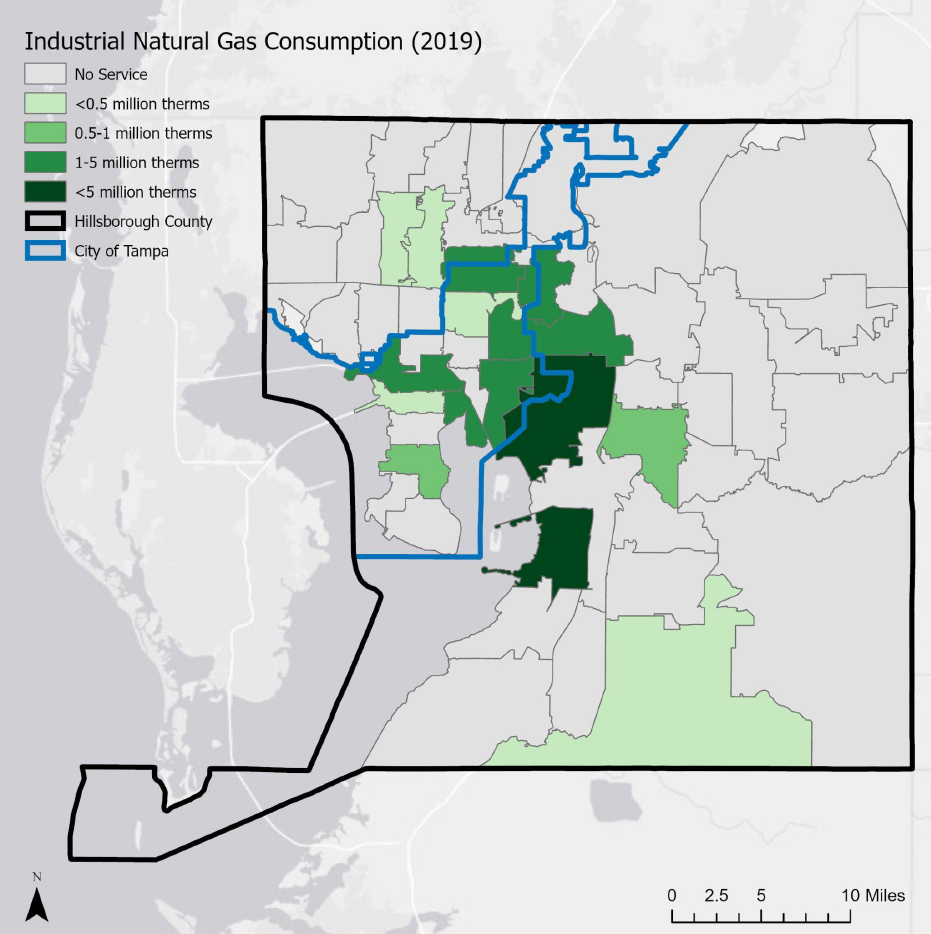
4.3.4 City-Wide Governmental Energy Sector
Figure 4.34 shows the government electricity and natural gas consumption in the City of Tampa.
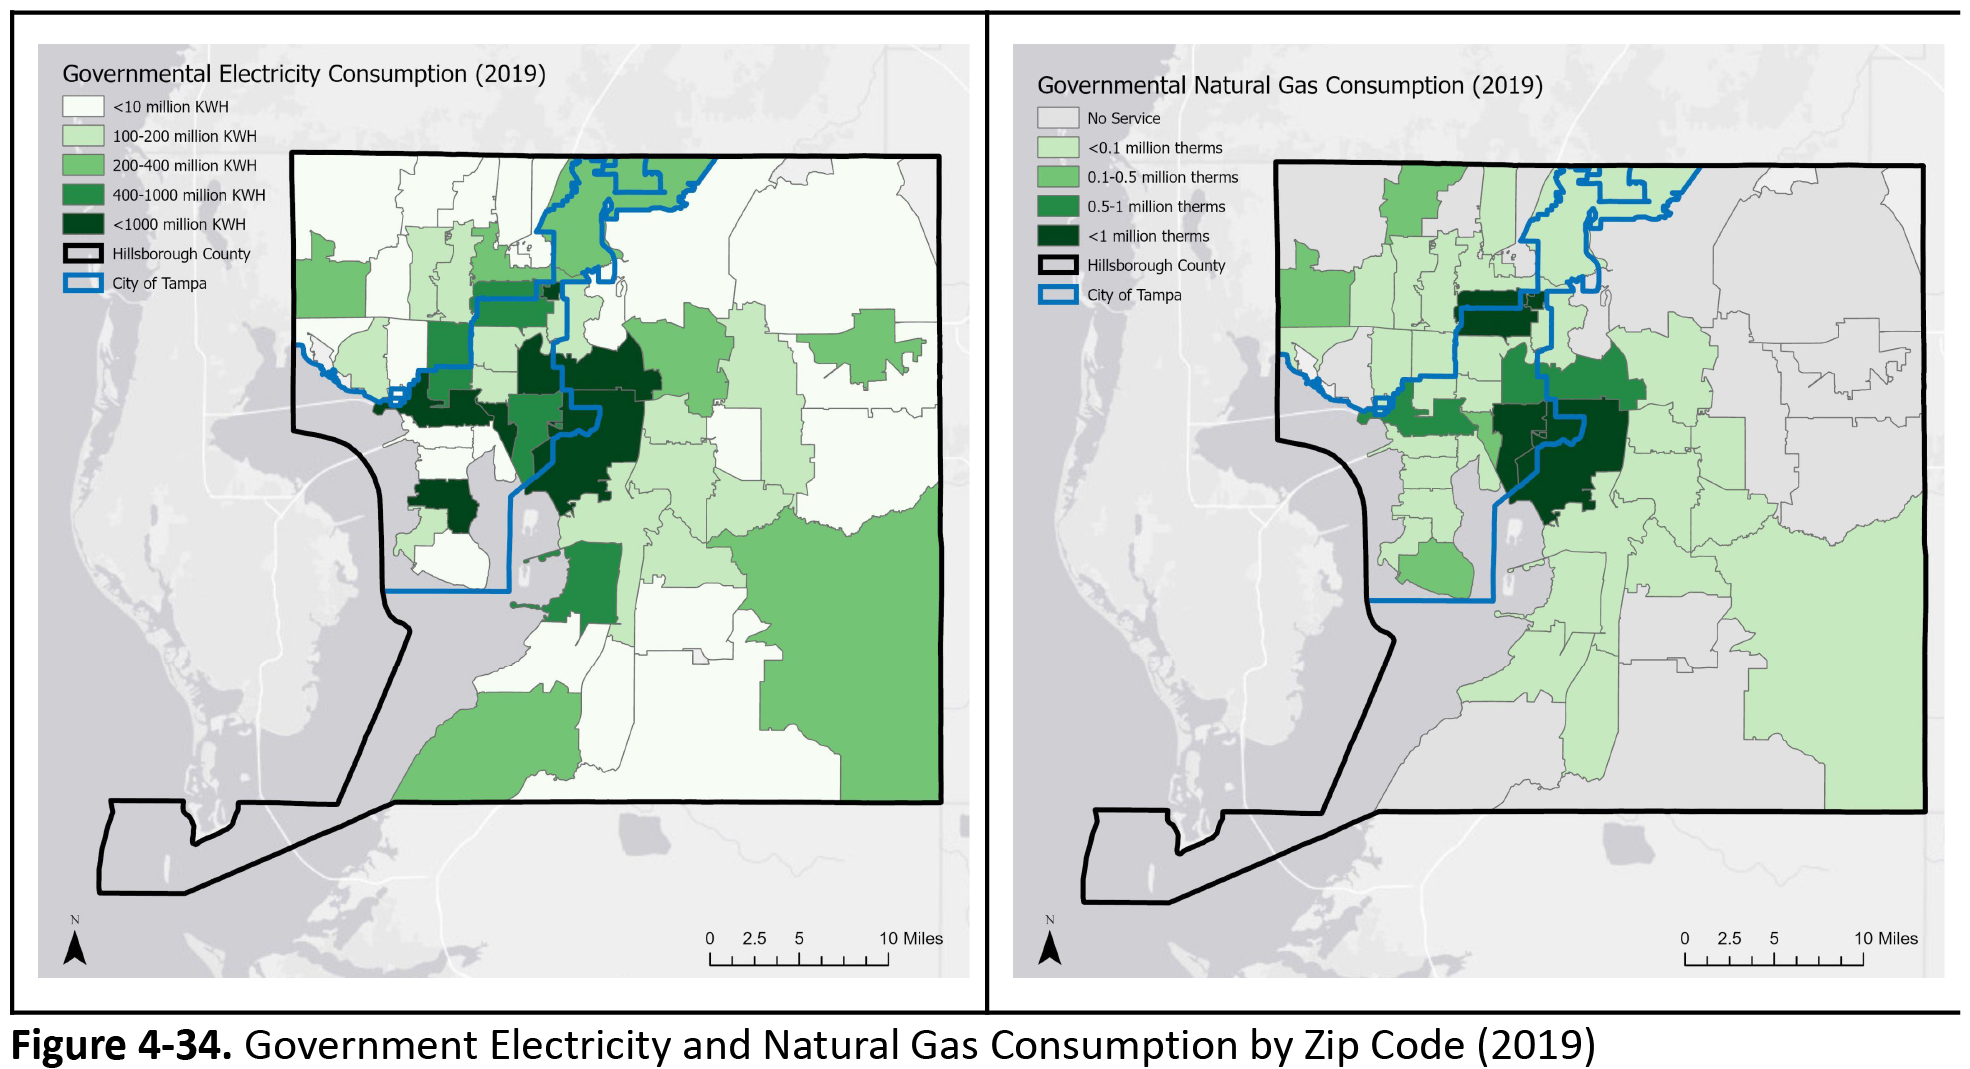
4.3.5 Key Findings: Energy Sector Analysis
The vast majority of energy provided to the City is from electricity. In 2009, emissions from electricity were much higher given the use of coal; however, coal is being replaced by natural gas and GHG emissions have reduced as a result. Energy consumption from the commercial sector represents the second largest source of GHG emissions (behind transportation) and represents 19 percent of total City-wide emissions. Commercial offices occupy the largest building areas in the City. Residential consumption is the third largest, by sector, with 17 percent of total GHG emissions in the City. Industrial and governmental energy are smaller in comparison (8 and 3 percent respectively).
5.0 CONCLUSIONS AND RECOMMENDATIONS
GHG emissions declined over the last decade, but the trend is not expected to continue. TECO is nearing completion with transitioning its fuel source from coal to natural gas and has expanded its Polk Power Station with lower-emission technology. Without another large-scale reduction that transitions away from natural gas towards renewable energy, net GHG emissions are forecasted to increase in line with a growing population. The electricity provider’s parent company, Emera, has announced that their portfolio would achieve net zero emissions by 2050. This along with community-wide improvements in efficiencies (i.e., energy efficient appliances and more fuel efficient cars) will also help to slow the growth in GHG emissions.
5.1 Opportunities
The largest opportunities to reduce GHG emissions in the City of Tampa exist in the largest GHG emission categories. In Government Operations, this category is Solid Waste. City-wide, transportation and energy categories are the largest contributors and outweigh overall emissions from solid waste. The largest opportunities for reductions are presented below.
5.1.1 Shift to Renewable Energy
From 2009 to 2019, City-Wide GHG emissions from energy (i.e., electricity and natural gas provided by TECO) shifted from 64 percent to 47 percent of total emissions. This reduction was traced to the energy provider transitioning from coal to natural gas and for expanding a power station with more efficient technologies. While coal is still in the region’s mix, a phase out of coal is planned by TECO and its parent company, Emera. Emera has committed to achieving net-zero carbon dioxide (CO2) emissions by 2050, which will result in reduced GHG emissions in all TECO’s service areas, represented by a declining business as usual (BAU) projection in Figure ES-5. This transition is being operationalized with the rapid expansion of solar arrays located in Hillsborough County and surrounding counties. The City of Tampa has additional opportunities to expand to renewable energy within its government operations by installing solar panels at its facilities and by advancing and supporting community solar projects.
5.1.2 Conservation and Improved Efficiencies
Transitioning from fossil fuels to renewable energy will result in lowered GHG emissions; however, time is needed to make the transition. Actions can be taken immediately to reduce GHG emissions by reducing consumption of transportation fuels, electricity, water, and material goods. Improving efficiencies also have the same effect of reducing GHG emissions. For example, installing energy-efficient appliances and lighting and thicker insulation will result in fewer GHG emissions for the same level of output. In the government sector, improving efficiencies in water treatment and distribution provide opportunities to reduce electricity consumption as well as save taxpayer dollars. Other measures such as retiming traffic signals to avoid idling of cars will result in lowered GHG emissions. Lastly, reducing waste and increasing recycling rates will result in fewer GHG emissions from combustion or landfilling of this waste and by avoiding trips to the landfill which also adds fuel consumption from trucking waste. It will take a combination of efforts to achieve GHG reduction goals set forth by the City.
5.1.3 Offset Emissions for Renewables and in the Urban Forest
Opportunities exist to offset emissions by protecting and enhancing natural and urban forests. Protecting forests allows for continued carbon storage in standing trees and continued annual carbon sequestration. The City of Tampa has had success expanding its urban forest through its tree planting program. There is potential to expand this program to sequester more carbon. Opportunities also exist by offsetting emissions through community solar and rooftop solar projects either on city property or through partnerships. As climate policies are advancing globally and nationally, there will be a demand for carbon offset projects and local governments have an opportunity to participate in the carbon market that provide triple bottom line successes, namely to reduce GHG emissions, save money, and spur the local economy.
5.1.4 Lead by Example Initiatives
The City of Tampa has shown leadership in sustainability efforts. There are more opportunities to “lead by example” through conservation and other sustainability efforts. The City also has an opportunity to provide education to its residents and City staff. Lastly, the City can drive policy actions through engagement with multi-governmental agencies to promote land use development and transportation patterns that address increasing consumption of energy.
5.2 Recommendations
This GHG Inventory used readily-available data and the best protocols available for each category. Some categories are based on high-level estimation methods (i.e., transportation) due to data gaps at the local level. A GHG inventory should continue to be improved and updated regularly. Data collection should be conducted annually with continued improvement to methodologies where available. Public reporting of emissions shows transparency and the City of Tampa is already participating in the Carbon Disclosure Project (CDP) and publicly reporting emissions. Furthermore, the City engages in the Global Covenant of Mayors for Climate and Energy. This inventory should be used to advance climate action planning that uses actual emissions to model GHG reduction potential of projects. Lastly, the key findings of the inventory should be clearly communicated to both internal and external stakeholders in order to increase the knowledge base and increase overall buy-in for implementing change. An interactive story map is one potential strategy for presenting easy-to-understand information to the public.
GHG emissions declined over the last decade, but the trend is not expected to continue. TECO is nearing completion with transitioning its fuel source from coal to natural gas. Without another large-scale reduction that transitions away from natural gas towards renewable energy, net GHG emissions are forecasted to increase with a growing population. The electricity provider’s parent company, Emera, has announced that their portfolio would achieve net zero emissions by 2050. This along with community-wide improvements in efficiencies (i.e., energy efficient appliances and more fuel efficient cars) will also help to slow the growth in GHG emissions.